Project Snapshot
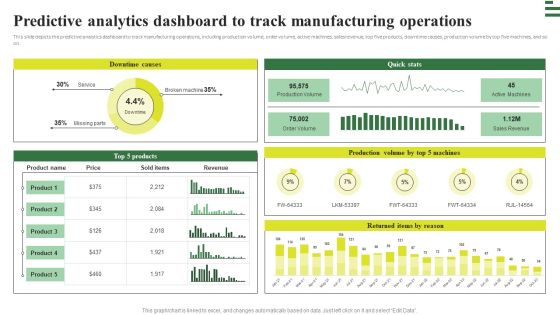
Transforming Manufacturing With Automation Predictive Analytics Dashboard To Track Diagrams PDF
This slide depicts the predictive analytics dashboard to track manufacturing operations, including production volume, order volume, active machines, sales revenue, top five products, downtime causes, production volume by top five machines, and so on. Get a simple yet stunning designed Transforming Manufacturing With Automation Predictive Analytics Dashboard To Track Diagrams PDF. It is the best one to establish the tone in your meetings. It is an excellent way to make your presentations highly effective. So, download this PPT today from Slidegeeks and see the positive impacts. Our easy to edit Transforming Manufacturing With Automation Predictive Analytics Dashboard To Track Diagrams PDF can be your go to option for all upcoming conferences and meetings. So, what are you waiting for Grab this template today.
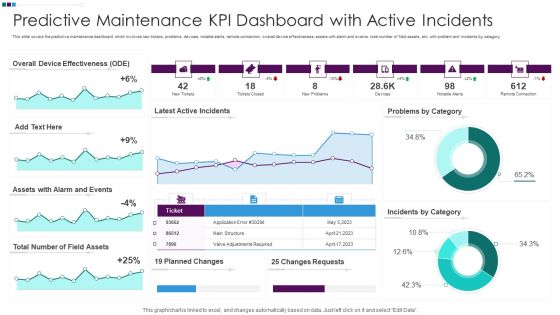
Predictive Maintenance KPI Dashboard With Active Incidents Ppt Slides Backgrounds PDF
This slide covers the predictive maintenance dashboard which involves new tickets, problems, devices, notable alerts, remote connection, overall device effectiveness, assets with alarm and events, total number of field assets, etc. with problem and incidents by category. Showcasing this set of slides titled Predictive Maintenance KPI Dashboard With Active Incidents Ppt Slides Backgrounds PDF. The topics addressed in these templates are Overall Device Effectiveness, Assets Alarm Events, Total Number Field. All the content presented in this PPT design is completely editable. Download it and make adjustments in color, background, font etc. as per your unique business setting.
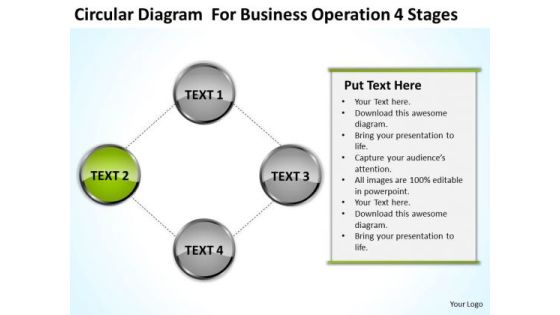
Diagram For Business Operation 4 Stages Ppt Plan PowerPoint Slides
We present our diagram for business operation 4 stages ppt plan PowerPoint Slides.Download and present our Arrows PowerPoint Templates because Our PowerPoint Templates and Slides have the Brilliant backdrops. Guaranteed to illuminate the minds of your audience. Present our Process and Flows PowerPoint Templates because Our PowerPoint Templates and Slides will effectively help you save your valuable time. They are readymade to fit into any presentation structure. Present our Business PowerPoint Templates because These PowerPoint Templates and Slides will give the updraft to your ideas. See them soar to great heights with ease. Download and present our Flow Charts PowerPoint Templates because our PowerPoint Templates and Slides are the string of your bow. Fire of your ideas and conquer the podium. Use our Shapes PowerPoint Templates because Our PowerPoint Templates and Slides are topically designed to provide an attractive backdrop to any subject.Use these PowerPoint slides for presentations relating to Diagram, business, decoration, form, components, step, layout, interface, plan, concept, vector, presentation, internet, circle, scheme, marketing, abstract, cycle, stage, circular, system, options, strategy, project, processes, term, solution, design, color, set, organization, infographic, four, art, connected, career, part, structure, arrows, communication. The prominent colors used in the PowerPoint template are Green, Gray, Black.

Key Features Of Predictive Data Analytics Software Business Analysis Modification Toolkit Graphics PDF
This slide represents the characteristics of predictive data analytics software. It includes features like predictive modeling, predictive scoring and data mining functions that help companies to get better insights.Presenting Key Features Of Predictive Data Analytics Software Business Analysis Modification Toolkit Graphics PDF to provide visual cues and insights. Share and navigate important information on five stages that need your due attention. This template can be used to pitch topics like Automate Analytics, Predictive Modeling, Automatic Preparation. In addtion, this PPT design contains high resolution images, graphics, etc, that are easily editable and available for immediate download.
Financial Calculations Sumbols And Signs Vector Ilustration Ppt PowerPoint Presentation File Inspiration PDF
Presenting this set of slides with name financial calculations sumbols and signs vector ilustration ppt powerpoint presentation file inspiration pdf. This is a three stage process. The stages in this process are financial calculations sumbols and signs vector ilustration. This is a completely editable PowerPoint presentation and is available for immediate download. Download now and impress your audience.
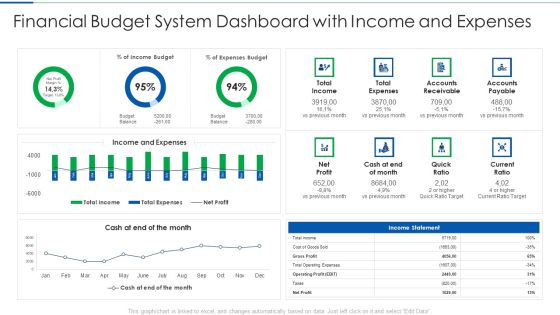
Financial Budget System Dashboard With Income And Expenses Themes PDF
Deliver an awe inspiring pitch with this creative financial budget system dashboard with income and expenses themes pdf bundle. Topics like financial budget system dashboard with income and expenses can be discussed with this completely editable template. It is available for immediate download depending on the needs and requirements of the user.

Dashboard For Technological Smart Homes Security System Management Designs PDF
This side showcase the dashboard of security system management for tracking and forecasting matrices for better functioning of devices. It include the statistic data such as temperature, power consumed, devices working, and list of devices connected. Showcasing this set of slides titled Dashboard For Technological Smart Homes Security System Management Designs PDF. The topics addressed in these templates are Smart Light, Smart Heating, Smart Cooling. All the content presented in this PPT design is completely editable. Download it and make adjustments in color, background, font etc. as per your unique business setting.

Transformation Toolkit Competitive Intelligence Information Analysis Key Features Of Predictive Data Analytics Software Elements PDF
This slide represents the characteristics of predictive data analytics software. It includes features like predictive modeling, predictive scoring and data mining functions that help companies to get better insights. This Transformation Toolkit Competitive Intelligence Information Analysis Key Features Of Predictive Data Analytics Software Elements PDF is perfect for any presentation, be it in front of clients or colleagues. It is a versatile and stylish solution for organizing your meetings. The Transformation Toolkit Competitive Intelligence Information Analysis Key Features Of Predictive Data Analytics Software Elements PDF features a modern design for your presentation meetings. The adjustable and customizable slides provide unlimited possibilities for acing up your presentation. Slidegeeks has done all the homework before launching the product for you. So, do not wait, grab the presentation templates today.

Promotional Budget Plan Analysis Dashboard For Startups Template PDF
This slide provides a dashboard for analysis of marketing budget plan that can be used by managers to optimize their advertisement strategies. It displays the comparison of total marketing budget of different companies, ROI, marketing campaign analysis and program budgets. Showcasing this set of slides titled Promotional Budget Plan Analysis Dashboard For Startups Template PDF. The topics addressed in these templates are Marketing Budget, Marketing Campaign, Competitive Analysis. All the content presented in this PPT design is completely editable. Download it and make adjustments in color, background, font etc. as per your unique business setting.

Budget Vs Actual Dashboard For Finance Department Brochure PDF
The slide illustrates the dashboard showing the income and expenses incurred by the finance department. The purpose of this slide is compare the budgeted figures with the actual cost, enabling effective analysis of financial activities. It include income budget, expense budget, and difference. Showcasing this set of slides titled Budget Vs Actual Dashboard For Finance Department Brochure PDF. The topics addressed in these templates are Income, Expenses, Expense Budget. All the content presented in this PPT design is completely editable. Download it and make adjustments in color, background, font etc. as per your unique business setting.
Employee Training Status KPI Dashboard With Budget Summary PDF
This slide consists of a dashboard to track employee annual training status in order to update the plan for next year. It includes elements such as training number, total hours, budget, trainee numbers, training types, etc. Pitch your topic with ease and precision using this Employee Training Status KPI Dashboard With Budget Summary PDF. This layout presents information on Employee Training Status, KPI Dashboard With Budget. It is also available for immediate download and adjustment. So, changes can be made in the color, design, graphics or any other component to create a unique layout.
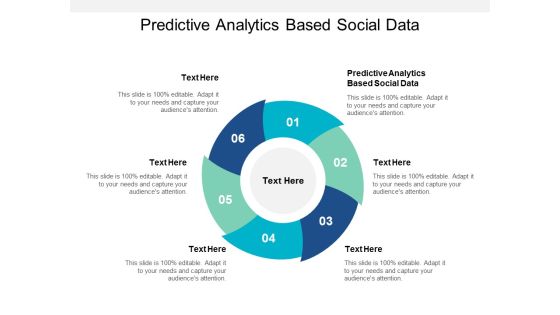
Predictive Analytics Based Social Data Ppt PowerPoint Presentation Good Cpb
Presenting this set of slides with name predictive analytics based social data ppt powerpoint presentation good cpb. This is an editable Powerpoint six stages graphic that deals with topics like predictive analytics based social data to help convey your message better graphically. This product is a premium product available for immediate download and is 100 percent editable in Powerpoint. Download this now and use it in your presentations to impress your audience.

Data Analytics Predictive Modelling Ppt PowerPoint Presentation Professional Slides Cpb
Presenting this set of slides with name data analytics predictive modelling ppt powerpoint presentation professional slides cpb. This is an editable Powerpoint four stages graphic that deals with topics like data analytics predictive modelling to help convey your message better graphically. This product is a premium product available for immediate download and is 100 percent editable in Powerpoint. Download this now and use it in your presentations to impress your audience.
Predictive Analytics Big Data Ppt PowerPoint Presentation Outline Deck Cpb
Presenting this set of slides with name predictive analytics big data ppt powerpoint presentation outline deck cpb. This is an editable Powerpoint four stages graphic that deals with topics like predictive analytics big data to help convey your message better graphically. This product is a premium product available for immediate download and is 100 percent editable in Powerpoint. Download this now and use it in your presentations to impress your audience.

Data Predictive Analytics Ppt PowerPoint Presentation Icon Introduction Cpb Pdf
Presenting this set of slides with name data predictive analytics ppt powerpoint presentation icon introduction cpb pdf. This is an editable Powerpoint five stages graphic that deals with topics like data predictive analytics to help convey your message better graphically. This product is a premium product available for immediate download and is 100 percent editable in Powerpoint. Download this now and use it in your presentations to impress your audience.

Brand Awareness Measuring Kpi Dashboard Brand Value Estimation Guide Formats PDF
Following slide illustrates KPI dashboard that can be used to track the awareness level of a specific brand. KPIs covered in the slide are traffic, attention, authority, inbound channel performance etc.There are so many reasons you need a Brand Awareness Measuring Kpi Dashboard Brand Value Estimation Guide Formats PDF. The first reason is you can not spend time making everything from scratch, Thus, Slidegeeks has made presentation templates for you too. You can easily download these templates from our website easily.

Sample Business Asset Valuation Dashboard Guide To Asset Cost Estimation Professional PDF
Following slide displays KPI dashboard for business asset valuation. KPIs covered are number of assets across production line, expected development cost and productivity index.Are you in need of a template that can accommodate all of your creative concepts This one is crafted professionally and can be altered to fit any style. Use it with Google Slides or PowerPoint. Include striking photographs, symbols, depictions, and other visuals. Fill, move around, or remove text boxes as desired. Test out color palettes and font mixtures. Edit and save your work, or work with colleagues. Download Sample Business Asset Valuation Dashboard Guide To Asset Cost Estimation Professional PDF and observe how to make your presentation outstanding. Give an impeccable presentation to your group and make your presentation unforgettable.
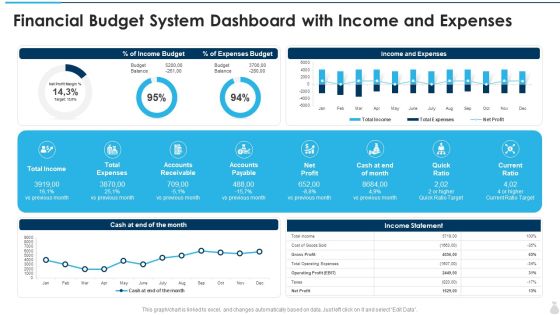
Financial Budget System Dashboard With Income And Expenses Formats PDF
Deliver an awe inspiring pitch with this creative financial budget system dashboard with income and expenses formats pdf bundle. Topics like expenses budget, income budget, expenses can be discussed with this completely editable template. It is available for immediate download depending on the needs and requirements of the user.
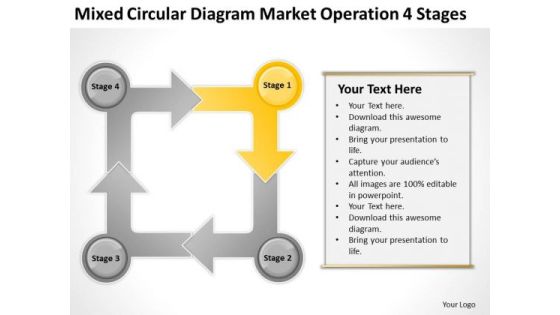
Mixed Circular Diagram Market Operation 4 Stages Making Business Plan PowerPoint Templates
We present our mixed circular diagram market operation 4 stages making business plan PowerPoint templates.Download and present our Process and Flows PowerPoint Templates because You can Connect the dots. Fan expectations as the whole picture emerges. Present our Flow Charts PowerPoint Templates because You can Create a matrix with our PowerPoint Templates and Slides. Feel the strength of your ideas click into place. Download our Arrows PowerPoint Templates because You are an avid believer in ethical practices. Highlight the benefits that accrue with our PowerPoint Templates and Slides. Download our Business PowerPoint Templates because Timeline crunches are a fact of life. Meet all deadlines using our PowerPoint Templates and Slides. Download our Marketing PowerPoint Templates because You aspire to touch the sky with glory. Let our PowerPoint Templates and Slides provide the fuel for your ascent.Use these PowerPoint slides for presentations relating to Business, diagram, decoration, segment, slice, corporate, plan, concept, presentation, portfolio, circle, scheme, element,marketing, technology, idea, management, modern, four, cycle, piece, circular, chart, system, options, strategy, project, round, processes, place,frame, web, group, infographic, movement, connected, part, background, structure, arrows. The prominent colors used in the PowerPoint template are Yellow, White, Gray.

Company Budget Assessment Dashboard With Progress Overview Background PDF
The following slide shows business departments budget portfolio with progress summary. It provides information about actuals, marketing accounting, human resource, etc. Showcasing this set of slides titled Company Budget Assessment Dashboard With Progress Overview Background PDF. The topics addressed in these templates are Total Costs, Budget Progress, Key Resources. All the content presented in this PPT design is completely editable. Download it and make adjustments in color, background, font etc. as per your unique business setting.

Budget Assessment Dashboard With Total Incomes And Expenses Information PDF
The following slides shows budget portfolio dashboard with incomes and expenses. It includes information about accounts payable, actual income, month, balance, Pitch your topic with ease and precision using this Budget Assessment Dashboard With Total Incomes And Expenses Information PDF. This layout presents information on Actual Income, Actual Expenses. It is also available for immediate download and adjustment. So, changes can be made in the color, design, graphics or any other component to create a unique layout.
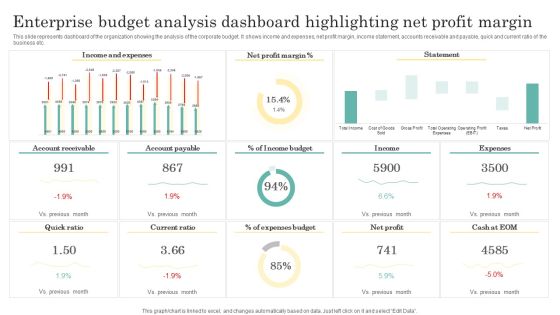
Enterprise Budget Analysis Dashboard Highlighting Net Profit Margin Clipart PDF
This slide represents dashboard of the organization showing the analysis of the corporate budget. It shows income and expenses, net profit margin, income statement, accounts receivable and payable, quick and current ratio of the business etc. Showcasing this set of slides titled Enterprise Budget Analysis Dashboard Highlighting Net Profit Margin Clipart PDF. The topics addressed in these templates are Income And Expenses, Net Profit Margin, Income Budget. All the content presented in this PPT design is completely editable. Download it and make adjustments in color, background, font etc. as per your unique business setting.
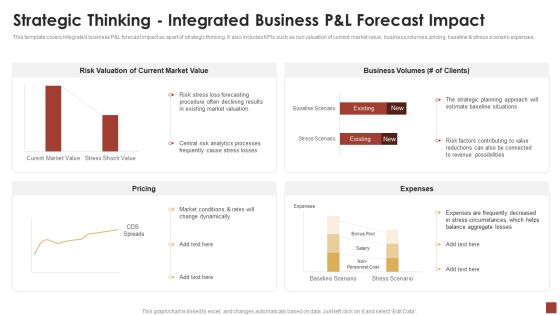
Strategical And Tactical Planning Strategic Thinking Integrated Business Pandl Forecast Impact Pictures PDF
This template covers integrated business P and L forecast impact as apart of strategic thinking. It also includes KPIs such as risk valuation of current market value, business volumes, pricing, baseline and stress scenario expenses. Deliver and pitch your topic in the best possible manner with this Strategical And Tactical Planning Strategic Thinking Integrated Business Pandl Forecast Impact Pictures PDF. Use them to share invaluable insights on Risk Valuation, Current Market Value, Business Volumes and impress your audience. This template can be altered and modified as per your expectations. So, grab it now.
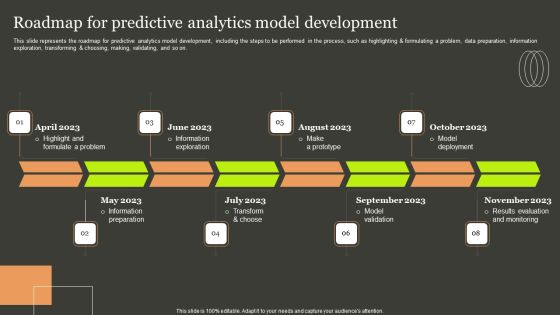
Predictive Analytics Methods Roadmap For Predictive Analytics Model Development Mockup PDF
This slide represents the roadmap for predictive analytics model development, including the steps to be performed in the process, such as highlighting and formulating a problem, data preparation, information exploration, transforming and choosing, making, validating, and so on. Slidegeeks is one of the best resources for PowerPoint templates. You can download easily and regulate Predictive Analytics Methods Roadmap For Predictive Analytics Model Development Mockup PDF for your personal presentations from our wonderful collection. A few clicks is all it takes to discover and get the most relevant and appropriate templates. Use our Templates to add a unique zing and appeal to your presentation and meetings. All the slides are easy to edit and you can use them even for advertisement purposes.

Data Interpretation And Analysis Playbook How To Bridge Business Intelligence And Predictive Analytics Challenges Designs PDF
This template depicts that with interactive BI visualization and predictive modeling in the same enterprise analytics platform, organizations can easily collaborate on initiatives that make recommended actions accessible to the business. Deliver an awe inspiring pitch with this creative data interpretation and analysis playbook how to bridge business intelligence and predictive analytics challenges designs pdf bundle. Topics like how to bridge business intelligence and predictive analytics challenges can be discussed with this completely editable template. It is available for immediate download depending on the needs and requirements of the user.
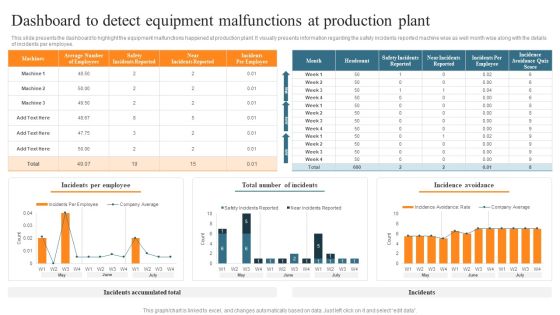
Leveraging Predictive Maintenance To Enhance Production Process Dashboard To Detect Equipment Malfunctions At Production Slides PDF
This slide presents the dashboard to highlight the equipment malfunctions happened at production plant. It visually presents information regarding the safety incidents reported machine wise as well month wise along with the details of incidents per employee. Want to ace your presentation in front of a live audience Our Leveraging Predictive Maintenance To Enhance Production Process Dashboard To Detect Equipment Malfunctions At Production Slides PDF can help you do that by engaging all the users towards you.. Slidegeeks experts have put their efforts and expertise into creating these impeccable powerpoint presentations so that you can communicate your ideas clearly. Moreover, all the templates are customizable, and easy-to-edit and downloadable. Use these for both personal and commercial use.

Calculate Facebook Key Performance Indicator Ppt PowerPoint Presentation Complete Deck With Slides
This complete deck acts as a great communication tool. It helps you in conveying your business message with personalized sets of graphics, icons etc. Comprising a set of eleven slides, this complete deck can help you persuade your audience. It also induces strategic thinking as it has been thoroughly researched and put together by our experts. Not only is it easily downloadable but also editable. The color, graphics, theme any component can be altered to fit your individual needs. So grab it now.

Agenda Predictive Data Model Microsoft PDF
Do you have to make sure that everyone on your team knows about any specific topic I yes, then you should give Agenda Predictive Data Model Microsoft PDF a try. Our experts have put a lot of knowledge and effort into creating this impeccable Agenda Predictive Data Model Microsoft PDF. You can use this template for your upcoming presentations, as the slides are perfect to represent even the tiniest detail. You can download these templates from the Slidegeeks website and these are easy to edit. So grab these today

Customer Success And Satisfaction KPIS Dashboard Ppt PowerPoint Presentation Outline Visuals PDF
This slide covers dashboard for estimation of customer satisfaction with success metrics. It includes KPIs such as average CSAT, average response time , service level agreement compliance, top companys accounts, etc. Pitch your topic with ease and precision using this Customer Success And Satisfaction KPIS Dashboard Ppt PowerPoint Presentation Outline Visuals PDF. This layout presents information on Customer Success, Satisfaction KPIs Dashboard. It is also available for immediate download and adjustment. So, changes can be made in the color, design, graphics or any other component to create a unique layout.

Financial Budgeting And Assessment Dashboard With Revenue Variance Designs PDF
This slide shows the dashboard representing financial analysis and planning of an organization. It highlights the set revenue targets and actual revenue with the help of graphs. Showcasing this set of slides titled Financial Budgeting And Assessment Dashboard With Revenue Variance Designs PDF. The topics addressed in these templates are YTD Revenue, Revenue Delta, Revenue Variance. All the content presented in this PPT design is completely editable. Download it and make adjustments in color, background, font etc. as per your unique business setting.

Dashboard For Tracking Green Financing Activities Themes PDF
This slide presents a finance dashboard to track the progress of sustainability activities based on finance allocations. The key performing indicators are overall progress, energy usage by month, budget allocation and application etc. Showcasing this set of slides titled Dashboard For Tracking Green Financing Activities Themes PDF. The topics addressed in these templates are Activities, Application, Dashboard. All the content presented in this PPT design is completely editable. Download it and make adjustments in color, background, font etc. as per your unique business setting.
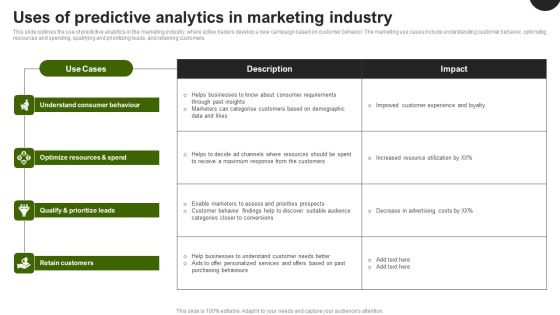
Predictive Analytics In The Age Of Big Data Uses Of Predictive Analytics In Marketing Industry Sample PDF
This slide outlines the use of predictive analytics in the marketing industry, where active traders develop a new campaign based on customer behavior. The marketing use cases include understanding customer behavior, optimizing resources and spending, qualifying and prioritizing leads, and retaining customers. Slidegeeks is here to make your presentations a breeze with Predictive Analytics In The Age Of Big Data Uses Of Predictive Analytics In Marketing Industry Sample PDF With our easy to use and customizable templates, you can focus on delivering your ideas rather than worrying about formatting. With a variety of designs to choose from, you are sure to find one that suits your needs. And with animations and unique photos, illustrations, and fonts, you can make your presentation pop. So whether you are giving a sales pitch or presenting to the board, make sure to check out Slidegeeks first.

Market Report Of EDI Document Transport Pictures PDF
This slide provides glimpse about market analysis and future market forecast report of Electronic Data Interchange EDI system. It includes base year, historical data, forecast period, etc.Showcasing this set of slides titled Market Report Of EDI Document Transport Pictures PDF. The topics addressed in these templates are Segments Covered, Report Coverage, Retail Consumer. All the content presented in this PPT design is completely editable. Download it and make adjustments in color, background, font etc. as per your unique business setting.

New Commodity Assessment Kpi Dashboard Pictures PDF
The following slide highlights the status of new product development. It includes KPIs such as planning, design, development, testing status, budget, task deadline etc.Showcasing this set of slides titled New Commodity Assessment Kpi Dashboard Pictures PDF. The topics addressed in these templates are Development, Product Launch Date, Overdue Tasks. All the content presented in this PPT design is completely editable. Download it and make adjustments in color, background, font etc. as per your unique business setting.
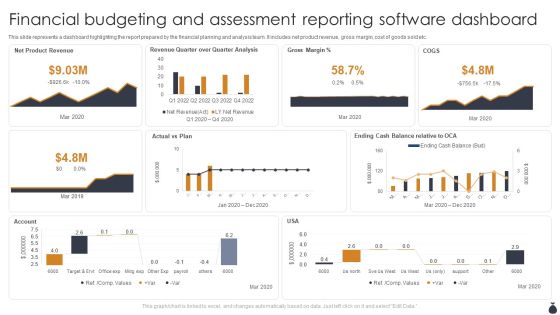
Financial Budgeting And Assessment Reporting Software Dashboard Template PDF
This slide represents a dashboard highlighting the report prepared by the financial planning and analysis team. It includes net product revenue, gross margin, cost of goods sold etc. Showcasing this set of slides titled Financial Budgeting And Assessment Reporting Software Dashboard Template PDF. The topics addressed in these templates are Net Product Revenue, Actual Vs Plan, Account. All the content presented in this PPT design is completely editable. Download it and make adjustments in color, background, font etc. as per your unique business setting.

Customer Lifetime Value Based Success KPIS Dashboard Ppt PowerPoint Presentation Layouts Gridlines PDF
This slide covers dashboard for estimation of customer lifetime value as success metrics. It includes KPIs such as customer lifetime value, customer lifetime period, customer risk, customer contact rate, customer retention costs, average lifetime value, customer churn rate, average revenue per account, etc. Pitch your topic with ease and precision using this Customer Lifetime Value Based Success KPIS Dashboard Ppt PowerPoint Presentation Layouts Gridlines PDF. This layout presents information on Average Revenue, Customer Lifetime, Customer Risk. It is also available for immediate download and adjustment. So, changes can be made in the color, design, graphics or any other component to create a unique layout.

Guide To Develop And Estimate Brand Value Brand Awareness Measuring Kpi Dashboard Infographics PDF
Following slide illustrates KPI dashboard that can be used to track the awareness level of a specific brand. KPIs covered in the slide are traffic, attention, authority, inbound channel performance etc.From laying roadmaps to briefing everything in detail, our templates are perfect for you. You can set the stage with your presentation slides. All you have to do is download these easy-to-edit and customizable templates. Guide To Develop And Estimate Brand Value Brand Awareness Measuring Kpi Dashboard Infographics PDF will help you deliver an outstanding performance that everyone would remember and praise you for. Do download this presentation today.

Customer Relationship Management Software CRM Dashboard For Tracking Sales Pipeline Background PDF
This slide covers the CRM KPI dashboard for monitoring lead status in the sales funnel. It includes metrics such as open pipeline value, open pipeline by product package, pipeline value forecast, etc. Deliver and pitch your topic in the best possible manner with this Customer Relationship Management Software CRM Dashboard For Tracking Sales Pipeline Background PDF. Use them to share invaluable insights on Product Package, Pipeline Value, Value Forecast and impress your audience. This template can be altered and modified as per your expectations. So, grab it now.

CRM System Implementation Stages CRM Dashboard For Tracking Sales Pipeline Background PDF
This slide covers the CRM KPI dashboard for monitoring lead status in the sales funnel. It includes metrics such as open pipeline value, open pipeline by product package, pipeline value forecast, etc. Deliver and pitch your topic in the best possible manner with this CRM System Implementation Stages CRM Dashboard For Tracking Sales Pipeline Background PDF. Use them to share invaluable insights on Pipeline Value, Value Forecast, Sales Opportunities and impress your audience. This template can be altered and modified as per your expectations. So, grab it now.
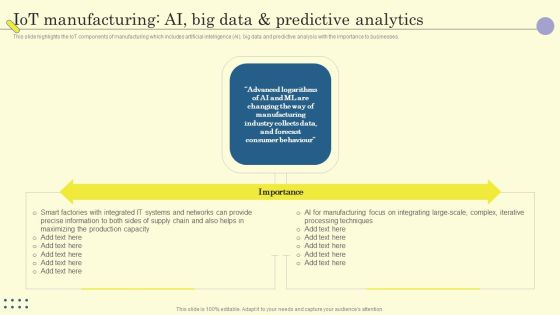
Internet Of Things In Manufacturing Sector Iot Manufacturing AI Big Data And Predictive Analytics Demonstration PDF
This slide highlights the IoT components of manufacturing which includes artificial intelligence AI, big data and predictive analysis with the importance to businesses. The Internet Of Things In Manufacturing Sector Iot Manufacturing AI Big Data And Predictive Analytics Demonstration PDF is a compilation of the most recent design trends as a series of slides. It is suitable for any subject or industry presentation, containing attractive visuals and photo spots for businesses to clearly express their messages. This template contains a variety of slides for the user to input data, such as structures to contrast two elements, bullet points, and slides for written information. Slidegeeks is prepared to create an impression.

Stock Photo Calculator On Dollars Background PowerPoint Slide
This image slide displays calculator on dollar notes. This PowerPoint template contains the concept of monetary calculation. Use this slide for displaying financial calculation in any presentation and get noticed by your viewers.
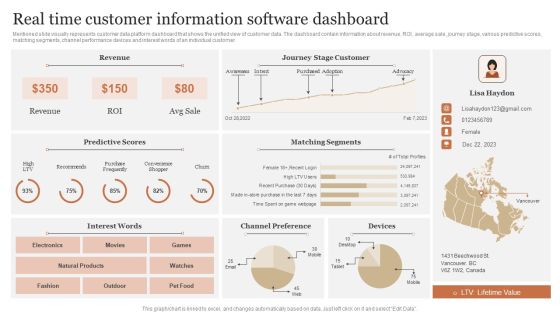
Real Time Customer Information Software Dashboard Portrait PDF
Mentioned slide visually represents customer data platform dashboard that shows the unified view of customer data. The dashboard contain information about revenue, ROI, average sale, journey stage, various predictive scores, matching segments, channel performance devices and interest words of an individual customer. Showcasing this set of slides titled Real Time Customer Information Software Dashboard Portrait PDF. The topics addressed in these templates are Predictive Scores, Matching Segments, Channel Preference. All the content presented in this PPT design is completely editable. Download it and make adjustments in color, background, font etc. as per your unique business setting.

Regression Model For Predictive Analytics Forward Looking Analysis IT Topics PDF
This slide represents the regression model of predictive analytics that is most commonly used in statistical analysis. This model is used to identify patterns in large amounts of data and works by calculating a formula. Presenting this PowerPoint presentation, titled Regression Model For Predictive Analytics Forward Looking Analysis IT Topics PDF, with topics curated by our researchers after extensive research. This editable presentation is available for immediate download and provides attractive features when used. Download now and captivate your audience. Presenting this Regression Model For Predictive Analytics Forward Looking Analysis IT Topics PDF. Our researchers have carefully researched and created these slides with all aspects taken into consideration. This is a completely customizable Regression Model For Predictive Analytics Forward Looking Analysis IT Topics PDF that is available for immediate downloading. Download now and make an impact on your audience. Highlight the attractive features available with our PPTs.

Calculating Customer Lifetime Value Clv Ppt PowerPoint Presentation Show Icon
This is a calculating customer lifetime value clv ppt powerpoint presentation show icon. This is a five stage process. The stages in this process are average acquisition cost, average customer revenue, average customer costs, average customer profit, customer retention rate.
Sales Techniques Playbook Sales Management Activities Tracking Dashboard Pictures PDF
This slide provides information regarding sales management activities tracking dashboard to measure closed business, sales pipeline, sales activity by sales rep, month over month growth, forecast by month, etc. Deliver and pitch your topic in the best possible manner with this sales techniques playbook sales management activities tracking dashboard pictures pdf Use them to share invaluable insights on sales management activities tracking dashboard and impress your audience. This template can be altered and modified as per your expectations. So, grab it now.

Budget Monitoring And Control Performance Circular Ppt PowerPoint Presentation Pictures
This is a budget monitoring and control performance circular ppt powerpoint presentation pictures. This is a four stage process. The stages in this process are circular process, financial, budget management, management.

Overhead Cost Budget Analysis Ppt PowerPoint Presentation Pictures Information
This is a overhead cost budget analysis ppt powerpoint presentation pictures information. This is a four stage process. The stages in this process are business, finance, budget, marketing, analysis, table.

Action Plan To Enhance Cash Flow Metrics Ppt Show Maker PDF
This slide showcases action to improve key metrics of cash flow. The KPIs covered are forecast variance, cash conversion cycle, sustainable growth rate, working capital and days payable outstanding. Showcasing this set of slides titled Action Plan To Enhance Cash Flow Metrics Ppt Show Maker PDF. The topics addressed in these templates are Forecast Variance, Cash Conversion Cycle, Sustainable Growth Rate. All the content presented in this PPT design is completely editable. Download it and make adjustments in color, background, font etc. as per your unique business setting.

Calculating Customer Lifetime Value Clv Ppt PowerPoint Presentation Styles Good
This is a calculating customer lifetime value clv ppt powerpoint presentation styles good. This is a five stage process. The stages in this process are average acquisition cost, average customer revenue, average customer costs, average customer profit, customer retention rate, cumulative retention rate, likely customer profit.
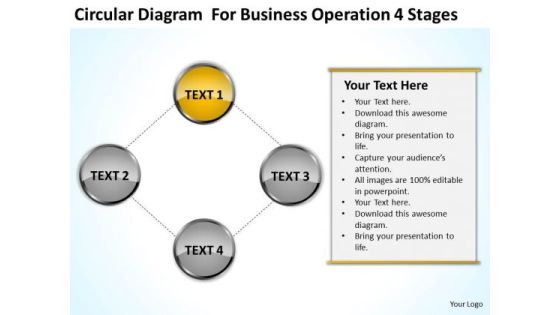
Circular Diagram For Business Operation 4 Stages Ppt Catering Plan PowerPoint Slides
We present our circular diagram for business operation 4 stages ppt catering plan PowerPoint Slides.Download and present our Arrows PowerPoint Templates because It can be used to Set your controls for the heart of the sun. Our PowerPoint Templates and Slides will be the propellant to get you there. Download and present our Process and Flows PowerPoint Templates because Our PowerPoint Templates and Slides are aesthetically designed to attract attention. We gaurantee that they will grab all the eyeballs you need. Download our Business PowerPoint Templates because Our PowerPoint Templates and Slides has conjured up a web of all you need with the help of our great team. Use them to string together your glistening ideas. Present our Flow Charts PowerPoint Templates because They will Put the wind in your sails. Skim smoothly over the choppy waters of the market. Download our Shapes PowerPoint Templates because Our PowerPoint Templates and Slides will Embellish your thoughts. They will help you illustrate the brilliance of your ideas.Use these PowerPoint slides for presentations relating to Diagram, business, decoration, form, components, step, layout, interface, plan, concept, vector, presentation, internet, circle, scheme, marketing, abstract, cycle, stage, circular, system, options, strategy, project, processes, term, solution, design, color, set, organization, infographic, four, art, connected, career, part, structure, arrows, communication. The prominent colors used in the PowerPoint template are Yellow, Gray, Black.

Circular Diagram Market Operation 4 Stages Ppt Business Plan Cover Page PowerPoint Templates
We present our circular diagram market operation 4 stages ppt business plan cover page PowerPoint templates.Present our Process and Flows PowerPoint Templates because Our PowerPoint Templates and Slides will let you meet your Deadlines. Download our Flow Charts PowerPoint Templates because Our PowerPoint Templates and Slides will let your ideas bloom. Create a bed of roses for your audience. Use our Arrows PowerPoint Templates because Our PowerPoint Templates and Slides are topically designed to provide an attractive backdrop to any subject. Download and present our Business PowerPoint Templates because Our PowerPoint Templates and Slides are the chords of your song. String them along and provide the lilt to your views. Download our Marketing PowerPoint Templates because It is Aesthetically crafted by artistic young minds. Our PowerPoint Templates and Slides are designed to display your dexterity.Use these PowerPoint slides for presentations relating to Business, diagram, decoration, segment, slice, corporate, plan, concept, presentation, portfolio, circle, scheme, element,marketing, technology, idea, development, management, modern, four, cycle, piece, circular, chart, system, options, strategy, project, round, processes, place,frame, web, group, infographic, banner, movement, connected, part, background, structure, arrows. The prominent colors used in the PowerPoint template are Green, White, Gray.
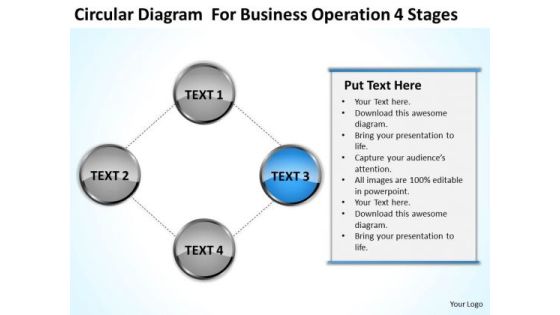
Diagram For Business Operation 4 Stages Ppt Plan Sample Restaurant PowerPoint Slides
We present our diagram for business operation 4 stages ppt plan sample restaurant PowerPoint Slides.Use our Business PowerPoint Templates because Our PowerPoint Templates and Slides will let your ideas bloom. Create a bed of roses for your audience. Download our Flow Charts PowerPoint Templates because You can safely bank on our PowerPoint Templates and Slides. They will provide a growth factor to your valuable thoughts. Download our Shapes PowerPoint Templates because You should Bet on your luck with our PowerPoint Templates and Slides. Be assured that you will hit the jackpot. Download and present our Arrows PowerPoint Templates because You can Hit a home run with our PowerPoint Templates and Slides. See your ideas sail into the minds of your audience. Use our Process and Flows PowerPoint Templates because Our PowerPoint Templates and Slides will let your team Walk through your plans. See their energy levels rise as you show them the way.Use these PowerPoint slides for presentations relating to Diagram, business, decoration, form, components, step, layout, interface, plan, concept, vector, presentation, internet, circle, scheme, marketing, abstract, cycle, stage, circular, system, options, strategy, project, processes, term, solution, design, color, set, organization, infographic, four, art, connected, career, part, structure, arrows, communication. The prominent colors used in the PowerPoint template are Gray, Blue, White.

Mixed Circular Diagram Market Operation 4 Stages Marketing Plan PowerPoint Slides
We present our mixed circular diagram market operation 4 stages marketing plan PowerPoint Slides.Download our Business PowerPoint Templates because Our PowerPoint Templates and Slides are truly out of this world. Even the MIB duo has been keeping tabs on our team. Present our Marketing PowerPoint Templates because Our PowerPoint Templates and Slides will Embellish your thoughts. They will help you illustrate the brilliance of your ideas. Present our Flow Charts PowerPoint Templates because You are working at that stage with an air of royalty. Let our PowerPoint Templates and Slides be the jewels in your crown. Download and present our Process and Flows PowerPoint Templates because Our PowerPoint Templates and Slides will provide weight to your words. They will bring out the depth of your thought process. Present our Shapes PowerPoint Templates because Our PowerPoint Templates and Slides are conceived by a dedicated team. Use them and give form to your wondrous ideas.Use these PowerPoint slides for presentations relating to Business, diagram, decoration, segment, slice, corporate, plan, concept, presentation, portfolio, circle, scheme, element,marketing, technology, idea, management, modern, four, cycle, piece, circular, chart, system, options, strategy, project, round, processes, place,frame, web, group, infographic, movement, connected, part, background, structure, arrows. The prominent colors used in the PowerPoint template are Blue, Gray, White.

Mixed Circular Diagram Market Operation 4 Stages Ppt Sample Business Plan PowerPoint Slides
We present our mixed circular diagram market operation 4 stages ppt sample business plan PowerPoint Slides.Use our Process and Flows PowerPoint Templates because You will get more than you ever bargained for. Download and present our Flow Charts PowerPoint Templates because You can safely bank on our PowerPoint Templates and Slides. They will provide a growth factor to your valuable thoughts. Present our Business PowerPoint Templates because Our PowerPoint Templates and Slides come in all colours, shades and hues. They help highlight every nuance of your views. Present our Shapes PowerPoint Templates because our PowerPoint Templates and Slides will give your ideas the shape. Download and present our Marketing PowerPoint Templates because Our PowerPoint Templates and Slides are like the strings of a tennis racquet. Well strung to help you serve aces.Use these PowerPoint slides for presentations relating to Business, diagram, decoration, segment, slice, corporate, plan, concept, presentation, portfolio, circle, scheme, element,marketing, technology, idea, management, modern, four, cycle, piece, circular, chart, system, options, strategy, project, round, processes, place,frame, web, group, infographic, movement, connected, part, background, structure, arrows. The prominent colors used in the PowerPoint template are Gray, Red, Black.

Budgeting Template Ppt PowerPoint Presentation Pictures Graphic Tips
This is a budgeting template ppt powerpoint presentation pictures graphic tips. This is a three stage process. The stages in this process are public relations, web marketing, advertising.

Stock Photo Arrow Percentage Increase Calculation Ppt Template
Open Up Doors That Lead To Success. Our Stock Photo Arrow Percentage Increase Calculation PPT template Powerpoint Templates Provide The Handles.

Calculating Customer Lifetime Value Clv Ppt PowerPoint Presentation Summary
This is a calculating customer lifetime value clv ppt powerpoint presentation summary. This is a five stage process. The stages in this process are complete clv, average acquisition cost, average customer revenue, average customer costs, average customer profit, customer retention rate, likely customer profit.

CRM Dashboard For Tracking Sales Pipeline Brochure PDF
This slide covers the CRM KPI dashboard for monitoring lead status in the sales funnel. It includes metrics such as open pipeline value, open pipeline by product package, pipeline value forecast, etc. Crafting an eye catching presentation has never been more straightforward. Let your presentation shine with this tasteful yet straightforward CRM Dashboard For Tracking Sales Pipeline Brochure PDF template. It offers a minimalistic and classy look that is great for making a statement. The colors have been employed intelligently to add a bit of playfulness while still remaining professional. Construct the ideal CRM Dashboard For Tracking Sales Pipeline Brochure PDF that effortlessly grabs the attention of your audience Begin now and be certain to wow your customers.

Stock Photo Business Management Strategy Calculate Your Money Savings Image
Encourage Curiosity In Your Audience. Our stock photo business management strategy calculate your money savings image Will Give Them Food For Thought. Display Fondness For Accuracy With Our money. Convince Them Of Your Desire To Be Correct.
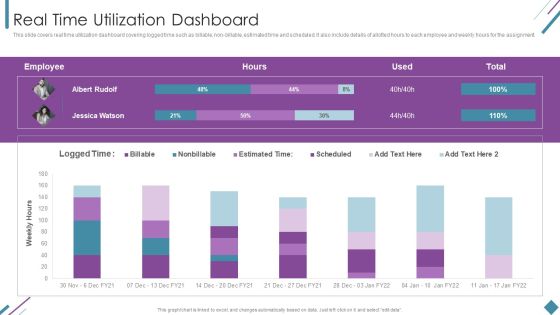
Metrics To Measure Business Performance Real Time Utilization Dashboard Topics PDF
This slide covers real time utilization dashboard covering logged time such as billable, non-billable, estimated time and scheduled. It also include details of allotted hours to each employee and weekly hours for the assignment. Deliver an awe inspiring pitch with this creative Metrics To Measure Business Performance Real Time Utilization Dashboard Topics PDF bundle. Topics like Weekly Hours, Employee, Estimated Time can be discussed with this completely editable template. It is available for immediate download depending on the needs and requirements of the user.

 Home
Home