Organizational Chart

Chart Showing Business Issues In Big Data Analytics Diagrams PDF
Pitch your topic with ease and precision using this chart showing business issues in big data analytics diagrams pdf. This layout presents information on data complexity, data volumes, performance, skills. It is also available for immediate download and adjustment. So, changes can be made in the color, design, graphics or any other component to create a unique layout.

Biyearly Gantt Chart For Project Management Elements PDF
Pitch your topic with ease and precision using this Biyearly Gantt Chart For Project Management Elements PDF. This layout presents information on Designing, Planning, Implementation. It is also available for immediate download and adjustment. So, changes can be made in the color, design, graphics or any other component to create a unique layout.
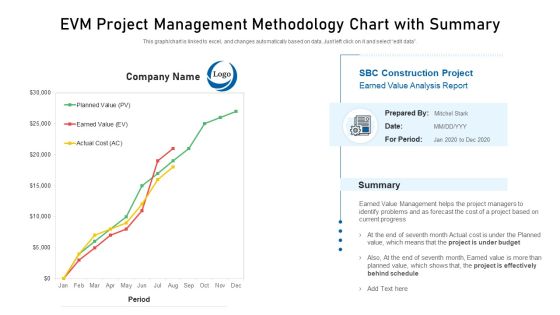
EVM Project Management Methodology Chart With Summary Clipart PDF
Pitch your topic with ease and precision using this evm project management methodology chart with summary clipart pdf. This layout presents information on project based, value management, forecast. It is also available for immediate download and adjustment. So, changes can be made in the color, design, graphics or any other component to create a unique layout.
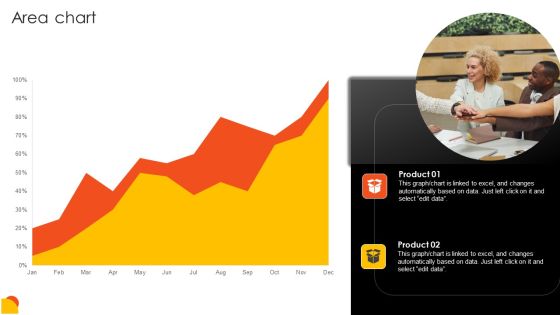
Effective Staff Performance Optimization Techniques Area Chart Template PDF
Boost your pitch with our creative Effective Staff Performance Optimization Techniques Area Chart Template PDF. Deliver an awe inspiring pitch that will mesmerize everyone. Using these presentation templates you will surely catch everyones attention. You can browse the ppts collection on our website. We have researchers who are experts at creating the right content for the templates. So you do not have to invest time in any additional work. Just grab the template now and use them.

PowerPoint Template Chart Components Of Circular Ppt Presentation
PowerPoint Template Chart Components of Circular PPT Presentation Business Power Points-The Circle of Life - a concept emmbedded in our minds and hence easy to comprehend. Life and Business is made up of processes comprising stages that flow from one to another. An excellent graphic to attract the attention of and understanding by your audience to improve earnings.-These amazing PowerPoint pre-designed slides and PowerPoint templates have been carefully created by our team of experts to help you impress your audience. Our stunning collection of Powerpoint slides are 100% editable and can easily fit in any PowerPoint presentations. By using these animations and graphics in PowerPoint and you can easily make professional presentations. Any text can be entered at any point in the PowerPoint template or slide. Just DOWNLOAD our awesome PowerPoint templates and you are ready to go.

Steps New Business PowerPoint Presentation Diverging Processes Cycle Chart Slides
We present our steps new business powerpoint presentation diverging processes Cycle Chart Slides.Use our Arrows PowerPoint Templates because the basic stages are in place, you need to build upon them with our PowerPoint templates. Download our Business PowerPoint Templates because a brainwave has occurred to you after review. You know just how to push the graph skyward. Download our Shapes PowerPoint Templates because you can Highlight the key components of your entire manufacturing/ business process. Use our Flow Charts PowerPoint Templates because you have some exciting plans to spread goodwill among the underprivileged, Expound on your ideas and show to your colleagues how they can help others and in the process increase your Brand value. Use our Process and Flows PowerPoint Templates because Our PowerPoint Templates and Slides help you meet the demand of the Market. Just browse and pick the slides that appeal to your intuitive senses.Use these PowerPoint slides for presentations relating to Action, Advertising, Arrows, Business, Design, Development, Diagram, Element, Planning, Graphic, Idea, Illustration, Management, Market, Marketing, Presentation, Process, Description, Progress, Strategy, Success, Target, Training, Vector. The prominent colors used in the PowerPoint template are Orange, White, Gray. People tell us our steps new business powerpoint presentation diverging processes Cycle Chart Slides are Perfect. People tell us our Planning PowerPoint templates and PPT Slides are Splendid. The feedback we get is that our steps new business powerpoint presentation diverging processes Cycle Chart Slides are Amazing. Presenters tell us our Business PowerPoint templates and PPT Slides are Functional. Customers tell us our steps new business powerpoint presentation diverging processes Cycle Chart Slides are Fun. The feedback we get is that our Planning PowerPoint templates and PPT Slides are Romantic.
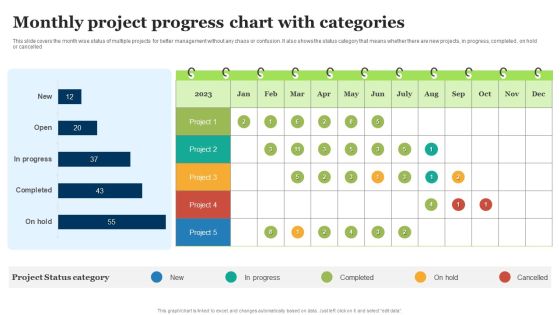
Monthly Project Progress Chart With Categories Ppt Professional Outfit PDF
This slide covers the month wise status of multiple projects for better management without any chaos or confusion. It also shows the status category that means whether there are new projects, in progress, completed , on hold or cancelled. Pitch your topic with ease and precision using this Monthly Project Progress Chart With Categories Ppt Professional Outfit PDF. This layout presents information on Project Status Category, Completed, Progress. It is also available for immediate download and adjustment. So, changes can be made in the color, design, graphics or any other component to create a unique layout.
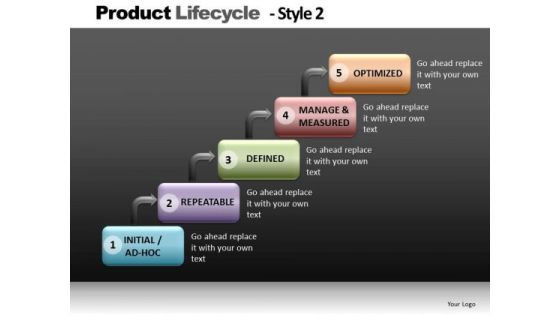
Stairscase Diagram Chart PowerPoint Slides Editable Ppt Templates
StairsCase Diagram Chart PowerPoint Slides Editable PPT templates-These high quality powerpoint pre-designed slides and powerpoint templates have been carefully created by our professional team to help you impress your audience. All slides have been created and are 100% editable in powerpoint. Each and every property of any graphic - color, size, orientation, shading, outline etc. can be modified to help you build an effective powerpoint presentation. Any text can be entered at any point in the powerpoint template or slide. Simply DOWNLOAD, TYPE and PRESENT!These PowerPoint designs and slide layouts can be used to in presentations relating to --Activities, business, clipart, commerce, concept, conceptual, customer, design, diagram, direction, distribution, guidelines, icon, illustration, integration, lifecycle, manage, management, manufacturing, marketing, mba, model, optimize, organization, performance, process, product, resentation, resource, sales, selling, steps, system, theoretical, theory, tool-StairsCase Diagram Chart PowerPoint Slides Editable PPT templates
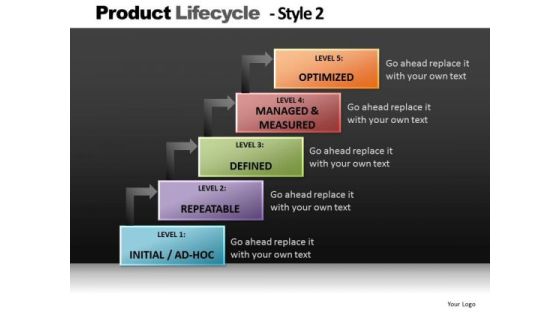
Step Diagram Chart Process PowerPoint Slides And Editable Ppt Templates
Step Diagram Chart Process PowerPoint Slides and Editable PPT templates-These high quality powerpoint pre-designed slides and powerpoint templates have been carefully created by our professional team to help you impress your audience. All slides have been created and are 100% editable in powerpoint. Each and every property of any graphic - color, size, orientation, shading, outline etc. can be modified to help you build an effective powerpoint presentation. Any text can be entered at any point in the powerpoint template or slide. Simply DOWNLOAD, TYPE and PRESENT!These PowerPoint designs and slide layouts can be used to in presentations relating to --Activities, business, clipart, commerce, concept, conceptual, customer, design, diagram, direction, distribution, guidelines, icon, illustration, integration, lifecycle, manage, management, manufacturing, marketing, mba, model, optimize, organization, performance, process, product, resentation, resource, sales, selling, steps, system, theoretical, theory, tool-Step Diagram Chart Process PowerPoint Slides and Editable PPT templates

Steps Process Chart Diagram PowerPoint Slides And Editable PowerPoint Templates
Steps Process Chart Diagram PowerPoint Slides and Editable PowerPoint templates-These high quality powerpoint pre-designed slides and powerpoint templates have been carefully created by our professional team to help you impress your audience. All slides have been created and are 100% editable in powerpoint. Each and every property of any graphic - color, size, orientation, shading, outline etc. can be modified to help you build an effective powerpoint presentation. Any text can be entered at any point in the powerpoint template or slide. Simply DOWNLOAD, TYPE and PRESENT!These PowerPoint designs and slide layouts can be used to in presentations relating to --Activities, business, clipart, commerce, concept, conceptual, customer, design, diagram, direction, distribution, guidelines, icon, illustration, integration, lifecycle, manage, management, manufacturing, marketing, mba, model, optimize, organization, performance, process, product, resentation, resource, sales, selling, steps, system, theoretical, theory, tool-Steps Process Chart Diagram PowerPoint Slides and Editable PowerPoint templates
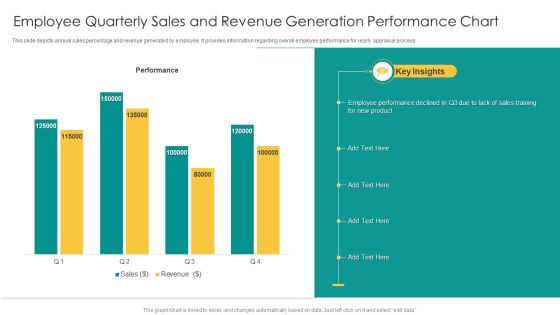
Employee Quarterly Sales And Revenue Generation Performance Chart Mockup PDF
This slide depicts annual sales percentage and revenue generated by employee. It provides information regarding overall employee performance for yearly appraisal process. Pitch your topic with ease and precision using this Employee Quarterly Sales And Revenue Generation Performance Chart Mockup PDF. This layout presents information on Performance, Sales, Revenue. It is also available for immediate download and adjustment. So, changes can be made in the color, design, graphics or any other component to create a unique layout.
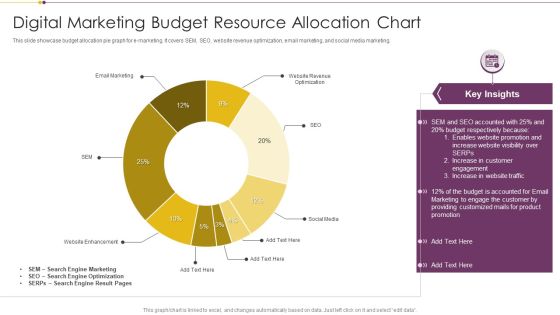
Digital Marketing Budget Resource Allocation Chart Download PDF
This slide showcase budget allocation pie graph for e marketing. It covers SEM, SEO, website revenue optimization, email marketing, and social media marketing. Pitch your topic with ease and precision using this Digital Marketing Budget Resource Allocation Chart Download PDF. This layout presents information on Search Engine Marketing, Search Engine Optimization, Budget. It is also available for immediate download and adjustment. So, changes can be made in the color, design, graphics or any other component to create a unique layout.
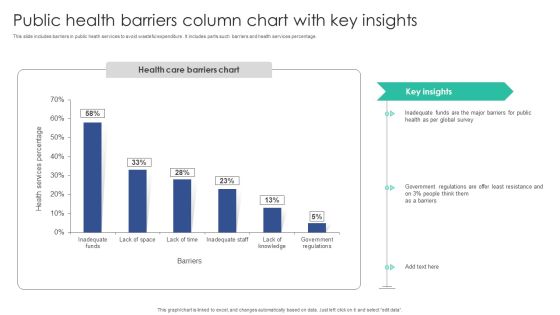
Public Health Barriers Column Chart With Key Insights Portrait PDF
This slide includes barriers in public heath services to avoid wasteful expenditure . It includes parts such barriers and health services percentage.Pitch your topic with ease and precision using this Public Health Barriers Column Chart With Key Insights Portrait PDF. This layout presents information on Inadequate Funds, Global Survey, Government Regulations. It is also available for immediate download and adjustment. So, changes can be made in the color, design, graphics or any other component to create a unique layout.
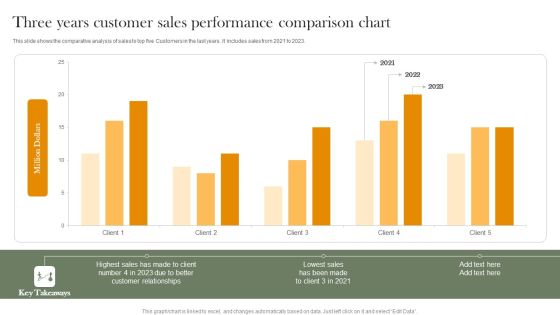
Three Years Customer Sales Performance Comparison Chart Professional PDF
This slide shows the comparative analysis of sales to top five Customers in the last years. It includes sales from 2021 to 2023. Pitch your topic with ease and precision using this Three Years Customer Sales Performance Comparison Chart Professional PDF. This layout presents information on Highest Sales, Customer Relationships, Lowest Sales. It is also available for immediate download and adjustment. So, changes can be made in the color, design, graphics or any other component to create a unique layout.

HR Recruitment Flow Chart Ppt PowerPoint Presentation Complete With Slides
This HR Recruitment Flow Chart Ppt PowerPoint Presentation Complete With Slides acts as backup support for your ideas, vision, thoughts, etc. Use it to present a thorough understanding of the topic. This PPT slideshow can be utilized for both in-house and outside presentations depending upon your needs and business demands. Entailing sixteen slides with a consistent design and theme, this template will make a solid use case. As it is intuitively designed, it suits every business vertical and industry. All you have to do is make a few tweaks in the content or any other component to design unique presentations. The biggest advantage of this complete deck is that it can be personalized multiple times once downloaded. The color, design, shapes, and other elements are free to modify to add personal touches. You can also insert your logo design in this PPT layout. Therefore a well-thought and crafted presentation can be delivered with ease and precision by downloading this HR Recruitment Flow Chart Ppt PowerPoint Presentation Complete With Slides PPT slideshow.

Enterprise Quarterly Income And Expenditure Performance Chart Graphics PDF
This slide depicts total income and expenses incurred annually. It represents the value of the income to expenses for each pair of bars, by quarter and variance is the profit earned. Pitch your topic with ease and precision using this Enterprise Quarterly Income And Expenditure Performance Chart Graphics PDF. This layout presents information on Expenses Surpassed Income, Sales, Huge Profit. It is also available for immediate download and adjustment. So, changes can be made in the color, design, graphics or any other component to create a unique layout.
Outcomes Summary Of Company Revenues Using Pie Chart Icons PDF
This slide focuses on graphical representation of revenues earned by company which includes media such as print advertising, electronic-media, events, paid subscriptions , custom publishing, etc.Pitch your topic with ease and precision using this Outcomes Summary Of Company Revenues Using Pie Chart Icons PDF This layout presents information on Custom Publishing, Paid Subscriptions, Revenues Are Generated It is also available for immediate download and adjustment. So, changes can be made in the color, design, graphics or any other component to create a unique layout.
Six Months Business Valuation Chart Ppt Styles Icons PDF
This slide shows the 6 months graph to measure company valuation. It is representing that highest valuation of company was calculated in the month of June due to increase in sales. Pitch your topic with ease and precision using this Six Months Business Valuation Chart Ppt Styles Icons PDF. This layout presents information on Increase Sales, Company Valuation. It is also available for immediate download and adjustment. So, changes can be made in the color, design, graphics or any other component to create a unique layout.
Product Marketing And Promotional Budget Spends Pie Chart Icons PDF
This slide covers marketing expenditures from budget allotted. It includes percentages for online advertising, sales training, conventions, trade shows, print advertising, publications, radio advertisements, magazines, catalogues and brochures. Pitch your topic with ease and precision using this Product Marketing And Promotional Budget Spends Pie Chart Icons PDF. This layout presents information on Conventions Were Maximum, Drive Maximum, Profit And Sales. It is also available for immediate download and adjustment. So, changes can be made in the color, design, graphics or any other component to create a unique layout.

Line Chart Representing Outcomes Summary Of Product Sales Mockup PDF
This slide shows the graphical representation of sales volume of company products which includes product A , B and C which helps company to analyze the acceptability of products by potential customers.Pitch your topic with ease and precision using this Line Chart Representing Outcomes Summary Of Product Sales Mockup PDF This layout presents information on Company Generated, Maximum Revenues, Increasing For Product It is also available for immediate download and adjustment. So, changes can be made in the color, design, graphics or any other component to create a unique layout.

Strategic Brand Refreshing Actions Line Chart Information PDF
This Strategic Brand Refreshing Actions Line Chart Information PDF from Slidegeeks makes it easy to present information on your topic with precision. It provides customization options, so you can make changes to the colors, design, graphics, or any other component to create a unique layout. It is also available for immediate download, so you can begin using it right away. Slidegeeks has done good research to ensure that you have everything you need to make your presentation stand out. Make a name out there for a brilliant performance.
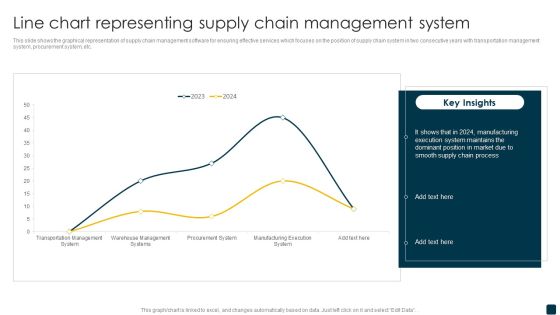
Line Chart Representing Supply Chain Management System Rules PDF
This slide shows the graphical representation of supply chain management software for ensuring effective services which focuses on the position of supply chain system in two consecutive years with transportation management system, procurement system, etc. Pitch your topic with ease and precision using this Line Chart Representing Supply Chain Management System Rules PDF. This layout presents information on Supply Chain Process, Manufacturing, Execution System. It is also available for immediate download and adjustment. So, changes can be made in the color, design, graphics or any other component to create a unique layout.

Breakdown Of Information Technology Budget Spend Analysis Chart Download PDF
This slide covers total IT expenditure financial report. It includes expenses incurred on SAAS, on-premises software, laaS in healthcare, retail, industrial products, financial services, transportation, tech hosting, etc. Pitch your topic with ease and precision using this Breakdown Of Information Technology Budget Spend Analysis Chart Download PDF. This layout presents information on Expenses Incurred, Technology Hosting, Consumer Products. It is also available for immediate download and adjustment. So, changes can be made in the color, design, graphics or any other component to create a unique layout.

3d Regular Implementation 7 Steps Flow Chart Template PowerPoint Slides
We present our 3d regular implementation 7 steps flow chart template PowerPoint Slides. Use our Business PowerPoint Templates because, The lessons have been analyzed, studied and conclusions drawn. Use our Arrows PowerPoint Templates because, Our Template designs are State of the Art. Use our Shapes PowerPoint Templates because; Highlight the key components of your entire manufacturing/ business process. Use our Abstract PowerPoint Templates because, Demonstrate to your audience how the best and most refined ideas pass through. Use our Process and Flows PowerPoint Templates because, to go for Gold and not just silver. Use these PowerPoint slides for presentations relating to analysis, art, blank, blue, business, categories, chart, chief, circle, clip, clipart, corporate, design, diagram, directors, element, executive, financial, graph, icon, illustration, implementation, isolated, managers, media, network, relations, role, sales, segments, set. The prominent colors used in the PowerPoint template are Blue, Gray, and Black
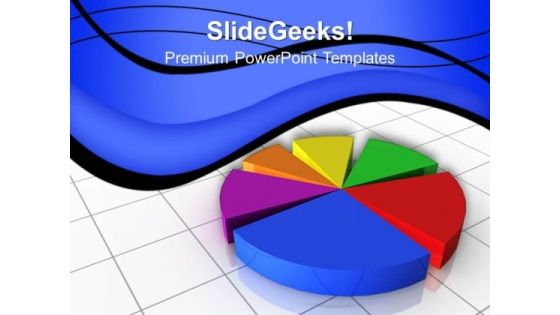
Pie Chart Marketing PowerPoint Templates And PowerPoint Themes 1012
Pie Chart Marketing PowerPoint Templates And PowerPoint Themes 1012-Use this Pie Chart Based PowerPoint Template to illustrate the main components required for the Growth of the Company. It shows seven major factors required. Now use this template to enlighten your team and colleagues on the critical factors involved. Use our PowerPoint templates to spread the good word, be assured by all you will be keenly heard.-Pie Chart Marketing PowerPoint Templates And PowerPoint Themes 1012-This PowerPoint template can be used for presentations relating to-Vector Pie Chart, Marketing, Business, Sales, Success, Competition
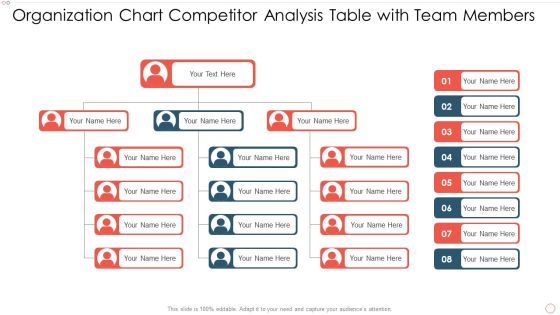
Organization Chart Competitor Analysis Table With Team Members Diagrams PDF
Pitch your topic with ease and precision using this organization chart competitor analysis table with team members diagrams pdf. This layout presents information on organization chart competitor analysis table with team members. It is also available for immediate download and adjustment. So, changes can be made in the color, design, graphics or any other component to create a unique layout.

Spaghetti Chart For Assessing And Analyzing Problem Designs PDF
Pitch your topic with ease and precision using this spaghetti chart for assessing and analyzing problem designs pdf. This layout presents information on spaghetti chart for assessing and analyzing problem. It is also available for immediate download and adjustment. So, changes can be made in the color, design, graphics or any other component to create a unique layout.

Pie Chart Showing Sales Split By Area Infographics PDF
Pitch your topic with ease and precision using this Pie Chart Showing Sales Split By Area Infographics PDF. This layout presents information on Pie Chart Showing, Sales Split Area. It is also available for immediate download and adjustment. So, changes can be made in the color, design, graphics or any other component to create a unique layout.

Quality Assurance Flow Chart In Production Process Guidelines PDF
Pitch your topic with ease and precision using this Quality Assurance Flow Chart In Production Process Guidelines PDF. This layout presents information on Quality Assurance, Flow Chart, Production Process. It is also available for immediate download and adjustment. So, changes can be made in the color, design, graphics or any other component to create a unique layout.
Sales Assessment Chart Vector Icon Ppt Powerpoint Presentation Summary Pdf
Pitch your topic with ease and precision using this sales assessment chart vector icon ppt powerpoint presentation summary pdf. This layout presents information on sales assessment chart vector icon. It is also available for immediate download and adjustment. So, changes can be made in the color, design, graphics or any other component to create a unique layout.
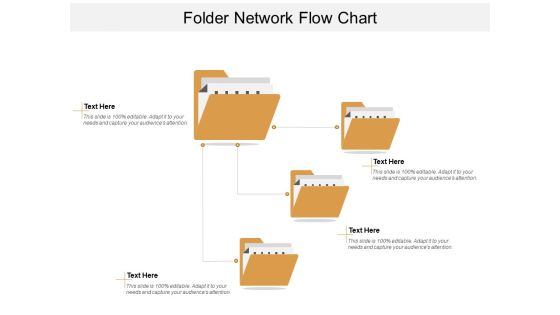
Folder Network Flow Chart Ppt PowerPoint Presentation Gallery Templates PDF
Pitch your topic with ease and precision using this folder network flow chart ppt powerpoint presentation gallery templates pdf. This layout presents information on folder network flow chart. It is also available for immediate download and adjustment. So, changes can be made in the color, design, graphics or any other component to create a unique layout.

NPS Chart With Passives And Promoters Ppt Pictures Slides PDF
Pitch your topic with ease and precision using this nps chart with passives and promoters ppt pictures slides pdf. This layout presents information on nps chart with passives and promoters It is also available for immediate download and adjustment. So, changes can be made in the color, design, graphics or any other component to create a unique layout.

Consumer Review Report With Rating Score Chart Ppt Slide PDF
Pitch your topic with ease and precision using this consumer review report with rating score chart ppt slide pdf. This layout presents information on consumer review report with rating score chart. It is also available for immediate download and adjustment. So, changes can be made in the color, design, graphics or any other component to create a unique layout.

Requirements Traceability Chart With Business Rules Ppt Show Pictures PDF
Pitch your topic with ease and precision using this requirements traceability chart with business rules ppt show pictures pdf. This layout presents information on requirements traceability chart with business rules. It is also available for immediate download and adjustment. So, changes can be made in the color, design, graphics or any other component to create a unique layout.

Construction Project Administrative Procedure Using Gantt Chart Professional PDF
Pitch your topic with ease and precision using this construction project administrative procedure using gantt chart professional pdf. This layout presents information on construction project administrative procedure using gantt chart. It is also available for immediate download and adjustment. So, changes can be made in the color, design, graphics or any other component to create a unique layout.

Biyearly Gantt Chart For Task Management Formats PDF
Pitch your topic with ease and precision using this Biyearly Gantt Chart For Task Management Formats PDF. This layout presents information on Biyearly Gantt Chart, Task Management. It is also available for immediate download and adjustment. So, changes can be made in the color, design, graphics or any other component to create a unique layout.
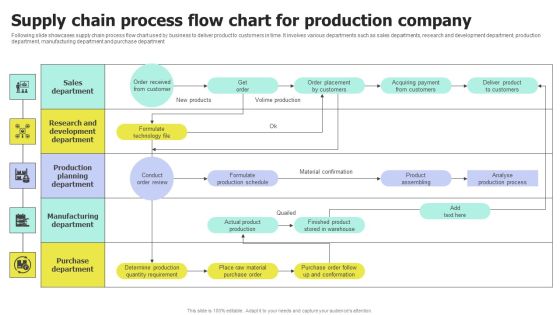
Supply Chain Process Flow Chart For Production Company Sample PDF
Pitch your topic with ease and precision using this Supply Chain Process Flow Chart For Production Company Sample PDF. This layout presents information on Chain Process, Flow Chart, Production Company. It is also available for immediate download and adjustment. So, changes can be made in the color, design, graphics or any other component to create a unique layout.

5 Reinforcing Components Arrow Diagram Chart Business Prototyping PowerPoint Slides
We present our 5 reinforcing components arrow diagram chart business prototyping PowerPoint Slides.Use our Arrows PowerPoint Templates because it shows the pyramid which is a symbol of the desire to reach the top in a steady manner. Present our Business PowerPoint Templates because watch the excitement levels rise as they realise their worth. Download and present our Competition PowerPoint Templates because you know your business and have a vision for it. Use our Design PowerPoint Templates because your business and plans for its growth consist of processes that are highly co-related. Download and present our Shapes PowerPoint Templates because the atmosphere in the worplace is electric.Use these PowerPoint slides for presentations relating to arrow, arrows, block, business, chart, design, development, diagram, direction, element, flow, flowchart, graph, linear, management, organization, process, program, section, sign, solution, symbol. The prominent colors used in the PowerPoint template are Blue, Gray, Black. Professionals tell us our 5 reinforcing components arrow diagram chart business prototyping PowerPoint Slides are Efficacious. The feedback we get is that our block PowerPoint templates and PPT Slides are Appealing. We assure you our 5 reinforcing components arrow diagram chart business prototyping PowerPoint Slides are designed by professionals Customers tell us our chart PowerPoint templates and PPT Slides are Fantastic. Presenters tell us our 5 reinforcing components arrow diagram chart business prototyping PowerPoint Slides are Fun. People tell us our block PowerPoint templates and PPT Slides are Nice.
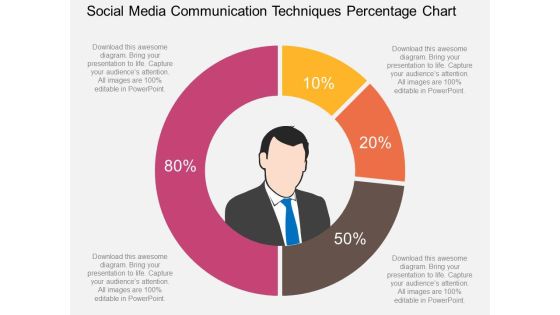
Social Media Communication Techniques Percentage Chart Powerpoint Template
This business slide displays percentage chart of social media communication techniques. Download this diagram to display information in visual manner. Visual effect of this diagram helps in maintaining the flow of the discussion and provides more clarity to the subject.

Product Price Catalogue Chart With Rate Allocation Infographics PDF
This slide showcases list chart that can help consumer to make comparative assessment about price of product for purchasing different amount of units. Its key components are product, rate allocated at 1 unit, 2 unit and more than 3 units purchase Pitch your topic with ease and precision using this product price catalogue chart with rate allocation infographics pdf. This layout presents information on product price catalogue chart with rate allocation. It is also available for immediate download and adjustment. So, changes can be made in the color, design, graphics or any other component to create a unique layout.

IT Software Web Development Gantt Chart Topics PDF
This slide presents a Gantt chart highlighting various phases of website design plan to help project managers deliver the project on time. It includes phases such as project definition, content, design, development and review. Pitch your topic with ease and precision using this IT Software Web Development Gantt Chart Topics PDF. This layout presents information on Chart, Software, Development. It is also available for immediate download and adjustment. So, changes can be made in the color, design, graphics or any other component to create a unique layout.
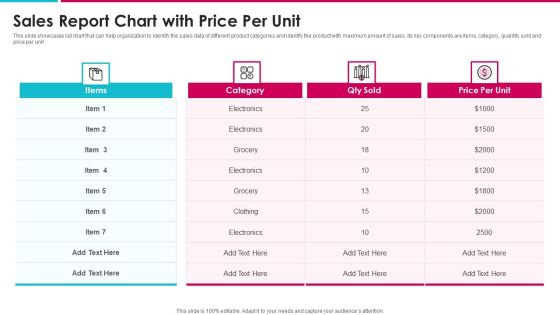
Sales Report Chart With Price Per Unit Information PDF
This slide showcases list chart that can help organization to identify the sales data of different product categories and identify the product with maximum amount of sales. Its key components are items, category, quantity sold and price per unit Showcasing this set of slides titled sales report chart with price per unit information pdf. The topics addressed in these templates are sales report chart with price per unit. All the content presented in this PPT design is completely editable. Download it and make adjustments in color, background, font etc. as per your unique business setting.
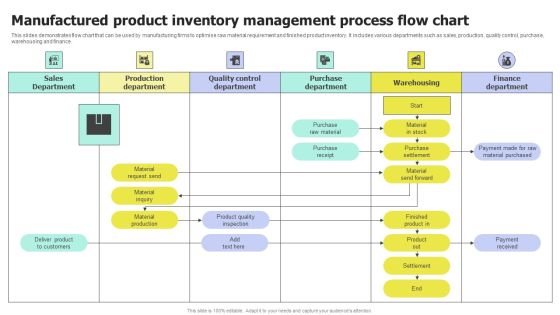
Manufactured Product Inventory Management Process Flow Chart Microsoft PDF
This slide demonstrates flow chart that can be used by manufacturing firms to optimise raw material requirement and finished product inventory. It includes various departments such as sales, production, quality control, purchase, warehousing and finance. Pitch your topic with ease and precision using this Manufactured Product Inventory Management Process Flow Chart Microsoft PDF. This layout presents information on Manufactured Product, Inventory Management, Process Flow Chart. It is also available for immediate download and adjustment. So, changes can be made in the color, design, graphics or any other component to create a unique layout.
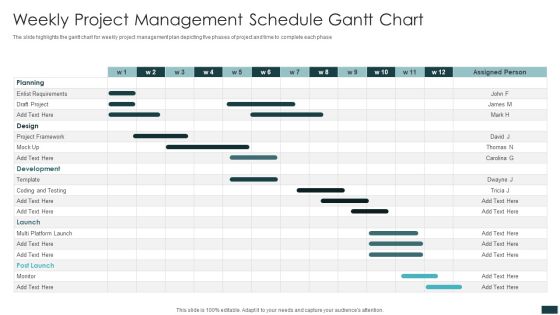
Weekly Project Management Schedule Gantt Chart Information PDF
The slide highlights the gantt chart for weekly project management plan depicting five phases of project and time to complete each phase. Pitch your topic with ease and precision using this Weekly Project Management Schedule Gantt Chart Information PDF. This layout presents information on Project Framework, Design, Planning. It is also available for immediate download and adjustment. So, changes can be made in the color, design, graphics or any other component to create a unique layout.

Various Long Term Incentive Programs Plan Chart Pictures PDF
This slide represents various long term incentive policy plan chart such as deferred annual bonus, three year performance linked restricted stock and five year saving plan. Pitch your topic with ease and precision using this Various Long Term Incentive Programs Plan Chart Pictures PDF. This layout presents information on Plan Funding, Restricted Stock, Stock Bonus. It is also available for immediate download and adjustment. So, changes can be made in the color, design, graphics or any other component to create a unique layout.

Business Information Application Protection Testing Flow Chart Themes PDF
This slide covers business application security testing flow chart which includes secure application model, security standard recognition and privacy testing.Pitch your topic with ease and precision using this Business Information Application Protection Testing Flow Chart Themes PDF. This layout presents information on Security Consistency, Target Weighting, Target Recognition. It is also available for immediate download and adjustment. So, changes can be made in the color, design, graphics or any other component to create a unique layout.

Monetary Strategy Implementation Process Flow Chart Brochure PDF
This slide shows the monetary strategy implementation flow chart. It includes external and internal monetary environment analysis, monetary goals development, monetary strategy development, dividend policy, etc. Pitch your topic with ease and precision using this Monetary Strategy Implementation Process Flow Chart Brochure PDF. This layout presents information on Dividend Policy, Investment Policy, Asset Management. It is also available for immediate download and adjustment. So, changes can be made in the color, design, graphics or any other component to create a unique layout.

Corporate Vulnerability Analysis Process Flow Chart Summary PDF
This slide showcases the enterprise vulnerability management process flow chart. It also includes stages such as information gathering, questionnaire, vendor response, risk management, remediation and validation. Pitch your topic with ease and precision using this Corporate Vulnerability Analysis Process Flow Chart Summary PDF. This layout presents information on Vender Response, Risk Assessment, Information Gathering. It is also available for immediate download and adjustment. So, changes can be made in the color, design, graphics or any other component to create a unique layout.

Sustainable Resource Recovery Blueprint Process Through Flow Chart Inspiration PDF
This template shows the flow chart of the recycling process. The includes the stages such as product evaluation, monitor, ecological assessment, etc. Pitch your topic with ease and precision using this Sustainable Resource Recovery Blueprint Process Through Flow Chart Inspiration PDF. This layout presents information on Procurement, Manufacturing, Suppliers. It is also available for immediate download and adjustment. So, changes can be made in the color, design, graphics or any other component to create a unique layout.
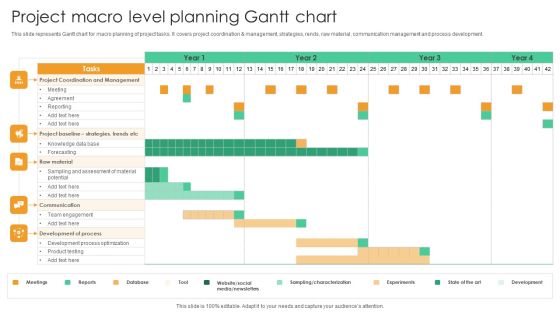
Project Macro Level Planning Gantt Chart Guidelines PDF
This slide represents Gantt chart for macro planning of project tasks. It covers project coordination and management, strategies, rends, raw material, communication management and process development. Pitch your topic with ease and precision using this Project Macro Level Planning Gantt Chart Guidelines PDF. This layout presents information on Project Coordination Management, Raw Material. It is also available for immediate download and adjustment. So, changes can be made in the color, design, graphics or any other component to create a unique layout.

Quarterly Resource Management Allocation Plan Chart Ppt Summary Visuals PDF
This slide illustrates task and resource allocation chart of a corporation. It includes department namely administration, accounts, IT, etc. Pitch your topic with ease and precision using this Quarterly Resource Management Allocation Plan Chart Ppt Summary Visuals PDF. This layout presents information on Quarter, Year, Accounts. It is also available for immediate download and adjustment. So, changes can be made in the color, design, graphics or any other component to create a unique layout.
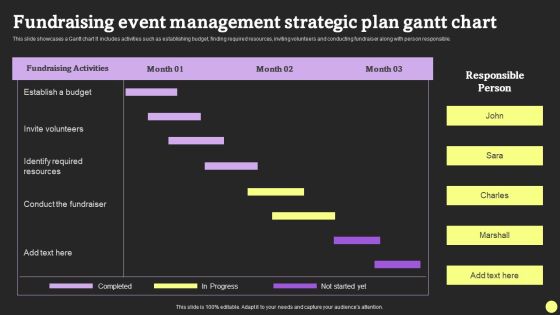
Fundraising Event Management Strategic Plan Gantt Chart Formats PDF
This slide showcases a Gantt chart It includes activities such as establishing budget, finding required resources, inviting volunteers and conducting fundraiser along with person responsible. Pitch your topic with ease and precision using this Fundraising Event Management Strategic Plan Gantt Chart Formats PDF. This layout presents information on Fundraising Activities, Invite Volunteers, Conduct The Fundraiser. It is also available for immediate download and adjustment. So, changes can be made in the color, design, graphics or any other component to create a unique layout.

RACI Chart Showing Service Request Fulfillment Management Introduction PDF
This slide represents RACI chart for service request fulfillment process illustrating process flow such as new service request, reviewing and updating request, user authentication etc.Pitch your topic with ease and precision using this RACI Chart Showing Service Request Fulfillment Management Introduction PDF This layout presents information on Incident Management, Request Fulfilment, Problem Management It is also available for immediate download and adjustment. So, changes can be made in the color, design, graphics or any other component to create a unique layout.

Project Budgeting And Cost Summary Report Chart Demonstration PDF
This slide represents project budgeting and cost summary chart illustrating project designing, project development, project delivery and project management. Pitch your topic with ease and precision using this Project Budgeting And Cost Summary Report Chart Demonstration PDF. This layout presents information on Project Management, Project Delivery, Project Development. It is also available for immediate download and adjustment. So, changes can be made in the color, design, graphics or any other component to create a unique layout.

RACI Chart For Launching Advertising Campaign Ideas PDF
The purpose of this template is to provide RACI chart for launching marketing campaigns . It covers information about responsible, accountable, consulted and informed team members. Pitch your topic with ease and precision using this RACI Chart For Launching Advertising Campaign Ideas PDF. This layout presents information on Project Management, Webpage Design, Tracking And Reporting. It is also available for immediate download and adjustment. So, changes can be made in the color, design, graphics or any other component to create a unique layout.
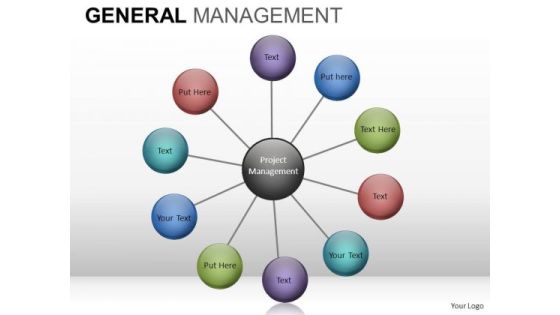
Wheel Chart Diagram PowerPoint Slides And Editable Ppt Templates Download
Wheel_Chart_Diagram_PowerPoint_slides_and_Editable_PPT_templates_Download-These high quality powerpoint pre-designed slides and powerpoint templates have been carefully created by our professional team to help you impress your audience. All slides have been created and are 100% editable in powerpoint. Each and every property of any graphic - color, size, orientation, shading, outline etc. can be modified to help you build an effective powerpoint presentation. Any text can be entered at any point in the powerpoint template or slide. Simply DOWNLOAD, TYPE and PRESENT! These PowerPoint presentation slides can be used to represent themes relating to --Abstract, action, analysis, blank, business, chart, clipart, commerce, concept, conceptual, design, diagram, direction, flow, generic, goals, guide, guidelines, heirarchy, icon, idea, illustration, lingakes, links, manage, management, mba, model, organization, performance, plan, process, project, relationship, representation, resource, steps, strategy, success, tactics, theoretical, theory, tool, workflow-Wheel_Chart_Diagram_PowerPoint_slides_and_Editable_PPT_templates_Download

3 Components Required In Process Simple Flow Chart PowerPoint Slides
We present our 3 components required in process simple flow chart PowerPoint Slides.Use our Arrows PowerPoint Templates because,Very often it is important to reflect on the basics. Use our Shapes PowerPoint Templates because,It transmits this clarity of purpose onto the eager minds of your team. Use our Leadership PowerPoint Templates because,Forward thinking is the way to go. Use our Business PowerPoint Templates because,You have selected your team man for man Use our Process and Flows PowerPoint Templates because, It focuses the light on the path to sure shot success.Use these PowerPoint slides for presentations relating to advice, analysis, analyze, background, business, businessman, collaboration, component, concept, constrain, corporate, education, hand, human, limit, management, manager, meeting, method, plan, presentation, principle, project, requirement, resources, scheme, strategy, . The prominent colors used in the PowerPoint template are Green, Green dark , Red. People tell us our 3 components required in process simple flow chart PowerPoint Slides are No-nonsense. The feedback we get is that our businessman PowerPoint templates and PPT Slides are Wonderful. People tell us our 3 components required in process simple flow chart PowerPoint Slides are Great. Presenters tell us our concept PowerPoint templates and PPT Slides will make the presenter look like a pro even if they are not computer savvy. The feedback we get is that our 3 components required in process simple flow chart PowerPoint Slides are Energetic. Professionals tell us our collaboration PowerPoint templates and PPT Slides are Striking.

5 Reinforcing Components Arrow Diagram Typical Flow Chart PowerPoint Templates
We present our 5 reinforcing components arrow diagram typical flow chart PowerPoint templates.Download our Arrows PowerPoint Templates because they highlight the depth of your thought process. Download our Business PowerPoint Templates because you have had your share of being a goldfish in a small bowl.you are ready to launch out and spread your wings. Use our Competition PowerPoint Templates because this is an appropriate layout to convince your team that they have the ability to score a tEN every time. Download and present our Design PowerPoint Templates because it is all there in bits and pieces. Download our Shapes PowerPoint Templates because it Shines the light on your thoughts and motivates your team to improve the quality of celebration for all around you.Use these PowerPoint slides for presentations relating to arrow, arrows, block, business, chart, design, development, diagram, direction, element, flow, flowchart, graph, linear, management, organization, process, program, section, sign, solution, symbol. The prominent colors used in the PowerPoint template are Green, Gray, Black. Professionals tell us our 5 reinforcing components arrow diagram typical flow chart PowerPoint templates are Bright. The feedback we get is that our direction PowerPoint templates and PPT Slides are the best it can get when it comes to presenting. We assure you our 5 reinforcing components arrow diagram typical flow chart PowerPoint templates are Spectacular. Customers tell us our business PowerPoint templates and PPT Slides are Glamorous. Presenters tell us our 5 reinforcing components arrow diagram typical flow chart PowerPoint templates are Nostalgic. People tell us our block PowerPoint templates and PPT Slides are Second to none.

Sales Techniques Playbook Different Products Price Comparison Chart Demonstration PDF
This slide provides information regarding product price comparison chart that captures information about price per unit, change over list price, reason for proposed price, volumes sold, forecasted growth. This is a sales techniques playbook different products price comparison chart demonstration pdf template with various stages. Focus and dispense information on two stages using this creative set, that comes with editable features. It contains large content boxes to add your information on topics like product, consumer, price, growth. You can also showcase facts, figures, and other relevant content using this PPT layout. Grab it now.

Sales Techniques Playbook Different Products Price Comparison Chart Graphics PDF
This slide provides information regarding product price comparison chart that captures information about price per unit, change over list price, reason for proposed price, volumes sold, forecasted growth. This is a sales techniques playbook different products price comparison chart graphics pdf template with various stages. Focus and dispense information on one stage using this creative set, that comes with editable features. It contains large content boxes to add your information on topics like ensuring effective communication among sales management team You can also showcase facts, figures, and other relevant content using this PPT layout. Grab it now.
 Home
Home