Organizational Chart
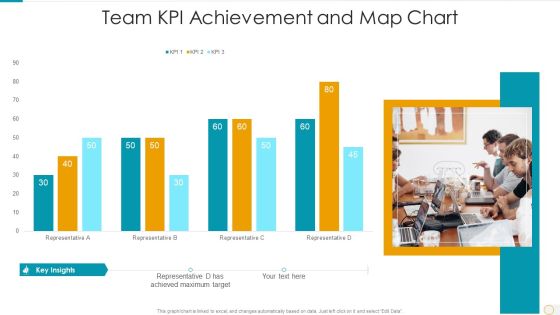
Team Kpi Achievement And Map Chart Portrait PDF
Pitch your topic with ease and precision using this team kpi achievement and map chart portrait pdf. This layout presents information on team kpi achievement and map chart. It is also available for immediate download and adjustment. So, changes can be made in the color, design, graphics or any other component to create a unique layout.

Use Pareto Chart Graph Software For Quality Administration Structure PDF
Pitch your topic with ease and precision using this use pareto chart graph software for quality administration structure pdf. This layout presents information on use pareto chart graph software for quality administration. It is also available for immediate download and adjustment. So, changes can be made in the color, design, graphics or any other component to create a unique layout.

Several Project Work Status With Pie Chart Microsoft PDF
Pitch your topic with ease and precision using this several project work status with pie chart microsoft pdf . This layout presents information on several project work status with pie chart . It is also available for immediate download and adjustment. So, changes can be made in the color, design, graphics or any other component to create a unique layout.
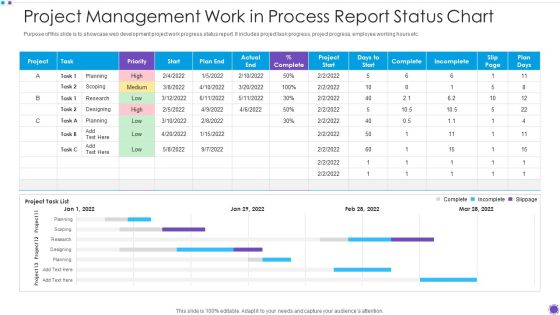
Project Management Work In Process Report Status Chart Microsoft PDF
Pitch your topic with ease and precision using this project management work in process report status chart microsoft pdf. This layout presents information on project management work in process report status chart. It is also available for immediate download and adjustment. So, changes can be made in the color, design, graphics or any other component to create a unique layout.

Work In Process Report Chart For Logistics Management Slides PDF
Pitch your topic with ease and precision using this work in process report chart for logistics management slides pdf. This layout presents information on work in process report chart for logistics management. It is also available for immediate download and adjustment. So, changes can be made in the color, design, graphics or any other component to create a unique layout.

Biyearly Gantt Chart For Multiple Task Project Structure PDF
Pitch your topic with ease and precision using this Biyearly Gantt Chart For Multiple Task Project Structure PDF. This layout presents information on Biyearly Gantt Chart, Multiple Task Project. It is also available for immediate download and adjustment. So, changes can be made in the color, design, graphics or any other component to create a unique layout.
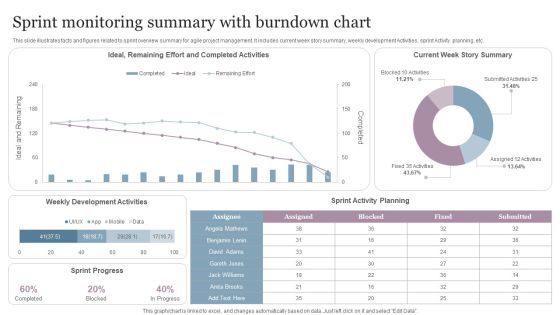
Sprint Monitoring Summary With Burndown Chart Portrait PDF
Pitch your topic with ease and precision using this Sprint Monitoring Summary With Burndown Chart Portrait PDF. This layout presents information on Sprint Monitoring Summary, Burndown Chart . It is also available for immediate download and adjustment. So, changes can be made in the color, design, graphics or any other component to create a unique layout.
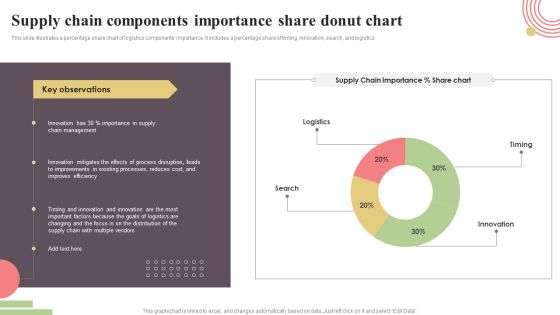
Supply Chain Components Importance Share Donut Chart Rules PDF
This slide illustrates a percentage share chart of logistics components importance. It includes a percentage share of timing, innovation, search, and logistics. Showcasing this set of slides titled Supply Chain Components Importance Share Donut Chart Rules PDF. The topics addressed in these templates are Timing, Innovation, Search, Logistics. All the content presented in this PPT design is completely editable. Download it and make adjustments in color, background, font etc. as per your unique business setting.

PowerPoint Template Global Business Process Chart Ppt Template
PowerPoint Template Global Business Process Chart PPT Template-Highlight the key components of your entire manufacturing/ business process. Illustrate how each element flows seamlessly onto the next stage. Emphasise on any critical or key factors within them. Demonstrate how they all combine to form the final product.-PowerPoint Template Global Business Process Chart PPT Template
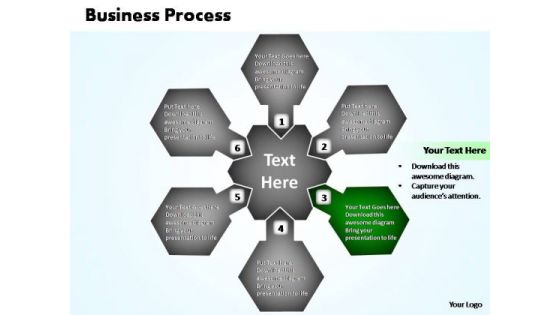
PowerPoint Design Slides Growth Business Process Chart Ppt Theme
PowerPoint Design Slides Growth Business Process Chart PPT Theme-Highlight the key components of your entire manufacturing/ business process. Illustrate how each element flows seamlessly onto the next stage. Emphasise on any critical or key factors within them. Demonstrate how they all combine to form the final product.-PowerPoint Design Slides Growth Business Process Chart PPT Theme
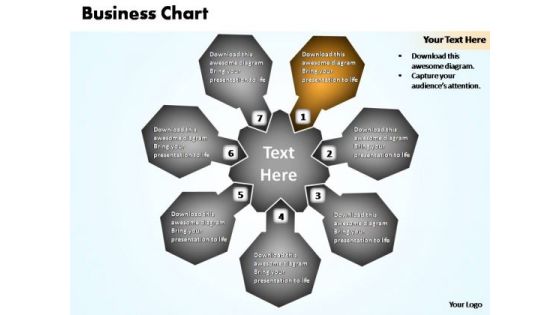
PowerPoint Design Slides Image Business Process Chart Ppt Themes
PowerPoint Design Slides Image Business Process Chart PPT Themes-Highlight the key components of your entire manufacturing/ business process. Illustrate how each element flows seamlessly onto the next stage. Emphasise on any critical or key factors within them. Demonstrate how they all combine to form the final product.-PowerPoint Design Slides Image Business Process Chart PPT Themes
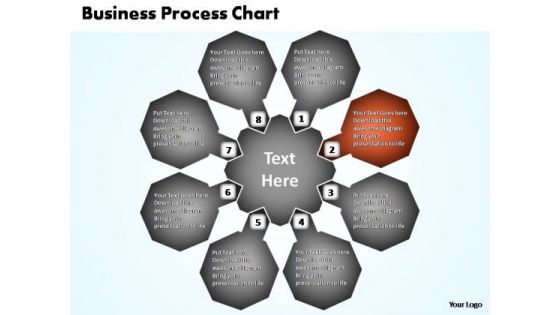
PowerPoint Process Diagram Business Process Chart Ppt Backgrounds
PowerPoint Process Diagram Business Process Chart PPT Backgrounds-Highlight the key components of your entire manufacturing/ business process. Illustrate how each element flows seamlessly onto the next stage. Emphasise on any critical or key factors within them. Demonstrate how they all combine to form the final product.-PowerPoint Process Diagram Business Process Chart PPT Backgrounds
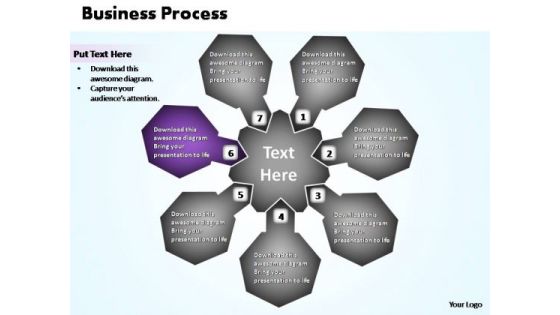
PowerPoint Backgrounds Leadership Business Process Chart Ppt Presentation
PowerPoint Backgrounds Leadership Business Process Chart PPT Presentation-Highlight the key components of your entire manufacturing/ business process. Illustrate how each element flows seamlessly onto the next stage. Emphasise on any critical or key factors within them. Demonstrate how they all combine to form the final product.-PowerPoint Backgrounds Leadership Business Process Chart PPT Presentation
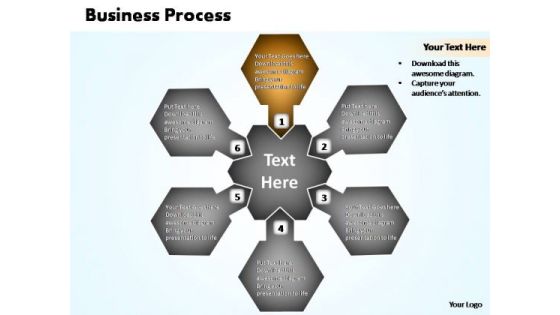
PowerPoint Backgrounds Sales Business Process Chart Ppt Slide Designs
PowerPoint Backgrounds Sales Business Process Chart PPT Slide Designs-Highlight the key components of your entire manufacturing/ business process. Illustrate how each element flows seamlessly onto the next stage. Emphasise on any critical or key factors within them. Demonstrate how they all combine to form the final product.-PowerPoint Backgrounds Sales Business Process Chart PPT Slide Designs

PowerPoint Design Download Business Process Chart Ppt Designs
PowerPoint Design Download Business Process Chart PPT Designs-Highlight the key components of your entire manufacturing/ business process. Illustrate how each element flows seamlessly onto the next stage. Emphasise on any critical or key factors within them. Demonstrate how they all combine to form the final product.-PowerPoint Design Download Business Process Chart PPT Designs

PowerPoint Design Graphic Business Process Chart Ppt Designs
PowerPoint Design Graphic Business Process Chart PPT Designs-Highlight the key components of your entire manufacturing/ business process. Illustrate how each element flows seamlessly onto the next stage. Emphasise on any critical or key factors within them. Demonstrate how they all combine to form the final product.-PowerPoint Design Graphic Business Process Chart PPT Designs
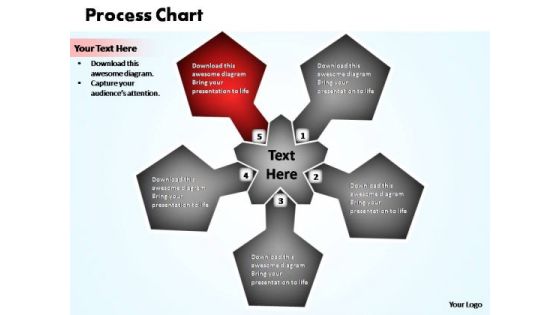
PowerPoint Presentation Leadership Business Process Chart Ppt Designs
PowerPoint Presentation Leadership Business Process Chart PPT Designs-Highlight the key components of your entire manufacturing/ business process. Illustrate how each element flows seamlessly onto the next stage. Emphasise on any critical or key factors within them. Demonstrate how they all combine to form the final product.-PowerPoint Presentation Leadership Business Process Chart PPT Designs

PowerPoint Presentation Success Business Process Chart Ppt Backgrounds
PowerPoint Presentation Success Business Process Chart PPT Backgrounds-Highlight the key components of your entire manufacturing/ business process. Illustrate how each element flows seamlessly onto the next stage. Emphasise on any critical or key factors within them. Demonstrate how they all combine to form the final product.-PowerPoint Presentation Success Business Process Chart PPT Backgrounds
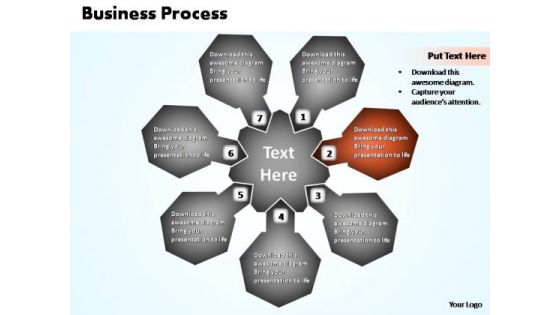
PowerPoint Process Global Business Process Chart Ppt Presentation
PowerPoint Process Global Business Process Chart PPT Presentation-Highlight the key components of your entire manufacturing/ business process. Illustrate how each element flows seamlessly onto the next stage. Emphasise on any critical or key factors within them. Demonstrate how they all combine to form the final product.-PowerPoint Process Global Business Process Chart PPT Presentation
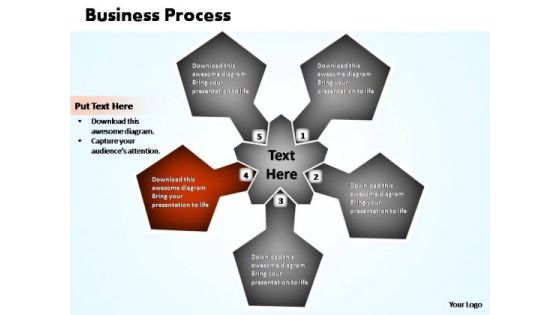
PowerPoint Slide Designs Graphic Business Process Chart Ppt Slide
PowerPoint Slide Designs Graphic Business Process Chart PPT Slide-Highlight the key components of your entire manufacturing/ business process. Illustrate how each element flows seamlessly onto the next stage. Emphasise on any critical or key factors within them. Demonstrate how they all combine to form the final product.-PowerPoint Slide Designs Graphic Business Process Chart PPT Slide

Process Diagram Chart With 4 Spherical Stages PowerPoint Templates
Process Diagram Chart with 4 Spherical Stages PowerPoint templates-These high quality powerpoint pre-designed slides and powerpoint templates have been carefully created by our professional team to help you impress your audience. All slides have been created and are 100% editable in powerpoint. Each and every property of any graphic - color, size, orientation, shading, outline etc. can be modified to help you build an effective powerpoint presentation. Any text can be entered at any point in the powerpoint template or slide. Simply DOWNLOAD, TYPE and PRESENT!-These PowerPoint presentation slides can be used to represent concepts relating to--Abstract, action, analysis, blank, business, chart, clipart, commerce, concept, conceptual, design, diagram, direction, flow, generic, goals, guide, guidelines, heirarchy, icon, idea, illustration, lingakes, links, manage, management, mba, model, organization, performance, plan, process, project, relationship, representation, resource, steps, strategy, success, tactics, theoretical, theory, tool, workflow-Process Diagram Chart with 4 Spherical Stages PowerPoint templates
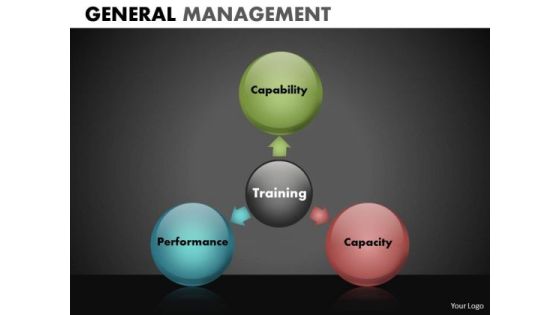
Triangular Process Chart PowerPoint Templates PowerPoint 3 Stages Process Diagram
Triangular Process Chart PowerPoint templates PowerPoint 3 Stages Process Diagram-These high quality powerpoint pre-designed slides and powerpoint templates have been carefully created by our professional team to help you impress your audience. All slides have been created and are 100% editable in powerpoint. Each and every property of any graphic - color, size, orientation, shading, outline etc. can be modified to help you build an effective powerpoint presentation. Any text can be entered at any point in the powerpoint template or slide. Simply DOWNLOAD, TYPE and PRESENT!-These PowerPoint presentation slides can be used to represent concepts relating to--Abstract, action, analysis, blank, business, chart, clipart, commerce, concept, conceptual, design, diagram, direction, flow, generic, goals, guide, guidelines, heirarchy, icon, idea, illustration, lingakes, links, manage, management, mba, model, organization, performance, plan, process, project, relationship, representation, resource, steps, strategy, success, tactics, theoretical, theory, tool, workflow-Triangular Process Chart PowerPoint templates PowerPoint 3 Stages Process Diagram

Internet Security Threat Analysis Report Chart Introduction PDF
Following slide exhibits security and data breach report chart it includes major statistics such as- loss or theft of data, failure to redirect data and data posting to incorrect recipient. Pitch your topic with ease and precision using this internet security threat analysis report chart introduction pdf. This layout presents information on internet security threat analysis report chart. It is also available for immediate download and adjustment. So, changes can be made in the color, design, graphics or any other component to create a unique layout.
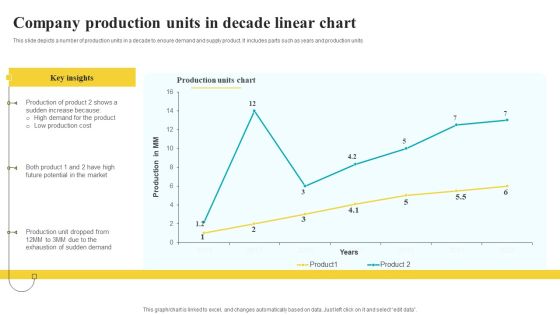
Company Production Units In Decade Linear Chart Designs PDF
This slide depicts a number of production units in a decade to ensure demand and supply product. It includes parts such as years and production units Pitch your topic with ease and precision using this Company Production Units In Decade Linear Chart Designs PDF. This layout presents information on Key Insights, Production Units Chart, Linear Chart. It is also available for immediate download and adjustment. So, changes can be made in the color, design, graphics or any other component to create a unique layout.

Usa And India Population Comparison Stacked Linear Chart Guidelines PDF
This slide depicts the population comparison chart of USA and India to forecast future population of the respective countries. It includes years and population in MM Pitch your topic with ease and precision using this Usa And India Population Comparison Stacked Linear Chart Guidelines PDF. This layout presents information on Key Insights, Population Growth, Comparison Chart. It is also available for immediate download and adjustment. So, changes can be made in the color, design, graphics or any other component to create a unique layout.
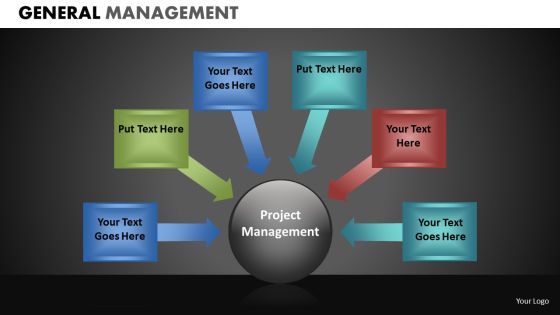
Ppt Slides With 5 Stages Semicircle Chart PowerPoint Templates
PPT Slides with 5 Stages SemiCircle Chart PowerPoint templates-These high quality powerpoint pre-designed slides and powerpoint templates have been carefully created by our professional team to help you impress your audience. All slides have been created and are 100% editable in powerpoint. Each and every property of any graphic - color, size, orientation, shading, outline etc. can be modified to help you build an effective powerpoint presentation. Any text can be entered at any point in the powerpoint template or slide. Simply DOWNLOAD, TYPE and PRESENT!-These PowerPoint presentation slides can be used to represent concepts relating to--Abstract, action, analysis, blank, business, chart, clipart, commerce, concept, conceptual, design, diagram, direction, flow, generic, goals, guide, guidelines, heirarchy, icon, idea, illustration, lingakes, links, manage, management, mba, model, organization, performance, plan, process, project, relationship, representation, resource, steps, strategy, success, tactics, theoretical, theory, tool, workflow-PPT Slides with 5 Stages SemiCircle Chart PowerPoint templates

Sequential Process Flow Steps Basic Chart PowerPoint Templates
We present our sequential process flow steps basic chart PowerPoint templates.Present our Arrows PowerPoint Templates because it Educates your team with your thoughts and logic. Download our Spheres PowerPoint Templates because you can Set out the goals and your plan of action for teamwork. Use our Process and Flows PowerPoint Templates because you can Highlight the key components of your entire manufacturing/ business process. Use our Marketing PowerPoint Templates because the foundation stones of many a life. Use our Circle Charts PowerPoint Templates because they highlight the depth of your thought process.Use these PowerPoint slides for presentations relating to Arrow, Business, Chain, Chart, Circle, Circle Frame, Color, Concept, Connect, Connection, Connectivity, Corporate, Data, Design, Diagram, Financial, Flow, Flowchart, Graph, Graphical, Group, Important, Organization, Organize, Plan, Process, Rectangle, Relation, Set, Steps, Structure, Teamwork. The prominent colors used in the PowerPoint template are Yellow, Green, Blue. Customers tell us our sequential process flow steps basic chart PowerPoint templates are Functional. The feedback we get is that our Chart PowerPoint templates and PPT Slides are Energetic. Professionals tell us our sequential process flow steps basic chart PowerPoint templates are Upbeat. People tell us our Color PowerPoint templates and PPT Slides will make the presenter look like a pro even if they are not computer savvy. Customers tell us our sequential process flow steps basic chart PowerPoint templates will help you be quick off the draw. Just enter your specific text and see your points hit home. Professionals tell us our Chain PowerPoint templates and PPT Slides are Functional.

Regional Sales Percentage Column Chart With Key Insights Diagrams PDF
This slide illustrates sales percentage chart in regions of USA to calculate and interpret present fuel consumption. It includes parts such as regions and sales percentage.Pitch your topic with ease and precision using this Regional Sales Percentage Column Chart With Key Insights Diagrams PDF. This layout presents information on Industries Central, Sales Central, Productions Companies. It is also available for immediate download and adjustment. So, changes can be made in the color, design, graphics or any other component to create a unique layout.

Chart Illustrating Manufacturing Plant Energy Consumption Statistics Slides PDF
This graph or chart is linked to excel, and changes automatically based on data. Just left click on it and select edit data. Pitch your topic with ease and precision using this Chart Illustrating Manufacturing Plant Energy Consumption Statistics Slides PDF. This layout presents information on Equipment Inefficiency, Process Heating, Energy Export. It is also available for immediate download and adjustment. So, changes can be made in the color, design, graphics or any other component to create a unique layout.
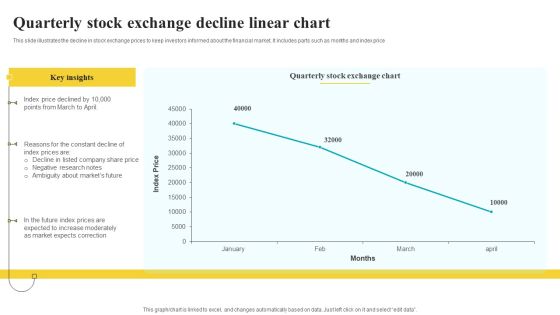
Quarterly Stock Exchange Decline Linear Chart Inspiration PDF
This slide illustrates the decline in stock exchange prices to keep investors informed about the financial market. It includes parts such as months and index price Pitch your topic with ease and precision using this Quarterly Stock Exchange Decline Linear Chart Inspiration PDF. This layout presents information on Key Insights, Exchange Chart, Correction. It is also available for immediate download and adjustment. So, changes can be made in the color, design, graphics or any other component to create a unique layout.
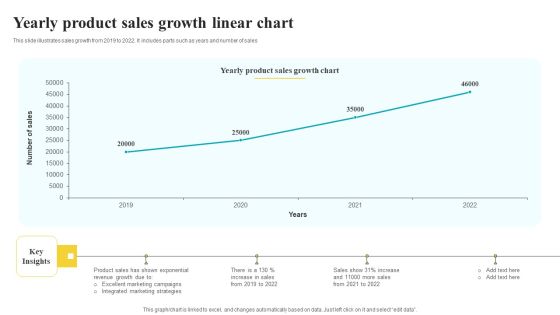
Yearly Product Sales Growth Linear Chart Pictures PDF
This slide illustrates sales growth from 2019 to 2022. It includes parts such as years and number of sales Pitch your topic with ease and precision using this Yearly Product Sales Growth Linear Chart Pictures PDF. This layout presents information on Sales Growth Chart, Key Insights, Strategies. It is also available for immediate download and adjustment. So, changes can be made in the color, design, graphics or any other component to create a unique layout.
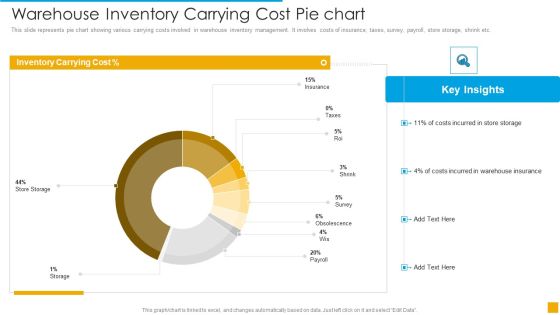
Warehouse Inventory Carrying Cost Pie Chart Demonstration PDF
This slide represents pie chart showing various carrying costs involved in warehouse inventory management. It involves costs of insurance, taxes, survey, payroll, store storage, shrink etc.Pitch your topic with ease and precision using this Warehouse Inventory Carrying Cost Pie Chart Demonstration PDF. This layout presents information on Cost, Inventory, Storage. It is also available for immediate download and adjustment. So, changes can be made in the color, design, graphics or any other component to create a unique layout.
Technology Update Workflow Chart With Icons Ppt Summary Guidelines PDF
Persuade your audience using this technology update workflow chart with icons ppt summary guidelines pdf. This PPT design covers eleven stages, thus making it a great tool to use. It also caters to a variety of topics including software update, operating system, server, techniques, deployment. Download this PPT design now to present a convincing pitch that not only emphasizes the topic but also showcases your presentation skills.

Business Environment Components Bar Chart Ppt Professional Format Ideas PDF
Presenting this set of slides with name business environment components bar chart ppt professional format ideas pdf. The topics discussed in these slides are product 01, product 02. This is a completely editable PowerPoint presentation and is available for immediate download. Download now and impress your audience.
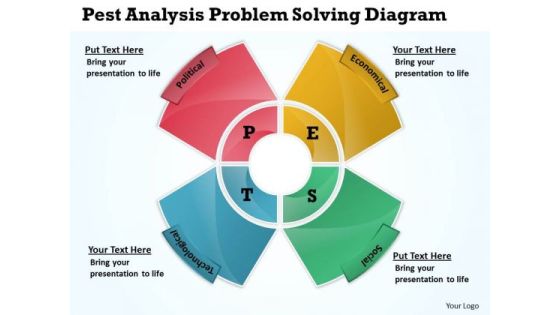
Pest Analysis Problem Solving Diagram Cycle Process Chart PowerPoint Templates
We present our pest analysis problem solving diagram Cycle Process Chart PowerPoint templates.Use our Marketing PowerPoint Templates because our Templates will enthuse your colleagues. Present our Business PowerPoint Templates because this template can project the path to sucess that you have charted. Present our Shapes PowerPoint Templates because you can spread the fruits of your efforts and elaborate your ideas on the prevention, diagnosis, control and cure of prevalent diseases. Download our Circle Charts PowerPoint Templates because you can Transmit your thoughts via our slides and proud your team to action. Present our Process and Flows PowerPoint Templates because you can Show them how you can save the day.Use these PowerPoint slides for presentations relating to Analysis, Analyze, Blackboard, Board, Business, Chalk, Chalkboard, Chart, Component, Concept, Diagram, Direction, Economic, Education, Environmental, Factors, Framework, Graph, Graphics, Illustration, Law, Leadership, Management, Market, Market, Research, Model, Operations, Pest, Political, Position, Potential. The prominent colors used in the PowerPoint template are Red, Yellow, Green. We assure you our pest analysis problem solving diagram Cycle Process Chart PowerPoint templates will get their audience's attention. Customers tell us our Chalk PowerPoint templates and PPT Slides are Graceful. The feedback we get is that our pest analysis problem solving diagram Cycle Process Chart PowerPoint templates are Multicolored. We assure you our Chart PowerPoint templates and PPT Slides are Bright. People tell us our pest analysis problem solving diagram Cycle Process Chart PowerPoint templates are Chic. We assure you our Component PowerPoint templates and PPT Slides are effectively colour coded to prioritise your plans They automatically highlight the sequence of events you desire.

Business Environment Components Column Chart Ppt Ideas Aids PDF
Presenting this set of slides with name business environment components column chart ppt ideas aids pdf. The topics discussed in these slides are product 01, product 02. This is a completely editable PowerPoint presentation and is available for immediate download. Download now and impress your audience.

Circular Boxes Process Innovation Diagram Chart Business Flowchart PowerPoint Slides
We present our circular boxes process innovation diagram chart business flowchart PowerPoint Slides.Download our Marketing PowerPoint Templates because customer satisfaction is a mantra of the marketplace. Building a loyal client base is an essential element of your business. Present our Busines PowerPoint Templates because this is an impressive template to unravel your recipe for a mouth watering result. Download and present our Circle Charts PowerPoint Templates because individual components well researched and understood in their place. Present our Arrows PowerPoint Templates because there is a vision, a need you can meet. Download and present our Spheres PowerPoint Templates because it is a step by step process with levels rising at every stage.Use these PowerPoint slides for presentations relating to Arrow, Business, Chain, Chart, Circle, Circle, Frame, Color, Concept, Connect, Connection, Connectivity, Corporate, Data, Design, Diagram, Financial, Flow, Flowchart, Graph, Graphical, Group, Important, Organization, Organize, Plan, Process, Rectangle, Relation, Set, Steps, Structure, Teamwork. The prominent colors used in the PowerPoint template are Orange, Gray, Black. Customers tell us our circular boxes process innovation diagram chart business flowchart PowerPoint Slides are Dynamic. You can be sure our Concept PowerPoint templates and PPT Slides are Bold. Presenters tell us our circular boxes process innovation diagram chart business flowchart PowerPoint Slides are Stylish. Professionals tell us our Frame PowerPoint templates and PPT Slides are designed to make your presentations professional. Presenters tell us our circular boxes process innovation diagram chart business flowchart PowerPoint Slides are Youthful. Professionals tell us our Circle PowerPoint templates and PPT Slides are Tasteful.

PowerPoint Templates Diverging Process Arrow Chart Ppt Target Network
We present our powerpoint templates diverging process arrow chart ppt Target Network.Download and present our Process and Flows PowerPoint Templates because individual components well researched and understood in their place. Download our Business PowerPoint Templates because like the famed William Tell, they put aside all emotions and concentrate on the target. Present our Shapes PowerPoint Templates because readymade PowerPoint templates can prove best of your knowledge for your slides to show. Download and present our Success PowerPoint Templates because iT outlines the entire thought process for the benefit of others. Tell it to the world with your characteristic aplomb. Download our Flow Charts PowerPoint Templates because they will Amplify your plans to have dedicated sub groups working on related but distinct tasks.Use these PowerPoint slides for presentations relating to Arrows, Business, Central, Centralized, Chart, Circle, Circular, Circulation, Concept, Conceptual, Illustration, Organization, Pointing, Process, Radial, Resource, Strategy, Template, Graphic, Group, Illustration, Process, Progress. The prominent colors used in the PowerPoint template are Green, Gray, White. People tell us our powerpoint templates diverging process arrow chart ppt Target Network are Upbeat. Professionals tell us our Concept PowerPoint templates and PPT Slides are readymade to fit into any presentation structure. Customers tell us our powerpoint templates diverging process arrow chart ppt Target Network are Fantastic. Use our Central PowerPoint templates and PPT Slides are Fun. We assure you our powerpoint templates diverging process arrow chart ppt Target Network are readymade to fit into any presentation structure. Professionals tell us our Centralized PowerPoint templates and PPT Slides are Functional.
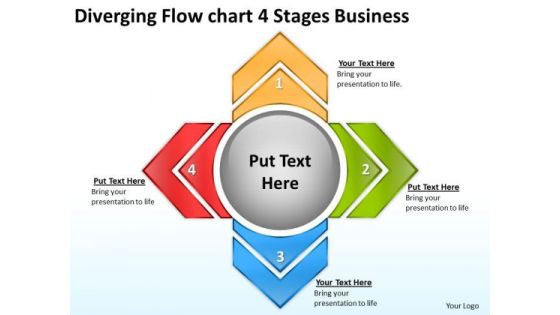
Diverging Flow Chart 4 Stages Business Cycle PowerPoint Slides
We present our diverging flow chart 4 stages business Cycle PowerPoint Slides.Present our Arrows PowerPoint Templates because you can Help your viewers automatically emphathise with your thoughts. Present our Business PowerPoint Templates because the fruits of your labour are beginning to show.Enlighten them on the great plans you have for their enjoyment. Download our Shapes PowerPoint Templates because they have fired the dreams of many fertile minds. Present our Signs PowerPoint Templates because you have a good idea of the roadmap to your desired destination. Present our Flow Charts PowerPoint Templates because you have to coordinate and motivate your team.Use these PowerPoint slides for presentations relating to analysis, analyze, background, blank, business, businessman, center, central, chart, component, concept, connect, core, decentralize, deploy, diagram, disperse, disseminate, distribute, diverge, diverse, diversify, divide, education, element, empty, expand, extend, flow, gist, group, industry, link, man, management, manager, part, people, person, plan, process, scatter, separate, spread, strategy, support, surround, teacher, template, transfer. The prominent colors used in the PowerPoint template are Green, Blue, Red. Customers tell us our diverging flow chart 4 stages business Cycle PowerPoint Slides are Romantic. PowerPoint presentation experts tell us our central PowerPoint templates and PPT Slides will get their audience's attention. People tell us our diverging flow chart 4 stages business Cycle PowerPoint Slides are Delightful. People tell us our center PowerPoint templates and PPT Slides are Flirty. Customers tell us our diverging flow chart 4 stages business Cycle PowerPoint Slides are Fabulous. People tell us our business PowerPoint templates and PPT Slides are Stunning.

Techniques To Boost Brand Awareness Column Chart Ppt Slides PDF
Crafting an eye-catching presentation has never been more straightforward. Let your presentation shine with this tasteful yet straightforward Techniques To Boost Brand Awareness Column Chart Ppt Slides PDF template. It offers a minimalistic and classy look that is great for making a statement. The colors have been employed intelligently to add a bit of playfulness while still remaining professional. Construct the ideal Techniques To Boost Brand Awareness Column Chart Ppt Slides PDF that effortlessly grabs the attention of your audience Begin now and be certain to wow your customers.
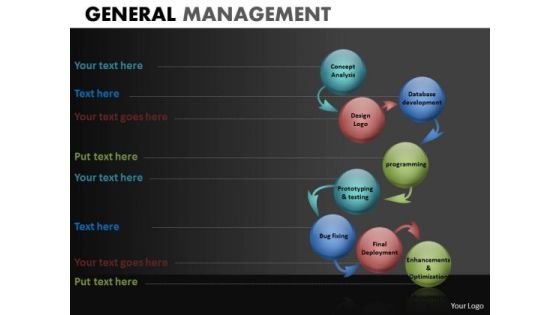
Snake Process Diagram Chart PowerPoint Slides Ppt Templates
Snake Process Diagram Chart PowerPoint Slides PPT templates-These high quality powerpoint pre-designed slides and powerpoint templates have been carefully created by our professional team to help you impress your audience. All slides have been created and are 100% editable in powerpoint. Each and every property of any graphic - color, size, orientation, shading, outline etc. can be modified to help you build an effective powerpoint presentation. Any text can be entered at any point in the powerpoint template or slide. Simply DOWNLOAD, TYPE and PRESENT!-These PowerPoint presentation slides can be used to represent concepts relating to--Abstract, action, analysis, blank, business, chart, clipart, commerce, concept, conceptual, design, diagram, direction, flow, generic, goals, guide, guidelines, heirarchy, icon, idea, illustration, lingakes, links, manage, management, mba, model, organization, performance, plan, process, project, relationship, representation, resource, steps, strategy, success, tactics, theoretical, theory, tool, workflow-Snake Process Diagram Chart PowerPoint Slides PPT templates
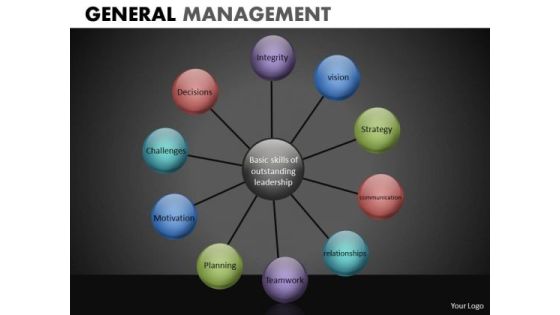
Wheel Chart With 10 Stages PowerPoint Slides Ppt Designs
Wheel Chart with 10 Stages PowerPoint Slides PPT Designs-These high quality powerpoint pre-designed slides and powerpoint templates have been carefully created by our professional team to help you impress your audience. All slides have been created and are 100% editable in powerpoint. Each and every property of any graphic - color, size, orientation, shading, outline etc. can be modified to help you build an effective powerpoint presentation. Any text can be entered at any point in the powerpoint template or slide. Simply DOWNLOAD, TYPE and PRESENT!-These PowerPoint presentation slides can be used to represent concepts relating to--Abstract, action, analysis, blank, business, chart, clipart, commerce, concept, conceptual, design, diagram, direction, flow, generic, goals, guide, guidelines, heirarchy, icon, idea, illustration, lingakes, links, manage, management, mba, model, organization, performance, plan, process, project, relationship, representation, resource, steps, strategy, success, tactics, theoretical, theory, tool, workflow-Wheel Chart with 10 Stages PowerPoint Slides PPT Designs
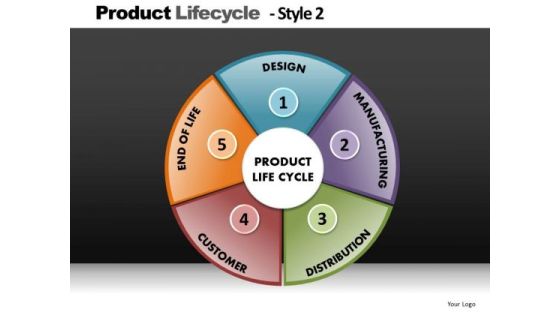
Product Lifecycle Pie Chart PowerPoint Slides Editable Ppt Slides
Product LifeCycle Pie Chart PowerPoint Slides Editable PPT Slides-These high quality powerpoint pre-designed slides and powerpoint templates have been carefully created by our professional team to help you impress your audience. All slides have been created and are 100% editable in powerpoint. Each and every property of any graphic - color, size, orientation, shading, outline etc. can be modified to help you build an effective powerpoint presentation. Any text can be entered at any point in the powerpoint template or slide. Simply DOWNLOAD, TYPE and PRESENT! These PowerPoint presentation slides can be used to represent themes relating to --Activities, business, clipart, commerce, concept, conceptual, customer, design, diagram, direction, distribution, guidelines, icon, illustration, integration, lifecycle, manage, management, manufacturing, marketing, mba, model, optimize, organization, performance, process, product, resentation, resource, sales, selling, steps, system, theoretical, theory, tool-Product LifeCycle Pie Chart PowerPoint Slides Editable PPT Slides
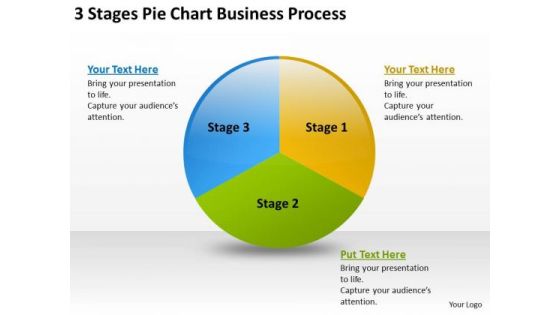
Chart Business PowerPoint Theme Process Writing Simple Plan Templates
We present our chart business powerpoint theme process writing simple plan templates.Download and present our Circle Charts PowerPoint Templates because Our PowerPoint Templates and Slides are aesthetically designed to attract attention. We gaurantee that they will grab all the eyeballs you need. Download and present our Flow Charts PowerPoint Templates because It is Aesthetically crafted by artistic young minds. Our PowerPoint Templates and Slides are designed to display your dexterity. Present our Business PowerPoint Templates because You can Stir your ideas in the cauldron of our PowerPoint Templates and Slides. Cast a magic spell on your audience. Download and present our Shapes PowerPoint Templates because you can Break through with our PowerPoint Templates and Slides. Bring down the mental barriers of your audience. Present our Marketing PowerPoint Templates because It can Bubble and burst with your ideas.Use these PowerPoint slides for presentations relating to Analyzing, business, capital, commerce, communication, company, decrease, descending, direction, earnings, economic, economy, finance, financial, graph,grow, growth, index, information, investment, leader, manage, management, marketing, money, organization, part, partition, percentage, pie, piechart, graph, piece, plan, presentation, process, profit, progress, report, resource, results, selling, slice, statistic, success, system, team, theory. The prominent colors used in the PowerPoint template are Green, Yellow, Blue.

Balanced Investment Annual Returns Performance Chart Designs PDF
This slide showcases a statistical data highlighting performance of balanced funds to measure and analyze returns on investments . It includes key components such as returns in 1 year, returns in 3 years and returns in 5 years. Pitch your topic with ease and precision using this Balanced Investment Annual Returns Performance Chart Designs PDF. This layout presents information on Balanced Investment, Annual Returns, Performance Chart. It is also available for immediate download and adjustment. So, changes can be made in the color, design, graphics or any other component to create a unique layout.

Client Engagement Loyalty Programs Comparison Chart Infographics PDF
This slide depicts comparison chart of customer loyalty programs used to check most effective loyalty program. It includes programs such as point rewards, expense rewards, cash back, surprise rewards, etc. Pitch your topic with ease and precision using this Client Engagement Loyalty Programs Comparison Chart Infographics PDF. This layout presents information on Point Rewards, Next Purchase, Customers. It is also available for immediate download and adjustment. So, changes can be made in the color, design, graphics or any other component to create a unique layout.

Company Turnover Financial Ratios Chart Comparison Icons PDF
This slide illustrates graph for turnover ratios that are accounts receivable, inventory turnover, accounts payable turnover, fixed asset turnover and total assets turnover ratio. It showcases comparison of three companies. Pitch your topic with ease and precision using this company turnover financial ratios chart comparison icons pdf. This layout presents information on company turnover financial ratios chart comparison. It is also available for immediate download and adjustment. So, changes can be made in the color, design, graphics or any other component to create a unique layout.
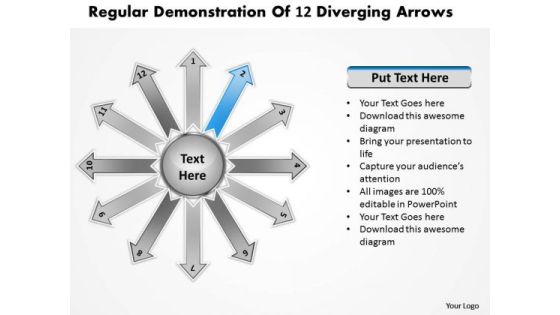
Regular Demonstration Of 12 Diverging Arrows Circular Chart PowerPoint Slides
We present our regular demonstration of 12 diverging arrows Circular Chart PowerPoint Slides.Use our Process and Flows PowerPoint Templates because you are going along well but your foresight shows that it may need a slight change in plans or direction. Use our Arrows PowerPoint Templates because it demonstrates to your audience how the best and most refined ideas pass through. Download and present our Marketing PowerPoint Templates because The marketplace is the merger of your dreams and your ability. Present our Flow charts PowerPoint Templates because this unique template give you an enthusiastic response and a purposeful Aye- Aye Sir. Present our Targets PowerPoint Templates because you can Highlight the key components of your entire manufacturing/ business process.Use these PowerPoint slides for presentations relating to Arrow, background, banner,concept,creative, design, direction, flow, ten,illustration, infographic, instruction, label,layout, manual, marketing, modern, next,number, offer, one, options, order,pointer, process, product,promotion, sequence, simple, special,step, symbol. The prominent colors used in the PowerPoint template are Blue, Black, Gray. Customers tell us our regular demonstration of 12 diverging arrows Circular Chart PowerPoint Slides are Delightful. We assure you our direction PowerPoint templates and PPT Slides are Glamorous. PowerPoint presentation experts tell us our regular demonstration of 12 diverging arrows Circular Chart PowerPoint Slides are Luxurious. People tell us our flow PowerPoint templates and PPT Slides are Fun. We assure you our regular demonstration of 12 diverging arrows Circular Chart PowerPoint Slides are Fashionable. Use our creative PowerPoint templates and PPT Slides are Multicolored.

Debt To Equity Financial Ratios Chart Comparison Download PDF
This slide illustrates debt to equity ratio graph that can help to evaluate total debt and financial liabilities against the total shareholders equity. It showcases comparison for a period of last four quarters Pitch your topic with ease and precision using this debt to equity financial ratios chart comparison download pdf. This layout presents information on debt to equity financial ratios chart comparison. It is also available for immediate download and adjustment. So, changes can be made in the color, design, graphics or any other component to create a unique layout.

Inventory Turnover Financial Ratios Chart Conversion Portrait PDF
This slide illustrates graph for inventory turnover ratio that can help company to analyze efficiency of inventory management. It showcases ratio graph comparison of 4 companies for a period of last 6 years Pitch your topic with ease and precision using this inventory turnover financial ratios chart conversion portrait pdf. This layout presents information on inventory turnover financial ratios chart conversion. It is also available for immediate download and adjustment. So, changes can be made in the color, design, graphics or any other component to create a unique layout.
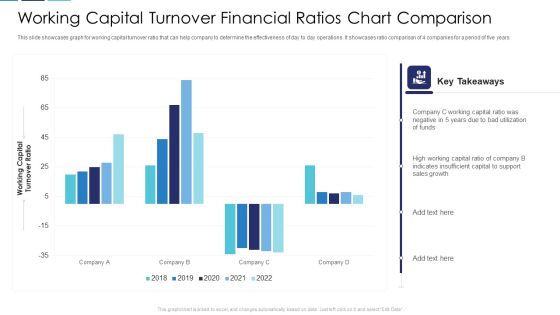
Working Capital Turnover Financial Ratios Chart Comparison Clipart PDF
This slide showcases graph for working capital turnover ratio that can help company to determine the effectiveness of day to day operations. It showcases ratio comparison of 4 companies for a period of five years Pitch your topic with ease and precision using this working capital turnover financial ratios chart comparison clipart pdf. This layout presents information on working capital turnover financial ratios chart comparison. It is also available for immediate download and adjustment. So, changes can be made in the color, design, graphics or any other component to create a unique layout.
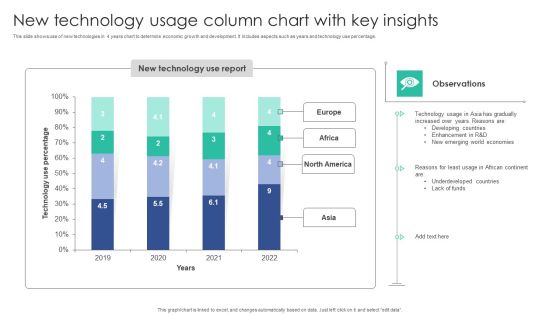
New Technology Usage Column Chart With Key Insights Brochure PDF
This slide shows use of new technologies in 4 years chart to determine economic growth and development. It Includes aspects such as years and technology use percentage.Pitch your topic with ease and precision using this New Technology Usage Column Chart With Key Insights Brochure PDF. This layout presents information on Technology Gradually, Increased Reasons, Developing Countries. It is also available for immediate download and adjustment. So, changes can be made in the color, design, graphics or any other component to create a unique layout.
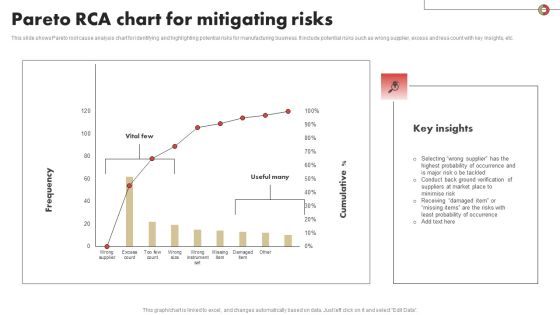
Pareto RCA Chart For Mitigating Risks Slides PDF
This slide shows Pareto root cause analysis chart for identifying and highlighting potential risks for manufacturing business. It include potential risks such as wrong supplier, excess and less count with key insights, etc. Pitch your topic with ease and precision using this Pareto RCA Chart For Mitigating Risks Slides PDF Download. This layout presents information on Mitigating, Pareto, Probability. It is also available for immediate download and adjustment. So, changes can be made in the color, design, graphics or any other component to create a unique layout.

Business Components Share Exploded Donut Circle Chart Elements PDF
This slide depicts the share of business components for a successful company and earn profits. It shows the percentage distribution of different components of business. Pitch your topic with ease and precision using this Business Components Share Exploded Donut Circle Chart Elements PDF. This layout presents information on Administration, Marketing, Customer Support. It is also available for immediate download and adjustment. So, changes can be made in the color, design, graphics or any other component to create a unique layout.

Bar Chart Representing Social Media Recruitment Benefits Infographics PDF
Pitch your topic with ease and precision using this bar chart representing social media recruitment benefits infographics pdf. This layout presents information on encouraging candidates, driving website traffic, creating brand awareness. It is also available for immediate download and adjustment. So, changes can be made in the color, design, graphics or any other component to create a unique layout.

Monthly Gantt Bar Chart Wit Department Involvement Inspiration PDF
Pitch your topic with ease and precision using this Monthly Gantt Bar Chart Wit Department Involvement Inspiration PDF. This layout presents information on Product Strategy, Business, Marketing. It is also available for immediate download and adjustment. So, changes can be made in the color, design, graphics or any other component to create a unique layout.
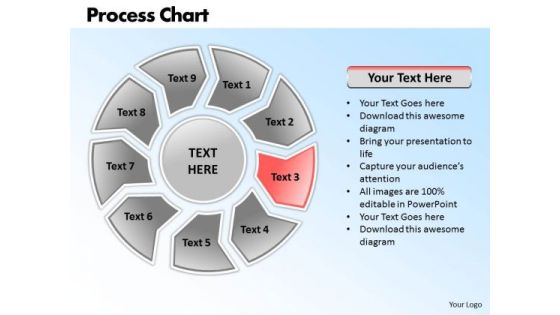
Ppt Circular Motion PowerPoint Writing Process Presentation Chart Templates
PPT circular motion powerpoint writing process presentation chart Templates-Create visually stunning and define your PPT Presentations in a unique and inspiring manner using our above Diagram which contains a graphic of nine text boxes arranged in circular manner. This image relates the concept of Circular process and its components to be explained in the Organization. PowerPoint text boxes diagram templates are designed to help you place your text in a professional layout.-PPT circular motion powerpoint writing process presentation chart Templates-Arrow, Art, Blue, Business, Button, Circular, Clip, Design, Diagram, Drop, Element, Glowing, Graph, Graphic, Icon, Illustration, Isolated, Process, Round, Set, Shadow, Sphere, Symbol

Diverging Flow Chart 4 Stages Business Circular PowerPoint Templates
We present our diverging flow chart 4 stages business Circular PowerPoint templates.Download and present our Marketing PowerPoint Templates because customer satisfaction is a mantra of the marketplace. Building a loyal client base is an essential element of your business. Use our Arrows PowerPoint Templates because brilliant ideas are your forte. Use our Flow charts PowerPoint Templates because you require care and diligence to function well. Present our Shapes PowerPoint Templates because our creative template will lay down your views. Download our Business PowerPoint Templates because you have selected your team man for man.Use these PowerPoint slides for presentations relating to Analysis, analyze, background, blank, business, businessman, center, central, chart component, concept, connect, core, decentralize, deploy, diagram, disperse disseminate, distribute, diverge, diverse, diversify, divide, education, element, empty expand, extend, flow, gist, group, industry, link, man, management, manager, part people, person, plan, process, scatter, separate, spread, strategy, support, surround teacher, template, transfer. The prominent colors used in the PowerPoint template are Yellow, Gray, White. Presenters tell us our diverging flow chart 4 stages business Circular PowerPoint templates help you meet deadlines which are an element of today's workplace. Just browse and pick the slides that appeal to your intuitive senses. Presenters tell us our blank PowerPoint templates and PPT Slides are Dynamic. PowerPoint presentation experts tell us our diverging flow chart 4 stages business Circular PowerPoint templates are Nice. We assure you our background PowerPoint templates and PPT Slides will get their audience's attention. Customers tell us our diverging flow chart 4 stages business Circular PowerPoint templates are No-nonsense. People tell us our background PowerPoint templates and PPT Slides are Nifty.

Pest Analysis Business Model Cycle Process Chart PowerPoint Templates
We present our pest analysis business model Cycle Process Chart PowerPoint templates.Download and present our Marketing PowerPoint Templates because customer satisfaction is a mantra of the marketplace. Building a loyal client base is an essential element of your business. Download our Business PowerPoint Templates because this slide represents the tools of the trade. Download and present our Leadership PowerPoint Templates because the mind is always whirring with new ideas. Present our Circle Charts PowerPoint Templates because you can Place them where they need to be. Download and present our Shapes PowerPoint Templates because you can Focus on each one and investigate which one would be the best fit for your needs.Use these PowerPoint slides for presentations relating to Analysis, Analyze, Blackboard, Board, Business, Chalk, Chalkboard, Chart, Component, Concept, Diagram, Direction, Economic, Education, Environmental, Factors, Framework, Graph, Graphics, Illustration, Law, Leadership, Management, Market, Market, Research, Model, Operations, Pest, Political, Position, Potential. The prominent colors used in the PowerPoint template are Red, Yellow, Green. We assure you our pest analysis business model Cycle Process Chart PowerPoint templates are Lush. Customers tell us our Board PowerPoint templates and PPT Slides are incredible easy to use. The feedback we get is that our pest analysis business model Cycle Process Chart PowerPoint templates are Fantastic. We assure you our Blackboard PowerPoint templates and PPT Slides are Perfect. People tell us our pest analysis business model Cycle Process Chart PowerPoint templates are the best it can get when it comes to presenting. We assure you our Chalk PowerPoint templates and PPT Slides look good visually.

Free Business PowerPoint Templates Process Ppt Circular Flow Layout Chart
We present our free business powerpoint templates process ppt Circular Flow Layout Chart.Present our Communication PowerPoint Templates because this is an excellent slide to detail and highlight your thought process, your views and your positive expectations.. Present our Arrows PowerPoint Templates because business ethics is an essential element in your growth. Download and present our Circle Charts PowerPoint Templates because you can Highlight the key components of your entire manufacturing/ business process. Present our Business PowerPoint Templates because you can see clearly through to the bigger bowl ahead. Time your jump to perfection and hit the nail on the head. Present our Shapes PowerPoint Templates because there is a crucial aspect that requires extra attention.Use these PowerPoint slides for presentations relating to Arrow, Bio, Business, Chart, Circle, Concept, Control, Cycle, Design, Development, Diagram, Eco, Ecology, Environmental, Evaluate, Flow, Flowchart, Fresh, Graphic, Green, Idea, Infographic, Iterative, Life, Lifecycle, Management, Method, Model, Natural, Nature, Organic, Process, Quality, Recycle, Research, Schema, Spiral, Step, Strategy, Success, System. The prominent colors used in the PowerPoint template are Blue, Gray, White. Customers tell us our free business powerpoint templates process ppt Circular Flow Layout Chart are Versatile. Customers tell us our Circle PowerPoint templates and PPT Slides are Youthful. Presenters tell us our free business powerpoint templates process ppt Circular Flow Layout Chart are Dynamic. PowerPoint presentation experts tell us our Design PowerPoint templates and PPT Slides are Wistful. Customers tell us our free business powerpoint templates process ppt Circular Flow Layout Chart are One-of-a-kind. Professionals tell us our Cycle PowerPoint templates and PPT Slides are Fabulous.
 Home
Home