Organizational Chart

Food Retail US Data Analysis Chart Ppt Powerpoint Presentation Ideas Microsoft Pdf
Pitch your topic with ease and precision using this food retail us data analysis chart ppt powerpoint presentation ideas microsoft pdf. This layout presents information on seven and i holdings, amazon, southeastern grocers, albertsons, target. It is also available for immediate download and adjustment. So, changes can be made in the color, design, graphics or any other component to create a unique layout.

Chart Showing Retail Channels Distribution Share Ppt PowerPoint Presentation Styles Format PDF
Pitch your topic with ease and precision using this chart showing retail channels distribution share ppt powerpoint presentation styles format pdf. This layout presents information on home shopping, duty free stores, departmental stores, hyermarkets, online. It is also available for immediate download and adjustment. So, changes can be made in the color, design, graphics or any other component to create a unique layout.

Coronavirus Disease 19 Contagiousness Comparison Chart Ppt PowerPoint Presentation Professional Background Designs PDF
Pitch your topic with ease and precision using this coronavirus disease 19 contagiousness comparison chart ppt powerpoint presentation professional background designs pdf. This layout presents information on x values seasonal norovirus case fatality rate. It is also available for immediate download and adjustment. So, changes can be made in the color, design, graphics or any other component to create a unique layout.

Monthly Website Performance Analysis Chart Ppt PowerPoint Presentation Model Skills PDF
Pitch your topic with ease and precision using this monthly website performance analysis chart ppt powerpoint presentation model skills pdf. This layout presents information on visitor devices, maverage time, the breakdown, laptop, desktop, mobile. It is also available for immediate download and adjustment. So, changes can be made in the color, design, graphics or any other component to create a unique layout.

Monthly Website Performance Analysis Chart Ppt PowerPoint Presentation Ideas Master Slide PDF
Pitch your topic with ease and precision using this monthly website performance analysis chart ppt powerpoint presentation ideas master slide pdf. This layout presents information on visitor devices, website traffic trends, the breakdown, average time. It is also available for immediate download and adjustment. So, changes can be made in the color, design, graphics or any other component to create a unique layout.

Pie Chart Showing Product Classification Of A Business Ppt PowerPoint Presentation File Guide PDF
Pitch your topic with ease and precision using this pie chart showing product classification of a business ppt powerpoint presentation file guide pdf. This layout presents information on entertainment products, hardware products, software products. It is also available for immediate download and adjustment. So, changes can be made in the color, design, graphics or any other component to create a unique layout.
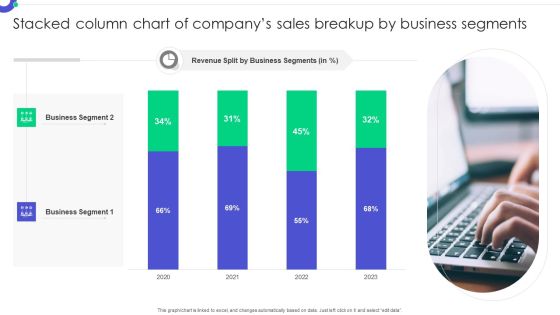
Stacked Column Chart Of Companys Sales Breakup By Business Segments Rules PDF
Pitch your topic with ease and precision using this Stacked Column Chart Of Companys Sales Breakup By Business Segments Rules PDF. This layout presents information on Business Segment, Revenue Split, Business Segments. It is also available for immediate download and adjustment. So, changes can be made in the color, design, graphics or any other component to create a unique layout.

Stacked Column Chart Of Product Sold By A Healthcare Company Download PDF
Pitch your topic with ease and precision using this Stacked Column Chart Of Product Sold By A Healthcare Company Download PDF. This layout presents information on Sales Split Products, Medical Product, Healthcare Company. It is also available for immediate download and adjustment. So, changes can be made in the color, design, graphics or any other component to create a unique layout.
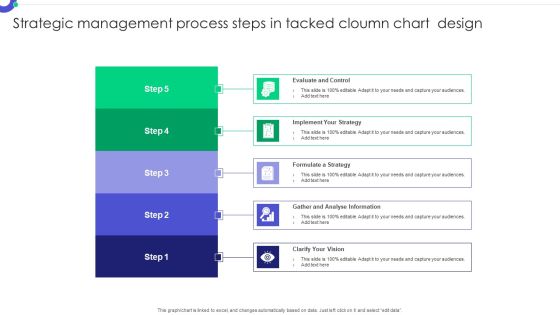
Strategic Management Process Steps In Tacked Cloumn Chart Design Pictures PDF
Pitch your topic with ease and precision using this Strategic Management Process Steps In Tacked Cloumn Chart Design Pictures PDF. This layout presents information on Evaluate Control, Implement Strategy, Formulate Strategy. It is also available for immediate download and adjustment. So, changes can be made in the color, design, graphics or any other component to create a unique layout.

11 Stages Marketing Process Chart Ppt Components Of Business Plan PowerPoint Slides
We present our 11 stages marketing process chart ppt components of business plan PowerPoint Slides.Download and present our Flow Charts PowerPoint Templates because Our PowerPoint Templates and Slides will embellish your thoughts. See them provide the desired motivation to your team. Download our Process and Flows PowerPoint Templates because Our PowerPoint Templates and Slides will let your words and thoughts hit bullseye everytime. Download our Business PowerPoint Templates because Our PowerPoint Templates and Slides will provide you a launch platform. Give a lift off to your ideas and send them into orbit. Download our Shapes PowerPoint Templates because Our PowerPoint Templates and Slides will let you meet your Deadlines. Download and present our Marketing PowerPoint Templates because These PowerPoint Templates and Slides will give the updraft to your ideas. See them soar to great heights with ease.Use these PowerPoint slides for presentations relating to Chart, flow, process, workflow, review, square, corporation, corporate, business, plan, hierarchy, glossy, compliance, diagram, graphic, marketing, development, graph, modern, illustration, icon, assess, clipart, stages, executive, design, clip, set, organization, infographic,levels, organize, art, implement, work, eleven. The prominent colors used in the PowerPoint template are White, Blue, Gray.

Complete Guide Of Paid Media Marketing Techniques Line Chart Background PDF
Want to ace your presentation in front of a live audience Our Complete Guide Of Paid Media Marketing Techniques Line Chart Background PDF can help you do that by engaging all the users towards you. Slidegeeks experts have put their efforts and expertise into creating these impeccable powerpoint presentations so that you can communicate your ideas clearly. Moreover, all the templates are customizable, and easy to edit and downloadable. Use these for both personal and commercial use.

Bubble Chart Developing Employee Retention Techniques To Minimize Turnover Rate Background PDF
Make sure to capture your audiences attention in your business displays with our gratis customizable Bubble Chart Developing Employee Retention Techniques To Minimize Turnover Rate Background PDF. These are great for business strategies, office conferences, capital raising or task suggestions. If you desire to acquire more customers for your tech business and ensure they stay satisfied, create your own sales presentation with these plain slides.
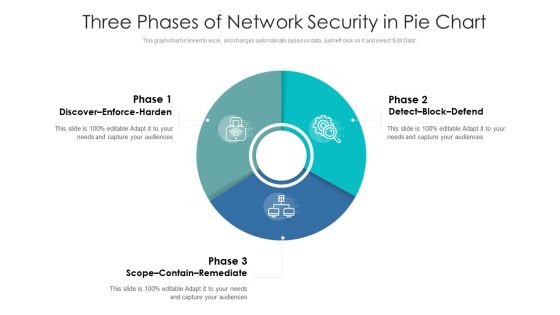
Three Phases Of Network Security In Pie Chart Ppt PowerPoint Presentation Gallery Graphics Download PDF
Pitch your topic with ease and precision using this three phases of network security in pie chart ppt powerpoint presentation gallery graphics download pdf. This layout presents information on discover enforce harden, detect block defend, scope contain remediate. It is also available for immediate download and adjustment. So, changes can be made in the color, design, graphics or any other component to create a unique layout.
Project Management Chart With Monitor And Control Ppt PowerPoint Presentation Summary Icons PDF
Pitch your topic with ease and precision using this project management chart with monitor and control ppt powerpoint presentation summary icons pdf. This layout presents information on executing, planning, monitor and control, closing, initiating, start, time, end. It is also available for immediate download and adjustment. So, changes can be made in the color, design, graphics or any other component to create a unique layout.

Chart Showing Quarterly Product Sales By Various Vendors Ppt PowerPoint Presentation Professional Vector PDF
Pitch your topic with ease and precision using this chart showing quarterly product sales by various vendors ppt powerpoint presentation professional vector pdf. This layout presents information on number of products sold, region abc region, year 2020, product sales, supplier. It is also available for immediate download and adjustment. So, changes can be made in the color, design, graphics or any other component to create a unique layout.

Power Grid Statistics Chart For Year Over Year Analysis Ppt PowerPoint Presentation Show Model PDF
Pitch your topic with ease and precision using this power grid statistics chart for year over year analysis ppt powerpoint presentation show model pdf. This layout presents information on investments by distribution system operators, investments by transmission system operators, 2017 to 2020. It is also available for immediate download and adjustment. So, changes can be made in the color, design, graphics or any other component to create a unique layout.

Chart Showing Time And Business Impact Ppt PowerPoint Presentation Example 2015 PDF
Pitch your topic with ease and precision using this chart showing time and business impact ppt powerpoint presentation example 2015 pdf. This layout presents information on business impact mobilization, ramp up, steady state, time, conscious change, renewal, effort. It is also available for immediate download and adjustment. So, changes can be made in the color, design, graphics or any other component to create a unique layout.
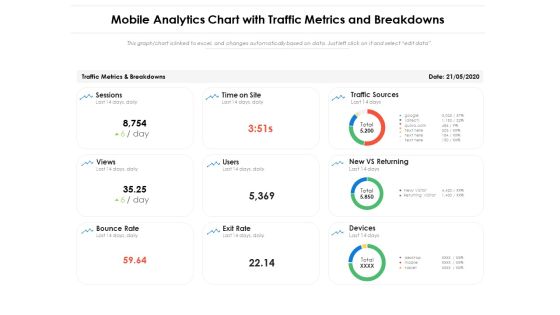
Mobile Analytics Chart With Traffic Metrics And Breakdowns Ppt PowerPoint Presentation Ideas Layout PDF
Pitch your topic with ease and precision using this mobile analytics chart with traffic metrics and breakdowns ppt powerpoint presentation ideas layout pdf. This layout presents information on traffic sources, new vs returning, devices, bounce rate, sessions. It is also available for immediate download and adjustment. So, changes can be made in the color, design, graphics or any other component to create a unique layout.
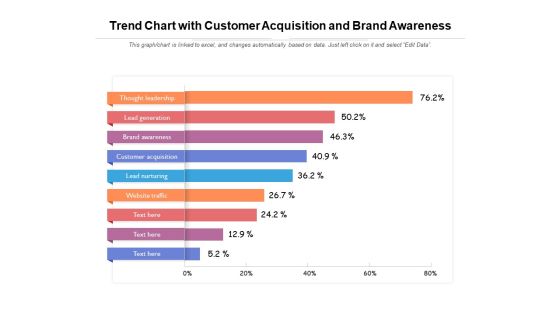
Trend Chart With Customer Acquisition And Brand Awareness Ppt PowerPoint Presentation Show Samples PDF
Pitch your topic with ease and precision using this trend chart with customer acquisition and brand awareness ppt powerpoint presentation show samples pdf. This layout presents information on thought leadership, lead generation, brand awareness, customer acquisition, lead nurturing. It is also available for immediate download and adjustment. So, changes can be made in the color, design, graphics or any other component to create a unique layout.
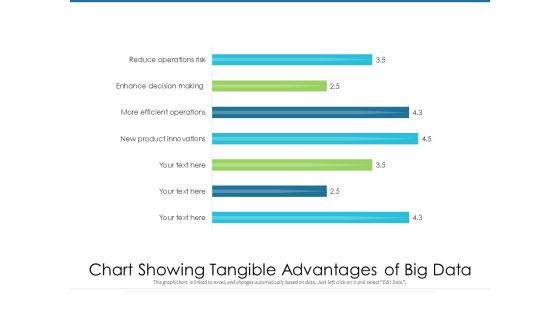
Chart Showing Tangible Advantages Of Big Data Ppt PowerPoint Presentation Infographics Clipart PDF
Pitch your topic with ease and precision using this chart showing tangible advantages of big data ppt powerpoint presentation infographics clipart pdf. This layout presents information on new product innovations, more efficient operations, enhance decision making, reduce operations risk. It is also available for immediate download and adjustment. So, changes can be made in the color, design, graphics or any other component to create a unique layout.

Chart Indicating United States Marine Corps Yearly Attrition Rate Ppt PowerPoint Presentation File Background Images PDF
Pitch your topic with ease and precision using this chart indicating united states marine corps yearly attrition rate ppt powerpoint presentation file background images pdf. This layout presents information on hart indicating united states marine corps yearly attrition rate. It is also available for immediate download and adjustment. So, changes can be made in the color, design, graphics or any other component to create a unique layout.

Budget Chart With Income And Expenditure Comparison Ppt PowerPoint Presentation Infographics Designs PDF
This slide illustrates graphical representation of income and expenditure of a company. It includes cashflow table with total income and total expense etc.Pitch your topic with ease and precision using this Budget Chart With Income And Expenditure Comparison Ppt PowerPoint Presentation Infographics Designs PDF. This layout presents information on Total Expense, Total Income, Total Cash. It is also available for immediate download and adjustment. So, changes can be made in the color, design, graphics or any other component to create a unique layout.

Market Chart Showing Revenue Breakdown Of IT Products Ppt File Elements PDF
This slide shows the revenue comparison graph of IT products over last six months. IT products covered in the slide are hardware and software. Pitch your topic with ease and precision using this Market Chart Showing Revenue Breakdown Of IT Products Ppt File Elements PDF. This layout presents information on Hardware, Software, Key Insights. It is also available for immediate download and adjustment. So, changes can be made in the color, design, graphics or any other component to create a unique layout.

Product Market Share Chart Of Electronic Company Ppt Gallery Graphic Tips PDF
This slide shows the percentage of market share graph of electronic company products. It includes mobile phone, laptop, tablet, computer and others devices. Pitch your topic with ease and precision using this Product Market Share Chart Of Electronic Company Ppt Gallery Graphic Tips PDF. This layout presents information on Mobile Phone, Computer, Laptop, Tablet. It is also available for immediate download and adjustment. So, changes can be made in the color, design, graphics or any other component to create a unique layout.
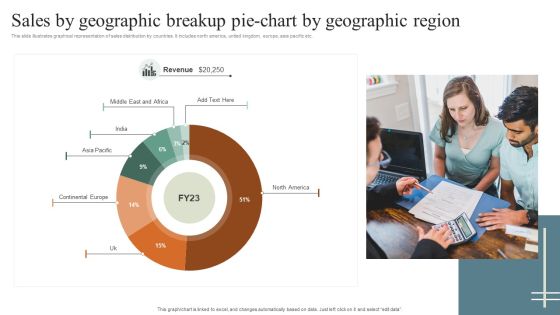
Sales By Geographic Breakup Pie Chart By Geographic Region Rules PDF
This slide illustrates graphical representation of sales distribution by countries. It includes north america, united kingdom, europe, asia pacific etc. Pitch your topic with ease and precision using this Sales By Geographic Breakup Pie Chart By Geographic Region Rules PDF. This layout presents information on Sales By Geographic, Geographic Region. It is also available for immediate download and adjustment. So, changes can be made in the color, design, graphics or any other component to create a unique layout.

Bar Chart Representing Quality Management Tools And Techniques For Process Improvement Download PDF
This slide focuses on the graphical representation of quality management software tools which includes quality management system, enterprise resource planning, business intelligence and manufacturing operations management with top performers, etc. Showcasing this set of slides titled bar chart representing quality management tools and techniques for process improvement download pdf. The topics addressed in these templates are manufacturing operations management, business intelligence, enterprise resource planning, quality management system. All the content presented in this PPT design is completely editable. Download it and make adjustments in color, background, font etc. as per your unique business setting.

Column Chart Developing Employee Retention Techniques To Minimize Turnover Rate Ideas PDF
Welcome to our selection of the Column Chart Developing Employee Retention Techniques To Minimize Turnover Rate Ideas PDF. These are designed to help you showcase your creativity and bring your sphere to life. Planning and Innovation are essential for any business that is just starting out. This collection contains the designs that you need for your everyday presentations. All of our PowerPoints are 100 precent editable, so you can customize them to suit your needs. This multi-purpose template can be used in various situations. Grab these presentation templates today.

Line Chart Brand And Equity Evaluation Techniques And Procedures Demonstration PDF
Slidegeeks has constructed Line Chart Brand And Equity Evaluation Techniques And Procedures Demonstration PDF after conducting extensive research and examination. These presentation templates are constantly being generated and modified based on user preferences and critiques from editors. Here, you will find the most attractive templates for a range of purposes while taking into account ratings and remarks from users regarding the content. This is an excellent jumping-off point to explore our content and will give new users an insight into our top-notch PowerPoint Templates.

Bar Chart Representing IT Risk Control Strategies Risk Management For Banks Themes PDF
This slide shows the graphical presentation of information technology risk management strategies adopted by banks such as mapping rules and requirements, regulatory impact management, data preparation and validation, compliance monitoring, analytical calculations, etc. Pitch your topic with ease and precision using this Bar Chart Representing IT Risk Control Strategies Risk Management For Banks Themes PDF. This layout presents information on IT Risk Management, Compliance Monitoring, Manages IT Risks. It is also available for immediate download and adjustment. So, changes can be made in the color, design, graphics or any other component to create a unique layout.

Trend Of Quarterly Funding For Start Up Project Performance Chart Graphics PDF
This slide depicts investment made in different start up projects for 2 years. It also includes the investment amount, funding quarters in graphical form with a trend line and insights. Pitch your topic with ease and precision using this Trend Of Quarterly Funding For Start Up Project Performance Chart Graphics PDF. This layout presents information on Good Management, Efficient Team, Investment Decreased. It is also available for immediate download and adjustment. So, changes can be made in the color, design, graphics or any other component to create a unique layout.

Bar Chart Showing Various Bullying Activities Ppt PowerPoint Presentation Professional Slide PDF
Pitch your topic with ease and precision using this bar chart showing various bullying activities ppt powerpoint presentation professional slide pdf. This layout presents information on unjustified criticism or complaints, deliberately excluding someone from workplace activities, deliberately denying access to information or other resources, verbal abusing, humiliating a person through gestures, sarcasm, teasing and insults in front of others, spreading rumors about someone. It is also available for immediate download and adjustment. So, changes can be made in the color, design, graphics or any other component to create a unique layout.

Ppt Purple Piece Live Connections In Linear Process Work Flow Chart PowerPoint Templates
PPT purple piece live connections in linear process work flow chart powerpoint Templates-Use this PowerPoint Diagram to illustrate how Linear Flow process and its components work. This Purple part which is being highlighted out of all combined Puzzles will let you explain the Beginning component of process and will help you to understand the whole mechanism of the procedure.-Can be used for presentations on abstract, algorithm, arrow, arrow, chart, block, block, diagram, business, chart, color, connection, design, development, diagram, direction, element, flow, flow, Chart, flow,diagram\n,flowchart\n,graph\n,kind,of,diagram\n,linear\n,linear,diagram\n,management\n,model\n,module\n,motion\n,organization\n,plan\n,process\n,process,arrows\n,process,chart\n,process,diagram\n,process,flow\n,program\n,section,segment,set,sign,solution,strategy,symbol-PPT purple piece live connections in linear process work flow chart powerpoint Templates

Quarterly Non Profit Marketing Strategy For Fundraising Campaign Performance Chart Diagrams PDF
This slide depicts different strategies applied annually to gain investment for non profit organizations. It includes direct mail, event, e-mail, social media and content marketing tactics. Pitch your topic with ease and precision using this Quarterly Non Profit Marketing Strategy For Fundraising Campaign Performance Chart Diagrams PDF. This layout presents information on Marketing Strategies, Event Marketing, Social Media. It is also available for immediate download and adjustment. So, changes can be made in the color, design, graphics or any other component to create a unique layout.
Revenue Chart Of Abc Bank Across Global Market Ppt Icon Images PDF
This slide illustrates information about revenue generated by ABC bank in last eight years across global market. Continuous digitalization is the main contributing factor for the same. Pitch your topic with ease and precision using this Revenue Chart Of Abc Bank Across Global Market Ppt Icon Images PDF. This layout presents information on Continuous Digitalization, 2016 To 2023, Revenue. It is also available for immediate download and adjustment. So, changes can be made in the color, design, graphics or any other component to create a unique layout.
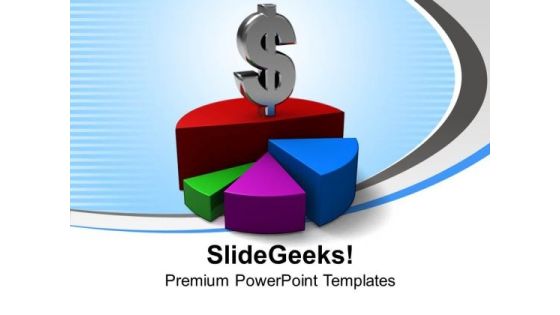
Pie Chart With Dollar Sign Business PowerPoint Templates And PowerPoint Themes 1112
Pie Chart With Dollar Sign Business PowerPoint Templates And PowerPoint Themes 1112-This PowerPoint template shows pie chart with dollar sign. Use this Pie Chart Based PowerPoint Template to illustrate the main components required for the Growth of the Company. Now use this template to enlighten your team and colleagues on the critical factors involved. Use our PowerPoint templates to spread the good word, be assured by all you will be keenly heard.-Pie Chart With Dollar Sign Business PowerPoint Templates And PowerPoint Themes 1112-This PowerPoint template can be used for presentations relating to-Pie chart dollar sign, Symbol, Finance, Marketing, Signs, Design

Cost Scrum Kpis Chart And Key Statistics Ppt Layouts Example Introduction PDF
This slide illustrates graphical representation of cost scrum metrics. It provides Projected Hours per story and actual hours per story point and other key statistics. Pitch your topic with ease and precision using this Cost Scrum Kpis Chart And Key Statistics Ppt Layouts Example Introduction PDF. This layout presents information on Projected Hours, Cost Per Story, Metrics, Actual Cost. It is also available for immediate download and adjustment. So, changes can be made in the color, design, graphics or any other component to create a unique layout.
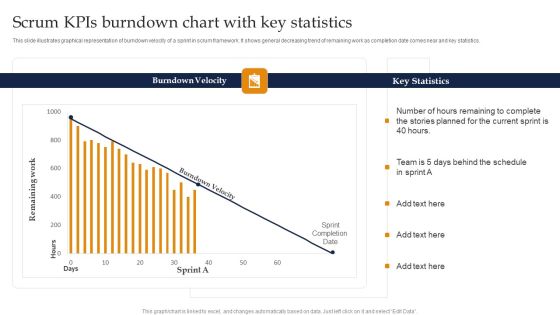
Scrum Kpis Burndown Chart With Key Statistics Ppt Pictures Visual Aids PDF
This slide illustrates graphical representation of burndown velocity of a sprint in scrum framework. It shows general decreasing trend of remaining work as completion date comes near and key statistics. Pitch your topic with ease and precision using this Scrum Kpis Burndown Chart With Key Statistics Ppt Pictures Visual Aids PDF. This layout presents information on Burndown Velocity, Key Statistics, Current Sprint. It is also available for immediate download and adjustment. So, changes can be made in the color, design, graphics or any other component to create a unique layout.

Construction Industry Market Share Chart Comparison Of Big Players Ppt Portfolio Shapes PDF
This slide shows the year over year market share comparison of major construction firms. It also illustrates that market share of brand B has increased by slight margin. Pitch your topic with ease and precision using this Construction Industry Market Share Chart Comparison Of Big Players Ppt Portfolio Shapes PDF. This layout presents information on Market Share Percentage, 2022 To 2023, Market Share. It is also available for immediate download and adjustment. So, changes can be made in the color, design, graphics or any other component to create a unique layout.

Usage Trend Chart Of Skincare Product Market Ppt Slides Graphics Download PDF
This slide shows market trend graph of skincare product usage in four quarters. It also indicates that product A is most preferred by the customers. Pitch your topic with ease and precision using this Usage Trend Chart Of Skincare Product Market Ppt Slides Graphics Download PDF. This layout presents information on Trend Product, Skincare Product, Quarter Due. It is also available for immediate download and adjustment. So, changes can be made in the color, design, graphics or any other component to create a unique layout.

Company Age Wise Employee Count Column Chart With Key Insights Microsoft PDF
This slide illustrates employee count by age to find the recruitment rate for company. It includes aspects such as the number of employees and age.Pitch your topic with ease and precision using this Company Age Wise Employee Count Column Chart With Key Insights Microsoft PDF. This layout presents information on Employees Working, Total Workforce, Require Replacement. It is also available for immediate download and adjustment. So, changes can be made in the color, design, graphics or any other component to create a unique layout.
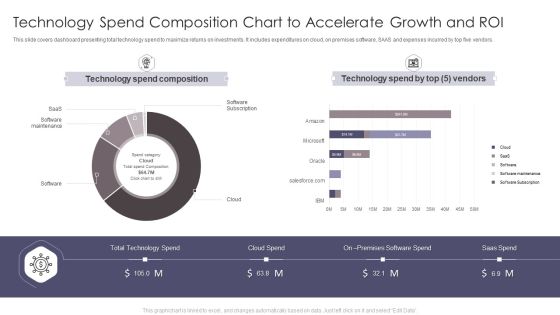
Technology Spend Composition Chart To Accelerate Growth And Roi Summary PDF
This slide covers dashboard presenting total technology spend to maximize returns on investments. It includes expenditures on cloud, on premises software, SAAS and expenses incurred by top five vendors. Pitch your topic with ease and precision using this Technology Spend Composition Chart To Accelerate Growth And Roi Summary PDF. This layout presents information on Technology Spend Composition, Technology Spend. It is also available for immediate download and adjustment. So, changes can be made in the color, design, graphics or any other component to create a unique layout.

Area Chart Employee Performance Management System To Enhance Workforce Productivity Ideas PDF
This Area Chart Employee Performance Management System To Enhance Workforce Productivity Ideas PDF from Slidegeeks makes it easy to present information on your topic with precision. It provides customization options, so you can make changes to the colors, design, graphics, or any other component to create a unique layout. It is also available for immediate download, so you can begin using it right away. Slidegeeks has done good research to ensure that you have everything you need to make your presentation stand out. Make a name out there for a brilliant performance.

Executing Automotive Marketing Tactics For Sales Boost Doughnut Chart Professional PDF
This Executing Automotive Marketing Tactics For Sales Boost Doughnut Chart Professional PDF from Slidegeeks makes it easy to present information on your topic with precision. It provides customization options, so you can make changes to the colors, design, graphics, or any other component to create a unique layout. It is also available for immediate download, so you can begin using it right away. Slidegeeks has done good research to ensure that you have everything you need to make your presentation stand out. Make a name out there for a brilliant performance.
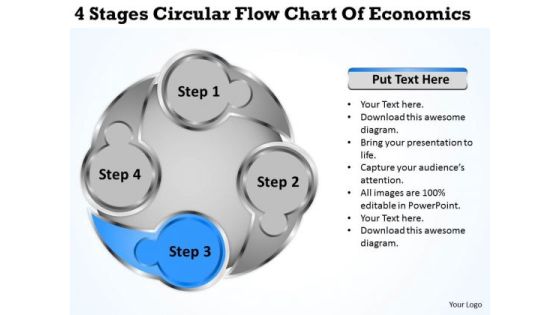
Circular Flow Chart Of Economics Business Plans For Small PowerPoint Templates
We present our circular flow chart of economics business plans for small PowerPoint templates.Use our Process and Flows PowerPoint Templates because Our PowerPoint Templates and Slides are specially created by a professional team with vast experience. They diligently strive to come up with the right vehicle for your brilliant Ideas. Download our Arrows PowerPoint Templates because Our PowerPoint Templates and Slides will give you great value for your money. Be assured of finding the best projection to highlight your words. Use our Circle Charts PowerPoint Templates because Our PowerPoint Templates and Slides are aesthetically designed to attract attention. We gaurantee that they will grab all the eyeballs you need. Download our Marketing PowerPoint Templates because Our PowerPoint Templates and Slides will provide you the cutting edge. Slice through the doubts in the minds of your listeners. Download and present our Shapes PowerPoint Templates because Our PowerPoint Templates and Slides has conjured up a web of all you need with the help of our great team. Use them to string together your glistening ideas.Use these PowerPoint slides for presentations relating to Action, stakeholders, tactics, model, tool, business, plan, concept, representation, diagram, guide, process, theory, personnel, management, learning,mba, manage, cycle, illustration, icon, strategy, clipart, guidelines, direction, design, organization, improve, implement, commerce, conceptual, improvement,heirarchy, analyze, resource, theoretical, measure, performance. The prominent colors used in the PowerPoint template are Blue, Gray, White.
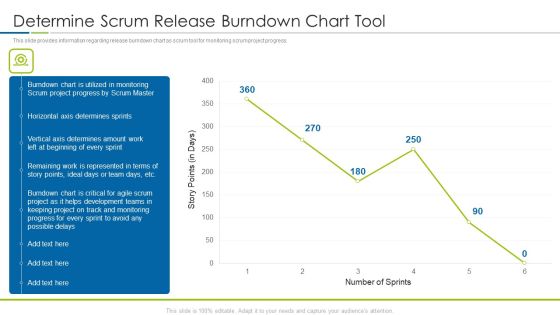
Scrum Techniques Deployed Agile Members It Determine Scrum Release Burndown Chart Tool Rules PDF
This slide provides information regarding release burndown chart as scrum tool for monitoring scrum project progress. Deliver an awe inspiring pitch with this creative scrum techniques deployed agile members it determine scrum release burndown chart tool rules pdf bundle. Topics like determine scrum release burndown chart tool can be discussed with this completely editable template. It is available for immediate download depending on the needs and requirements of the user.

Accounts Receivables Optimization Techniques Account Receivable Management And Customer Invoice Chart Elements PDF
This slide shows the accounts receivable management and customer invoice chart with invoice data, invoice number, customer details, etc.Deliver an awe inspiring pitch with this creative accounts receivables optimization techniques account receivable management and customer invoice chart elements pdf bundle. Topics like account receivable management and customer invoice chart can be discussed with this completely editable template. It is available for immediate download depending on the needs and requirements of the user.
Food Company Financial Performance Summary Historical Food Product Sales Chart Icons PDF
The following slide shows the comparative sales growth of agricultural products and processed foods. It shows the product sales from more than three decades to assess the change in demand of company products. This Food Company Financial Performance Summary Historical Food Product Sales Chart Icons PDF from Slidegeeks makes it easy to present information on your topic with precision. It provides customization options, so you can make changes to the colors, design, graphics, or any other component to create a unique layout. It is also available for immediate download, so you can begin using it right away. Slidegeeks has done good research to ensure that you have everything you need to make your presentation stand out. Make a name out there for a brilliant performance.

3d Puzzle Linear Flow Process 2 Stages Ppt Chart PowerPoint Templates
We present our 3d puzzle linear flow process 2 stages ppt chart PowerPoint templates. Use our Business PowerPoint Templates because; Highlight the key components of your entire manufacturing/ business process. Use our Puzzles or Jigsaws PowerPoint Templates because, you have it all down to a nicety, slice by slice, layer by layer. Use our Shapes PowerPoint Templates because, and watch them strengthen your companys sinews. Use our Abstract PowerPoint Templates because, Help your viewers automatically empathized with your thoughts. Use our Process and Flows PowerPoint Templates because, Puzzles or Jigsaw Template:- It is all there in bits and pieces. Use these PowerPoint slides for presentations relating to abstract, action, attach, box, business, center, chain, chart, color, communication, concept, connection, cube, cycle, data, diagram, flow, globe, horizontal, idea, illustration, information, interaction, jigsaw, join, link, pieces, process, puzzle, relation, relationship, shape, success. The prominent colors used in the PowerPoint template are Blue, Gray, and Black

Success Pie Chart Concept Business PowerPoint Templates And PowerPoint Themes 1012
Success Pie Chart Concept Business PowerPoint Templates And PowerPoint Themes 1012-Use this Pie Chart Based PowerPoint Template to illustrate the main components required for the Growth of the Company. It shows seven major factors required. Now use this template to enlighten your team and colleagues on the critical factors involved. Use our PowerPoint templates to spread the good word, be assured by all you will be keenly heard.-Success Pie Chart Concept Business PowerPoint Templates And PowerPoint Themes 1012-This PowerPoint template can be used for presentations relating to-Success Pie Chart, Business, Finance, Marketing, Success, Symbol
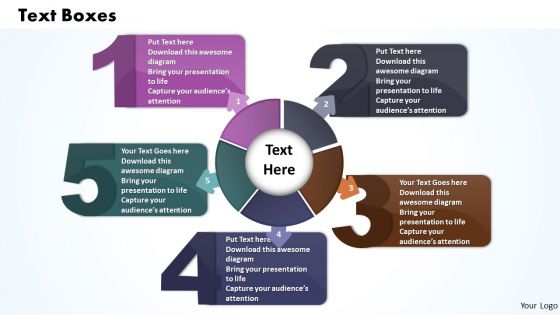
Ppt Five Text Boxes PowerPoint Template Connections Travel With Circle Chart Templates
PPT five text boxes powerpoint template connections travel with circle Chart Templates-Use this Circular Process with five text Boxes to represent a continuing sequence of stages, tasks, or events in a circular flow and emphasize the connection between all components. You can change color, size and orientation of any icon to your liking.-PPT five text boxes powerpoint template connections travel with circle Chart Templates
Scheduling Chart For Tracking Work In Process Report In Production Management Formats PDF
Pitch your topic with ease and precision using this scheduling chart for tracking work in process report in production management formats pdf. This layout presents information on scheduling chart for tracking work in process report. It is also available for immediate download and adjustment. So, changes can be made in the color, design, graphics or any other component to create a unique layout.

Calendar Chart Showing Various Activities By Date Ppt PowerPoint Presentation Infographics Maker PDF
Pitch your topic with ease and precision using this calendar chart showing various activities by date ppt powerpoint presentation infographics maker pdf. This layout presents information on calendar chart showing various activities by date. It is also available for immediate download and adjustment. So, changes can be made in the color, design, graphics or any other component to create a unique layout.
Employee Engagement Statistics Icon In A Pie Chart Format Diagrams PDF
Pitch your topic with ease and precision using this employee engagement statistics icon in a pie chart format diagrams pdf. This layout presents information on employee engagement statistics icon in a pie chart format. It is also available for immediate download and adjustment. So, changes can be made in the color, design, graphics or any other component to create a unique layout.

Corporate Fun Activity Event Program Planning And Coordination Flow Chart Rules PDF
Pitch your topic with ease and precision using this Corporate Fun Activity Event Program Planning And Coordination Flow Chart Rules PDF. This layout presents information on Team Assembles, Competition Recommences, Coordination Flow Chart. It is also available for immediate download and adjustment. So, changes can be made in the color, design, graphics or any other component to create a unique layout.
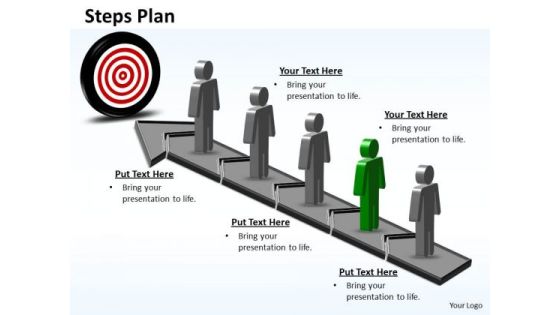
PowerPoint Backgrounds Chart Steps Plan 5 Stages Style 6 Ppt Design
PowerPoint Backgrounds Chart Steps Plan 5 Stages Style 6 PPT Design-This Business Powerpoint Template Shows the one step which consists of five stages to reach till center of the board. Use this another graphic design to represent a continuing sequence of stages, tasks, or events and emphasize the connection between all components.-PowerPoint Backgrounds Chart Steps Plan 5 Stages Style 6 PPT Design
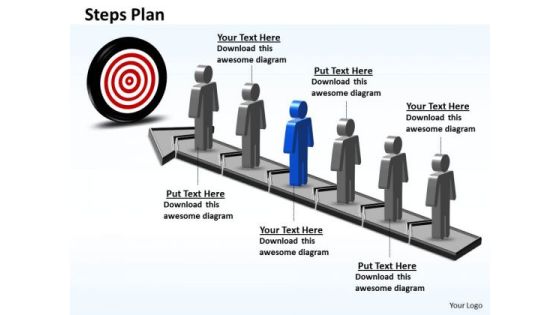
PowerPoint Backgrounds Chart Steps Plan 6 Stages Style 6 Ppt Slide
PowerPoint Backgrounds Chart Steps Plan 6 Stages Style 6 PPT Slide-This Business Powerpoint Template Shows the one step which consists of six stages to reach till center of the board. Use this another graphic design to represent a continuing sequence of stages, tasks, or events and emphasize the connection between all components.-PowerPoint Backgrounds Chart Steps Plan 6 Stages Style 6 PPT Slide
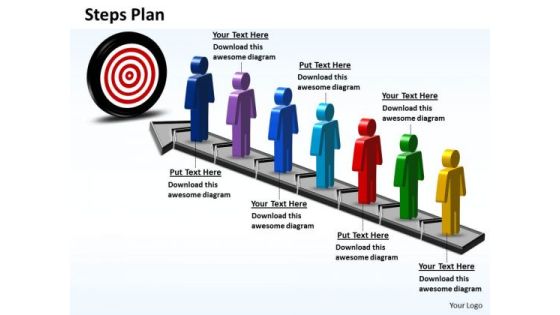
PowerPoint Backgrounds Chart Steps Plan 7 Stages Style 6 Ppt Design
PowerPoint Backgrounds Chart Steps Plan 7 Stages Style 6 PPT Design-This Business Powerpoint Template Shows the one step which consists of seven stages to reach till center of the board. Use this another graphic design to represent a continuing sequence of stages, tasks, or events and emphasize the connection between all components.-PowerPoint Backgrounds Chart Steps Plan 7 Stages Style 6 PPT Design

PowerPoint Presentation Chart Steps Plan 7 Stages Style 6 Ppt Slide
PowerPoint Presentation Chart Steps Plan 7 Stages Style 6 PPT Slide-This Business Powerpoint Template Shows the one step which consists of seven stages to reach till center of the board. Use this another graphic design to represent a continuing sequence of stages, tasks, or events and emphasize the connection between all components.-PowerPoint Presentation Chart Steps Plan 7 Stages Style 6 PPT Slide

PowerPoint Layout Chart Steps Plan 3 Stages Style 3 Ppt Backgrounds
PowerPoint Layout Chart Steps Plan 3 Stages Style 3 PPT Backgrounds-This Business Powerpoint Template Shows the one step which consists of three stages to hit the center of the board. Use this another graphic design to represent a continuing sequence of stages, tasks, or events and emphasize the connection between all components.-PowerPoint Layout Chart Steps Plan 3 Stages Style 3 PPT Backgrounds

Spaghetti Chart To Describe Movement Of Invoice In Office Diagrams PDF
Pitch your topic with ease and precision using this spaghetti chart to describe movement of invoice in office diagrams pdf. This layout presents information on spaghetti chart to describe movement of invoice in office. It is also available for immediate download and adjustment. So, changes can be made in the color, design, graphics or any other component to create a unique layout.
 Home
Home