Metrics
IT Security Risk Management Approach Introduction Kpi Dashboard To Track Security Risk Events Icons PDF
This slide displays KPI dashboard that company will use to track multiple risk events. Metrics covered in the dashboard are residual risks by period and risk category by total risk rating. Deliver and pitch your topic in the best possible manner with this IT Security Risk Management Approach Introduction Kpi Dashboard To Track Security Risk Events Icons PDF. Use them to share invaluable insights on System Technology Risk, Governance Risk, Security Risk Events and impress your audience. This template can be altered and modified as per your expectations. So, grab it now.

Employee Performance Scorecard With Goals And Actual Performance Guidelines PDF
The slide shows the number of employees assessed with average employee performance score. It includes metrics such as no. of sales, absenteeism rate, overtime per employee and potential client contact. Pitch your topic with ease and precision using this Employee Performance Scorecard With Goals And Actual Performance Guidelines PDF. This layout presents information on Potential Client Contact, Absenteeism Rate, Average Employee Score. It is also available for immediate download and adjustment. So, changes can be made in the color, design, graphics or any other component to create a unique layout.
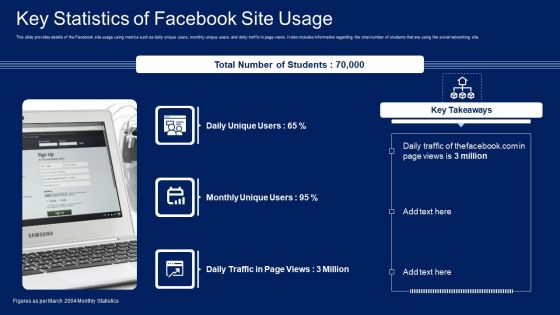
Facebook Original Elevator Funding Pitch Deck Key Statistics Of Facebook Site Usage Background PDF
This slide provides details of the Facebook site usage using metrics such as daily unique users, monthly unique users, and daily traffic in page views. It also includes information regarding the total number of students that are using the social networking site. Presenting Facebook Original Elevator Funding Pitch Deck Key Statistics Of Facebook Site Usage Background PDF to provide visual cues and insights. Share and navigate important information on three stages that need your due attention. This template can be used to pitch topics like Key Statistics. In addtion, this PPT design contains high resolution images, graphics, etc, that are easily editable and available for immediate download.

Company Sales Lead Qualification Procedure To Enhance Revenue Introducing Our New Sales Cycle Ideas PDF
Developing a new sales cycle is key strategy for any organization as it highlights the new sales cycle of the organization. The provided displays key metrics of the such as sales cycle, technology used etc.Deliver an awe inspiring pitch with this creative Company Sales Lead Qualification Procedure To Enhance Revenue Introducing Our New Sales Cycle Ideas PDF bundle. Topics like Lead Generation, Prospect Qualification, Sales Presentation can be discussed with this completely editable template. It is available for immediate download depending on the needs and requirements of the user.

Company Sales Lead Qualification Procedure To Enhance Revenue Identifying The Best Framework Themes PDF
Purpose of the following side is to analyze the various framework of lead qualification, the provided tabular representation compares multiple framework on various metrics such as easy to use, sales process time etc. Deliver an awe inspiring pitch with this creative Company Sales Lead Qualification Procedure To Enhance Revenue Identifying The Best Framework Themes PDF bundle. Topics like Cost Implementation, Sales Process, Considerations The Organization can be discussed with this completely editable template. It is available for immediate download depending on the needs and requirements of the user.

KPI Dashboard To Track Automation Performance In Employee Onboarding Introduction PDF
The following slide outlines performance key performance indicator KPI which can be used to evaluate business process automation performance in employee onboarding. The metrics highlighted in the slide are onboarding completion status, hires per office, etc. Deliver an awe inspiring pitch with this creative KPI Dashboard To Track Automation Performance In Employee Onboarding Introduction PDF bundle. Topics like Onboarding Completion Status, Onboardings In Progress, Employee Onboarding can be discussed with this completely editable template. It is available for immediate download depending on the needs and requirements of the user.
Sales Lead Qualification Rating Framework Identifying The Best Framework For Our Sales Process Icons PDF
Purpose of the following side is to analyze the various framework of lead qualification, the provided tabular representation compares multiple framework on various metrics such as easy to use, sales process time etc.Deliver an awe inspiring pitch with this creative Sales Lead Qualification Rating Framework Identifying The Best Framework For Our Sales Process Icons PDF bundle. Topics like Considerations Organization, Lead Qualification, Cost Implementation can be discussed with this completely editable template. It is available for immediate download depending on the needs and requirements of the user.
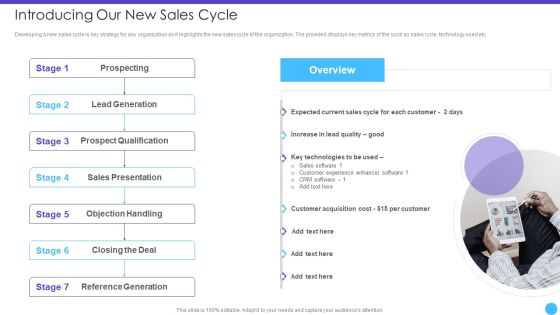
Sales Lead Qualification Rating Framework Introducing Our New Sales Cycle Structure PDF
Developing a new sales cycle is key strategy for any organization as it highlights the new sales cycle of the organization. The provided displays key metrics of the such as sales cycle, technology used etc.This is a Sales Lead Qualification Rating Framework Introducing Our New Sales Cycle Structure PDF template with various stages. Focus and dispense information on seven stages using this creative set, that comes with editable features. It contains large content boxes to add your information on topics like Prospecting, Lead Generation, Prospect Qualification You can also showcase facts, figures, and other relevant content using this PPT layout. Grab it now.

Sales Lead Qualification Procedure And Parameter Introducing Our New Sales Cycle Microsoft PDF
Developing a new sales cycle is key strategy for any organization as it highlights the new sales cycle of the organization. The provided displays key metrics of the such as sales cycle, technology used etc.This is a Sales Lead Qualification Procedure And Parameter Introducing Our New Sales Cycle Microsoft PDF template with various stages. Focus and dispense information on one stage using this creative set, that comes with editable features. It contains large content boxes to add your information on topics like Prospect Qualification, Sales Presentation, Objection Handling You can also showcase facts, figures, and other relevant content using this PPT layout. Grab it now.
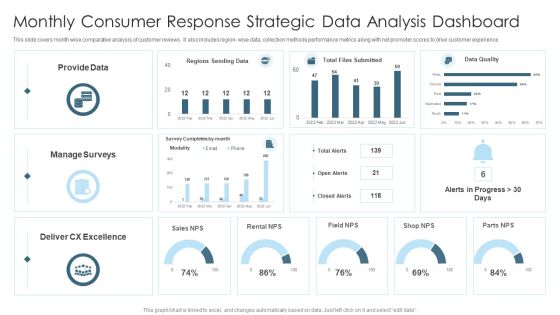
Monthly Consumer Response Strategic Data Analysis Dashboard Graphics PDF
This slide covers month wise comparative analysis of customer reviews . It also includes region wise data, collection methods performance metrics along with net promoter scores to drive customer experience. Showcasing this set of slides titled Monthly Consumer Response Strategic Data Analysis Dashboard Graphics PDF. The topics addressed in these templates are Provide Data, Sales, Manage Surveys. All the content presented in this PPT design is completely editable. Download it and make adjustments in color, background, font etc. as per your unique business setting.

KPI Dashboard Of Real Estate Customer Relationship Management Pictures PDF
This slide represents the dashboard generated through CRM software used in a real estate company. It shows details related to key performance metrics such as leads by source, closed and pending transactions, projected monthly sales volume etc. Showcasing this set of slides titled KPI Dashboard Of Real Estate Customer Relationship Management Pictures PDF. The topics addressed in these templates are Projected Monthly Sales Volume, Leads By Source, Annual Commissions. All the content presented in this PPT design is completely editable. Download it and make adjustments in color, background, font etc. as per your unique business setting.

Agile Human Resource Transformation KPI Dashboard Microsoft PDF
This slide highlights the impact of agile HR transformation to analyze the key performing areas. The dashboard includes key metrics showcasing employee headcount, diversity, hiring status, leave days and the termination data. Showcasing this set of slides titled Agile Human Resource Transformation KPI Dashboard Microsoft PDF. The topics addressed in these templates are Employees, Diversity, Hiring, Leave Days, Termination. All the content presented in this PPT design is completely editable. Download it and make adjustments in color, background, font etc. as per your unique business setting.
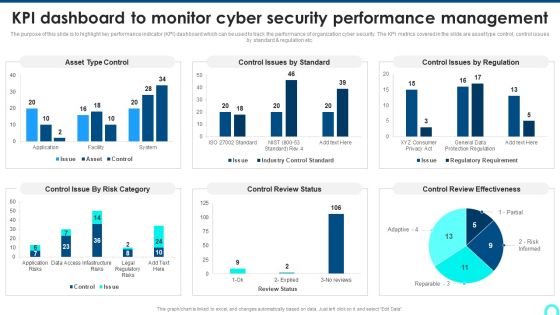
KPI Dashboard To Monitor Cyber Security Performance Management Background PDF
The purpose of this slide is to highlight key performance indicator KPI dashboard which can be used to track the performance of organization cyber security. The KPI metrics covered in the slide are asset type control, control issues by standard and regulation etc.Deliver and pitch your topic in the best possible manner with this KPI Dashboard To Monitor Cyber Security Performance Management Background PDF. Use them to share invaluable insights on Control Issue, Control Review, Review Effectiveness and impress your audience. This template can be altered and modified as per your expectations. So, grab it now.

Standard Operating Procedures Marketing Standard Operating Procedure Of Global Marketing Campaign Infographics PDF
This slide showcases the standard operating steps of social media marketing. It includes steps such as identifying customer, analyze social presence, key metrics and develop engaging content. Presenting Standard Operating Procedures Marketing Standard Operating Procedure Of Global Marketing Campaign Infographics PDF to dispense important information. This template comprises seven stages. It also presents valuable insights into the topics including Creating Mission Statement, Analyze And Optimize, Develop Engaging Content. This is a completely customizable PowerPoint theme that can be put to use immediately. So, download it and address the topic impactfully.

Sales Automation Procedure Comparative Assessment Of Sales Performance With Competitors Demonstration PDF
This slide shows the comparative assessment of sales performance with competitors based on certain metrics such as lead qualification rate, ,marketing effectiveness, sales forecast accuracy, pipeline thickness, etc. Deliver and pitch your topic in the best possible manner with this Sales Automation Procedure Comparative Assessment Of Sales Performance With Competitors Demonstration PDF. Use them to share invaluable insights on Industry Benchmark, Our Company, Marketing Effectiveness and impress your audience. This template can be altered and modified as per your expectations. So, grab it now.

5 Year Growth Strategy Of Corporate Post Covid Ppt PowerPoint Presentation Slides Guidelines PDF
This slide covers growth plan of firm post covid for business to sustain in the market. key metrics included are increase in productivity, market share, CSR activities and innovation.Persuade your audience using this 5 Year Growth Strategy Of Corporate Post Covid Ppt PowerPoint Presentation Slides Guidelines PDF. This PPT design covers one stages, thus making it a great tool to use. It also caters to a variety of topics including Increase Market, Increase In Innovation, CSR Activities. Download this PPT design now to present a convincing pitch that not only emphasizes the topic but also showcases your presentation skills.

Supply Chain Approaches Why Do We Needsupply Chain Modelling Diagrams PDF
This slide shows the need of supply chain modelling which includes greater stock control, greater efficiency and reduces costs, greater accuracy in supply chain logistics, etc.Presenting Supply Chain Approaches Why Do We Needsupply Chain Modelling Diagrams PDF to provide visual cues and insights. Share and navigate important information on three stages that need your due attention. This template can be used to pitch topics like Determining Require, Inventory Level According, Metrics Resulting. In addtion, this PPT design contains high resolution images, graphics, etc, that are easily editable and available for immediate download.
Online Customer Interaction Dashboard For Tracking Customer Service Team Performance Infographics PDF
This slide covers the KPI dashboard for analyzing the performance of client support department. It includes metrics such as first call resolution, unresolved calls, average response rate, the best day to call, average time to solve issues, etc. Deliver and pitch your topic in the best possible manner with this Online Customer Interaction Dashboard For Tracking Customer Service Team Performance Infographics PDF. Use them to share invaluable insights on Response Time, Issue Solving, Call Resolution and impress your audience. This template can be altered and modified as per your expectations. So, grab it now.

Stream Processing Dashboard With Incidents Status Ppt PowerPoint Presentation Gallery Portrait PDF
The following slide outlines a KPI dashboard of data ingestion. The dashboard covers key metrics such as incidents by category and severity, contributing cause, root cause, incident trends and status, etc. Showcasing this set of slides titled Stream Processing Dashboard With Incidents Status Ppt PowerPoint Presentation Gallery Portrait PDF. The topics addressed in these templates are Incidens, Category And Severity, Incidents By Facility, Contributing Cause. All the content presented in this PPT design is completely editable. Download it and make adjustments in color, background, font etc. as per your unique business setting.

Competitive Sales Strategy Development Plan For Revenue Growth Comparative Assessment Of Sales Professional PDF
This slide shows the comparative assessment of sales performance metrics such as total revenue, average revenue per customer, market share, win rate, year-over-year growth, customer lifetime value, etc. Deliver and pitch your topic in the best possible manner with this Competitive Sales Strategy Development Plan For Revenue Growth Comparative Assessment Of Sales Professional PDF. Use them to share invaluable insights on Total Revenue, Market Share, Customer Lifetime Value and impress your audience. This template can be altered and modified as per your expectations. So, grab it now.
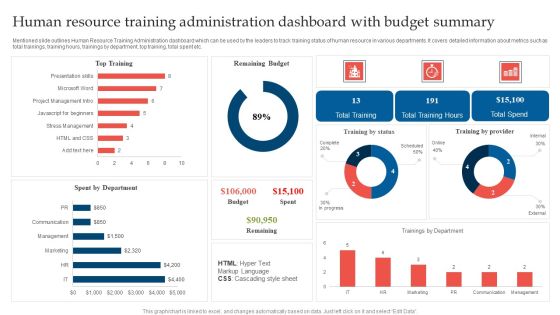
Human Resource Training Administration Dashboard With Budget Summary Microsoft PDF
Mentioned slide outlines Human Resource Training Administration dashboard which can be used by the leaders to track training status of human resource in various departments. It covers detailed information about metrics such as total trainings, training hours, trainings by department, top training, total spent etc. Showcasing this set of slides titled Human Resource Training Administration Dashboard With Budget Summary Microsoft PDF. The topics addressed in these templates are Remaining Budget, Top Training, Spent Department. All the content presented in this PPT design is completely editable. Download it and make adjustments in color, background, font etc. as per your unique business setting.

Kpi Dashboard Highlighting Results Of Human Resource Training Administration Background PDF
Mentioned slide outlines a dashboard through which the organization can track and evaluate the results of Human Resource Training Administration. It provides information about metrics such as training budget, total cost, cost per participant, total hours of training, etc. Showcasing this set of slides titled Kpi Dashboard Highlighting Results Of Human Resource Training Administration Background PDF. The topics addressed in these templates are Actual Cost Vs, Training Budget, Approved Training Budget, Online Training. All the content presented in this PPT design is completely editable. Download it and make adjustments in color, background, font etc. as per your unique business setting.

Comparative Assessment Of Sales Performance With Competitors Infographics PDF
This slide shows the comparative assessment of sales performance with competitors on the basis of certain metrics such as lead qualification rate, marketing effectiveness, sales forecast accuracy, pipeline thickness, etc. Presenting Comparative Assessment Of Sales Performance With Competitors Infographics PDF to provide visual cues and insights. Share and navigate important information on five stages that need your due attention. This template can be used to pitch topics like Industry Benchmark, Marketing Effectiveness, Sales Forecast Accuracy. In addtion, this PPT design contains high resolution images, graphics, etc, that are easily editable and available for immediate download.

Customer Relationship Management Software CRM Dashboard For Tracking Sales Pipeline Background PDF
This slide covers the CRM KPI dashboard for monitoring lead status in the sales funnel. It includes metrics such as open pipeline value, open pipeline by product package, pipeline value forecast, etc. Deliver and pitch your topic in the best possible manner with this Customer Relationship Management Software CRM Dashboard For Tracking Sales Pipeline Background PDF. Use them to share invaluable insights on Product Package, Pipeline Value, Value Forecast and impress your audience. This template can be altered and modified as per your expectations. So, grab it now.

CRM System Implementation Stages CRM Dashboard For Tracking Sales Pipeline Background PDF
This slide covers the CRM KPI dashboard for monitoring lead status in the sales funnel. It includes metrics such as open pipeline value, open pipeline by product package, pipeline value forecast, etc. Deliver and pitch your topic in the best possible manner with this CRM System Implementation Stages CRM Dashboard For Tracking Sales Pipeline Background PDF. Use them to share invaluable insights on Pipeline Value, Value Forecast, Sales Opportunities and impress your audience. This template can be altered and modified as per your expectations. So, grab it now.
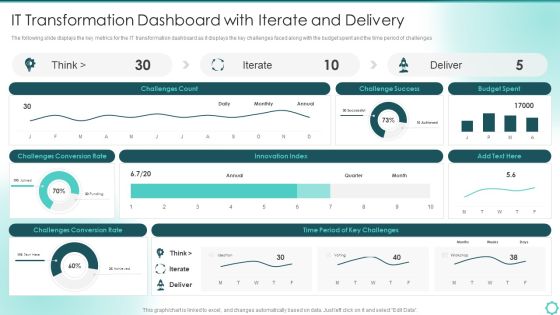
Digitalization Of Transportation Enterprise IT Transformation Dashboard With Iterate And Delivery Designs PDF
The following slide displays the key metrics for the IT transformation dashboard as it displays the key challenges faced along with the budget spent and the time period of challenges. Deliver and pitch your topic in the best possible manner with this Digitalization Of Transportation Enterprise IT Transformation Dashboard With Iterate And Delivery Designs PDF. Use them to share invaluable insights on Innovation Index, Budget Spent, Conversion Rate and impress your audience. This template can be altered and modified as per your expectations. So, grab it now.
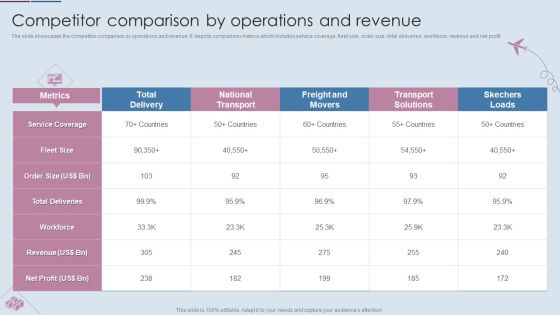
Logistics Shipment Company Profile Competitor Comparison By Operations And Revenue Brochure PDF
The slide showcases the competitor comparison by operations and revenue. It depicts comparison metrics which includes service coverage, fleet size, order size, total deliveries, workforce, revenue and net profit. Deliver and pitch your topic in the best possible manner with this Logistics Shipment Company Profile Competitor Comparison By Operations And Revenue Brochure PDF. Use them to share invaluable insights on Service Coverage, Order Size, Total Deliveries and impress your audience. This template can be altered and modified as per your expectations. So, grab it now.
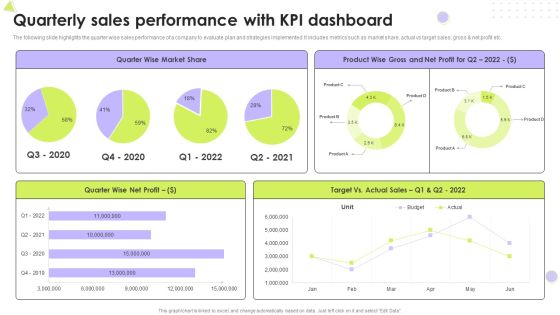
Quarterly Sales Performance With Kpi Dashboard Introduction PDF
The following slide highlights the quarter wise sales performance of a company to evaluate plan and strategies implemented. It includes metrics such as market share, actual vs target sales, gross and net profit etc. Pitch your topic with ease and precision using this Quarterly Sales Performance With Kpi Dashboard Introduction PDF. This layout presents information on Market Share, Net Profit, Target. It is also available for immediate download and adjustment. So, changes can be made in the color, design, graphics or any other component to create a unique layout.
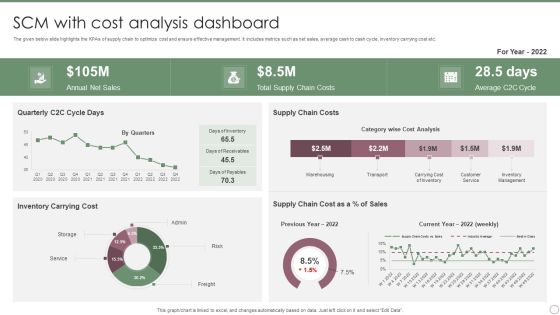
SCM With Cost Analysis Dashboard Ppt PowerPoint Presentation File Slides PDF
The given below slide highlights the KPAs of supply chain to optimize cost and ensure effective management. It includes metrics such as net sales, average cash to cash cycle, inventory carrying cost etc. Showcasing this set of slides titled SCM With Cost Analysis Dashboard Ppt PowerPoint Presentation File Slides PDF. The topics addressed in these templates are Annual Net Sales, Total Supply Chain, Costs, Average C2C Cycle. All the content presented in this PPT design is completely editable. Download it and make adjustments in color, background, font etc. as per your unique business setting.

CRM System Deployment Plan CRM Dashboard For Tracking Sales Pipeline Pictures PDF
This slide covers the CRM KPI dashboard for monitoring lead status in the sales funnel. It includes metrics such as open pipeline value, open pipeline by product package, pipeline value forecast, etc. Deliver an awe inspiring pitch with this creative CRM System Deployment Plan CRM Dashboard For Tracking Sales Pipeline Pictures PDF bundle. Topics like Pipeline Value Forecast, Open Pipeline Value, Branding can be discussed with this completely editable template. It is available for immediate download depending on the needs and requirements of the user.

Implementing Marketing Mix Strategy To Enhance Overall Performance Competitor Benchmarking For Effective Analysis Themes PDF
Competitive benchmarking is a technique used by multiple organizations to understand the basic industry standards, the following slide helps the organization in understanding competitive benchmarking by carefully analyzing various metrics of the competitors. Deliver and pitch your topic in the best possible manner with this Implementing Marketing Mix Strategy To Enhance Overall Performance Competitor Benchmarking For Effective Analysis Themes PDF. Use them to share invaluable insights on Purchase, Bounce Rate, Effective Analysis and impress your audience. This template can be altered and modified as per your expectations. So, grab it now.

Essential Key Performance Indicators In Investment Summary Demonstration PDF
The following slide showcases dashboard of portfolio summary with important key performance indicators to provide an oversight of the project. Key metrics covered are cost, work, variance, active risk and issues. Showcasing this set of slides titled Essential Key Performance Indicators In Investment Summary Demonstration PDF. The topics addressed in these templates are Cost, Active Risks, Projects. All the content presented in this PPT design is completely editable. Download it and make adjustments in color, background, font etc. as per your unique business setting.

Prospective Buyer Retention Dashboard With Key Performance Indicators Themes PDF
This slide shows the dashboard representing the key performance metrics for retention of potential customers of the organization. It shows no. of active users, churn rate, cost of customer acquisition, their life time value, monthly recurring revenue etc.Pitch your topic with ease and precision using this Prospective Buyer Retention Dashboard With Key Performance Indicators Themes PDF. This layout presents information on Recurring Revenue, Revenue Growth, Customer Acquisition. It is also available for immediate download and adjustment. So, changes can be made in the color, design, graphics or any other component to create a unique layout.
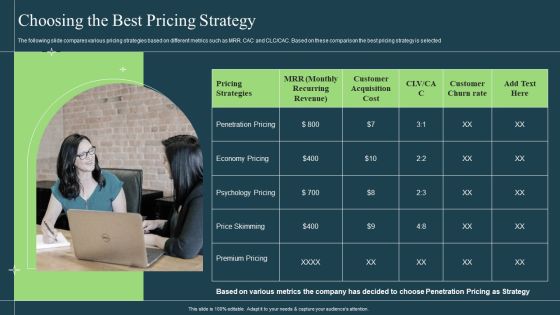
Differentiation Techniques Ways To Surpass Competitors Choosing The Best Pricing Strategy Topics PDF
The following slide compares various pricing strategies based on different metrics such as MRR. CAC and CLC or CAC. Based on these comparison the best pricing strategy is selected. This is a Differentiation Techniques Ways To Surpass Competitors Choosing The Best Pricing Strategy Topics PDF template with various stages. Focus and dispense information on one stages using this creative set, that comes with editable features. It contains large content boxes to add your information on topics like Pricing Strategies, Economy Pricing, Price Skimming. You can also showcase facts, figures, and other relevant content using this PPT layout. Grab it now.

Brand Promotion Communication Strategy Dashboard For Analyzing Brand Perception Introduction PDF
This slide covers the dashboard for tracking brand reputation. It also includes metrics such as new customer lifetime value, customer acquisition cost, target met, above sales target, average weekly sales revenue, etc. Deliver an awe inspiring pitch with this creative Brand Promotion Communication Strategy Dashboard For Analyzing Brand Perception Introduction PDF bundle. Topics like New customer YTD, Sales revenue YTD, Profit YTD can be discussed with this completely editable template. It is available for immediate download depending on the needs and requirements of the user.

Automation Project Status Dashboard Of Consulting Firm Report Background PDF
This slide showcases project status dashboard that provides a concise visual of key indicators progress and allow to compare actual performance with pre-built objectives. Key metrics covered are cost performance, time v or s project phase, timeline v or s resource capacity. Showcasing this set of slides titled Automation Project Status Dashboard Of Consulting Firm Report Background PDF. The topics addressed in these templates are Project Phase, Planned Value, Cost Performance Index. All the content presented in this PPT design is completely editable. Download it and make adjustments in color, background, font etc. as per your unique business setting.

Organic Business Growth Strategies Dashboard To Analyse Organic Growth Post Global Expansion Background PDF
Purpose of the following slide is to display a dashboard to help analyze the organic growth through essential metrics such as actual vs. target sales, gross profit, sales growth etc. Deliver and pitch your topic in the best possible manner with this Organic Business Growth Strategies Dashboard To Analyse Organic Growth Post Global Expansion Background PDF. Use them to share invaluable insights on Sales, Product, Target and impress your audience. This template can be altered and modified as per your expectations. So, grab it now.

Audience Satisfaction Study On Virtual Event Experience Inspiration PDF
This slide covers survey outcomes for audience satisfaction with virtual events. It includes metrics such as opinions on date and time, ease of accessibility, reviews on event speakers, breakout sessions, networking, sponsors and exhibitors, etc. Showcasing this set of slides titled Audience Satisfaction Study On Virtual Event Experience Inspiration PDF. The topics addressed in these templates are Networking, Audience Satisfaction Study, Virtual Event Experience. All the content presented in this PPT design is completely editable. Download it and make adjustments in color, background, font etc. as per your unique business setting.

Dashboard For Tracking Customer Service Team Performance Clipart PDF
This slide covers the KPI dashboard for analyzing the performance of client support department. It includes metrics such as first call resolution, unresolved calls, average response rate, the best day to call, average time to solve issues, etc. Deliver an awe inspiring pitch with this creative Dashboard For Tracking Customer Service Team Performance Clipart PDF bundle. Topics like Dashboard For Tracking Customer, Service Team Performance can be discussed with this completely editable template. It is available for immediate download depending on the needs and requirements of the user.

Dashboard For E Commerce Project Management Ppt Ideas Design Inspiration PDF
Mentioned slide illustrates a dashboard which can be used by company for e-Commerce project management. The various metrics mentioned in the slide are new orders, total revenue, expenses, new users, etc. Showcasing this set of slides titled Dashboard For E Commerce Project Management Ppt Ideas Design Inspiration PDF. The topics addressed in these templates are New Orders, Total Income, Total Expense. All the content presented in this PPT design is completely editable. Download it and make adjustments in color, background, font etc. as per your unique business setting.

Video Promotion Techniques To Enhance Business Revenue Ppt Inspiration PDF
This slide signifies the video marketing approach to increase organisation revenue. It covers information regarding to the metrics like engagement rate, view count, play rate, social sharing and feedback. Showcasing this set of slides titled Video Promotion Techniques To Enhance Business Revenue Ppt Inspiration PDF. The topics addressed in these templates are Engagement Rate, View Count, Play Rate. All the content presented in this PPT design is completely editable. Download it and make adjustments in color, background, font etc. as per your unique business setting.

Yearly Company Financial Performance Indicators Of Organization Ppt Infographics Outline PDF
This slide showcases to past years values of organization for future prediction. Key metrics covered are revenue, net profit, cash flow, sales and EBITDA. Persuade your audience using this Yearly Company Financial Performance Indicators Of Organization Ppt Infographics Outline PDF. This PPT design covers five stages, thus making it a great tool to use. It also caters to a variety of topics including Revenue, Net Profit, Cash Flow. Download this PPT design now to present a convincing pitch that not only emphasizes the topic but also showcases your presentation skills.

Key Findings Of Consumer Intelligence Analytics Ppt PowerPoint Presentation Icon Model PDF
Following slide highlights consumer intelligence analytics findings that can be used by organization to understand individual customer needs and wants. Customer analytics findings include metrics such as customer name, tenure days, transaction usage, NPS, churn probability, churn prediction and required actions to be taken. Pitch your topic with ease and precision using this Key Findings Of Consumer Intelligence Analytics Ppt PowerPoint Presentation Icon Model PDF. This layout presents information on Customer, Tenure days, Transition Usage. It is also available for immediate download and adjustment. So, changes can be made in the color, design, graphics or any other component to create a unique layout.
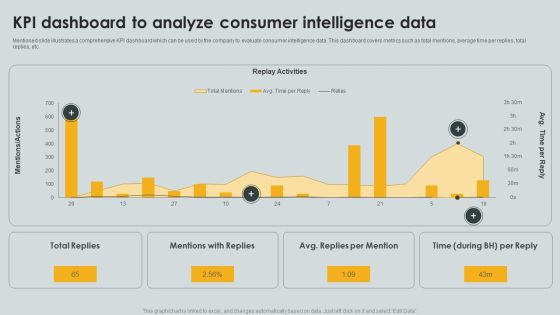
KPI Dashboard To Analyze Consumer Intelligence Data Ppt PowerPoint Presentation File Portfolio PDF
Mentioned slide illustrates a comprehensive KPI dashboard which can be used by the company to evaluate consumer intelligence data. This dashboard covers metrics such as total mentions, average time per replies, total replies, etc. Pitch your topic with ease and precision using this KPI Dashboard To Analyze Consumer Intelligence Data Ppt PowerPoint Presentation File Portfolio PDF. This layout presents information on Replay Activities, Total Replies, Mentions Replies. It is also available for immediate download and adjustment. So, changes can be made in the color, design, graphics or any other component to create a unique layout.

Key Parameters For Customer Behavior Analytics Ppt Infographics Summary PDF
The following slide showcases key metrics to analyze customer buying pattern to help firm understand behavior of consumer and expand their target audience. Main indicators covered are place, items, time and frequency of purchase. Pitch your topic with ease and precision using this Key Parameters For Customer Behavior Analytics Ppt Infographics Summary PDF. This layout presents information on Demographics, Engagement, Purchase. It is also available for immediate download and adjustment. So, changes can be made in the color, design, graphics or any other component to create a unique layout.

Best Practices To Secure Internet Of Things Network Gateway Ppt Outline Elements PDF
The following slide showcases best practices to secure IOT gateway that are device establishment, establishing strong identity and provide identity to ecosystem. Presenting Best Practices To Secure Internet Of Things Network Gateway Ppt Outline Elements PDF to dispense important information. This template comprises one stages. It also presents valuable insights into the topics including Performance Metrics For Project Management Office, Requirement Gathering. This is a completely customizable PowerPoint theme that can be put to use immediately. So, download it and address the topic impactfully.

KPI Dashboard To Track Automation Performance In Employee Onboarding Achieving Operational Efficiency Download PDF
The following slide outlines performance key performance indicator KPI which can be used to evaluate business process automation performance in employee onboarding. The metrics highlighted in the slide are onboarding completion status, hires per office, etc.Deliver an awe inspiring pitch with this creative KPI Dashboard To Track Automation Performance In Employee Onboarding Achieving Operational Efficiency Download PDF bundle. Topics like Onboarding Completion, Onboarding, Onboarding Completion can be discussed with this completely editable template. It is available for immediate download depending on the needs and requirements of the user.
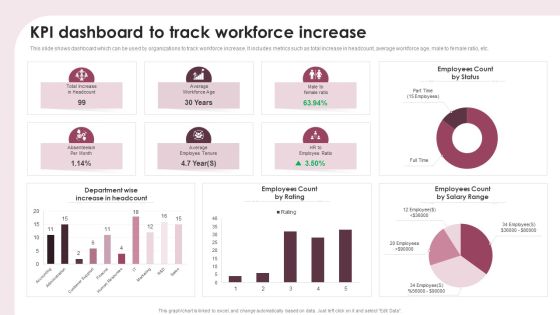
KPI Dashboard To Track Workforce Increase Ppt Show Portfolio PDF
This slide shows dashboard which can be used by organizations to track workforce increase. It includes metrics such as total increase in headcount, average workforce age, male to female ratio, etc. Pitch your topic with ease and precision using this KPI Dashboard To Track Workforce Increase Ppt Show Portfolio PDF. This layout presents information on Department Wise, Increase Headcount, Employees Count Rating. It is also available for immediate download and adjustment. So, changes can be made in the color, design, graphics or any other component to create a unique layout.
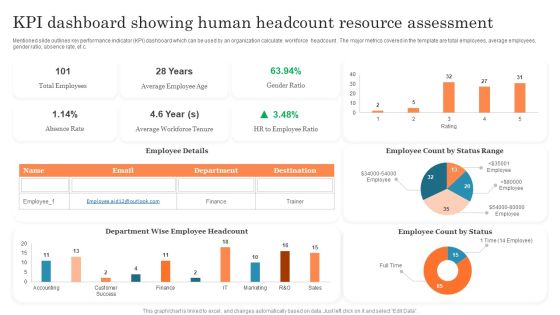
KPI Dashboard Showing Human Headcount Resource Assessment Ppt PowerPoint Presentation Outline PDF
Mentioned slide outlines key performance indicator KPI dashboard which can be used by an organization calculate workforce headcount . The major metrics covered in the template are total employees, average employees, gender ratio, absence rate, etc. Pitch your topic with ease and precision using this KPI Dashboard Showing Human Headcount Resource Assessment Ppt PowerPoint Presentation Outline PDF. This layout presents information on Total Employees, Average Employee, Employee Count. It is also available for immediate download and adjustment. So, changes can be made in the color, design, graphics or any other component to create a unique layout.

R2R Dashboard With Income Statement Ppt PowerPoint Presentation Show Slide Download PDF
Following slide outlines a comprehensive R2R dashboard used for taking financial decisions. The various metrics covered in this slide are total income, expenses, net profit, cash at end of month, income and expenses, quick ratio, current ratio etc.Showcasing this set of slides titled R2R Dashboard With Income Statement Ppt PowerPoint Presentation Show Slide Download PDF. The topics addressed in these templates are Operating Expenses, Total Experience, Accounts Receivable. All the content presented in this PPT design is completely editable. Download it and make adjustments in color, background, font etc. as per your unique business setting.

Addressing Present Performance Delivery Gap Improving Distribution Channel Download PDF
This slide provides information regarding the present delivery gap that firm is facing in terms of its performance as compared to the industry standards. The firms performance is assessed on metrics such as response rate, forecast accuracy, lead qualification rate, etc. Deliver and pitch your topic in the best possible manner with this Addressing Present Performance Delivery Gap Improving Distribution Channel Download PDF. Use them to share invaluable insights on Marketing Effectiveness, Forecast Accuracy, Sales Effectiveness and impress your audience. This template can be altered and modified as per your expectations. So, grab it now.

Investment Project KPI Dashboard With Labor Hour And Cost Analysis Portrait PDF
This slide displays KPI dashboard for project health analysis. It also include metrics such as total projects, cost, progress, status, projects by highest actual hours, highest actual labour cost, highest actual non-labour cost, etc. Pitch your topic with ease and precision using this Investment Project KPI Dashboard With Labor Hour And Cost Analysis Portrait PDF. This layout presents information on Project Health, Project Progress, Project Status. It is also available for immediate download and adjustment. So, changes can be made in the color, design, graphics or any other component to create a unique layout.

Investment Project Performance Analysis KPI Dashboard Professional PDF
This slide showcases KPI dashboard for project planning and resource allocation. It also include metrics such as invested amount, return amount, NPV, return to investor, annualized IRR, ROI, payback period, etc. Pitch your topic with ease and precision using this Investment Project Performance Analysis KPI Dashboard Professional PDF. This layout presents information on Project Cash Flows, Project Performance, Innovation Lab. It is also available for immediate download and adjustment. So, changes can be made in the color, design, graphics or any other component to create a unique layout.
Monthly Project Investment Expense Tracking KPI Dashboard Themes PDF
This slide showcases KPI dashboard for analysing the variance between billed and budgeted expenses. It also include metrics such as project budget, potential, billed, cost, margin billed vs. budget labour cost, hours details by resources, etc. Pitch your topic with ease and precision using this Monthly Project Investment Expense Tracking KPI Dashboard Themes PDF. This layout presents information on Project Summary, Sales Potential. It is also available for immediate download and adjustment. So, changes can be made in the color, design, graphics or any other component to create a unique layout.

Consumer Journey Mapping Techniques Dashboard For Tracking Customer Service Team Performance Summary PDF
This slide covers the KPI dashboard for analyzing the performance of client support department. It includes metrics such as first call resolution, unresolved calls, average response rate, the best day to call, average time to solve issues, etc. Pitch your topic with ease and precision using this Consumer Journey Mapping Techniques Dashboard For Tracking Customer Service Team Performance Summary PDF. This layout presents information on Dashboard For Tracking Customer, Service Team Performance. It is also available for immediate download and adjustment. So, changes can be made in the color, design, graphics or any other component to create a unique layout.

Consumer Journey Mapping Techniques Dashboard For Tracking Digital Content Performance Clipart PDF
This slide covers the KPI dashboard for analyzing online content. It includes metrics such as blog visitors, pageviews, newsletter conversion rate, new signups, new customers, etc. Showcasing this set of slides titled Consumer Journey Mapping Techniques Dashboard For Tracking Digital Content Performance Clipart PDF. The topics addressed in these templates are Purchase Amount, Customers, Tracking Digital Content Performance. All the content presented in this PPT design is completely editable. Download it and make adjustments in color, background, font etc. as per your unique business setting.

Consumer Journey Mapping Techniques Loyalty Program Performance Tracking Dashboard Portrait PDF
This slide covers the KPI dashboard for analyzing customer loyalty campaign results. It includes metrics such as revenue, liability, NQP accrued, transaction count, members, redemption ratio, etc. Pitch your topic with ease and precision using this Consumer Journey Mapping Techniques Loyalty Program Performance Tracking Dashboard Portrait PDF. This layout presents information on Transaction Count, Revenue, Redemption Ratio. It is also available for immediate download and adjustment. So, changes can be made in the color, design, graphics or any other component to create a unique layout.
Consumer Journey Mapping Techniques Referral Program Performance Tracking Dashboard Formats PDF
This slide covers the KPI dashboard for analyzing referral campaign results. It includes metrics such as total revenue generated, monthly recurring revenue, new customers, clicks, cancelled customers, paying customers, etc. Showcasing this set of slides titled Consumer Journey Mapping Techniques Referral Program Performance Tracking Dashboard Formats PDF. The topics addressed in these templates are Revenue, New Customers, Paying Customers. All the content presented in this PPT design is completely editable. Download it and make adjustments in color, background, font etc. as per your unique business setting.

Dashboard For Tracking Customer Service Team Performance Information PDF
This slide covers the KPI dashboard for analyzing the performance of client support department. It includes metrics such as first call resolution, unresolved calls, average response rate, the best day to call, average time to solve issues, etc. Deliver an awe inspiring pitch with this creative Dashboard For Tracking Customer Service Team Performance Information PDF bundle. Topics like Dashboard For Tracking Customer, Service Team Performance can be discussed with this completely editable template. It is available for immediate download depending on the needs and requirements of the user.

Quarterly Roadmap For Corporate Business Planning Icons PDF
This slide shows marketing strategy quarterly roadmap to enhance efficiency and determine opportunities. It include metrics of goals, revenue, number of devices to sale and strategies to achieve the set objectives. Presenting Quarterly Roadmap For Corporate Business Planning Icons PDF to dispense important information. This template comprises four stages. It also presents valuable insights into the topics including Identify Target Audience, Goal, Revenue. This is a completely customizable PowerPoint theme that can be put to use immediately. So, download it and address the topic impactfully.
 Home
Home