Metrics
Sales Techniques Playbook Sales Management Activities Tracking Dashboard Introduction PDF
This slide provides information regarding various metrics catered to track sales team performance in terms of average revenue per account, win rate, NPS, along with sales representative performance tracking through number of opportunities created, lead response time, etc. Deliver an awe inspiring pitch with this creative sales techniques playbook sales management activities tracking dashboard introduction pdf bundle. Topics like growth, sales can be discussed with this completely editable template. It is available for immediate download depending on the needs and requirements of the user.

Agile Group For Product Development Ways To Lead Product Management Team Portrait PDF
This slide shows the ways to lead product management team such as using metrics to set priorities, developing soft skills, creating product roadmap, strategize self improvement, etc. Presenting agile group for product development ways to lead product management team portrait pdf to provide visual cues and insights. Share and navigate important information on five stages that need your due attention. This template can be used to pitch topics like develop soft skills, strategize self improvement, embrace agile methodology to product management. In addtion, this PPT design contains high resolution images, graphics, etc, that are easily editable and available for immediate download.

Formulating Competitive Plan Of Action For Effective Product Leadership Inspiration PDF
This slide shows the ways to lead product management team such as using metrics to set priorities, developing soft skills, creating product roadmap, strategize self improvement, etc. Presenting formulating competitive plan of action for effective product leadership inspiration pdf to provide visual cues and insights. Share and navigate important information on five stages that need your due attention. This template can be used to pitch topics like skills, product, self improvement. In addtion, this PPT design contains high resolution images, graphics, etc, that are easily editable and available for immediate download.

Artificial Intelligence Gaming Industry Fund Raising Elevator Comparing Our Product Values Professional PDF
Purpose of the following slide is to compare our organization to our competitors as it highlights the key metrics on which we can compare such as Ease to use, space requirements etc. Deliver and pitch your topic in the best possible manner with this artificial intelligence gaming industry fund raising elevator comparing our product values professional pdf. Use them to share invaluable insights on comparing our product values in comparison to competitors and impress your audience. This template can be altered and modified as per your expectations. So, grab it now.
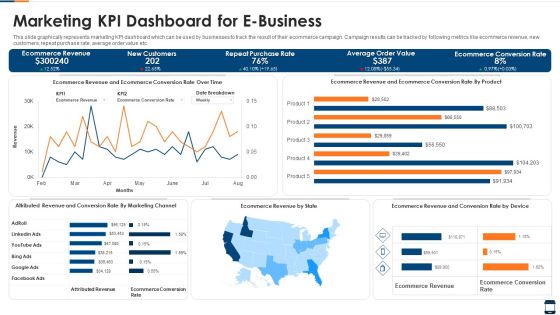
Marketing KPI Dashboard For E Business Brochure PDF
This slide graphically represents marketing KPI dashboard which can be used by businesses to track the result of their ecommerce campaign. Campaign results can be tracked by following metrics like ecommerce revenue, new customers, repeat purchase rate, average order value etc. Showcasing this set of slides titled marketing kpi dashboard for e business brochure pdf. The topics addressed in these templates are marketing kpi dashboard for e business. All the content presented in this PPT design is completely editable. Download it and make adjustments in color, background, font etc. as per your unique business setting.

Handling Cyber Threats Digital Era KPI Dashboard To Track Security Risk Events Ppt Inspiration PDF
This slide displays KPI dashboard that company will use to track multiple risk events. Metrics covered in the dashboard are residual risks by period and risk category by total risk rating. Deliver and pitch your topic in the best possible manner with this handling cyber threats digital era kpi dashboard to track security risk events ppt inspiration pdf. Use them to share invaluable insights on kpi dashboard to track security risk events and impress your audience. This template can be altered and modified as per your expectations. So, grab it now.
Marketing Playbook To Maximize ROI Sales Management Activities Tracking Dashboard Guidelines PDF
This slide provides information regarding various metrics catered to track sales team performance in terms of average revenue per account, win rate, NPS, along with sales representative performance tracking through number of opportunities created, lead response time, etc. Deliver and pitch your topic in the best possible manner with this marketing playbook to maximize roi sales management activities tracking dashboard guidelines pdf. Use them to share invaluable insights on closed business, sales pipeline, month over month growth, sales activity by sales rep and impress your audience. This template can be altered and modified as per your expectations. So, grab it now.

B2B Lead Generation Plan Addressing Performance Delivery Gap At Present Mockup PDF
This slide provides information regarding present performance delivery by assessing it on various performance metrics such as marketing spend on B2B account management, B2B accounts closed, conversion rate and comparing these to industry benchmarks and competitors performances. Deliver an awe inspiring pitch with this creative b2b lead generation plan addressing performance delivery gap at present mockup pdf bundle. Topics like addressing performance delivery gap at present can be discussed with this completely editable template. It is available for immediate download depending on the needs and requirements of the user.

Strategic Business Plan Effective Tools Vision Statement In Business Planning Pictures PDF
This slide covers the vision statement which plays an important role in business planning to achieve long term business goal. Presenting strategic business plan effective tools vision statement in business planning pictures pdf to provide visual cues and insights. Share and navigate important information on four stages that need your due attention. This template can be used to pitch topics like vision, ideal future, metrics success, vision statement. In addtion, this PPT design contains high resolution images, graphics, etc, that are easily editable and available for immediate download.
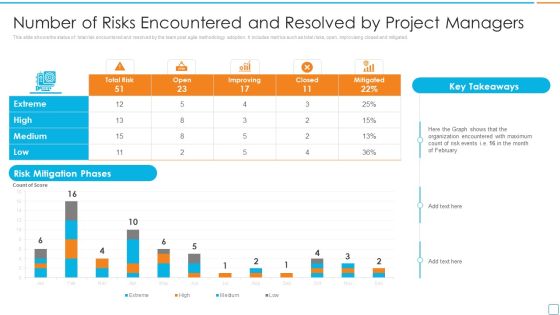
Professional Scrum Master Certification Number Of Risks Encountered And Resolved Inspiration PDF
This slide shows the status of total risk encountered and resolved by the team post agile methodology adoption. It includes metrics such as total risks, open, improvising closed and mitigated. Deliver an awe inspiring pitch with this creative professional scrum master certification number of risks encountered and resolved inspiration pdf bundle. Topics like risk mitigation phases, organization encountered, high, medium, low can be discussed with this completely editable template. It is available for immediate download depending on the needs and requirements of the user.
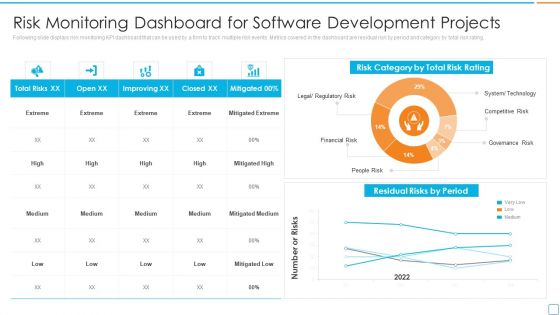
Professional Scrum Master Certification Risk Monitoring Dashboard For Software Development Portrait PDF
Following slide displays risk monitoring KPI dashboard that can be used by a firm to track multiple risk events. Metrics covered in the dashboard are residual risk by period and category by total risk rating. Deliver an awe inspiring pitch with this creative professional scrum master certification risk monitoring dashboard for software development portrait pdf bundle. Topics like residual risks by period, risk category, total risk rating can be discussed with this completely editable template. It is available for immediate download depending on the needs and requirements of the user.

Assuring Management In Product Innovation To Enhance Processes Ways To Lead Product Management Team Template PDF
This slide shows the ways to lead product management team such as using metrics to set priorities, developing soft skills, creating product roadmap, strategize self improvement, etc.Presenting assuring management in product innovation to enhance processes ways to lead product management team template pdf to provide visual cues and insights. Share and navigate important information on five stages that need your due attention. This template can be used to pitch topics like develop soft skills, create product roadmap, strategize self improvement In addtion, this PPT design contains high resolution images, graphics, etc, that are easily editable and available for immediate download.
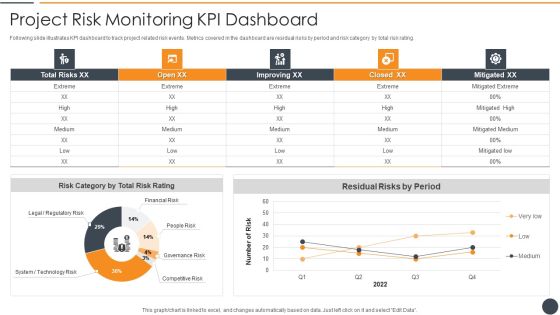
Effective Initiation Of Information Technology Project Project Risk Monitoring Kpi Dashboard Microsoft PDF
Following slide illustrates KPI dashboard to track project related risk events. Metrics covered in the dashboard are residual risks by period and risk category by total risk rating. Deliver and pitch your topic in the best possible manner with this effective initiation of information technology project project risk monitoring kpi dashboard microsoft pdf. Use them to share invaluable insights on mitigated extreme, residual risks by period, risk category by total risk rating and impress your audience. This template can be altered and modified as per your expectations. So, grab it now.

Data Safety Initiatives KPI Dashboard To Track Security Risk Events Portrait PDF
This slide displays KPI dashboard that company will use to track multiple risk events. Metrics covered in the dashboard are residual risks by period and risk category by total risk rating. Deliver and pitch your topic in the best possible manner with this data safety initiatives kpi dashboard to track security risk events portrait pdf. Use them to share invaluable insights on risk category, total risk rating, residual risk by period, technology risk and impress your audience. This template can be altered and modified as per your expectations. So, grab it now.

Social Network Training Program Success Summary Ppt Professional Slides PDF
Mentioned slide outlines success summary of social media training program organized at company premises. This slide provides information about training program metrics like employees registered, employees participated, social media activity etc. Pitch your topic with ease and precision using this social network training program success summary ppt professional slides pdf. This layout presents information on learning rate, success rate of training program, social media activity, employees participated. It is also available for immediate download and adjustment. So, changes can be made in the color, design, graphics or any other component to create a unique layout.
Email Marketing Dashboard Illustrating Campaign Performance Results Ppt PowerPoint Presentation File Icon PDF
Mentioned slide displays email campaign dashboard which can be used by marketers to track performance of their marketing campaigns. Marketers can track metrics such as total subscribers growth, overall bounce rate, unsubscribe rate, open rate, click rate etc. Showcasing this set of slides titled email marketing dashboard illustrating campaign performance results ppt powerpoint presentation file icon pdf. The topics addressed in these templates are marketing, list health, total subscribers, percentage. All the content presented in this PPT design is completely editable. Download it and make adjustments in color, background, font etc. as per your unique business setting.
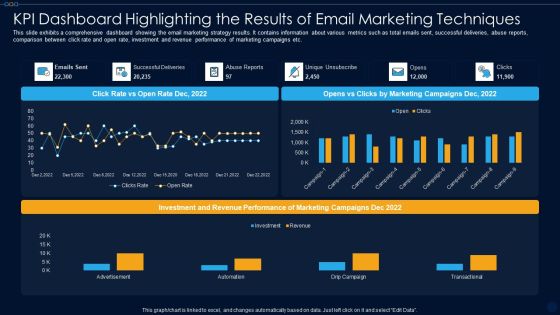
KPI Dashboard Highlighting The Results Of Email Marketing Techniques Ppt PowerPoint Presentation File Format PDF
This slide exhibits a comprehensive dashboard showing the email marketing strategy results. It contains information about various metrics such as total emails sent, successful deliveries, abuse reports, comparison between click rate and open rate, investment and revenue performance of marketing campaigns etc. Showcasing this set of slides titled kpi dashboard highlighting the results of email marketing techniques ppt powerpoint presentation file format pdf. The topics addressed in these templates are advertisement, automation, drip campaign, transactional. All the content presented in this PPT design is completely editable. Download it and make adjustments in color, background, font etc. as per your unique business setting.
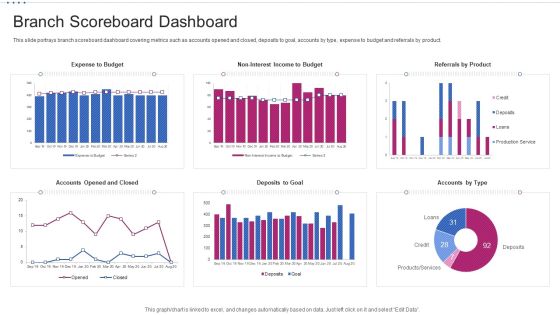
M Banking System Improving Consumer Branch Scoreboard Dashboard Demonstration PDF
This slide portrays branch scoreboard dashboard covering metrics such as accounts opened and closed, deposits to goal, accounts by type, expense to budget and referrals by product. Deliver an awe inspiring pitch with this creative m banking system improving consumer branch scoreboard dashboard demonstration pdf bundle. Topics like expense to budget, no interest income to budget, referrals by product, deposits to goal, accounts opened and closed can be discussed with this completely editable template. It is available for immediate download depending on the needs and requirements of the user.

Data Flowchart For Project QA Plan Ppt PowerPoint Presentation Gallery Show PDF
This slide depicts the data flowchart of project quality management plan which includes developing project management plan, identifying stakeholders, collecting requirements, identifying risks, project documents, quality metrics for controlling project quality, etc. Presenting data flowchart for project qa plan ppt powerpoint presentation gallery show pdf to dispense important information. This template comprises two stages. It also presents valuable insights into the topics including developing project management plan, identifying stakeholders, collecting requirements, identifying risks, project documents. This is a completely customizable PowerPoint theme that can be put to use immediately. So, download it and address the topic impactfully.
Salesman Principles Playbook Sales Management Activities Tracking Dashboard Ideas PDF
This slide provides information regarding various metrics catered to track sales team performance in terms of average revenue per account, win rate, NPS, along with sales representative performance tracking through number of opportunities created, lead response time, etc. Deliver and pitch your topic in the best possible manner with this salesman principles playbook sales management activities tracking dashboard ideas pdf Use them to share invaluable insights on sales management activities tracking dashboard and impress your audience. This template can be altered and modified as per your expectations. So, grab it now.
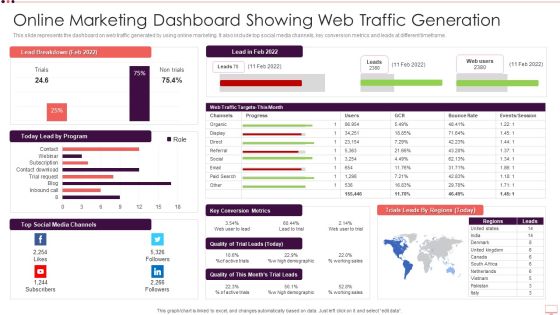
Online Marketing Dashboard Showing Web Traffic Generation Formats PDF
This slide represents the dashboard on web traffic generated by using online marketing. It also include top social media channels, key conversion metrics and leads at different timeframe. Showcasing this set of slides titled Online Marketing Dashboard Showing Web Traffic Generation Formats PDF. The topics addressed in these templates are Online Marketing Dashboard Showing Web Traffic Generation. All the content presented in this PPT design is completely editable. Download it and make adjustments in color, background, font etc. as per your unique business setting.
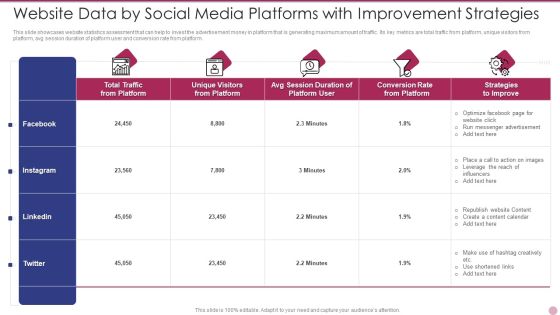
Website Data By Social Media Platforms With Improvement Strategies Diagrams PDF
This slide showcases website statistics assessment that can help to invest the advertisement money in platform that is generating maximum amount of traffic. Its key metrics are total traffic from platform, unique visitors from platform, avg session duration of platform user and conversion rate from platform. Showcasing this set of slides titled Website Data By Social Media Platforms With Improvement Strategies Diagrams PDF. The topics addressed in these templates are Strategies To Improve, Advertisement, Optimize. All the content presented in this PPT design is completely editable. Download it and make adjustments in color, background, font etc. as per your unique business setting.
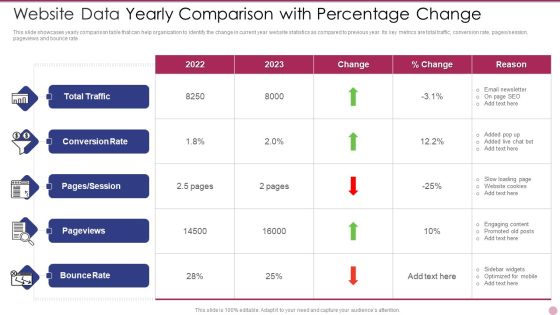
Website Data Yearly Comparison With Percentage Change Formats PDF
This slide showcases yearly comparison table that can help organization to identify the change in current year website statistics as compared to previous year. Its key metrics are total traffic, conversion rate, pages or session, pageviews and bounce rate. Pitch your topic with ease and precision using this Website Data Yearly Comparison With Percentage Change Formats PDF. This layout presents information on Website Data Yearly Comparison With Percentage Change. It is also available for immediate download and adjustment. So, changes can be made in the color, design, graphics or any other component to create a unique layout.

Innovation Procedure For Online Business IT Transformation Dashboard With Iterate And Delivery Infographics PDF
The following slide displays the key metrics for the IT transformation dashboard as it displays the key challenges faced along with the budget spent and the time period of challenges Deliver an awe inspiring pitch with this creative Innovation Procedure For Online Business IT Transformation Dashboard With Iterate And Delivery Infographics PDF bundle. Topics like IT Transformation Dashboard With Iterate And Delivery can be discussed with this completely editable template. It is available for immediate download depending on the needs and requirements of the user.
Sales Management Playbook Sales Management Activities Tracking Dashboard Themes PDF
This slide provides information regarding various metrics catered to track sales team performance in terms of average revenue per account, win rate, NPS, along with sales representative performance tracking through number of opportunities created, lead response time, etc. Deliver an awe inspiring pitch with this creative Sales Management Playbook Sales Management Activities Tracking Dashboard Themes PDF bundle. Topics like Sales Management Activities Tracking Dashboard can be discussed with this completely editable template. It is available for immediate download depending on the needs and requirements of the user.
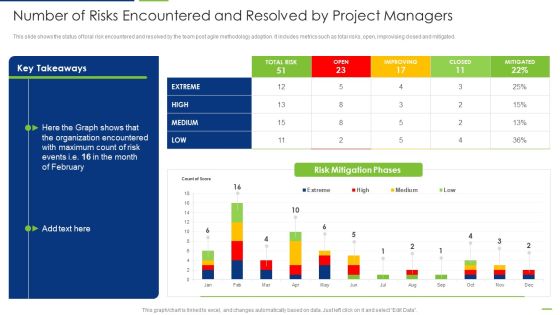
Professional Scrum Master Number Of Risks Encountered And Resolved By Project Managers Infographics PDF
This slide shows the status of toral risk encountered and resolved by the team post agile methodology adoption. It includes metrics such as total risks, open, improvising closed and mitigated. Deliver an awe inspiring pitch with this creative Professional Scrum Master Number Of Risks Encountered And Resolved By Project Managers Infographics PDF bundle. Topics like Risk Mitigation Phases, Organization Encountered, High, Low, Medium can be discussed with this completely editable template. It is available for immediate download depending on the needs and requirements of the user.

Professional Scrum Master Risk Monitoring Dashboard For Software Development Projects Designs PDF
Following slide displays risk monitoring KPI dashboard that can be used by a firm to track multiple risk events. Metrics covered in the dashboard are residual risk by period and category by total risk rating. Deliver an awe inspiring pitch with this creative Professional Scrum Master Risk Monitoring Dashboard For Software Development Projects Designs PDF bundle. Topics like Residual Risks By Period, Risk Category By Total Risk Rating, Total Risks can be discussed with this completely editable template. It is available for immediate download depending on the needs and requirements of the user.

BI Software Vendor Scan With Evaluation BI Transformation Toolset Brochure PDF
This slide tabulates the vendor performance on multiple metrics such as cost, after-sale services. Also, a comparative analysis of vendors for business intelligence solutions is performed by scoring them on key attributes. Presenting BI Software Vendor Scan With Evaluation BI Transformation Toolset Brochure PDF to provide visual cues and insights. Share and navigate important information on one stages that need your due attention. This template can be used to pitch topics like Evaluation Parameters, Costing, After Sale Services. In addtion, this PPT design contains high resolution images, graphics, etc, that are easily editable and available for immediate download.

Agile And Waterfall Methods For Development And Administration Of E Commerce Venture Template PDF
The following slide highlights the agile and waterfall methods for planning and managing ecommerce project illustrating metrics to compare agile and waterfall methods for functions which includes planning, development process, application testing, delivery time, budget, modification, modification cost and client communication. Showcasing this set of slides titled Agile And Waterfall Methods For Development And Administration Of E Commerce Venture Template PDF. The topics addressed in these templates are Planning, Development Process, Application Testing. All the content presented in this PPT design is completely editable. Download it and make adjustments in color, background, font etc. as per your unique business setting.

Planning E Commerce Project And Implementation Management Clipart PDF
The following slide highlights the planning ecommerce project and implementation management illustrating key heading which includes strategic business plan, technology selection, customer acquisition, customer engagement, customer retention, key metrics and business analysis Presenting Planning E Commerce Project And Implementation Management Clipart PDF to dispense important information. This template comprises seven stages. It also presents valuable insights into the topics including Customer Acquisition, Technology Selection, Strategic Business Plan. This is a completely customizable PowerPoint theme that can be put to use immediately. So, download it and address the topic impactfully.

Analytics Dashboard To Evaluate Digital Marketing Performance Mockup PDF
The purpose of this slide is to exhibits a dashboard which can be used to examine the marketing performance. The metrics covered in the dashboard are bounce rate, page views, new sessions, total time spent on site, email marketing performance etc. Showcasing this set of slides titled Analytics Dashboard To Evaluate Digital Marketing Performance Mockup PDF. The topics addressed in these templates are Conversion Funnel, Target, Marketing Performance. All the content presented in this PPT design is completely editable. Download it and make adjustments in color, background, font etc. as per your unique business setting.
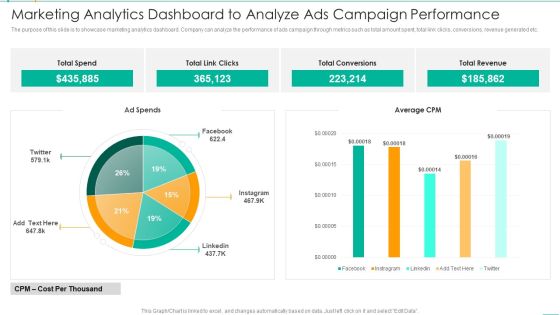
Marketing Analytics Dashboard To Analyze Ads Campaign Performance Microsoft PDF
The purpose of this slide is to showcase marketing analytics dashboard. Company can analyze the performance of ads campaign through metrics such as total amount spent, total link clicks, conversions, revenue generated etc. Showcasing this set of slides titled Marketing Analytics Dashboard To Analyze Ads Campaign Performance Microsoft PDF. The topics addressed in these templates are Marketing Analytics Dashboard To Analyze Ads Campaign Performance. All the content presented in this PPT design is completely editable. Download it and make adjustments in color, background, font etc. as per your unique business setting.

HR Budget Vs Actual KPI Dashboard Ppt PowerPoint Presentation File Structure PDF
The given below slide highlights the key metrics of HR budget to manage expense stream and take assist decision making. It includes KPAs such as month wise variations in budget, total amount allocated, actual expenditures etc. Pitch your topic with ease and precision using this HR Budget Vs Actual KPI Dashboard Ppt PowerPoint Presentation File Structure PDF. This layout presents information on Amount Allocated, Expenses by Heads, Budget Achieved. It is also available for immediate download and adjustment. So, changes can be made in the color, design, graphics or any other component to create a unique layout.

Corporate Digital Transformation Roadmap IT Transformation Dashboard With Iterate And Delivery Microsoft PDF
The following slide displays the key metrics for the IT transformation dashboard as it displays the key challenges faced along with the budget spent and the time period of challenges Deliver and pitch your topic in the best possible manner with this Corporate Digital Transformation Roadmap IT Transformation Dashboard With Iterate And Delivery Microsoft PDF Use them to share invaluable insights on IT Transformation Dashboard With Iterate And Delivery and impress your audience. This template can be altered and modified as per your expectations. So, grab it now.
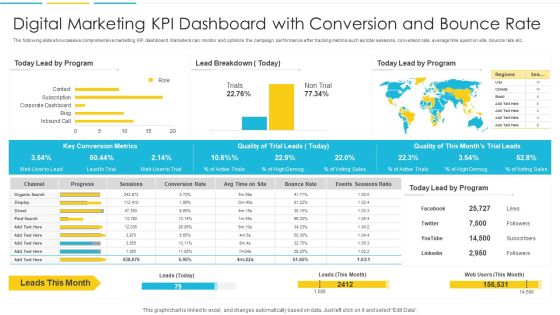
Digital Marketing KPI Dashboard With Conversion And Bounce Rate Introduction PDF
The following slide showcases a comprehensive marketing KPI dashboard. Marketers can monitor and optimize the campaign performance after tracking metrics such as total sessions, conversion rate, average time spent on site, bounce rate etc. Pitch your topic with ease and precision using this Digital Marketing KPI Dashboard With Conversion And Bounce Rate Introduction PDF. This layout presents information on Organic, Progress, Conversion Rate. It is also available for immediate download and adjustment. So, changes can be made in the color, design, graphics or any other component to create a unique layout

Digital Marketing KPI Dashboard With Goal Conversion Rate Ideas PDF
The following slide showcases a marketing KPI dashboard. The various metrics highlighted in the slide are total sessions, bounce rate, goal completions, goal conversion rate, top channels which generated revenue. Pitch your topic with ease and precision using this Digital Marketing KPI Dashboard With Goal Conversion Rate Ideas PDF. This layout presents information on Rate, Goal, Conversions. It is also available for immediate download and adjustment. So, changes can be made in the color, design, graphics or any other component to create a unique layout.
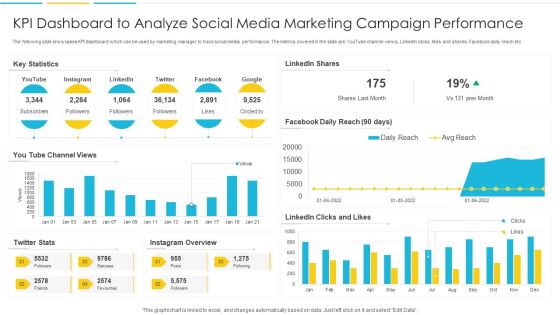
KPI Dashboard To Analyze Social Media Marketing Campaign Performance Rules PDF
The following slide showcases KPI dashboard which can be used by marketing manager to track social media performance. The metrics covered in the slide are YouTube channel views, LinkedIn clicks, likes and shares, Facebook daily reach etc. Pitch your topic with ease and precision using this KPI Dashboard To Analyze Social Media Marketing Campaign Performance Rules PDF. This layout presents information on Dashboard, Marketing, Analyze. It is also available for immediate download and adjustment. So, changes can be made in the color, design, graphics or any other component to create a unique layout.

Marketing KPI Dashboard With Lead To Conversion Structure PDF
The following slide showcases KPI dashboard which can be used to monitor the performance of marketing campaign. The key metrics mentioned in the slide are average daily impressions, cost per click, leads to conversion rate, cost per conversion etc. Showcasing this set of slides titled Marketing KPI Dashboard With Lead To Conversion Structure PDF. The topics addressed in these templates are Impressions, Optimization, Cost. All the content presented in this PPT design is completely editable. Download it and make adjustments in color, background, font etc. as per your unique business setting.
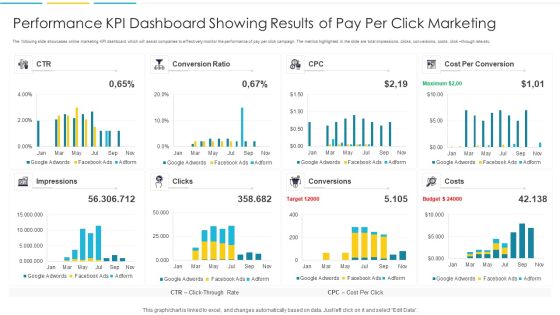
Performance KPI Dashboard Showing Results Of Pay Per Click Marketing Portrait PDF
The following slide showcases online marketing KPI dashboard which will assist companies to effectively monitor the performance of pay per click campaign. The metrics highlighted in the slide are total impressions, clicks, conversions, costs, click through rate etc. Pitch your topic with ease and precision using this Performance KPI Dashboard Showing Results Of Pay Per Click Marketing Portrait PDF. This layout presents information on Impressions, Target, Budget. It is also available for immediate download and adjustment. So, changes can be made in the color, design, graphics or any other component to create a unique layout.
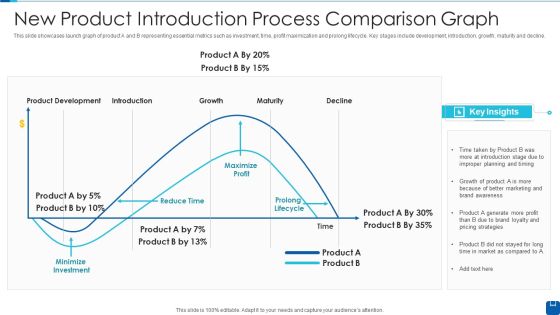
New Product Introduction Process Comparison Graph Slides PDF
This slide showcases launch graph of product A and B representing essential metrics such as investment, time, profit maximization and prolong lifecycle. Key stages include development, introduction, growth, maturity and decline.Showcasing this set of slides titled New Product Introduction Process Comparison Graph Slides PDF The topics addressed in these templates are Product Development, Improper Planning, Minimize Investment All the content presented in this PPT design is completely editable. Download it and make adjustments in color, background, font etc. as per your unique business setting.

Transportation And Logistics Services Company Profile Competitor Comparison By Operations Inspiration PDF
The slide showcases the competitor comparison by operations and revenue. It depicts comparison metrics which includes service coverage, fleet size, order size, total deliveries, workforce, revenue and net profit. Deliver and pitch your topic in the best possible manner with this Transportation And Logistics Services Company Profile Competitor Comparison By Operations Inspiration PDF. Use them to share invaluable insights on Service Coverage, Fleet Size, Workforce, Order Size, Revenue and impress your audience. This template can be altered and modified as per your expectations. So, grab it now.
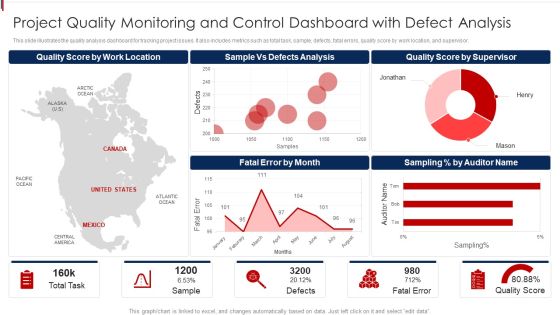
Project Quality Monitoring And Control Dashboard With Defect Analysis Demonstration PDF
This slide illustrates the quality analysis dashboard for tracking project issues. It also includes metrics such as total task, sample, defects, fatal errors, quality score by work location, and supervisor. Pitch your topic with ease and precision using this Project Quality Monitoring And Control Dashboard With Defect Analysis Demonstration PDF. This layout presents information on Location, Analysis, Supervisor. It is also available for immediate download and adjustment. So, changes can be made in the color, design, graphics or any other component to create a unique layout.
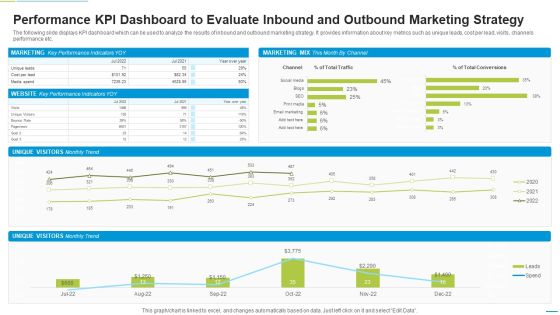
Performance KPI Dashboard To Evaluate Inbound And Outbound Marketing Strategy Mockup PDF
The following slide displays KPI dashboard which can be used to analyze the results of inbound and outbound marketing strategy. It provides information about key metrics such as unique leads, cost per lead, visits, channels performance etc. Showcasing this set of slides titled Performance KPI Dashboard To Evaluate Inbound And Outbound Marketing Strategy Mockup PDF. The topics addressed in these templates are Marketing, Unique Visitors, Cost Per Lead. All the content presented in this PPT design is completely editable. Download it and make adjustments in color, background, font etc. as per your unique business setting.
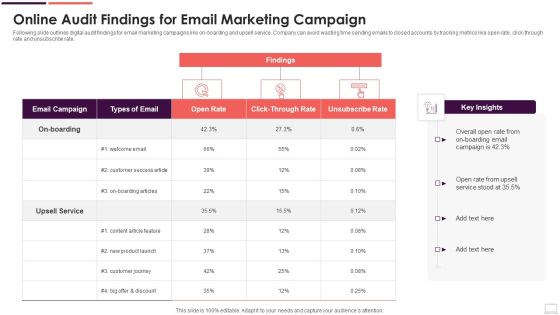
Online Audit Findings For Email Marketing Campaign Pictures PDF
Following slide outlines digital audit findings for email marketing campaigns like on-boarding and upsell service. Company can avoid wasting time sending emails to closed accounts by tracking metrics like open rate, click-through rate and unsubscribe rate. Pitch your topic with ease and precision using this Online Audit Findings For Email Marketing Campaign Pictures PDF. This layout presents information on On Boarding, Upsell Service, Email Campaign. It is also available for immediate download and adjustment. So, changes can be made in the color, design, graphics or any other component to create a unique layout.
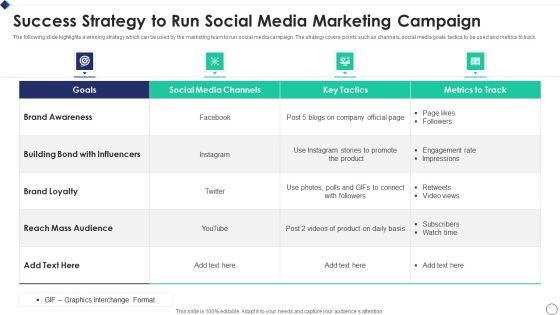
Success Strategy To Run Social Media Marketing Campaign Template PDF
The following slide highlights a winning strategy which can be used by the marketing team to run social media campaign. The strategy covers points such as channels, social media goals, tactics to be used and metrics to track. Showcasing this set of slides titled Success Strategy To Run Social Media Marketing Campaign Template PDF The topics addressed in these templates are Building Bond, Reach Mass, Instagram Stories All the content presented in this PPT design is completely editable. Download it and make adjustments in color, background, font etc. as per your unique business setting.
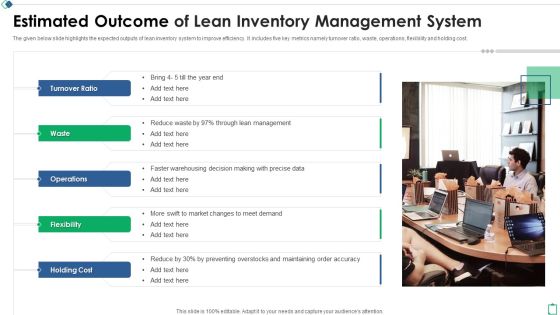
Estimated Outcome Of Lean Inventory Management System Ppt File Themes PDF
The given below slide highlights the expected outputs of lean inventory system to improve efficiency. It includes five key metrics namely turnover ratio, waste, operations, flexibility and holding cost. Persuade your audience using this Estimated Outcome Of Lean Inventory Management System Ppt File Themes PDF. This PPT design covers one stages, thus making it a great tool to use. It also caters to a variety of topics including Turnover Ratio Waste, Operations Flexibility Holding, Cost Precise Data. Download this PPT design now to present a convincing pitch that not only emphasizes the topic but also showcases your presentation skills.
Performance Evaluation KPI Dashboard For 360 Degree Review Icons PDF
This slide covers 360 degree employee feedback dashboard. It includes metrics such as highest rated area, lowest rated area, potential blind spots, peer ratings, self rating, gap analysis, etc. Showcasing this set of slides titled Performance Evaluation KPI Dashboard For 360 Degree Review Icons PDF. The topics addressed in these templates are Highest Rated, Lowest Areas, Potential Spots. All the content presented in this PPT design is completely editable. Download it and make adjustments in color, background, font etc. as per your unique business setting.
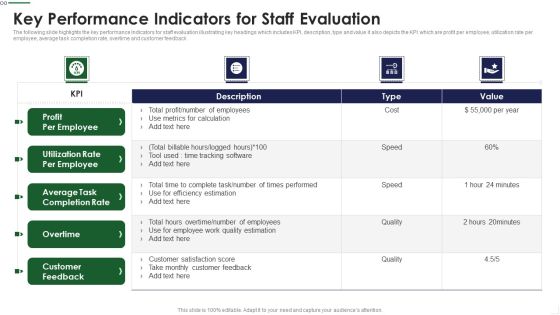
Key Performance Indicators For Staff Evaluation Infographics PDF
The following slide highlights the key performance Indicators for staff evaluation illustrating key headings which includes KPI, description, type and value it also depicts the KPI which are profit per employee, utilization rate per employee, average task completion rate, overtime and customer feedback Showcasing this set of slides titled Key Performance Indicators For Staff Evaluation Infographics PDF The topics addressed in these templates are Metrics Calculation, Times Performed, Customer Satisfaction All the content presented in this PPT design is completely editable. Download it and make adjustments in color, background, font etc. as per your unique business setting.
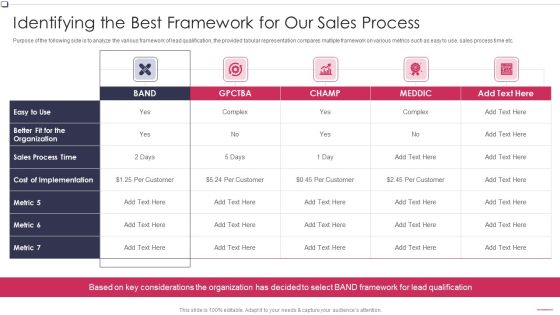
Identifying The Best Framework For Our Business To Business Promotion Sales Lead Introduction PDF
Purpose of the following side is to analyze the various framework of lead qualification, the provided tabular representation compares multiple framework on various metrics such as easy to use, sales process time etc. Deliver and pitch your topic in the best possible manner with this Identifying The Best Framework For Our Business To Business Promotion Sales Lead Introduction PDF Use them to share invaluable insights on Considerations Organization, Framework Qualification, Implementation and impress your audience. This template can be altered and modified as per your expectations. So, grab it now.

Introducing Our New Sales Cycle Business To Business Promotion Sales Lead Template PDF
Developing a new sales cycle is key strategy for any organization as it highlights the new sales cycle of the organization. The provided displays key metrics of the such as sales cycle, technology used etc.This is a Introducing Our New Sales Cycle Business To Business Promotion Sales Lead Template PDF template with various stages. Focus and dispense information on seven stages using this creative set, that comes with editable features. It contains large content boxes to add your information on topics like Prospecting, Prospect Qualification, Sales Presentation You can also showcase facts, figures, and other relevant content using this PPT layout. Grab it now.

BANT Sales Lead Qualification Model Identifying The Best Framework For Our Sales Brochure PDF
Purpose of the following side is to analyze the various framework of lead qualification, the provided tabular representation compares multiple framework on various metrics such as easy to use, sales process time etc. Deliver and pitch your topic in the best possible manner with this BANT Sales Lead Qualification Model Identifying The Best Framework For Our Sales Brochure PDF. Use them to share invaluable insights on Sales Process, Cost Implementation, Better Organization and impress your audience. This template can be altered and modified as per your expectations. So, grab it now.

BANT Sales Lead Qualification Model Introducing Our New Sales Cycle Download PDF
Developing a new sales cycle is key strategy for any organization as it highlights the new sales cycle of the organization. The provided displays key metrics of the such as sales cycle, technology used etc. Deliver and pitch your topic in the best possible manner with this BANT Sales Lead Qualification Model Introducing Our New Sales Cycle Download PDF. Use them to share invaluable insights on Lead Generation, Prospect Qualification, Sales Presentation and impress your audience. This template can be altered and modified as per your expectations. So, grab it now.
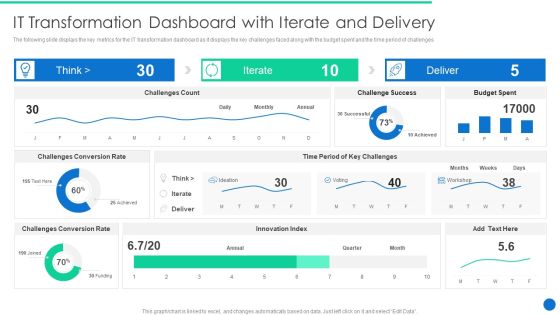
ERP Digital Transformation Journey It Transformation Dashboard With Iterate And Delivery Clipart PDF
The following slide displays the key metrics for the IT transformation dashboard as it displays the key challenges faced along with the budget spent and the time period of challenges. Deliver and pitch your topic in the best possible manner with this ERP Digital Transformation Journey It Transformation Dashboard With Iterate And Delivery Clipart PDF. Use them to share invaluable insights on Challenges Conversion, Budget Spent, Innovation Index and impress your audience. This template can be altered and modified as per your expectations. So, grab it now.

Risk Based Procedures To IT Security KPI Dashboard To Track Security Risk Events Designs PDF
This slide displays KPI dashboard that company will use to track multiple risk events. Metrics covered in the dashboard are residual risks by period and risk category by total risk rating. Deliver and pitch your topic in the best possible manner with this Risk Based Procedures To IT Security KPI Dashboard To Track Security Risk Events Designs PDF. Use them to share invaluable insights on Governance Risk, People Risk, Financial Risk and impress your audience. This template can be altered and modified as per your expectations. So, grab it now.
Development And Operations KPI Dashboard With Central Processing Unit Statistics Icons PDF
This slide covers devops KPI metrics dashboard with central processing unit statistics about input output statistics , network traffic volume under during recorded sessions. Further, this template includes numbers of sessions with waiting time.Showcasing this set of slides titled Development And Operations KPI Dashboard With Central Processing Unit Statistics Icons PDF The topics addressed in these templates are Central Processing, Output Statistics, Resource Limits All the content presented in this PPT design is completely editable. Download it and make adjustments in color, background, font etc. as per your unique business setting.
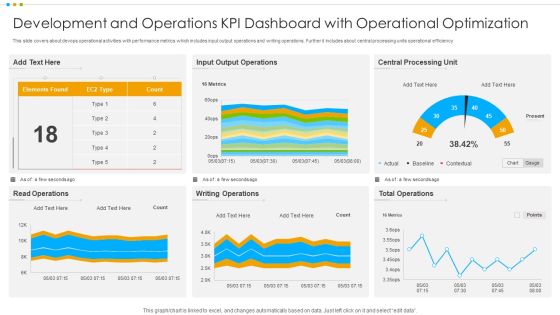
Development And Operations KPI Dashboard With Operational Optimization Pictures PDF
This slide covers about devops operational activities with performance metrics which includes input output operations and writing operations. Further it includes about central processing units operational efficiency.Pitch your topic with ease and precision using this Development And Operations KPI Dashboard With Operational Optimization Pictures PDF This layout presents information on Output Operations, Central Processing, Total Operations It is also available for immediate download and adjustment. So, changes can be made in the color, design, graphics or any other component to create a unique layout.

Online Marketing Report Showing Social Media Analytics Mockup PDF
This slide shows the digital marketing report showcasing social media analytics which provides metrics of Facebook, Twitter, Instagram and YouTube with actual, target and yet to target performance.Pitch your topic with ease and precision using this Online Marketing Report Showing Social Media Analytics Mockup PDF This layout presents information on Total Engagements, Marketing Report, Showing Analytics It is also available for immediate download and adjustment. So, changes can be made in the color, design, graphics or any other component to create a unique layout.

Effective Sales Technique For New Product Launch Dashboard To Track Sales Opportunities Introduction PDF
Mentioned slide shows dashboard that can be used by an organization to track win and lost sales opportunities. It includes metrics namely won opportunities, lost opportunities, pipeline by territory, total opportunities.Deliver an awe inspiring pitch with this creative Effective Sales Technique For New Product Launch Dashboard To Track Sales Opportunities Introduction PDF bundle. Topics like Lost Opportunities, Total Opportunities, Revenue Territory can be discussed with this completely editable template. It is available for immediate download depending on the needs and requirements of the user.

New Product Sales Strategy And Marketing Dashboard To Track Sales Opportunities Rules PDF
Mentioned slide shows dashboard that can be used by an organization to track win and lost sales opportunities. It includes metrics namely won opportunities, lost opportunities, pipeline by territory, total opportunities. Deliver and pitch your topic in the best possible manner with this New Product Sales Strategy And Marketing Dashboard To Track Sales Opportunities Rules PDF. Use them to share invaluable insights on Won Opportunities, Lost Opportunities, Revenue and impress your audience. This template can be altered and modified as per your expectations. So, grab it now.
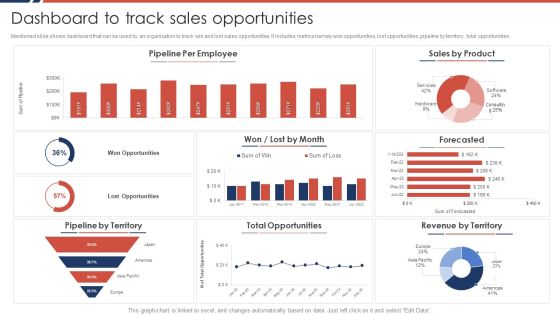
Effective Sales Plan For New Product Introduction In Market Dashboard To Track Sales Opportunities Formats PDF
Mentioned slide shows dashboard that can be used by an organization to track win and lost sales opportunities. It includes metrics namely won opportunities, lost opportunities, pipeline by territory, total opportunities.Deliver an awe inspiring pitch with this creative Effective Sales Plan For New Product Introduction In Market Dashboard To Track Sales Opportunities Formats PDF bundle. Topics like Pipeline Employee, Total Opportunities, Revenue Territory can be discussed with this completely editable template. It is available for immediate download depending on the needs and requirements of the user.
 Home
Home