Metrics
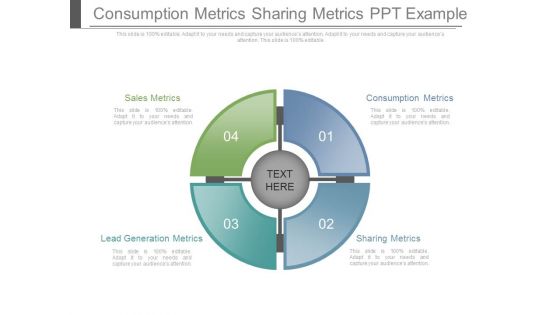
Consumption Metrics Sharing Metrics Ppt Example
This is a consumption metrics sharing metrics ppt example. This is a four stage process. The stages in this process are circle charts, business, marketing.

Metrics Depicting Business Operations Metrics Diagrams PDF
Pitch your topic with ease and precision using this Metrics Depicting Business Operations Metrics Diagrams PDF. This layout presents information on Metrics Depicting, Business, Operations Metrics. It is also available for immediate download and adjustment. So, changes can be made in the color, design, graphics or any other component to create a unique layout.

Metrics Exhibiting Sales Operations Metrics Topics PDF
This slide represents the sales operations dashboard. It covers the number of sales, total revenue, profit, cost, sales revenue, cost breakdown, accumulated revenue, etc. Showcasing this set of slides titled Metrics Exhibiting Sales Operations Metrics Topics PDF. The topics addressed in these templates are Total Revenue, Total Profit, Total Cost. All the content presented in this PPT design is completely editable. Download it and make adjustments in color, background, font etc. as per your unique business setting.
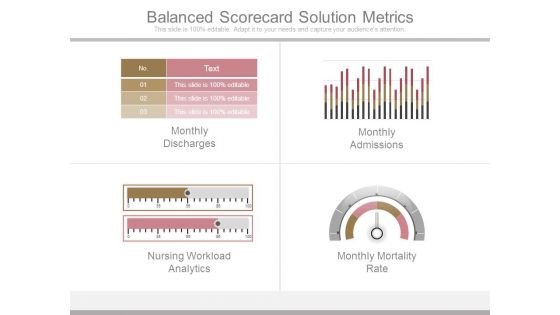
Balanced Scorecard Solution Metrics
This is a balanced scorecard solution metrics. This is a four stage process. The stages in this process are monthly discharges, monthly admissions, nursing workload analytics, monthly mortality rate.
Key Evaluation Metrics Ppt Slides
This is a key evaluation metrics ppt slides. This is a five stage process. The stages in this process are business, finance, marketing, symbol.

Effective Digital Security Metrics And Metrics Categories Microsoft Pdf
Pitch your topic with ease and precision using this Effective Digital Security Metrics And Metrics Categories Microsoft Pdf This layout presents information on Security Program Maturity, Metric Category, Sensitive Data Scanning It is also available for immediate download and adjustment. So, changes can be made in the color, design, graphics or any other component to create a unique layout.

Setting Campaign Metrics Ppt Slides
This is a setting campaign metrics ppt slides. This is a five stage process. The stages in this process are business, marketing, success.

Sales Metrics Customer Readiness To Buy Metrics Ppt Presentation
This is a sales metrics ppt presentation examples. This is a five stage process. The stages in this process are sales metrics, distribution metrics, customer readiness to buy metrics, customer metrics, communication metrics.
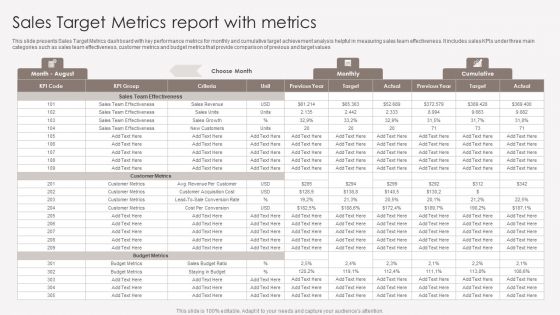
Sales Target Metrics Report With Metrics Introduction PDF
This slide presents Sales Target Metrics dashboard with key performance metrics for monthly and cumulative target achievement analysis helpful in measuring sales team effectiveness. It includes sales KPIs under three main categories such as sales team effectiveness, customer metrics and budget metrics that provide comparison of previous and target values. Pitch your topic with ease and precision using this Sales Target Metrics Report With Metrics Introduction PDF. This layout presents information on Sales Team Effectiveness, Customer Metrics, Budget Metrics. It is also available for immediate download and adjustment. So, changes can be made in the color, design, graphics or any other component to create a unique layout.
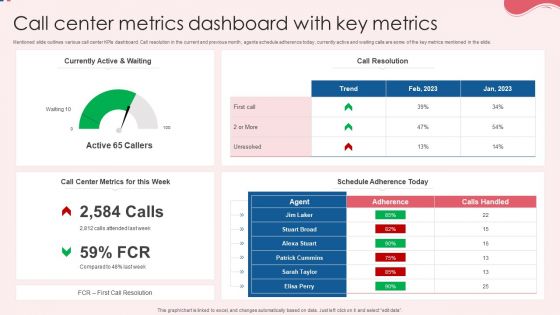
Call Center Metrics Dashboard With Key Metrics Information PDF
Mentioned slide outlines various call center KPIs dashboard. Call resolution in the current and previous month, agents schedule adherence today, currently active and waiting calls are some of the key metrics mentioned in the slide. Showcasing this set of slides titled Call Center Metrics Dashboard With Key Metrics Information PDF. The topics addressed in these templates are Currently Active, Call Resolution, Key Metrics. All the content presented in this PPT design is completely editable. Download it and make adjustments in color, background, font etc. as per your unique business setting.

Types And Metrics Of Performance Metrics Portrait PDF
Are you searching for a Types And Metrics Of Performance Metrics Portrait PDF that is uncluttered, straightforward, and original Its easy to edit, and you can change the colors to suit your personal or business branding. For a presentation that expresses how much effort you have put in, this template is ideal With all of its features, including tables, diagrams, statistics, and lists, its perfect for a business plan presentation. Make your ideas more appealing with these professional slides. Download Types And Metrics Of Performance Metrics Portrait PDF from Slidegeeks today.

Software Development Metrics With Project Health Metrics Graphics PDF
This slide shows complete progress report for application development project which includes planning, designing, development, testing, risks, budget, overdue tasks, summery, average handle time and upcoming deadlines. Pitch your topic with ease and precision using this Software Development Metrics With Project Health Metrics Graphics PDF. This layout presents information on Overall Progress, Overdue Tasks, Project Budget. It is also available for immediate download and adjustment. So, changes can be made in the color, design, graphics or any other component to create a unique layout.
Different Campaign Metrics Powerpoint Templates
This is a different campaign metrics powerpoint templates. This is a five stage process. The stages in this process are metrics, management, marketing, business, strategy.
Key Business Metrics Ppt Samples
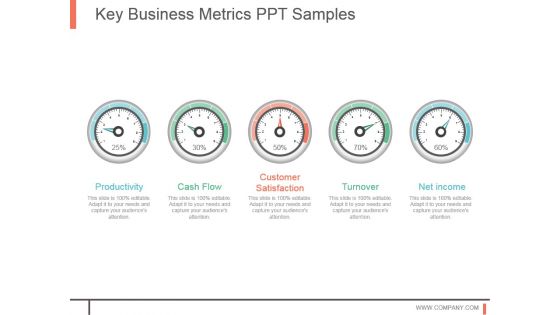
This is a key business metrics ppt samples. This is a five stage process. The stages in this process are productivity, cash flow, customer satisfaction, turnover, net income.

Performance Metrics Ppt Examples Professional
This is a performance metrics ppt examples professional. This is a five stage process. The stages in this process are productivity, cash flow, customer satisfaction, turnover, net income.
Key Metrics Presentation Powerpoint Example
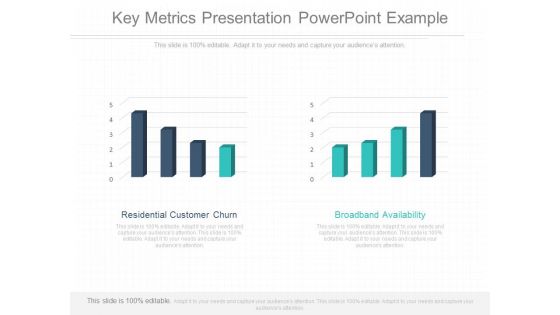
This is a key metrics presentation powerpoint example. This is a two stage process. The stages in this process are residential customer churn, broadband availability.
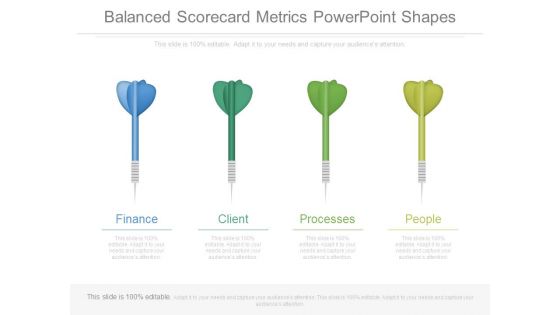
Balanced Scorecard Metrics Powerpoint Shapes
This is a balanced scorecard metrics powerpoint shapes. This is a four stage process. The stages in this process are finance, client, processes, people.

Key Metrics Dashboard Ppt Images
This is a key metrics dashboard ppt images. This is a five stage process. The stages in this process are cash flow, turnover, productivity, net income, customer satisfaction.
Loyalty Program Metrics Ppt Icon
This is a loyalty program metrics ppt icon. This is a four stage process. The stages in this process are enrollments, reward outstanding, loyalty revenue, gift sales.
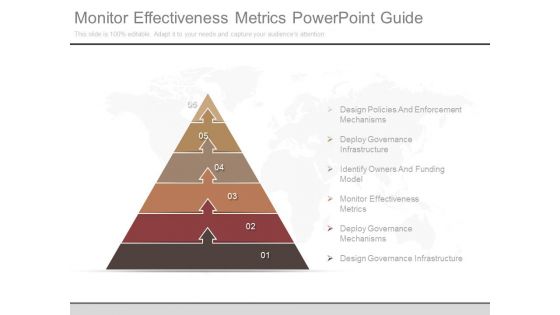
Monitor Effectiveness Metrics Powerpoint Guide
This is a monitor effectiveness metrics powerpoint guide. This is a six stage process. The stages in this process are design policies and enforcement mechanisms, deploy governance infrastructure, identify owners and funding model, monitor effectiveness metrics, deploy governance mechanisms, design governance infrastructure.
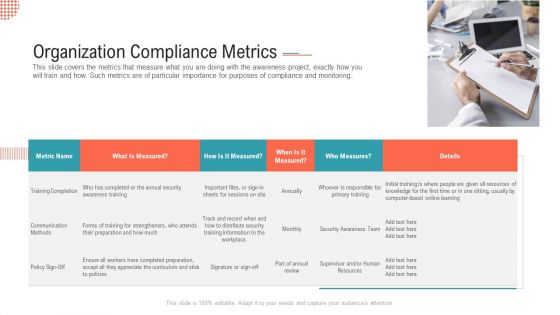
Organization Compliance Metrics Pictures PDF
This slide covers the metrics that measure what you are doing with the awareness project, exactly how you will train and how. Such metrics are of particular importance for purposes of compliance and monitoring.Presenting organization compliance metrics pictures pdf. to provide visual cues and insights. Share and navigate important information on one stage that need your due attention. This template can be used to pitch topics like training completion, communication methods. In addtion, this PPT design contains high resolution images, graphics, etc, that are easily editable and available for immediate download.
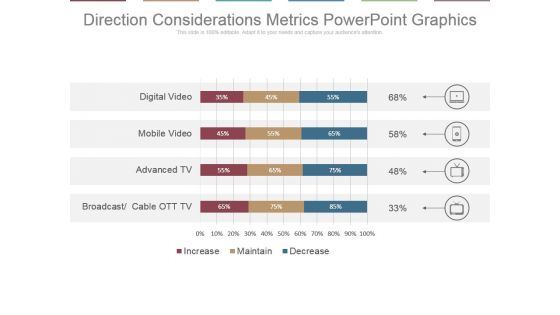
Direction Considerations Metrics Powerpoint Graphics
This is a direction considerations metrics powerpoint graphics. This is a four stage process. The stages in this process are digital video, mobile video, advanced tv, broadcast, cable ott tv.

Customer Understanding Metrics Powerpoint Slide
This is a customer understanding metrics powerpoint slide. This is a three stage process. The stages in this process are inactive nonprofit able customer, active profitable customers, very active very profitable customers.

Devops Performance Metrics Themes PDF
This slide provides the glimpse about the devops performance metrics which focuses on performance, speed and quality based on business objectives and customer experience.This is a devops performance metrics themes pdf template with various stages. Focus and dispense information on three stages using this creative set, that comes with editable features. It contains large content boxes to add your information on topics like resource utilization, frequency of release, success rate . You can also showcase facts, figures, and other relevant content using this PPT layout. Grab it now.

B2B Marketing List Of ROI Metrics To Track BETTER METRIC Clipart PDF
Deliver and pitch your topic in the best possible manner with this b2b marketing list of roi metrics to track better metric clipart pdf. Use them to share invaluable insights on growth rate followers, engagement rates, fans and followers, likes and favorites, return investment and impress your audience. This template can be altered and modified as per your expectations. So, grab it now.

Goals And Success Metrics Ppt Slides
This is a goals and success metrics ppt slides. This is a four stage process. The stages in this process are process and flows, success, business.

Brand Marketing Engagement Metrics Timeline Ppt Slide
This is a brand marketing engagement metrics timeline ppt slide. This is a six stage process. The stages in this process are time planning, marketing, arrows.
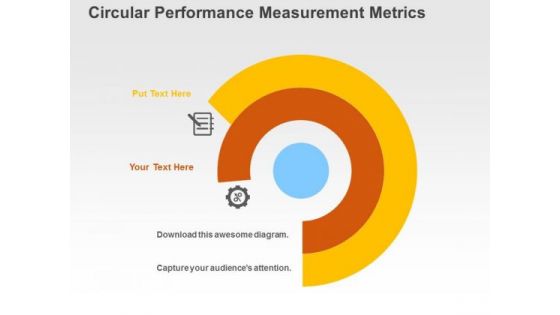
Circular Performance Measurement Metrics PowerPoint Templates
Communicate with your group through this slide of circles. It will facilitate understanding of your views. This diagram can be used to display performance measurement in business presentations.
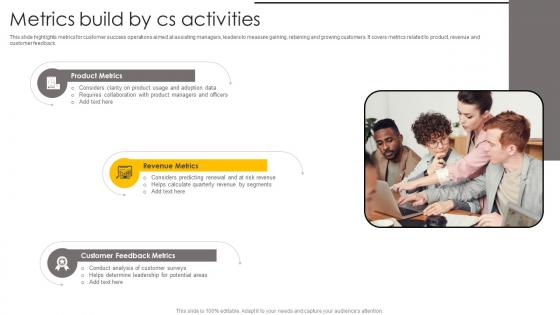
Metrics Build By Cs Activities Pictures Pdf
This slide highlights metrics for customer success operations aimed at assisting managers, leaders to measure gaining, retaining and growing customers. It covers metrics related to product, revenue and customer feedback. Showcasing this set of slides titled Metrics Build By Cs Activities Pictures Pdf. The topics addressed in these templates are Product Metrics, Revenue Metrics, Feedback Metrics. All the content presented in this PPT design is completely editable. Download it and make adjustments in color, background, font etc. as per your unique business setting.
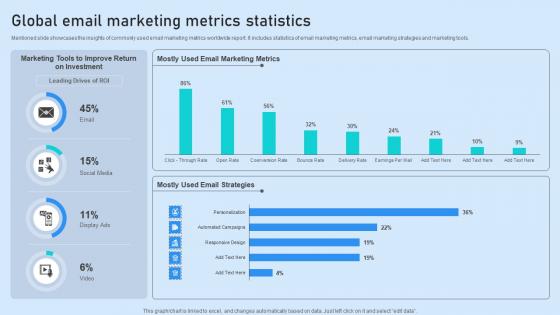
Global Email Marketing Metrics Statistics Structure Pdf
Mentioned slide showcases the insights of commonly used email marketing metrics worldwide report. It includes statistics of email marketing metrics, email marketing strategies and marketing tools. Showcasing this set of slides titled Global Email Marketing Metrics Statistics Structure Pdf. The topics addressed in these templates are Marketing Metrics, Strategies, Investment. All the content presented in this PPT design is completely editable. Download it and make adjustments in color, background, font etc. as per your unique business setting.
Tracking Employee Engagement Activities Metrics Graphics Pdf
Following slides shows the metrics for monitoring employee engagement activities which assist in boosting employee satisfaction. It includes metrics such as voluntary employee turnover rate, employee retention rate, absenteeism , etc. Pitch your topic with ease and precision using this Tracking Employee Engagement Activities Metrics Graphics Pdf This layout presents information on Projected, Variance, Activities Metrics It is also available for immediate download and adjustment. So, changes can be made in the color, design, graphics or any other component to create a unique layout.

Metrics Based Management Layout Presentation Powerpoint Templates
This is a metrics based management layout presentation powerpoint templates. This is a three stage process. The stages in this process are metrics review by dd dm, pl reviews the data, pm approves the metrics.
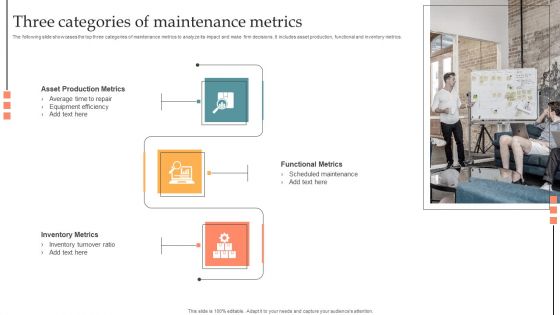
Three Categories Of Maintenance Metrics Portrait PDF
The following slide showcases the top three categories of maintenance metrics to analyze its impact and make firm decisions. It includes asset production, functional and inventory metrics. Presenting Three Categories Of Maintenance Metrics Portrait PDF to dispense important information. This template comprises three stages. It also presents valuable insights into the topics including Asset Production Metrics, Inventory Metrics, Functional Metrics. This is a completely customizable PowerPoint theme that can be put to use immediately. So, download it and address the topic impactfully.

Business Improvement Metrics Example Ppt Presentation
This is a business improvement metrics example ppt presentation. This is a four stage process. The stages in this process are focus, area of focus, metrics, targets, objectives.

Exceptional Metrics Ppt PowerPoint Presentation Good Cpb
This is a exceptional metrics ppt powerpoint presentation good cpb. This is a seven stage process. The stages in this process are exceptional metrics.
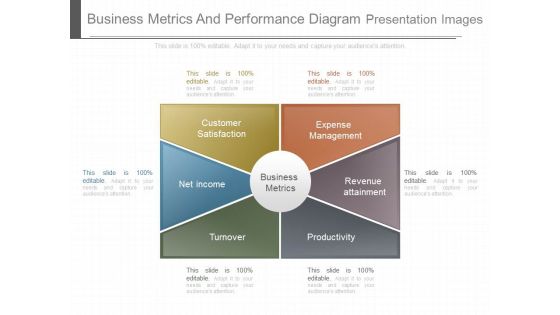
Business Metrics And Performance Diagram Presentation Images
This is a business metrics and performance diagram presentation images. This is a six stage process. The stages in this process are expense management, customer satisfaction, net income, revenue attainment, business metrics, turnover, productivity.
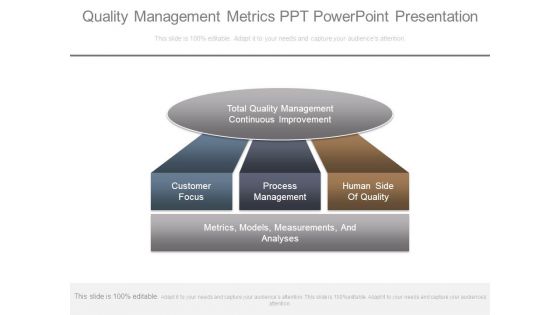
Quality Management Metrics Ppt Powerpoint Presentation
This is a quality management metrics ppt powerpoint presentation. This is a three stage process. The stages in this process are total quality management continuous improvement, customer focus, process management, human side of quality, metrics, models, measurements and analyses.

Key Metrics Google Alerts Powerpoint Presentation Examples
This is a key metrics google alerts powerpoint presentation examples. This is a four stage process. The stages in this process are key metrics, visible technologies, google alerts, information source.

Key Metrics For Workforce Improvement Ppt Summary
This is a key metrics for workforce improvement ppt summary. This is a four stage process. The stages in this process are vision and strategy, metrics, targets, objectives, area of focus.

Content Freelance Marketing Engagement Metrics Elements PDF
The following slide highlights the content freelance marketing engagement metrics illustrating metrics which includes shares, benchmark, target, result and variance to measure the result and variance with target. Showcasing this set of slides titled Content Freelance Marketing Engagement Metrics Elements PDF. The topics addressed in these templates are Metrics, Survey Completion Rate, Bounce Rate. All the content presented in this PPT design is completely editable. Download it and make adjustments in color, background, font etc. as per your unique business setting.

Website Medical Checkup Key Metrics Themes PDF
The following slide showcases key metrics for checking website health score to boost performance. It includes key metrics like functionality, security, design, structure, content and engagement. Pitch your topic with ease and precision using this Website Medical Checkup Key Metrics Themes PDF. This layout presents information on Evaluate Performance, Environment, Metrics. It is also available for immediate download and adjustment. So, changes can be made in the color, design, graphics or any other component to create a unique layout.
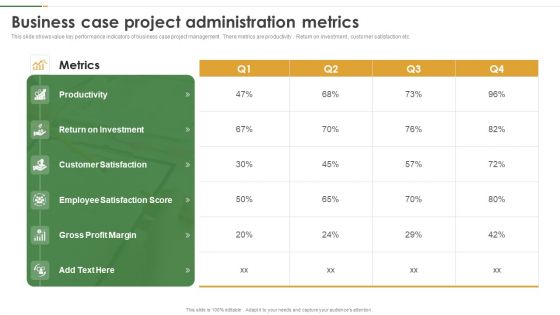
Business Case Project Administration Metrics Template PDF
This slide shows value key performance indicators of business case project management . There metrics are productivity . Return on investment , customer satisfaction etc. Showcasing this set of slides titled Business Case Project Administration Metrics Template PDF. The topics addressed in these templates are Productivity, Metrics, Return On Investment. All the content presented in this PPT design is completely editable. Download it and make adjustments in color, background, font etc. as per your unique business setting.
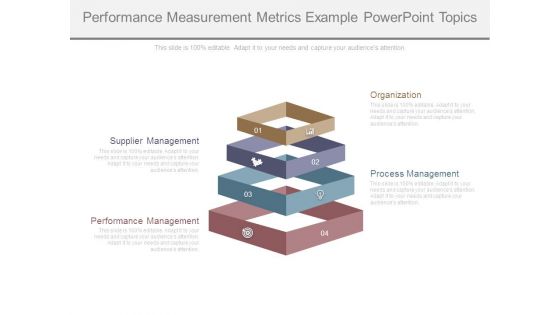
Performance Measurement Metrics Example Powerpoint Topics
This is a performance measurement metrics example powerpoint topics. This is a four stage process. The stages in this process are organization, supplier management, process management, performance management.

Metrics To Measure Performance Sample Ppt Presentation
This is a metrics to measure performance sample ppt presentation. This is a three stage process. The stages in this process are insight and analysis, goal, tactic.

Metrics To Measure Marketing Campaign Ppt Example
This is a metrics to measure marketing campaign ppt example. This is a five stage process. The stages in this process are marketing, business, strategy, icons, management.
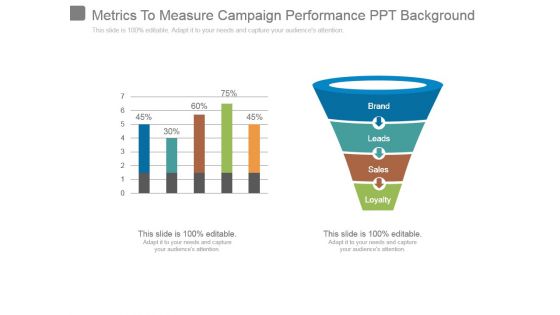
Metrics To Measure Campaign Performance Ppt Background
This is a metrics to measure campaign performance ppt background. This is a two stage process. The stages in this process are brand, leads, sales, loyalty.

Exercise Equipment User Acquisition Metrics Designs PDF
This slide provides the glimpse about our user acquisition metrics which focuses on user locations, mobile app downloads, users and sessions, users after initial influencer posts, etc. Deliver an awe inspiring pitch with this creative exercise equipment user acquisition metrics designs pdf bundle. Topics like user acquisition metrics can be discussed with this completely editable template. It is available for immediate download depending on the needs and requirements of the user.
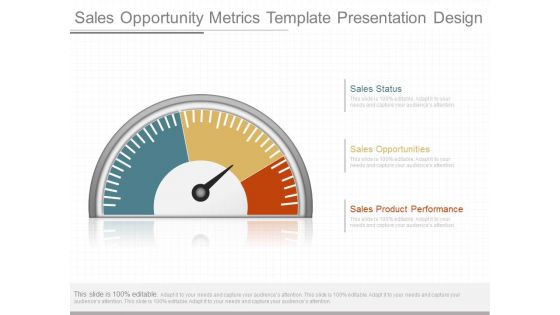
Sales Opportunity Metrics Template Presentation Design
This is a sales opportunity metrics template presentation design. This is a three stage process. The stages in this process are sales status, sales opportunities, sales product performance.
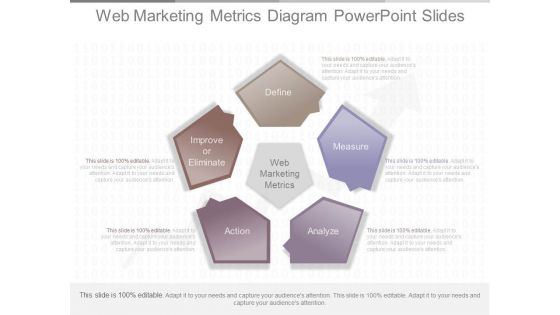
Web Marketing Metrics Diagram Powerpoint Slides
This is a web marketing metrics diagram powerpoint slides. This is a five stage process. The stages in this process are define, measure, analyze, action, improve or eliminate.
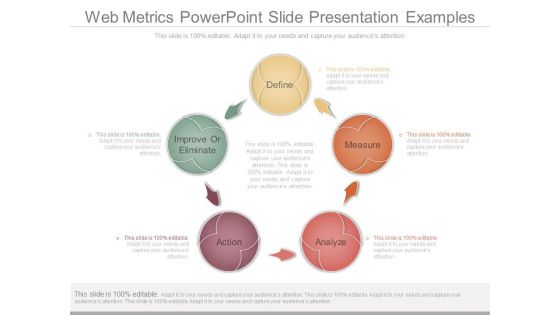
Web Metrics Powerpoint Slide Presentation Examples
This is a web metrics powerpoint slide presentation examples. This is a five stage process. The stages in this process are define, measure, analyze, action, improve or eliminate.
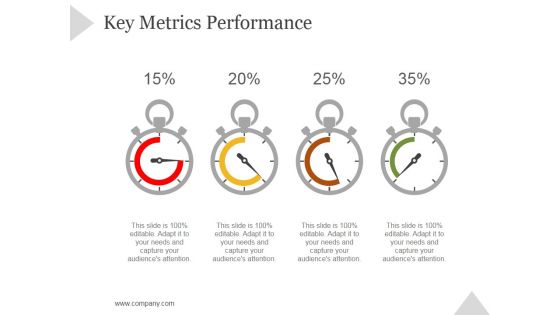
Key Metrics Performance Ppt PowerPoint Presentation Tips
This is a key metrics performance ppt powerpoint presentation tips. This is a four stage process. The stages in this process are business, strategy, marketing, success, dashboard, measuring.
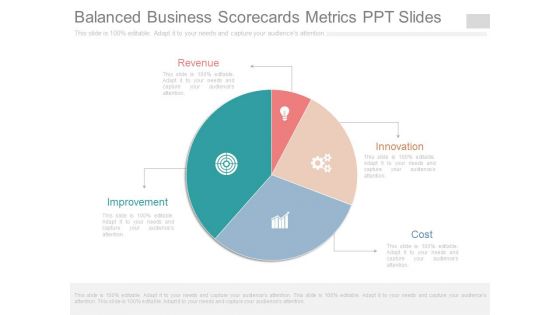
Balanced Business Scorecards Metrics Ppt Slides
This is a balanced business scorecards metrics ppt slides. This is a four stage process. The stages in this process are revenue, improvement, innovation, cost.

Business Development Metrics Sample Diagram Powerpoint Slides
This is a business development metrics sample diagram powerpoint slides. This is a four stage process. The stages in this process are place, price, target market, product, promotion.

Business Departments Performance Metrics Ppt Slides
This is a business departments performance metrics ppt slides. This is a seven stage process. The stages in this process are engineering, construction, maintenance, operations, safety, finance, environment.

Business Kpi Dashboard Metrics Ppt Sample File
This is a business kpi dashboard metrics ppt sample file. This is a five stage process. The stages in this process are business, finance, management, success, marketing, presentation.

Hr Metrics Dashboard Examples Ppt Powerpoint Slides
This is a hr metrics dashboard examples ppt powerpoint slides. This is a five stage process. The stages in this process are chicago, boston, detroit, cleveland, turnover.

Customer Adoption Metrics Diagram Powerpoint Guide
This is a customer adoption metrics diagram powerpoint guide. This is a five stage process. The stages in this process are relevant market, awareness, internet, evolution, trial.

Performance Metrics Application Example Ppt Model
This is a performance metrics application example ppt model. This is a six stage process. The stages in this process are goal, cost, audience, budgeting, forecasting, insight.

Business Metrics Dashboard Presentation Powerpoint Example
This is a business metrics dashboard presentation powerpoint example. This is a two stage process. The stages in this process are facebook, twitter.
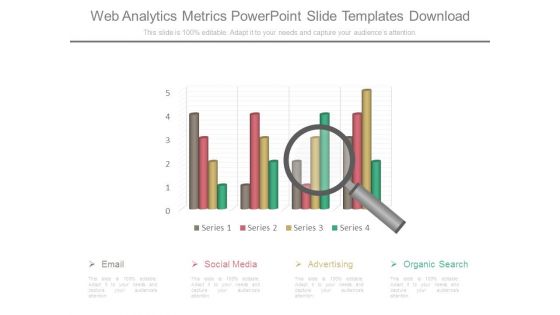
Web Analytics Metrics Powerpoint Slide Templates Download
This is a web analytics metrics powerpoint slide templates download. This is a one stage process. The stages in this process are email, social media, advertising, organic search.
Set And Track Metrics Ppt Examples
This is a set and track metrics ppt examples. This is a five stage process. The stages in this process are business, management, strategy, presentation, marketing.
Key Performance Management Metrics Powerpoint Slide Background
This is a key performance management metrics powerpoint slide background. This is a five stage process. The stages in this process are business, marketing, finance, icons, strategy.
Finance Management Metrics Ppt Slide Templates
This is a finance management metrics ppt slide templates. This is a nine stage process. The stages in this process are business, marketing, management, table.

Loyalty Program Performance Metrics Ppt Background
This is a loyalty program performance metrics ppt background. This is a four stage process. The stages in this process are enrollments, reward outstanding, revenue, gift sales.
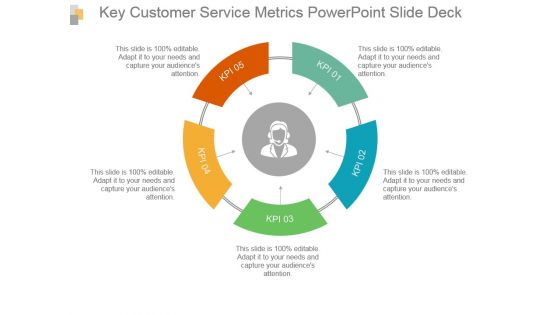
Key Customer Service Metrics Powerpoint Slide Deck
This is a key customer service metrics powerpoint slide deck. This is a five stage process. The stages in this process are process, management, arrow, marketing, strategy.

Key Metrics For Finance Unit Presentation Images
This is a key metrics for finance unit presentation images. This is a three stage process. The stages in this process are business, management, strategy, finance unit, marketing.

Performance Metrics For Engineering Team Ppt Templates
This is a performance metrics for engineering team ppt templates. This is a three stage process. The stages in this process are area of focus, result, area.
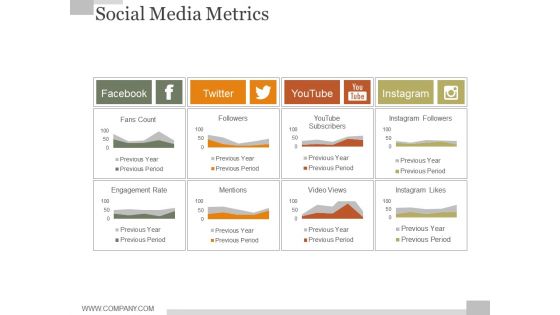
Social Media Metrics Ppt PowerPoint Presentation Graphics
This is a social media metrics ppt powerpoint presentation graphics. This is a four stage process. The stages in this process are facebook, twitter, youtube, instagram.
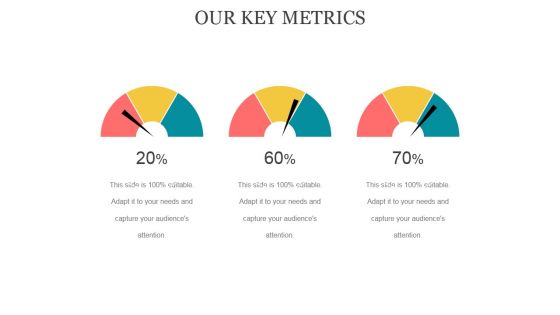
Our Key Metrics Ppt PowerPoint Presentation Styles
This is a our key metrics ppt powerpoint presentation styles. This is a three stage process. The stages in this process are business, marketing, dashboard, planning, analysis.

Setting Campaign Metrics Ppt PowerPoint Presentation Designs
This is a setting campaign metrics ppt powerpoint presentation designs. This is a five stage process. The stages in this process are business, strategy, marketing, management, planning.
Setting Campaign Metrics Ppt PowerPoint Presentation Templates
This is a setting campaign metrics ppt powerpoint presentation templates. This is a five stage process. The stages in this process are business, marketing, icons, strategy.
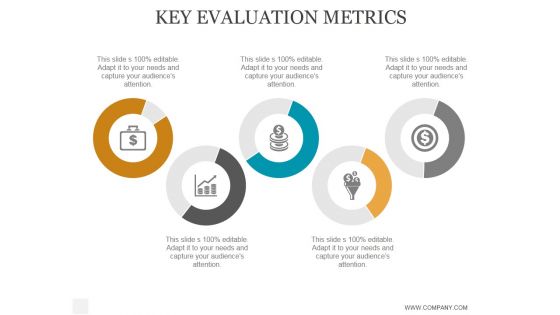
Key Evaluation Metrics Ppt PowerPoint Presentation Portfolio
This is a key evaluation metrics ppt powerpoint presentation portfolio. This is a five stage process. The stages in this process are business, strategy, marketing, analysis, success, icons.

Key Metrics Ppt PowerPoint Presentation Introduction
This is a key metrics ppt powerpoint presentation introduction. This is a five stage process. The stages in this process are icons, marketing, business, strategy.
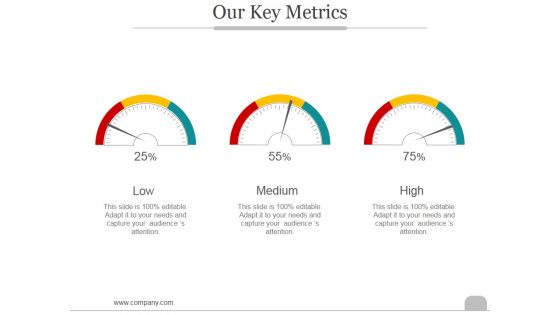
Our Key Metrics Ppt PowerPoint Presentation Gallery
This is a our key metrics ppt powerpoint presentation gallery. This is a three stage process. The stages in this process are low, medium, high.
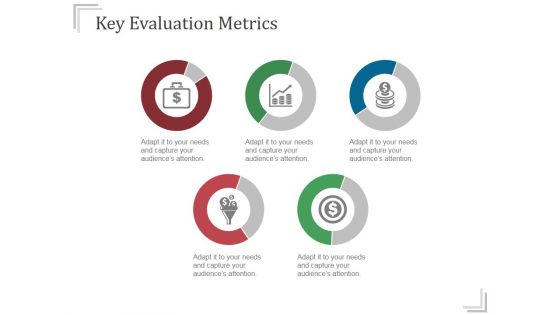
Key Evaluation Metrics Ppt PowerPoint Presentation Gallery
This is a key evaluation metrics ppt powerpoint presentation gallery. This is a five stage process. The stages in this process are business, icons, marketing, strategy, success.
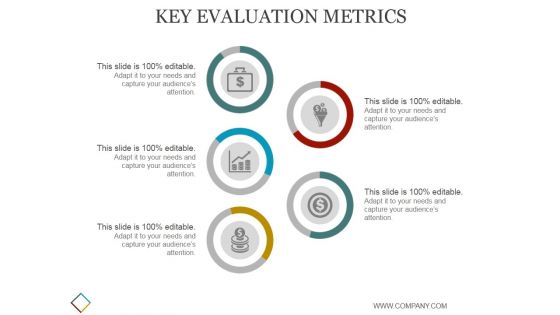
Key Evaluation Metrics Ppt PowerPoint Presentation Deck
This is a key evaluation metrics ppt powerpoint presentation deck. This is a five stage process. The stages in this process are business, strategy, marketing, analysis, finance, compare.

Key Evaluation Metrics Ppt PowerPoint Presentation Files
This is a key evaluation metrics ppt powerpoint presentation files. This is a five stage process. The stages in this process are icons, business, management, success, percentage.
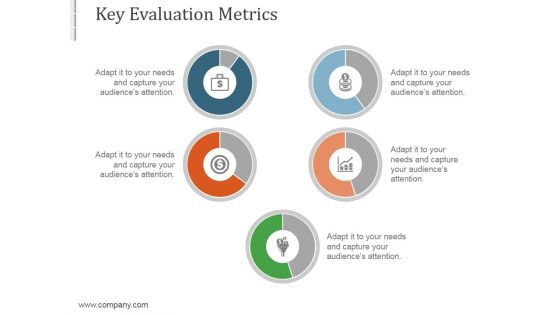
Key Evaluation Metrics Ppt PowerPoint Presentation Model
This is a key evaluation metrics ppt powerpoint presentation model. This is a five stage process. The stages in this process are business, marketing, strategy, success, process.

Social Media Metrics Ppt PowerPoint Presentation Slide
This is a social media metrics ppt powerpoint presentation slide. This is a four stage process. The stages in this process are facebook, twitter, youtube, instagram, fans count.

Setting Campaign Metrics Ppt PowerPoint Presentation Summary
This is a setting campaign metrics ppt powerpoint presentation summary. This is a five stage process. The stages in this process are process, strategy, management, marketing, business.
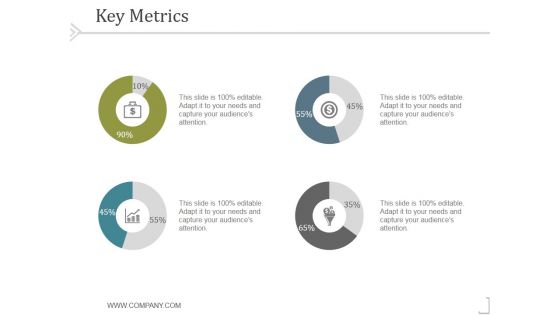
Key Metrics Ppt PowerPoint Presentation Rules
This is a key metrics ppt powerpoint presentation rules. This is a four stage process. The stages in this process are business, strategy, marketing, success, analysis, finance.

Key Evaluation Metrics Ppt PowerPoint Presentation Visuals
This is a key evaluation metrics ppt powerpoint presentation visuals. This is a five stage process. The stages in this process are layered, business, strategy, management, marketing.

Metrics Model Ppt PowerPoint Presentation Guidelines
This is a metrics model ppt powerpoint presentation guidelines. This is a three stage process. The stages in this process are hr, people, organization, efficiency, effectiveness.
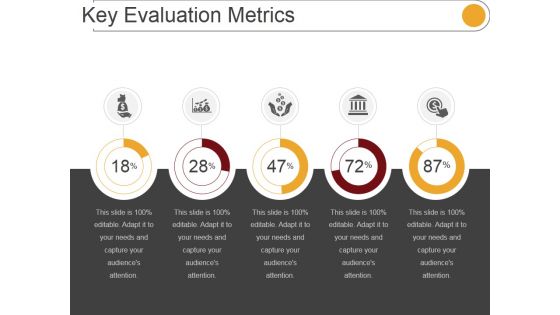
Key Evaluation Metrics Ppt PowerPoint Presentation Influencers
This is a key evaluation metrics ppt powerpoint presentation influencers. This is a five stage process. The stages in this process are icons, percentage, marketing, management.
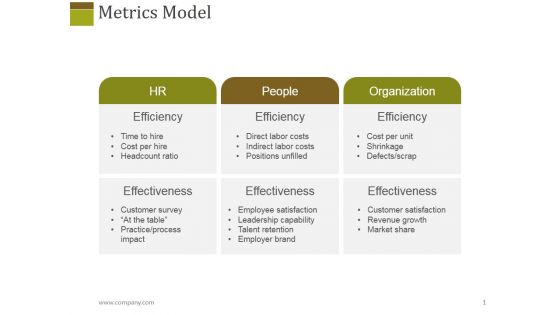
Metrics Model Ppt PowerPoint Presentation Ideas Guidelines
This is a metrics model ppt powerpoint presentation ideas guidelines. This is a six stage process. The stages in this process are hr, people, organization, efficiency.

Metrics Model Ppt PowerPoint Presentation Ideas Pictures
This is a metrics model ppt powerpoint presentation ideas pictures. This is a three stage process. The stages in this process are effectiveness, efficiency, people, organization.
Business Operations Metrics Dashboard Icon Graphics PDF
Showcasing this set of slides titled Business Operations Metrics Dashboard Icon Graphics PDF. The topics addressed in these templates are Business Operations, Metrics Dashboard Icon. All the content presented in this PPT design is completely editable. Download it and make adjustments in color, background, font etc. as per your unique business setting.
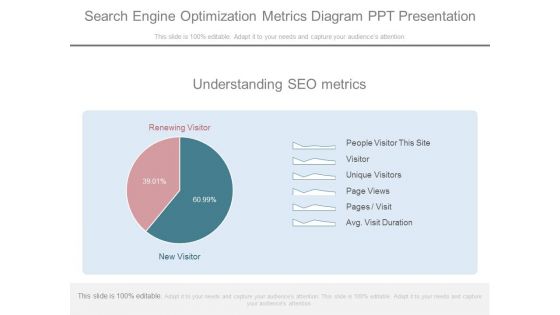
Search Engine Optimization Metrics Diagram Ppt Presentation
This is a search engine optimization metrics diagram ppt presentation. This is a two stage process. The stages in this process are understanding seo metrics, people visitor this site, visitor, unique visitors, page views, pages visit, avg visit duration, renewing visitor, new visitor.
Devops Performance Assessment Metrics Icons PDF
This is a devops performance assessment metrics icons pdf template with various stages. Focus and dispense information on four stages using this creative set, that comes with editable features. It contains large content boxes to add your information on topics like devops performance assessment metrics. You can also showcase facts, figures, and other relevant content using this PPT layout. Grab it now.
Operational Risk Metrics Dashboard Icon Mockup PDF
Presenting Operational Risk Metrics Dashboard Icon Mockup PDF to dispense important information. This template comprises four stages. It also presents valuable insights into the topics including Operational Risk Metrics Dashboard Icon. This is a completely customizable PowerPoint theme that can be put to use immediately. So, download it and address the topic impactfully.
Student Enrollment Education Metrics Icon Topics PDF
Presenting Student Enrollment Education Metrics Icon Topics PDF to dispense important information. This template comprises four stages. It also presents valuable insights into the topics including Student Enrollment, Education Metrics, Icon. This is a completely customizable PowerPoint theme that can be put to use immediately. So, download it and address the topic impactfully.
KPI Dashboard Metrics Security Icon Download PDF
Persuade your audience using this KPI Dashboard Metrics Security Icon Download PDF. This PPT design covers two stages, thus making it a great tool to use. It also caters to a variety of topics including Kpi Dashboard, Metrics Security Icon. Download this PPT design now to present a convincing pitch that not only emphasizes the topic but also showcases your presentation skills.
Robotic Process Automation Metrics Icon Download PDF
Pitch your topic with ease and precision using this Robotic Process Automation Metrics Icon Download PDF. This layout presents information on Automation Metrics Icon, Robotic Process. It is also available for immediate download and adjustment. So, changes can be made in the color, design, graphics or any other component to create a unique layout.
Pilot Program Success Metrics Icon Demonstration PDF
Persuade your audience using this Pilot Program Success Metrics Icon Demonstration PDF. This PPT design covers three stages, thus making it a great tool to use. It also caters to a variety of topics including Pilot Program Success, Metrics Icon. Download this PPT design now to present a convincing pitch that not only emphasizes the topic but also showcases your presentation skills.
Sales Target Metrics Achievement Icon Download PDF
Persuade your audience using this Sales Target Metrics Achievement Icon Download PDF. This PPT design covers four stages, thus making it a great tool to use. It also caters to a variety of topics including Sales Target Metrics, Achievement Icon. Download this PPT design now to present a convincing pitch that not only emphasizes the topic but also showcases your presentation skills.
Icon Depicting Operations Metrics Monitoring Diagrams PDF
Presenting Icon Depicting Operations Metrics Monitoring Diagrams PDF to dispense important information. This template comprises Three stages. It also presents valuable insights into the topics including Icon Depicting Operations, Metrics Monitoring. This is a completely customizable PowerPoint theme that can be put to use immediately. So, download it and address the topic impactfully.
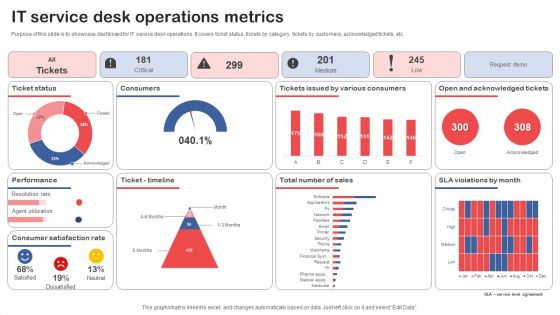
IT Service Desk Operations Metrics Summary PDF
Showcasing this set of slides titled IT Service Desk Operations Metrics Summary PDF. The topics addressed in these templates are IT Service, Desk Operations Metrics. All the content presented in this PPT design is completely editable. Download it and make adjustments in color, background, font etc. as per your unique business setting.

Understanding Companys Operational Metrics One Pager Documents
Presenting you an exemplary Understanding Companys Operational Metrics One Pager Documents. Our one-pager comprises all the must-have essentials of an inclusive document. You can edit it with ease, as its layout is completely editable. With such freedom, you can tweak its design and other elements to your requirements. Download this Understanding Companys Operational Metrics One Pager Documents brilliant piece now.
Maintenance Performance Metrics Dashboard Icon Inspiration PDF
Presenting Maintenance Performance Metrics Dashboard Icon Inspiration PDF to dispense important information. This template comprises three stages. It also presents valuable insights into the topics including Maintenance Performance, Metrics Dashboard Icon. This is a completely customizable PowerPoint theme that can be put to use immediately. So, download it and address the topic impactfully.
Digital Sales Metrics Showing Enhancement Icons PDF
The following slide represents statistics of online sales key performance indicators KPIs which can assist marketing manager to review their performance and take necessary steps. It include different metrics such as add to cart rate, conversion rate, and revenue per session. Showcasing this set of slides titled Digital Sales Metrics Showing Enhancement Icons PDF. The topics addressed in these templates are Quarterly Online Sales Metrics, Targeted Right Customers, Offered Product Recommendations. All the content presented in this PPT design is completely editable. Download it and make adjustments in color, background, font etc. as per your unique business setting.
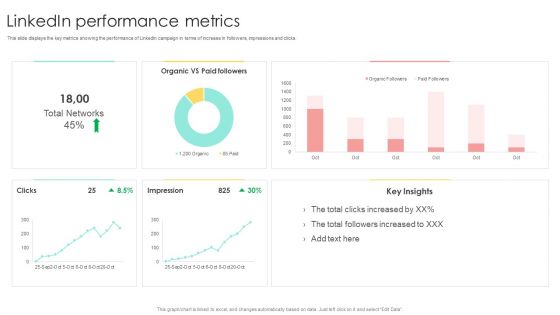
Media Advertising Linkedin Performance Metrics Mockup PDF
This slide displays the key metrics showing the performance of LinkedIn campaign in terms of increase in followers, impressions and clicks. Crafting an eye-catching presentation has never been more straightforward. Let your presentation shine with this tasteful yet straightforward Media Advertising Linkedin Performance Metrics Mockup PDF template. It offers a minimalistic and classy look that is great for making a statement. The colors have been employed intelligently to add a bit of playfulness while still remaining professional. Construct the ideal Media Advertising Linkedin Performance Metrics Mockup PDF that effortlessly grabs the attention of your audience Begin now and be certain to wow your customers
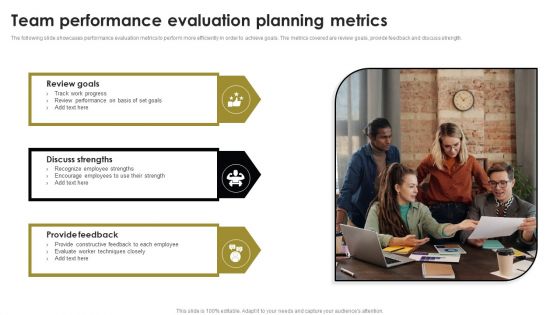
Team Performance Evaluation Planning Metrics Ideas PDF
The following slide showcases performance evaluation metrics to perform more efficiently in order to achieve goals. The metrics covered are review goals, provide feedback and discuss strength. Persuade your audience using this Team Performance Evaluation Planning Metrics Ideas PDF. This PPT design covers three stages, thus making it a great tool to use. It also caters to a variety of topics including Discuss Strengths, Review Goals, Provide Feedback. Download this PPT design now to present a convincing pitch that not only emphasizes the topic but also showcases your presentation skills.

Kpis And Operations Metrics Presentation Powerpoint Example
This is a kpis and operations metrics presentation powerpoint example. This is a five stage process. The stages in this process are customer class, affiliate, sales by warehouse, warehouse, profit by affiliate.
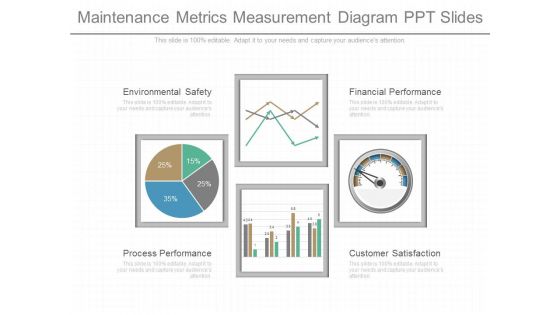
Maintenance Metrics Measurement Diagram Ppt Slides
This is a maintenance metrics measurement diagram ppt slides. This is a four stage process. The stages in this process are environmental safety, process performance, financial performance, customer satisfaction.
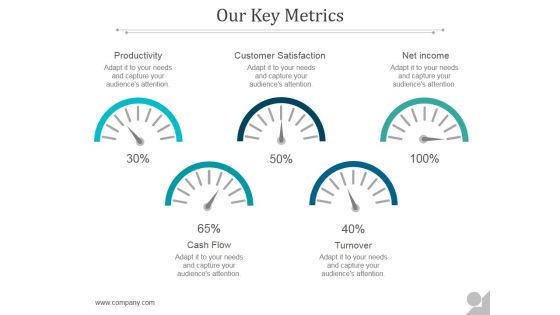
Our Key Metrics Ppt PowerPoint Presentation Examples
This is a our key metrics ppt powerpoint presentation examples. This is a five stage process. The stages in this process are productivity, customer satisfaction, net income, cash flow, turnover.
Our Key Metrics Ppt PowerPoint Presentation Portfolio
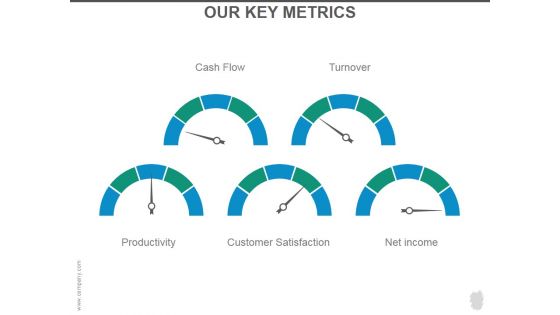
This is a our key metrics ppt powerpoint presentation portfolio. This is a five stage process. The stages in this process are cash flow, turnover, productivity, customer satisfaction, net income.
Performance Management System Metrics Ppt Presentation
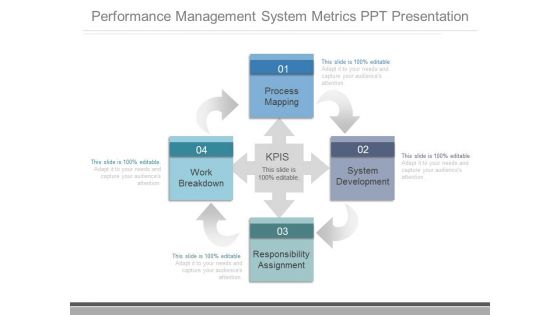
This is a performance management system metrics ppt presentation. This is a four stage process. The stages in this process are process mapping, work breakdown, responsibility assignment, system development, kpis.
Sales Metrics And Kpi Examples Presentation Slides
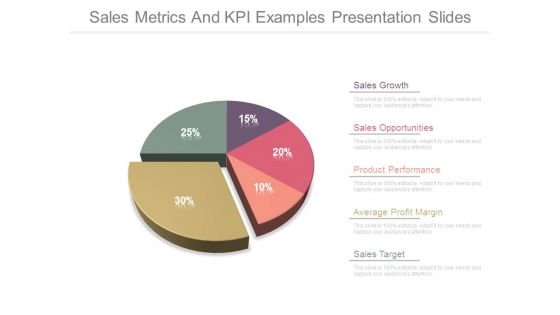
This is a sales metrics and kpi examples presentation slides. This is a five stage process. The stages in this process are sales growth, sales opportunities, product performance, average profit margin, sales target.
Balanced Scorecard Information Metrics Ppt Slides
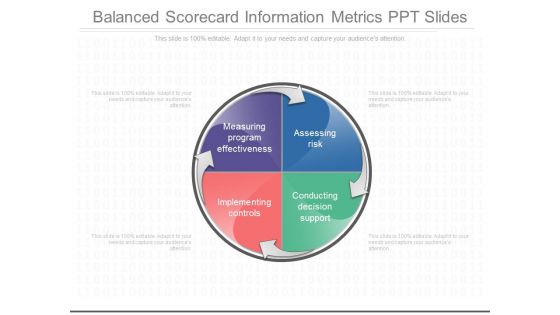
This is a balanced scorecard information metrics ppt slides. This is a four stage process. The stages in this process are assessing risk, conducting decision support, measuring program effectiveness, implementing controls.
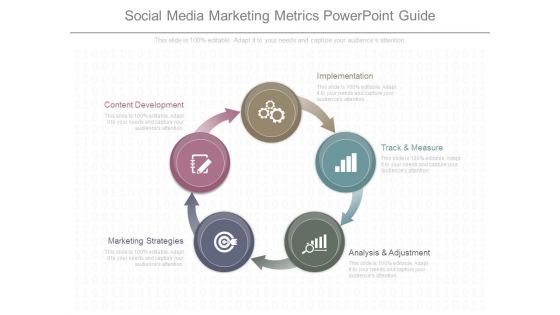
Social Media Marketing Metrics Powerpoint Guide
This is a social media marketing metrics powerpoint guide. This is a five stage process. The stages in this process are implementation, track and measure, analysis and adjustment, marketing strategies, content development.

Performance Driver Metrics Diagram Powerpoint Show
This is a performance driver metrics diagram powerpoint show. This is a five stage process. The stages in this process are values, behavior, habits of action, habits of thinking, competence.
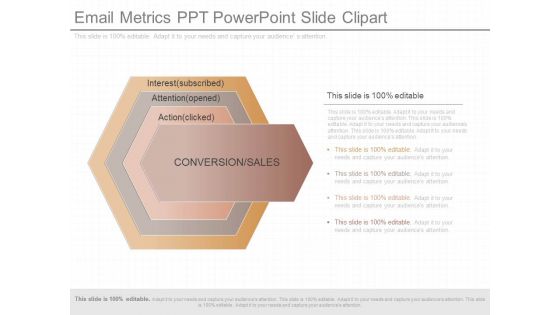
Email Metrics Ppt Powerpoint Slide Clipart
This is a email metrics ppt powerpoint slide clipart. This is a four stage process. The stages in this process are interest subscribed, attention opened, action clicked, conversion sales.
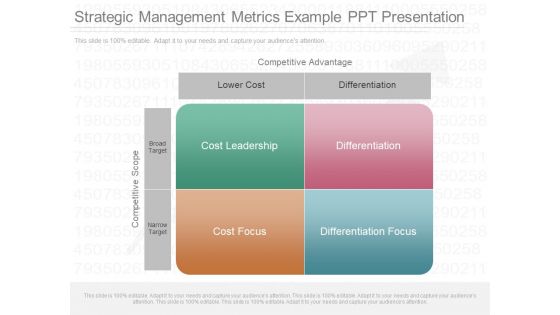
Strategic Management Metrics Example Ppt Presentation

Understanding Of Financial Metrics Diagram Powerpoint Shapes
This is a understanding of financial metrics diagram powerpoint shapes. This is a four stage process. The stages in this process are income statement, changes in financial position, balance sheet, retained earnings.

Ecommerce Metrics Integration Diagram Ppt Images
This is a ecommerce metrics integration diagram ppt images. This is a seven stage process. The stages in this process are financial, idea, searching, social media, email, purchase, communication.
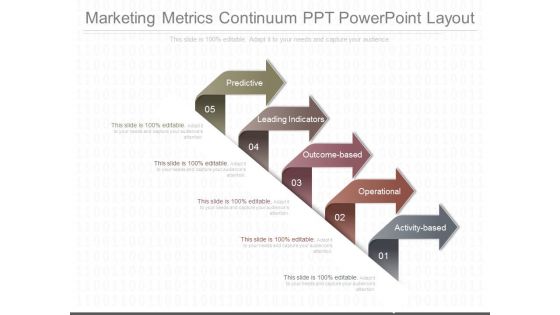
Marketing Metrics Continuum Ppt Powerpoint Layout
This is a marketing metrics continuum ppt powerpoint layout. This is a five stage process. The stages in this process are predictive, leading indicators, outcome based, operational, activity based.
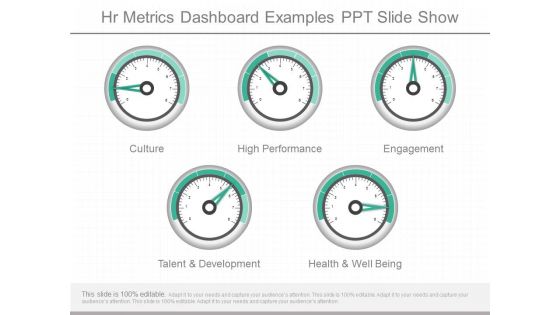
Hr Metrics Dashboard Examples Ppt Slide Show
This is a hr metrics dashboard examples ppt slide show. This is a five stage process. The stages in this process are culture, high performance, engagement, talent and development, health and well being.
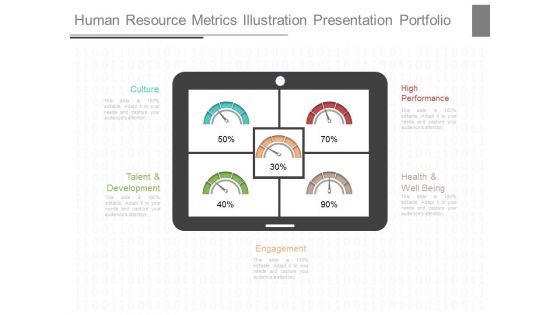
Human Resource Metrics Illustration Presentation Portfolio
This is a human resource metrics illustration presentation portfolio. This is a five stage process. The stages in this process are culture, high performance, talent and development, health and well being, engagement.
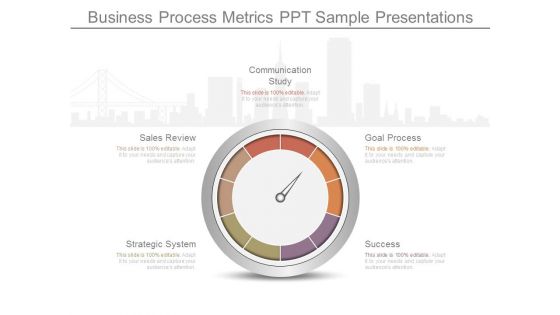
Business Process Metrics Ppt Sample Presentations
This is a business process metrics ppt sample presentations. This is a five stage process. The stages in this process are communication study, goal process, success, strategic system, sales review.

Business Operations Metrics Template Ppt Background Images
This is a business operations metrics template ppt background images. This is a three stage process. The stages in this process are performance data, trend summary data, detailed data.

Market Study Metrics Example Ppt Slide Themes
This is a market study metrics example ppt slide themes. This is a four stage process. The stages in this process are market research, focus groups, interviews, libraries, government agencies.

Multichannel Marketing Metrics Ppt Images Gallery
This is a multichannel marketing metrics ppt images gallery. This is a four stage process. The stages in this process are sales density, personnel cost, real estate cost, inventory turnover, supermarkets, soft discount, hard discount.
Software Development Performance Metrics Diagram Ppt Slide
This is a software development performance metrics diagram ppt slide. This is a three stage process. The stages in this process are overall business strategy, situation analysis, priority setting.
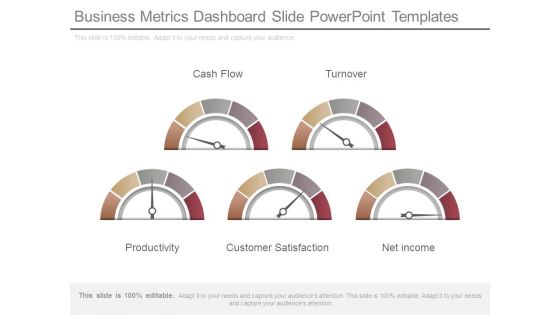
Business Metrics Dashboard Slide Powerpoint Templates
This is a business metrics dashboard slide powerpoint templates. This is a five stage process. The stages in this process are cash flow, turnover, productivity, customer satisfaction, net income.
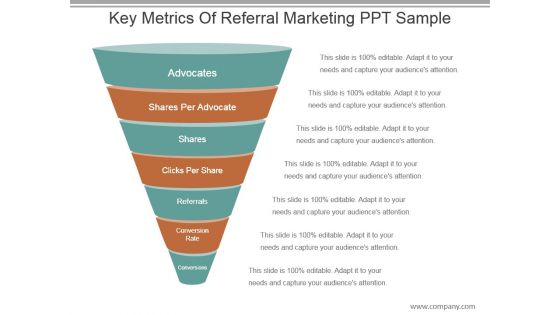
Key Metrics Of Referral Marketing Ppt Sample
This is a key metrics of referral marketing ppt sample. This is a seven stage process. The stages in this process are advocates, shares per advocate, shares, clicks per share, referrals, conversion rate, conversions.
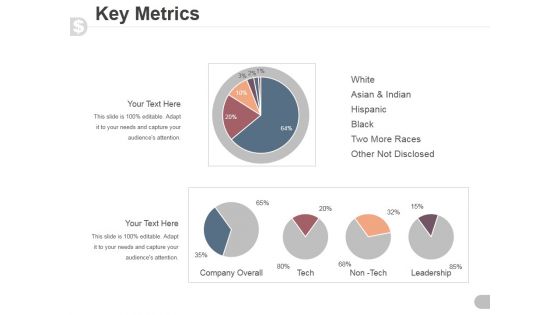
Key Metrics Ppt PowerPoint Presentation Visual Aids
This is a key metrics ppt powerpoint presentation visual aids. This is a five stage process. The stages in this process are white, asian and indian, hispanic, black, two more races, other not disclosed.
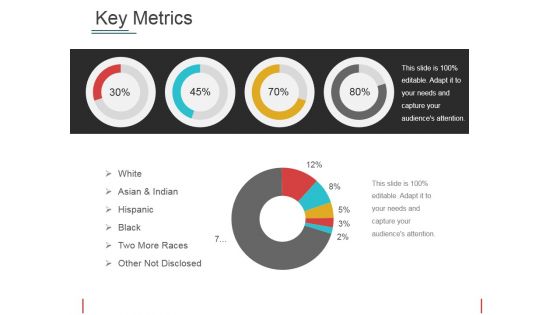
Key Metrics Ppt PowerPoint Presentation Model Professional
This is a key metrics ppt powerpoint presentation model professional. This is a four stage process. The stages in this process are white, asian and indian, hispanic, black, two more races, other not disclosed.
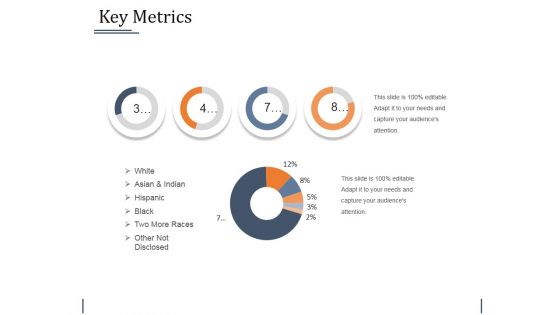
Key Metrics Ppt PowerPoint Presentation Outline Templates
This is a key metrics ppt powerpoint presentation outline templates. This is a four stage process. The stages in this process are white, asian and indian, hispanic, black, two more races, other not disclosed.
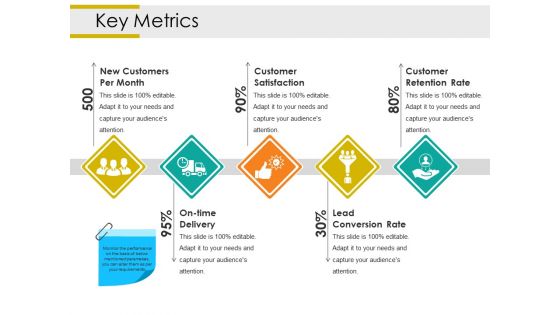
Key Metrics Ppt PowerPoint Presentation Layouts Good
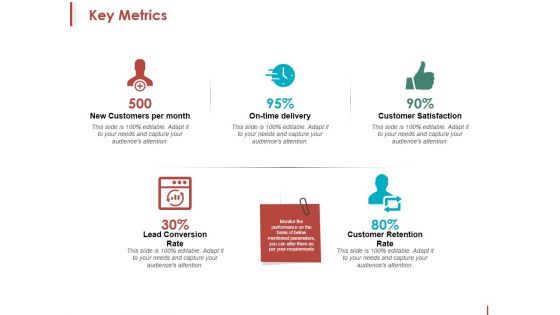
This is a key metrics ppt powerpoint presentation layouts good. This is a five stage process. The stages in this process are new customers per month, customer satisfaction, customer retention rate, lead conversion rate, on time delivery.
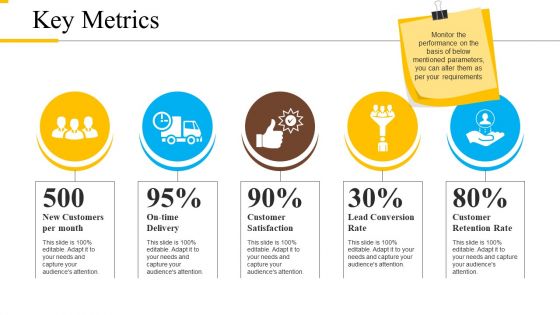
Key Metrics Ppt PowerPoint Presentation Professional Slideshow
This is a key metrics ppt powerpoint presentation professional slideshow. This is a five stage process. The stages in this process are new customers per month, on time delivery, customer satisfaction, lead conversion rate, customer retention rate.
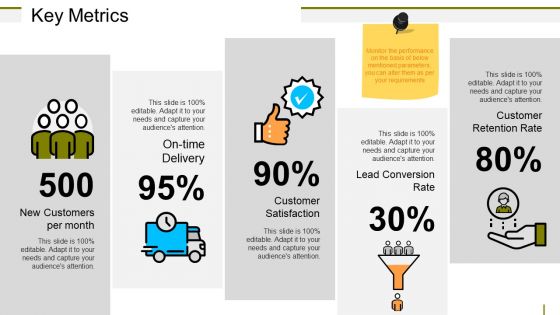
Key Metrics Ppt PowerPoint Presentation Model Portrait
Key Metrics Ppt PowerPoint Presentation Inspiration Format
This is a key metrics ppt powerpoint presentation inspiration format. This is a five stage process. The stages in this process are new customers per month, on time delivery, customer satisfaction, customer retention rate.
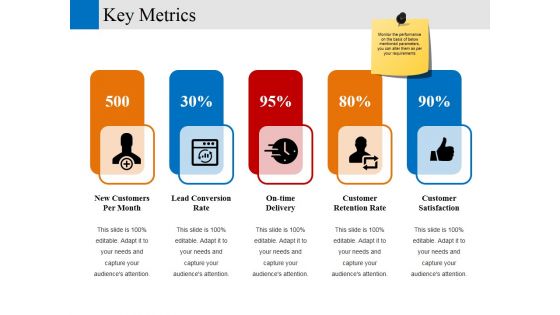
Key Metrics Ppt PowerPoint Presentation Layouts Ideas
This is a key metrics ppt powerpoint presentation layouts ideas. This is a five stage process. The stages in this process are new customers per month, lead conversion rate, on time delivery, customer retention rate, customer satisfaction.
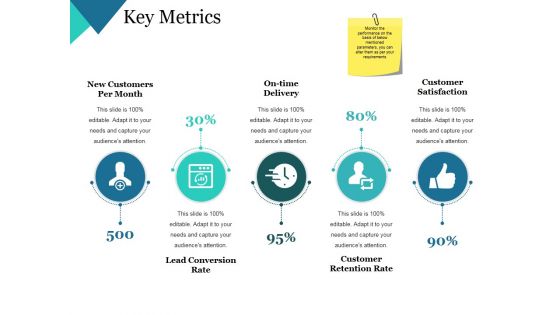
Key Metrics Ppt PowerPoint Presentation Themes
This is a key metrics ppt powerpoint presentation themes. This is a five stage process. The stages in this process are new customers per month, on time delivery, customer satisfaction, customer retention rate, lead conversion rate.
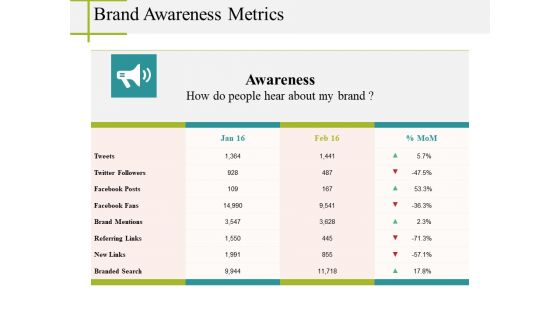
Brand Awareness Metrics Ppt PowerPoint Presentation Styles
This is a brand awareness metrics ppt powerpoint presentation styles. This is a four stage process. The stages in this process are twitter followers, facebook posts, facebook fans, brand mentions, new links.
New Commodity Development Assessment Metrics Icons PDF
The following slide highlights the key metrics to evaluate product performance. It includes elements such as product wise revenue, time to the market etc.Pitch your topic with ease and precision using this New Commodity Development Assessment Metrics Icons PDF. This layout presents information on Annual Product, Wise Revenue, Shown Continuous. It is also available for immediate download and adjustment. So, changes can be made in the color, design, graphics or any other component to create a unique layout.
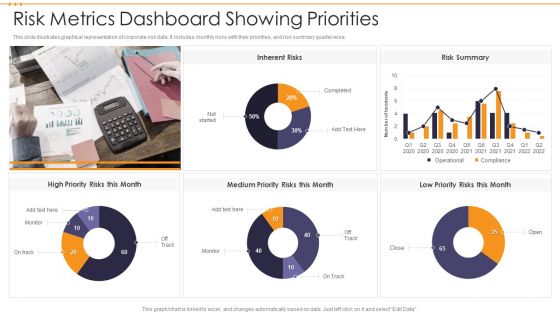
Risk Metrics Dashboard Showing Priorities Infographics PDF
This slide illustrates graphical representation of corporate risk data. It includes monthly risks with their priorities, and risk summary quarter wise. Showcasing this set of slides titled Risk Metrics Dashboard Showing Priorities Infographics PDF. The topics addressed in these templates are Risk Metrics Dashboard Showing Priorities. All the content presented in this PPT design is completely editable. Download it and make adjustments in color, background, font etc. as per your unique business setting.

Comparing Hospital Metrics With Competitors Themes PDF
This slide shows the comparison of hospital metrics with competitors such as average length of patient stay, time to service, patient satisfaction, physician performance, patient readmission rate, operating margin, etc.Deliver and pitch your topic in the best possible manner with this Comparing Hospital Metrics With Competitors Themes PDF Use them to share invaluable insights on Patient Satisfaction, Patient Readmission, Impatient Mortality and impress your audience. This template can be altered and modified as per your expectations. So, grab it now.
Fb Advertising Campaign Performance Metrics Icons PDF
The following slide showcases performance metrics to assess a companys behavior, actions, and performance. It includes results, cost per impression and frequency. Presenting Fb Advertising Campaign Performance Metrics Icons PDF to dispense important information. This template comprises three stages. It also presents valuable insights into the topics including Cost Per Impression, Frequency, Results. This is a completely customizable PowerPoint theme that can be put to use immediately. So, download it and address the topic impactfully.
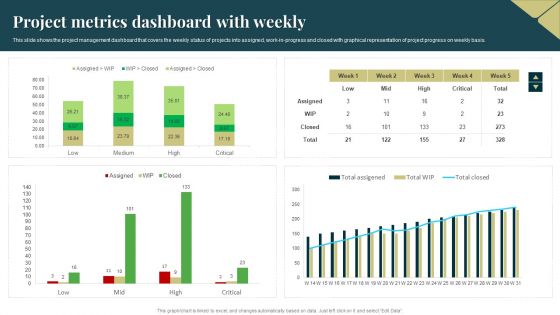
Project Metrics Dashboard With Weekly Formats PDF
This slide shows the project management dashboard that covers the weekly status of projects into assigned, work in progress and closed with graphical representation of project progress on weekly basis. Showcasing this set of slides titled Project Metrics Dashboard With Weekly Formats PDF. The topics addressed in these templates are Project Metrics, Dashboard With Weekly. All the content presented in this PPT design is completely editable. Download it and make adjustments in color, background, font etc. as per your unique business setting.
Metrics Showcasing Project Management Operations Icons PDF
This slide exhibits project management operations dashboard. It covers task status, budget status, pending tasks, activity progress status etc to track project progress. Showcasing this set of slides titled Metrics Showcasing Project Management Operations Icons PDF. The topics addressed in these templates are Metrics Showcasing, Project Management Operations. All the content presented in this PPT design is completely editable. Download it and make adjustments in color, background, font etc. as per your unique business setting.

Various CRM Program Success Metrics Designs PDF
This slide covers information regarding the metrics associated customer relationship to analyze CRM program success. Make sure to capture your audiences attention in your business displays with our gratis customizable Various CRM Program Success Metrics Designs PDF. These are great for business strategies, office conferences, capital raising or task suggestions. If you desire to acquire more customers for your tech business and ensure they stay satisfied, create your own sales presentation with these plain slides.
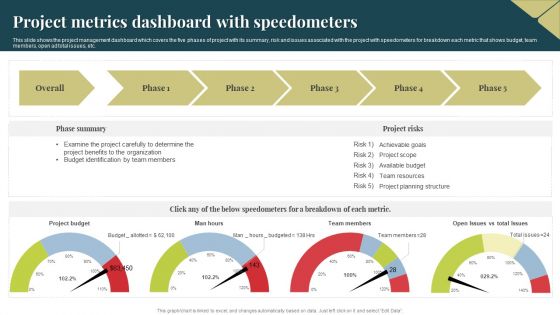
Project Metrics Dashboard With Speedometers Themes PDF
This slide shows the project management dashboard which covers the five phases of project with its summary, risk and issues associated with the project with speedometers for breakdown each metric that shows budget, team members, open ad total issues, etc. Showcasing this set of slides titled Project Metrics Dashboard With Speedometers Themes PDF. The topics addressed in these templates are Budget, Project Benefits, Organization. All the content presented in this PPT design is completely editable. Download it and make adjustments in color, background, font etc. as per your unique business setting.
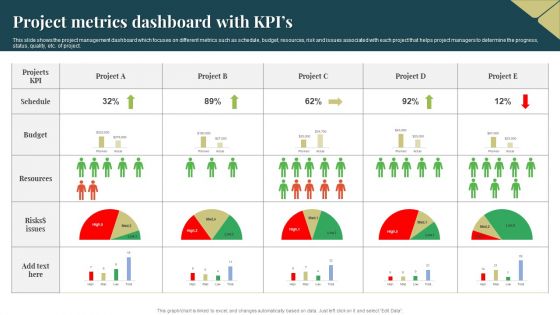
Project Metrics Dashboard With Kpis Ideas PDF
This slide shows the project management dashboard which focuses on different metrics such as schedule, budget, resources, risk and issues associated with each project that helps project managers to determine the progress, status, quality, etc. of project. Pitch your topic with ease and precision using this Project Metrics Dashboard With Kpis Ideas PDF. This layout presents information on Resources, Budget, Risks. It is also available for immediate download and adjustment. So, changes can be made in the color, design, graphics or any other component to create a unique layout.
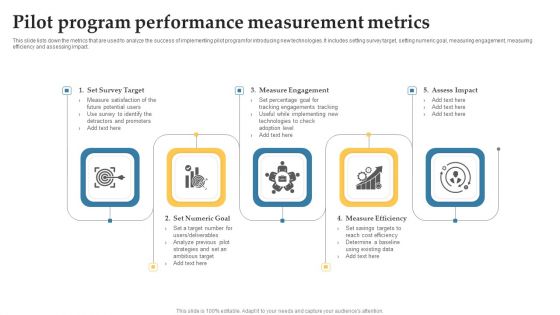
Pilot Program Performance Measurement Metrics Ideas PDF
This slide lists down the metrics that are used to analyze the success of implementing pilot program for introducing new technologies. It includes setting survey target, setting numeric goal, measuring engagement, measuring efficiency and assessing impact. Persuade your audience using this Pilot Program Performance Measurement Metrics Ideas PDF. This PPT design covers five stages, thus making it a great tool to use. It also caters to a variety of topics including Measure Engagement, Assess Impact, Measure Efficiency. Download this PPT design now to present a convincing pitch that not only emphasizes the topic but also showcases your presentation skills.

Insurance Sales Procedure Evaluation Metrics Graphics PDF
The following slide highlights evaluation metrics for insurance sales cycle to recognize areas of operational success and failure. It includes KPIs such as quote rate, quota rate, contract rate, number of referrals, percentage pending and sales growth rate. Presenting Insurance Sales Procedure Evaluation Metrics Graphics PDF to dispense important information. This template comprises six stages. It also presents valuable insights into the topics including Contract Rate, Percentage Pending, Sales Growth Rate . This is a completely customizable PowerPoint theme that can be put to use immediately. So, download it and address the topic impactfully.

Construction Project Expectation Management Metrics Mockup PDF
The following slide highlights the construction project expectation management metrics illustrating measure of success which include scope, time, cost and quality priority, expectation and guidelines to assist the project manager to allocate more resources for high priority tasks. Showcasing this set of slides titled construction project expectation management metrics mockup pdf. The topics addressed in these templates are measure of success, time, cost. All the content presented in this PPT design is completely editable. Download it and make adjustments in color, background, font etc. as per your unique business setting.
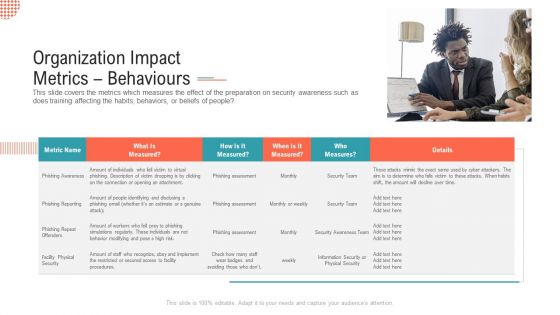
Organization Impact Metrics Behaviours Structure PDF
This slide covers the metrics which measures the effect of the preparation on security awareness such as does training affecting the habits, behaviors, or beliefs of people This is a organization impact metrics behaviours structure pdf. template with various stages. Focus and dispense information on one stage using this creative set, that comes with editable features. It contains large content boxes to add your information on topics like phishing reporting, phishing repeat offenders. You can also showcase facts, figures, and other relevant content using this PPT layout. Grab it now.

Software Application Development Performance Metrics Mockup PDF
This slide showcase software application metrics indicator to monitor software quantitative measure for achieving improvement in application and alignment with organization objectives. It includes indicators like CPU usage, memory usage, per minute and byte per requester rate, security exposure and latency and uptime Persuade your audience using this Software Application Development Performance Metrics Mockup PDF. This PPT design covers Six stages, thus making it a great tool to use. It also caters to a variety of topics including Latency And Uptime, Memory Usage, Security Exposure . Download this PPT design now to present a convincing pitch that not only emphasizes the topic but also showcases your presentation skills.
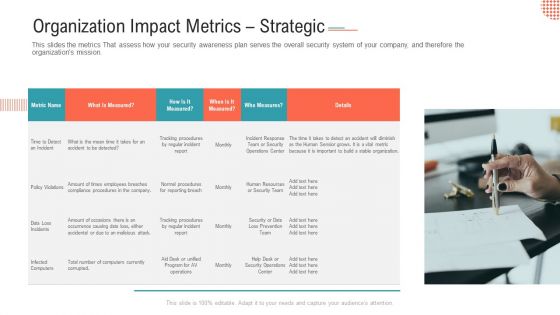
Organization Impact Metrics Strategic Themes PDF
This slides the metrics That assess how your security awareness plan serves the overall security system of your company, and therefore the organizations mission.Presenting organization impact metrics strategic themes pdf. to provide visual cues and insights. Share and navigate important information on one stage that need your due attention. This template can be used to pitch topics like data loss incidents, infected computers, total number of computers currently corrupted. In addtion, this PPT design contains high resolution images, graphics, etc, that are easily editable and available for immediate download.

Dashboard Depicting Customer Accomplishment Metrics Slides PDF
This slide covers the dashboard that depicts customer success metrics which includes total number of customers, net promoter score, support tickets, opportunities, contacts which are active and inactive, customer journey such as onboarding, growth, value achieved, renewal, etc. Showcasing this set of slides titled dashboard depicting customer accomplishment metrics slides pdf. The topics addressed in these templates are customers, unhealthy, support tickets. All the content presented in this PPT design is completely editable. Download it and make adjustments in color, background, font etc. as per your unique business setting.
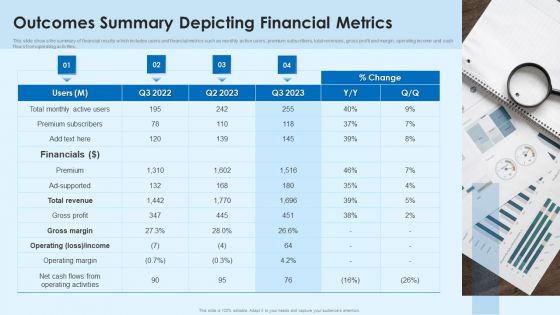
Outcomes Summary Depicting Financial Metrics Designs PDF
This slide shows the summary of financial results which includes users and financial metrics such as monthly active users, premium subscribers, total revenues, gross profit and margin, operating income and cash flows from operating activities.Showcasing this set of slides titled Outcomes Summary Depicting Financial Metrics Designs PDF The topics addressed in these templates are Operating Margin, Gross Profit, Operating Activities All the content presented in this PPT design is completely editable. Download it and make adjustments in color, background, font etc. as per your unique business setting.
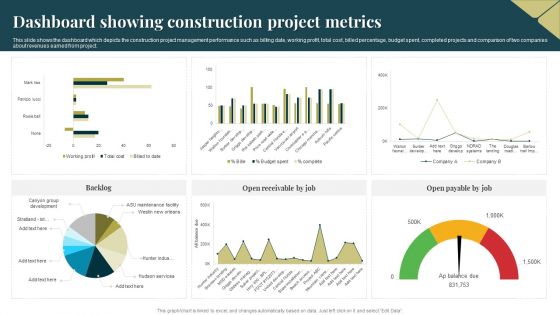
Dashboard Showing Construction Project Metrics Sample PDF
This slide shows the dashboard which depicts the construction project management performance such as billing date, working profit, total cost, billed percentage, budget spent, completed projects and comparison of two companies about revenues earned from project. Showcasing this set of slides titled Dashboard Showing Construction Project Metrics Sample PDF. The topics addressed in these templates are Dashboard, Construction Project Metrics. All the content presented in this PPT design is completely editable. Download it and make adjustments in color, background, font etc. as per your unique business setting.
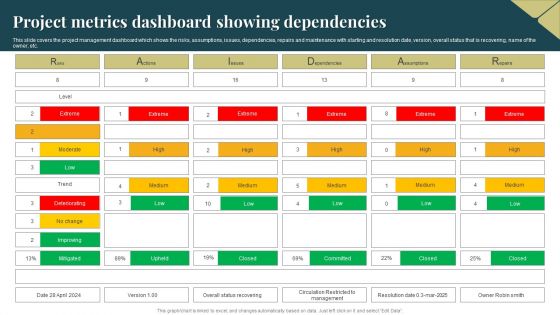
Project Metrics Dashboard Showing Dependencies Brochure PDF
This slide covers the project management dashboard which shows the risks, assumptions, issues, dependencies, repairs and maintenance with starting and resolution date, version, overall status that is recovering, name of the owner, etc. Showcasing this set of slides titled Project Metrics Dashboard Showing Dependencies Brochure PDF. The topics addressed in these templates are Project Metrics, Dashboard Showing Dependencies. All the content presented in this PPT design is completely editable. Download it and make adjustments in color, background, font etc. as per your unique business setting.
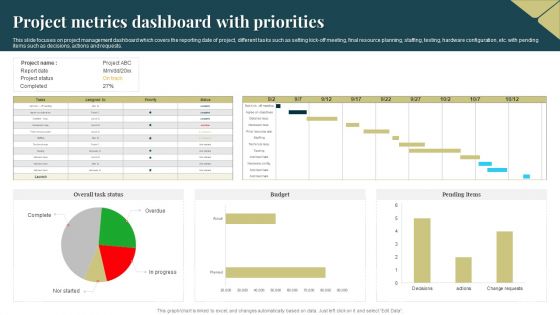
Project Metrics Dashboard With Priorities Formats PDF
This slide focuses on project management dashboard which covers the reporting date of project, different tasks such as setting kick-off meeting, final resource planning, staffing, testing, hardware configuration, etc. with pending items such as decisions, actions and requests. Showcasing this set of slides titled Project Metrics Dashboard With Priorities Formats PDF. The topics addressed in these templates are Budget, Project Metrics Dashboard. All the content presented in this PPT design is completely editable. Download it and make adjustments in color, background, font etc. as per your unique business setting.

Project Metrics Dashboard With Responsibilities Graphics PDF
This slide focuses on project management dashboard which shows the number of projects, types of objects, key performance indicators, viewpoints, overall project status with actions and progress, responsibilities with linked object types and actions, etc. Pitch your topic with ease and precision using this Project Metrics Dashboard With Responsibilities Graphics PDF. This layout presents information on Project Metrics, Dashboard With Responsibilities. It is also available for immediate download and adjustment. So, changes can be made in the color, design, graphics or any other component to create a unique layout.
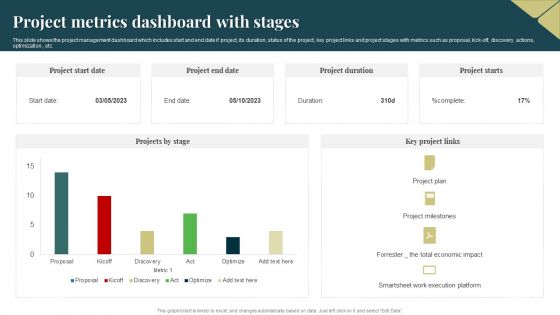
Project Metrics Dashboard With Stages Download PDF
This slide shows the project management dashboard which includes start and end date if project, its duration, status of the project, key project links and project stages with metrics such as proposal, kick off, discovery, actions, optimization , etc. Pitch your topic with ease and precision using this Project Metrics Dashboard With Stages Download PDF. This layout presents information on Economic, Project Plan, Execution. It is also available for immediate download and adjustment. So, changes can be made in the color, design, graphics or any other component to create a unique layout.
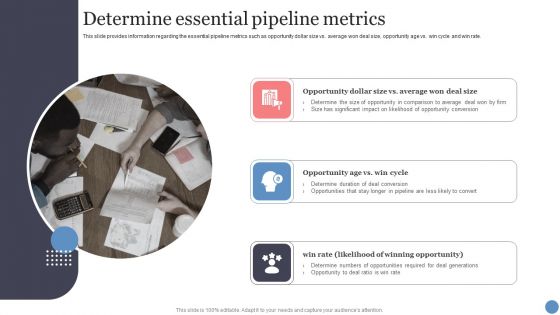
Determine Essential Pipeline Metrics Mockup PDF
This slide provides information regarding the essential pipeline metrics such as opportunity dollar size vs. average won deal size, opportunity age vs. win cycle and win rate. This is a Determine Essential Pipeline Metrics Mockup PDF template with various stages. Focus and dispense information on three stages using this creative set, that comes with editable features. It contains large content boxes to add your information on topics like Opportunity, Determine Numbers, Average Deal. You can also showcase facts, figures, and other relevant content using this PPT layout. Grab it now.
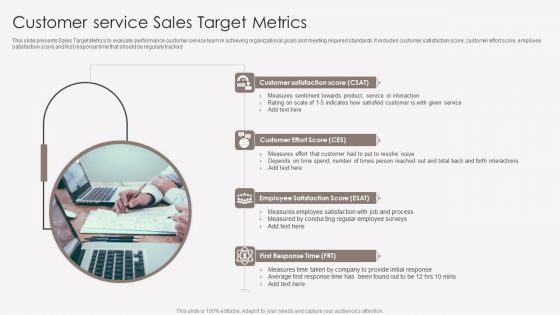
Customer Service Sales Target Metrics Download PDF
This slide presents Sales Target Metrics to evaluate performance customer service team in achieving organizational goals and meeting required standards. It includes customer satisfaction score, customer effort score, employee satisfaction score and first response time that should be regularly tracked. Persuade your audience using this Customer Service Sales Target Metrics Download PDF. This PPT design covers four stages, thus making it a great tool to use. It also caters to a variety of topics including Customer Satisfaction, Employee Satisfaction, First Response Time. Download this PPT design now to present a convincing pitch that not only emphasizes the topic but also showcases your presentation skills.

Website Design Procedure Success Metrics Formats PDF
This slide showcases website design process metrics the amount of interaction your website visitors have with your website and online brand. It includes page reviews , average time , average session duration , bounce rate , traffic sources etc. Showcasing this set of slides titled Website Design Procedure Success Metrics Formats PDF. The topics addressed in these templates are Page Views, Average Time, Bounce Rate . All the content presented in this PPT design is completely editable. Download it and make adjustments in color, background, font etc. as per your unique business setting.

Digital Marketing Investment Metrics Dashboard Professional PDF
This slide showcases the overview of various parameters of online advertising campaign. It includes the total marketing investment, number of link click, impression made, click through rate, conversion rate, lead conversion cost etc. Showcasing this set of slides titled Digital Marketing Investment Metrics Dashboard Professional PDF. The topics addressed in these templates are Campaign Total Cost, Cost Per Lead Conversion, Investment Metrics Dashboard. All the content presented in this PPT design is completely editable. Download it and make adjustments in color, background, font etc. as per your unique business setting.

Website Medical Checkup Metrics Dashboard Introduction PDF
The following slide showcases a dashboard to identify key issues and boost website performance. It includes key elements like crawled URLs, health score, issues, found links, URL by errors and top issues. Showcasing this set of slides titled Website Medical Checkup Metrics Dashboard Introduction PDF. The topics addressed in these templates are Website Medical Checkup, Metrics Dashboard. All the content presented in this PPT design is completely editable. Download it and make adjustments in color, background, font etc. as per your unique business setting.
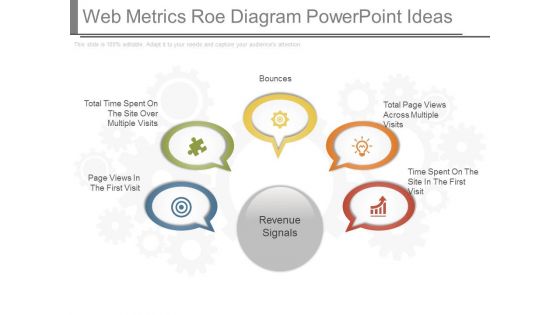
Web Metrics Roe Diagram Powerpoint Ideas
This is a web metrics roe diagram powerpoint ideas. This is a five stage process. The stages in this process are page views in the first visit, total time spent on the site over multiple visits, bounces, total page views across multiple visits, time spent on the site in the first visit.
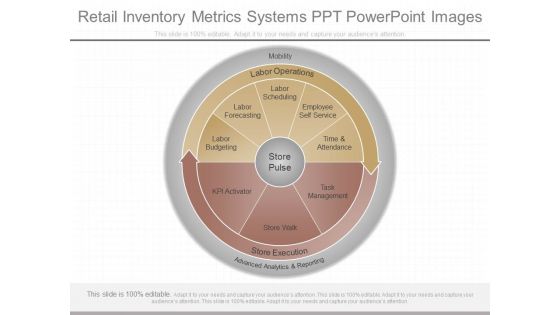
Retail Inventory Metrics Systems Ppt Powerpoint Images
This is a retail inventory metrics systems ppt powerpoint images. This is a one stage process. The stages in this process are mobility, labor operations, store pulse, labor budgeting, labor forecasting, labor scheduling, employee self service, time and attendance, kpi activator, store walk, task management, store execution, advanced analytics and reporting.
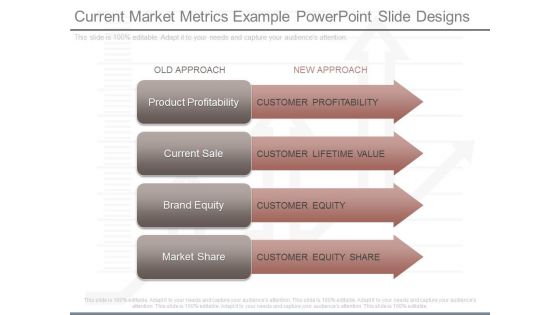
Current Market Metrics Example Powerpoint Slide Designs
This is a current market metrics example powerpoint slide designs. This is a four stage process. The stages in this process are old approach, new approach, product profitability, customer profitability, current sale, customer lifetime value, brand equity, customer equity, market share, customer equity share.

Email Marketing Metrics Diagram Powerpoint Presentation
This is a email marketing metrics diagram powerpoint presentation. This is a three stage process. The stages in this process are is email marketing producing roi, is email team size, produces significant roi, produces same roi, will eventually produce roi, indirectly produce roi, not likely to produce roi unsure, email team size.
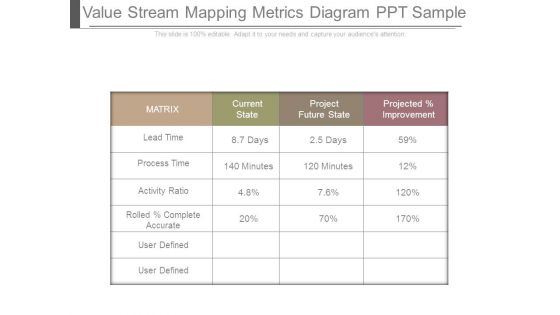
Value Stream Mapping Metrics Diagram Ppt Sample
This is a value stream mapping metrics diagram ppt sample. This is a four stage process. The stages in this process are matrix, current state, project future state, projected improvement, lead time, days, process time, activity ratio, rolled complete accurate, user defined, minutes.

Product Management KPI Marketing Metrics Background PDF
Deliver an awe-inspiring pitch with this creative product management kpi marketing metrics background pdf. bundle. Topics like traffic sources, revenue generated can be discussed with this completely editable template. It is available for immediate download depending on the needs and requirements of the user.
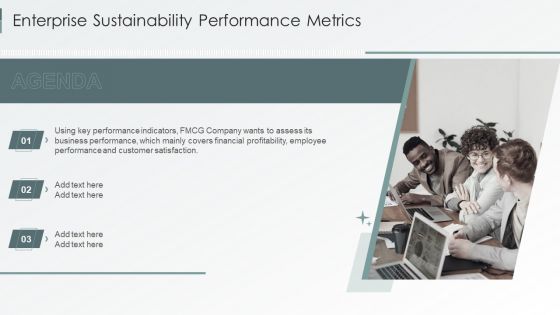
Agenda Enterprise Sustainability Performance Metrics Ideas PDF

Software Performance Metrics Development Template PDF
Presenting Software Performance Metrics Development Template PDF to dispense important information. This template comprises Five stages. It also presents valuable insights into the topics including Customer Satisfaction, Team Velocity, Release Breakdown. This is a completely customizable PowerPoint theme that can be put to use immediately. So, download it and address the topic impactfully.
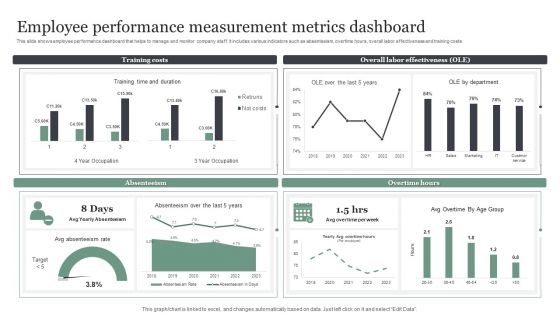
Employee Performance Measurement Metrics Dashboard Brochure PDF
This slide shows employee performance dashboard that helps to manage and monitor company staff. It includes various indicators such as absenteeism, overtime hours, overall labor effectiveness and training costs. Showcasing this set of slides titled Employee Performance Measurement Metrics Dashboard Brochure PDF. The topics addressed in these templates are Training Costs, Overall Labor Effectiveness. All the content presented in this PPT design is completely editable. Download it and make adjustments in color, background, font etc. as per your unique business setting.
Sample Project Management Metrics Ppt Powerpoint Show
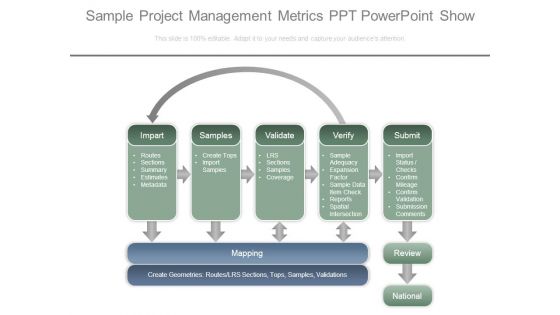
This is a sample project management metrics ppt powerpoint show. This is a seven stage process. The stages in this process are impart, routes, sections, summary, estimates, metadata, samples, create tops, import samples, validate, lrs, sections, samples, coverage, verify, sample, adequacy, expansion factor, sample data item check, reports, spatial intersection, impart, routes, sections, summary, estimates, metadata, samples, create tops, import samples, validate, lrs, sections, samples, coverage, verify, sample, adequacy, expansion factor, sample data item check, reports, spatial intersection.
Dashboard Depicting Construction Project Metrics Inspiration PDF
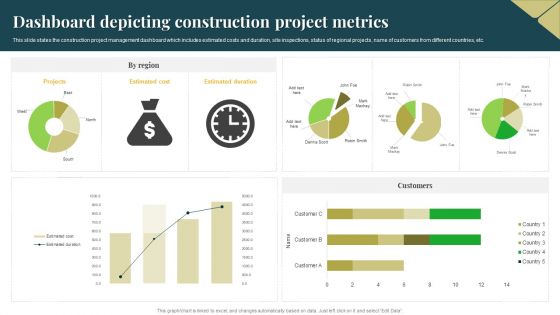
This slide states the construction project management dashboard which includes estimated costs and duration, site inspections, status of regional projects, name of customers from different countries, etc. Pitch your topic with ease and precision using this Dashboard Depicting Construction Project Metrics Inspiration PDF. This layout presents information on Estimated Cost, Estimated Duration, Projects. It is also available for immediate download and adjustment. So, changes can be made in the color, design, graphics or any other component to create a unique layout.

Project Metrics Dashboard Depicting Financials Pictures PDF
This slide shows the project management dashboard which covers the monthly sales graph and project financials such as reviewing, setup, coding, testing, getting feedback from users, training, implementation and launching. Pitch your topic with ease and precision using this Project Metrics Dashboard Depicting Financials Pictures PDF. This layout presents information on Execution, Project Financial. It is also available for immediate download and adjustment. So, changes can be made in the color, design, graphics or any other component to create a unique layout.

Project Metrics Dashboard With Commitments Mockup PDF
This slide focuses on the project management dashboard which includes the actual income, status, duration progress, project health with work schedule and budget, expenses, commitments, current status such as order, revised, billed, etc. Showcasing this set of slides titled Project Metrics Dashboard With Commitments Mockup PDF. The topics addressed in these templates are Expenses, Budget, Average. All the content presented in this PPT design is completely editable. Download it and make adjustments in color, background, font etc. as per your unique business setting.

Campaign Metrics With Traffic Report Information PDF
This template covers about traffic generated with daily number of sessions by user. This further includes behavioral response through analyzing page views. Pitch your topic with ease and precision using this Campaign Metrics With Traffic Report Information PDF. This layout presents information on Origins, Behaviour, Bounce Rate. It is also available for immediate download and adjustment. So, changes can be made in the color, design, graphics or any other component to create a unique layout.
Online Advertising Weekly Campaign Metrics Designs PDF
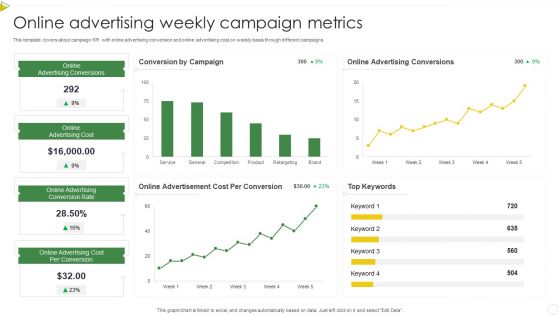
This template covers about campaign KPI with online advertising conversion and online advertising cost on weekly basis through different campaigns. Showcasing this set of slides titled Online Advertising Weekly Campaign Metrics Designs PDF. The topics addressed in these templates are Online Advertising Cost, Online Advertising Conversions. All the content presented in this PPT design is completely editable. Download it and make adjustments in color, background, font etc. as per your unique business setting.

Key Web Software Performance Metrics Background PDF
Persuade your audience using this Key Web Software Performance Metrics Background PDF. This PPT design covers Seven stages, thus making it a great tool to use. It also caters to a variety of topics including User Satisfaction, Peak Response Time, Time To Interactive. Download this PPT design now to present a convincing pitch that not only emphasizes the topic but also showcases your presentation skills.

Metrics Scorecard For HR Manager Download PDF
This slide showcases KPI scorecard that can help to do the performance assessment of human resource manager. Its key result areas are recruitment, training and development, performance and career management and employee retention plus productivity. Showcasing this set of slides titled Metrics Scorecard For HR Manager Download PDF. The topics addressed in these templates are Key Results Areas, Recruitment, Training Development. All the content presented in this PPT design is completely editable. Download it and make adjustments in color, background, font etc. as per your unique business setting.
Facility Planning Management Kpis Metrics Portrait PDF
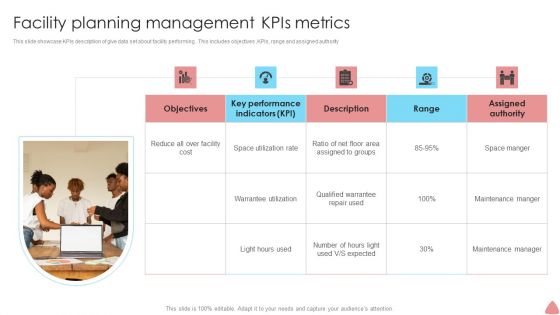
This slide showcase KPIs description of give data set about facility performing . This includes objectives ,KPIs, range and assigned authority. Persuade your audience using this Facility Planning Management Kpis Metrics Portrait PDF. This PPT design covers five stages, thus making it a great tool to use. It also caters to a variety of topics including Key Performance Indicators, Assigned Authority, Space Utilization Rate. Download this PPT design now to present a convincing pitch that not only emphasizes the topic but also showcases your presentation skills.

 Home
Home