Line Graph

Sample Of Operation Management Topics Diagram Ppt Templates
This is a sample of operation management topics diagram ppt templates. This is a eight stage process. The stages in this process are scheduling, aggregate planning, inventory, forecasting, flows and waiting lines, quality tools, quality, strategy.

Sigma Performance Levels Ppt Infographics
This is a sigma performance levels ppt infographics. This is a five stage process. The stages in this process are engagement, bottom line, project by project, trained individuals, customer focused.
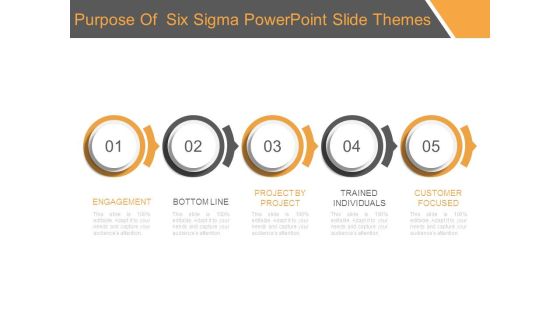
Purpose Of Six Sigma Powerpoint Slide Themes
This is a purpose of six sigma powerpoint slide themes. This is a five stage process. The stages in this process are engagement, bottom line, project by project, trained individuals, customer focused.

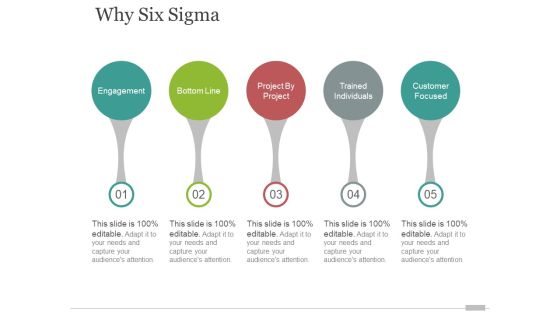
Why Six Sigma Template 1 Ppt PowerPoint Presentation Infographic Template Slide
This is a why six sigma template 1 ppt powerpoint presentation infographic template slide. This is a five stage process. The stages in this process are engagement, bottom line, project by project, trained individuals, customer focused.

Network Topology Tool Diagram Powerpoint Shape
This is a network topology tool diagram powerpoint shape. This is a seven stage process. The stages in this process are mesh, star, ring, fully connected, bus, tree, line.

Market Saturation Of Branded Goods Example Presentation Design
This is a market saturation of branded goods example presentation design. This is a ten stage process. The stages in this process are differentiation, ideas and evaluations, test marketing, product lines, product, decisions, risk choices, distribution.

Why Six Sigma Tamplate 2 Ppt PowerPoint Presentation Templates
This is a why six sigma tamplate 2 ppt powerpoint presentation templates. This is a five stage process. The stages in this process are engagement, bottom line, project by project, trained individuals, customer focused.

A B Testing Metrics Ppt Powerpoint Presentation Professional Format
This is a a b testing metrics ppt powerpoint presentation professional format. This is a four stage process. The stages in this process are subject line, opens, clicks, version a wins.
why six sigma template 2 ppt powerpoint presentation professional slides
This is a why six sigma template 2 ppt powerpoint presentation professional slides. This is a five stage process. The stages in this process are engagement, bottom line, project by project, trained individuals, customer focused.

Pareto Chart Ppt PowerPoint Presentation Ideas
This is a pareto chart ppt powerpoint presentation ideas. This is a four stage process. The stages in this process are bar graph, finance, marketing, strategy, analysis, business.

Column Chart Ppt PowerPoint Presentation Professional Example
This is a column chart ppt powerpoint presentation professional example. This is a eight stage process. The stages in this process are bar graph, growth, success, business, marketing.

Column Chart Ppt PowerPoint Presentation Infographics Model
This is a column chart ppt powerpoint presentation infographics model. This is a two stage process. The stages in this process are bar graph, growth, product, percentage, year.

Area Chart Ppt PowerPoint Presentation Designs
This is a area chart ppt powerpoint presentation designs. This is a two stage process. The stages in this process are product, graph, in percentage, growth, business.

Area Chart Ppt PowerPoint Presentation Gallery Inspiration
This is a area chart ppt powerpoint presentation gallery inspiration. This is a two stage process. The stages in this process are product, growth, success, graph, finance.

Area Chart Ppt PowerPoint Presentation Slides Show
This is a area chart ppt powerpoint presentation slides show. This is a two stage process. The stages in this process are business, marketing, success, graph, growth.
Ppt 3d Linear Flow Process Charts Arrow 6 Stages PowerPoint Templates
PPT 3d linear flow process charts arrow 6 stages PowerPoint Templates-This linear abstraction PowerPoint slide forms a straight line. Use this Slide to coordinate business plans.-PPT 3d linear flow process charts arrow 6 stages PowerPoint Templates-Achievement, Arrow, Ascending, Ascension, Business, Concept, 6 Stages, Evolution, Illustration, Leader, Leadership, Progress, Red, Render, Rise, Rising, Sphere, Success, Team, White, Circle, Charts, Shapes

Clustered Bar Ppt PowerPoint Presentation Diagrams
This is a clustered bar ppt powerpoint presentation diagrams. This is a five stage process. The stages in this process are bar graph, marketing, strategy, analysis, business.

Clustered Bar Ppt PowerPoint Presentation File Inspiration
This is a clustered bar ppt powerpoint presentation file inspiration. This is a two stage process. The stages in this process are product, profit, growth, success, graph.

Bar Diagram Ppt PowerPoint Presentation Pictures Designs
This is a bar diagram ppt powerpoint presentation pictures designs. This is a five stage process. The stages in this process are business, marketing, growth, graph, success.

Stacked Bar Template 1 Ppt PowerPoint Presentation Inspiration
This is a stacked bar template 1 ppt powerpoint presentation inspiration. This is a six stage process. The stages in this process are bar, graph, business, marketing, strategy.

Stacked Bar Template 2 Ppt PowerPoint Presentation Themes
This is a stacked bar template 2 ppt powerpoint presentation themes. This is a four stage process. The stages in this process are bar, graph, business, marketing, strategy.
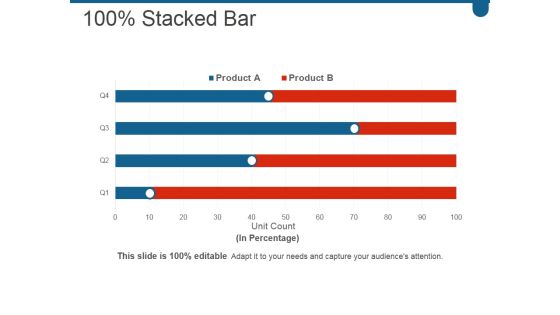
Stacked Bar Ppt PowerPoint Presentation File Graphics Example
This is a stacked bar ppt powerpoint presentation file graphics example. This is a four stage process. The stages in this process are business, marketing, bar, graph, percentage.

Bar Chart Ppt PowerPoint Presentation Background Designs
This is a bar chart ppt powerpoint presentation background designs. This is a twelve stage process. The stages in this process are bar graph, finance, marketing, strategy, analysis, investment.

Bar Chart Ppt PowerPoint Presentation Outline Backgrounds
This is a bar chart ppt powerpoint presentation outline backgrounds. This is a one stage process. The stages in this process are sales in percentage, financial years, product, bar graph, finance.

Bar Chart Ppt PowerPoint Presentation Layouts Visuals
This is a bar chart ppt powerpoint presentation layouts visuals. This is a two stage process. The stages in this process are business, strategy, marketing, planning, chart and graph.

Bar Chart Ppt PowerPoint Presentation Icon Demonstration
This is a bar chart ppt powerpoint presentation icon demonstration. This is a seven stage process. The stages in this process are product, sales in percentage, financial year, graph.
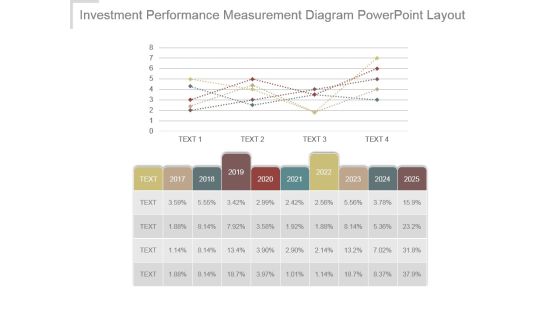
Investment Performance Measurement Diagram Powerpoint Layout
This is a investment performance measurement diagram powerpoint layout. This is a five stage process. The stages in this process are bar graph, growth, success, business, marketing.
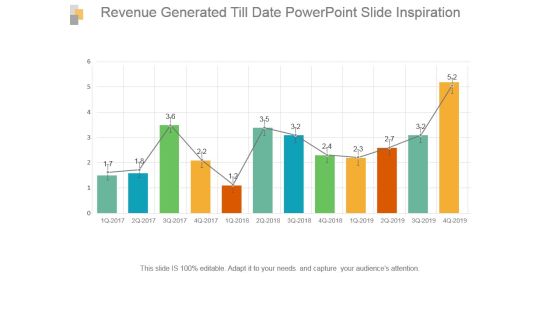
Revenue Generated Till Date Powerpoint Slide Inspiration
This is a revenue generated till date powerpoint slide inspiration. This is a twelve stage process. The stages in this process are bar graph, growth, success, data, analysis.

Clustered Column Ppt PowerPoint Presentation Slide Download
This is a clustered column ppt powerpoint presentation slide download. This is a twelve stage process. The stages in this process are bar graph, marketing, strategy, analysis, business.

Stacked Column Template 1 Ppt PowerPoint Presentation Slide
This is a stacked column template 1 ppt powerpoint presentation slide. This is a nine stage process. The stages in this process are bar, graph, business, marketing, strategy.
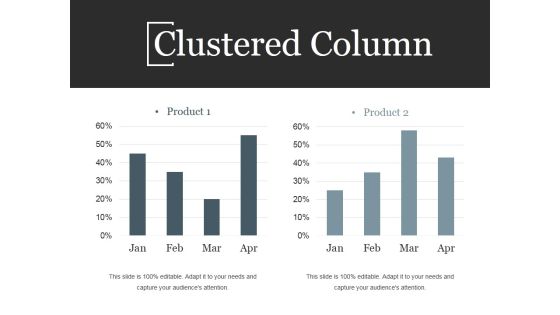
Clustered Column Ppt PowerPoint Presentation Information
This is a clustered column ppt powerpoint presentation information. This is a twelve stage process. The stages in this process are bar graph, business, marketing, growth, success.
Growth Team Ppt PowerPoint Presentation Icon Topics
This is a growth team ppt powerpoint presentation icon topics. This is a five stage process. The stages in this process are bar graph, growth, success, business, marketing.

Stacked Column Ppt PowerPoint Presentation Pictures Outfit
This is a stacked column ppt powerpoint presentation pictures outfit. This is a two stage process. The stages in this process are product, profit, growth, bar graph, success.

Comparison Ppt PowerPoint Presentation Ideas Show
This is a comparison ppt powerpoint presentation ideas show. This is a two stage process. The stages in this process are comparison, bar graph, growth, management, business.

Annual Hiring Plan Bar Chart Example Of Ppt
This is a annual hiring plan bar chart example of ppt. This is a five stage process. The stages in this process are bar graph, business, marketing, growth, success.

Gross Margin Analysis Bar Chart Powerpoint Slide Backgrounds
This is a gross margin analysis bar chart powerpoint slide backgrounds. This is a two stage process. The stages in this process are bar graph, business, marketing, growth, success.

Dividend Per Share Bar Chart Powerpoint Slide Background Designs
This is a dividend per share bar chart powerpoint slide background designs. This is a five stage process. The stages in this process are business, marketing, success, growth, bar graph.

Stacked Bar Chart Ppt PowerPoint Presentation Inspiration Ideas
This is a stacked bar chart ppt powerpoint presentation inspiration ideas. This is a four stage process. The stages in this process are product, highest, business, marketing, bar graph.

Bar Chart Ppt PowerPoint Presentation Infographics Format Ideas
This is a bar chart ppt powerpoint presentation infographics format ideas. This is a two stage process. The stages in this process are bar graph, product, financial year, sales in percentage.

Bar Chart Ppt PowerPoint Presentation Pictures Background Image
This is a bar chart ppt powerpoint presentation pictures background image. This is a seven stage process. The stages in this process are financial years, sales in percentage, graph, business.
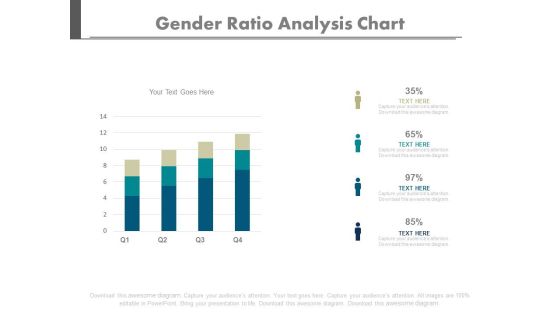
Four Bars Gender Population Ratio Chart Powerpoint Slides
Create dynamic presentations with our creative template of bar graph. This diagram may be used to present gender population. Download this template to leave permanent impression on your audience.
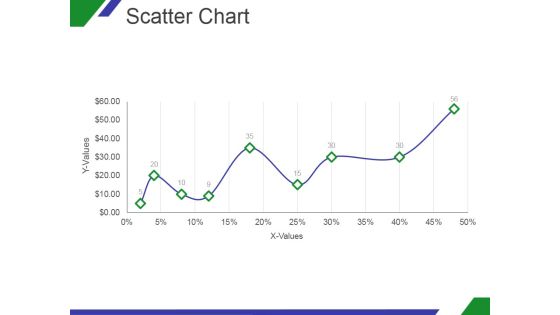
Scatter Chart Ppt PowerPoint Presentation Designs Download
This is a scatter chart ppt powerpoint presentation designs download. This is a nine stage process. The stages in this process are x values, y values, graph, growth, success.
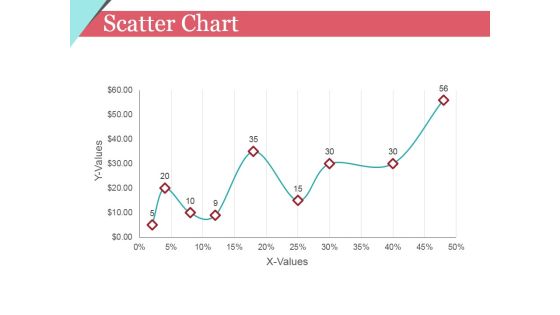
Scatter Chart Ppt PowerPoint Presentation Model Template
This is a scatter chart ppt powerpoint presentation model template. This is a nine stage process. The stages in this process are x values, y values, graph, growth, success.
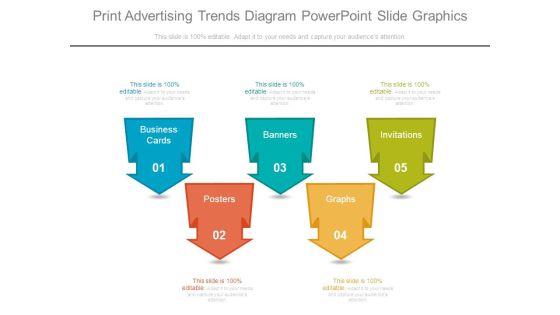
Print Advertising Trends Diagram Powerpoint Slide Graphics
This is a print advertising trends diagram powerpoint slide graphics. This is a five stage process. The stages in this process are business cards, banners, invitations, graphs, posters.

Establishing Successful Brand Strategy To Captivate Consumers Current Brand Architecture Spectrum Alone Microsoft PDF
This slide displays current brand architecture spectrum of the firm. It includes product information that comes under brand spectrum namely master branded, brand lined, brand endorsed and stand alone. This is a establishing successful brand strategy to captivate consumers current brand architecture spectrum alone microsoft pdf template with various stages. Focus and dispense information on five stages using this creative set, that comes with editable features. It contains large content boxes to add your information on topics like master branded, brand lined, brand endorsed, brand alone. You can also showcase facts, figures, and other relevant content using this PPT layout. Grab it now.

Best Practices For Implementing Artificial Intelligence In Email Advertising Mockup PDF
This slide covers best practices to implement artificial intelligence in email marketing to automate daily tasks and maximize return on investment. Some of the best practices include draft good subject lines, automate email copy, draft personalized newsletters, etc. Presenting Best Practices For Implementing Artificial Intelligence In Email Advertising Mockup PDF to dispense important information. This template comprises six stages. It also presents valuable insights into the topics including Subject Lines, Automate, Segmentation. This is a completely customizable PowerPoint theme that can be put to use immediately. So, download it and address the topic impactfully.

Ppt 3d Circlular Arrows Mobile Marketing PowerPoint Presentation Strategy Templates
PPT 3d circlular arrows mobile marketing powerpoint presentation strategy Templates-Use this 3D PowerPoint Diagram to represent the five stages of Sequential Process. It portrays beeline, continuous, even, horizontal, in bee line, in straight line, linear , nonstop, not crooked, point-blank, right, shortest, straight, straightaway, though, true, unbroken etc.-PPT 3d circlular arrows mobile marketing powerpoint presentation strategy Templates-3d, Advertisement, Advertising, Arrow, Border, Business, Circles, Collection, Customer, Design, Element, Icon, Idea, Illustration, Info, Information, Isolated, Label, Light, Location, Needle, New, Notification, Notify, Point, Pointer, Promotion, Role, Rounded

Competitive Analysis Template 4 Scatter Chart Radar Chart Ppt PowerPoint Presentation Topics
This is a competitive analysis template 4 scatter chart radar chart ppt powerpoint presentation topics. This is a six stage process. The stages in this process are business, analysis, graph, marketing, scatter.
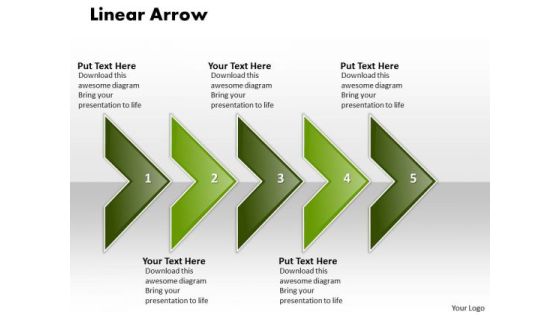
Ppt Linear Arrow-5 State Diagram PowerPoint Templates
PPT linear arrow-5 state diagram PowerPoint Templates-This graphics can be really helpful to make awesome PowerPoint Presentation and help to visualize data.-PPT linear arrow-5 state diagram PowerPoint Templates-Abstract, Age, Ancient, Antique, Arrows, Art, Artistic, Background, Colors, Decoration, Design, Dynamic, Elegant, Element, Future, Illustration, Index, Linear, Lines, Modern, Old, Paper, Pattern, Scratch, Text, Texture, Up, Vintage

Ppt Linear Arrow 3 Stages PowerPoint Templates
PPT linear arrow 3 stages PowerPoint Templates-An excellent graphics that help you convey your ideas successfully - no matter what they are-PPT linear arrow 3 stages PowerPoint Templates-Abstract, Age, Ancient, Antique, Arrows, Art, Artistic, Background, Colors, Decoration, Design, Dynamic, Elegant, Element, Future, Illustration, Index, Linear, Lines, Modern, Old, Paper, Pattern, Scratch, Text, Texture, Up, Vintage
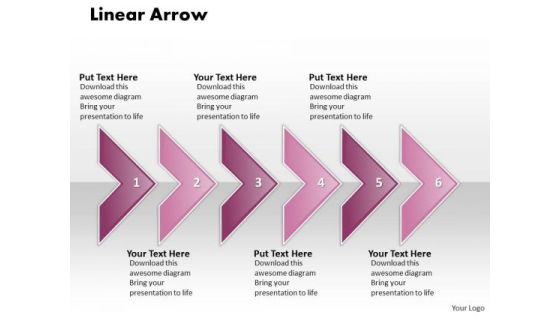
Ppt Linear Arrow Business 6 Power Point Stage PowerPoint Templates
PPT linear arrow Business 6 power point stage PowerPoint Templates- This consecutive implementation diagram is a graphic representation of all the major steps of a process.-PPT linear arrow Business 6 power point stage PowerPoint Templates-Abstract, Age, Ancient, Antique, Arrows, Art, Artistic, Background, Colors, Decoration, Design, Dynamic, Elegant, Element, Future, Illustration, Index, Linear, Lines, Modern, Old, Paper, Pattern, Scratch, Text, Texture, Up, Vintage
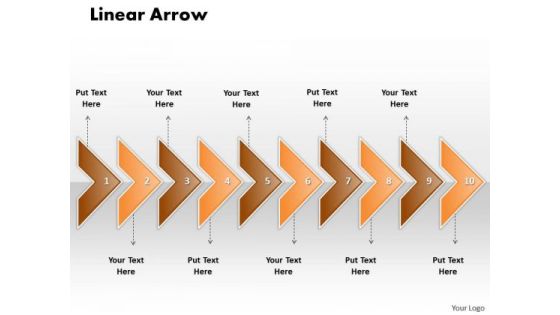
Ppt Linear Arrow Business 10 Phase Diagram PowerPoint Templates
PPT linear arrow Business 10 phase diagram PowerPoint Templates-Use this sequential implementation PowerPoint diagram to represent a series of interconnected ideas.-PPT linear arrow Business 10 phase diagram PowerPoint Templates-Abstract, Age, Ancient, Antique, Arrows, Art, Artistic, Background, Colors, Decoration, Design, Dynamic, Elegant, Element, Future, Illustration, Index, Linear, Lines, Modern, Old, Paper, Pattern, Scratch, Text, Texture, Up, Vintage

Ppt Linear Arrow 4 State PowerPoint Project Diagram Templates
PPT linear arrow 4 state powerpoint project diagram Templates-Highlight the key point in business process with this circular Arrow of Four stages diagram-PPT linear arrow 4 state powerpoint project diagram Templates-Abstract, Age, Ancient, Antique, Arrows, Art, Artistic, Background, Colors, Decoration, Design, Dynamic, Elegant, Element, Future, Illustration, Index, Linear, Lines, Modern, Old, Paper, Pattern, Scratch, Text, Texture, Up, Vintage

Ppt Linear Arrow Business 2 Stages PowerPoint Templates
PPT linear arrow Business 2 stages PowerPoint Templates-This template offers an excellent background to build up the two stages of your business process. -PPT linear arrow Business 2 stages PowerPoint Templates-Abstract, Age, Ancient, Antique, Arrows, Art, Artistic, Background, Colors, Decoration, Design, Dynamic, Elegant, Element, Future, Illustration, Index, Linear, Lines, Modern, Old, Paper, Pattern, Scratch, Text, Texture, Up, Vintage

Ppt Linear Arrow Business 3 Stages PowerPoint Templates
PPT linear arrow Business 3 stages PowerPoint Templates-This graphics can be really helpful to make awesome PowerPoint Presentation and help to visualize data.-PPT linear arrow Business 3 stages PowerPoint Templates-Abstract, Age, Ancient, Antique, Arrows, Art, Artistic, Background, Colors, Decoration, Design, Dynamic, Elegant, Element, Future, Illustration, Index, Linear, Lines, Modern, Old, Paper, Pattern, Scratch, Text, Texture, Up, Vintage
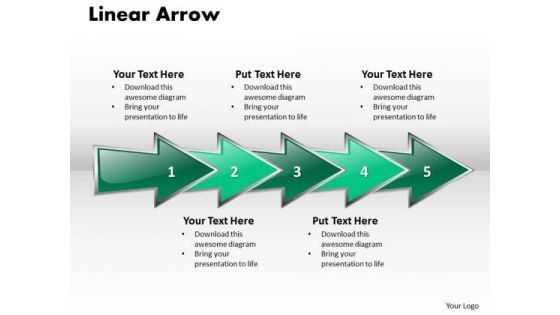
Ppt Linear Arrow Business 5 Stages PowerPoint Templates
PPT linear arrow Business 5 stages PowerPoint Templates-Select the key concepts of the topic under study use this slide to discuss that topic with your team -PPT linear arrow Business 5 stages PowerPoint Templates-Abstract, Age, Ancient, Antique, Arrows, Art, Artistic, Background, Colors, Decoration, Design, Dynamic, Elegant, Element, Future, Illustration, Index, Linear, Lines, Modern, Old, Paper, Pattern, Scratch, Text, Texture, Up, Vintage
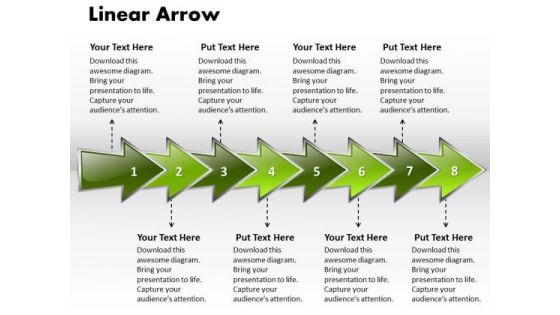
Ppt Linear Arrow Business 8 Stages PowerPoint Templates
PPT linear arrow Business 8 stages PowerPoint Templates-This diagram can help in showing an organized view of business services and processes.-PPT linear arrow Business 8 stages PowerPoint Templates-Abstract, Age, Ancient, Antique, Arrows, Art, Artistic, Background, Colors, Decoration, Design, Dynamic, Elegant, Element, Future, Illustration, Index, Linear, Lines, Modern, Old, Paper, Pattern, Scratch, Text, Texture, Up, Vintage
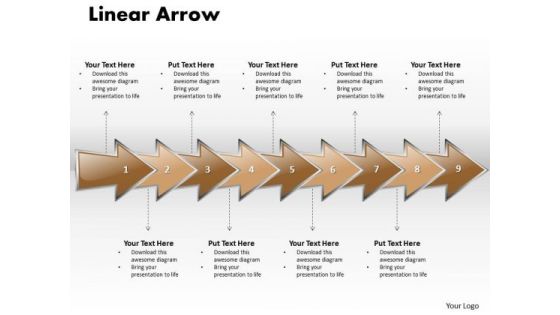
Ppt Linear Arrow Business 9 Stages PowerPoint Templates
PPT linear arrow Business 9 stages PowerPoint Templates-Display the direction of the specific activities involved and how to put these in a proper manner for achieving the desired goal.-PPT linear arrow Business 9 stages PowerPoint Templates-Abstract, Age, Ancient, Antique, Arrows, Art, Artistic, Background, Colors, Decoration, Design, Dynamic, Elegant, Element, Future, Illustration, Index, Linear, Lines, Modern, Old, Paper, Pattern, Scratch, Text, Texture, Up, Vintage

Ppt Linear Arrow Business 10 Stages PowerPoint Templates
PPT linear arrow Business 10 stages PowerPoint Templates- This continuous imitation diagram is a graphic representation of all the major steps of a process.-PPT linear arrow Business 10 stages PowerPoint Templates-Abstract, Age, Ancient, Antique, Arrows, Art, Artistic, Background, Colors, Decoration, Design, Dynamic, Elegant, Element, Future, Illustration, Index, Linear, Lines, Modern, Old, Paper, Pattern, Scratch, Text, Texture, Up, Vintage
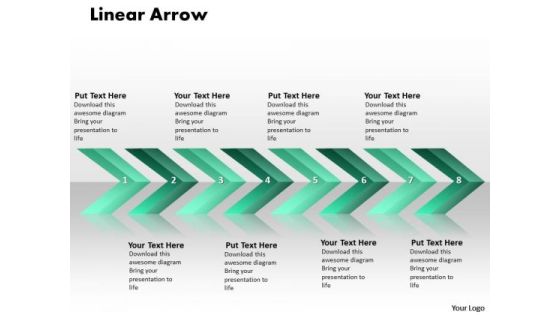
Ppt Linear Arrows Business 8 Phase Diagram PowerPoint Templates
PPT linear arrows Business 8 phase diagram PowerPoint Templates- This continuous implementation diagram is a graphic representation of all the major steps of a process.-PPT linear arrows Business 8 phase diagram PowerPoint Templates-Abstract, Age, Ancient, Antique, Arrows, Art, Artistic, Background, Colors, Decoration, Design, Dynamic, Elegant, Element, Future, Illustration, Index, Linear, Lines, Modern, Old, Paper, Pattern, Scratch, Text, Texture, Up, Vintage

Ppt 3d Arrow Linear Sequence Of 2 Stages PowerPoint Templates
PPT 3d arrow linear sequence of 2 stages PowerPoint Templates-These circular shapes are simple but very pretty to use with a small amount of text.-PPT 3d arrow linear sequence of 2 stages PowerPoint Templates-3d, Abstract, Arrows, Background, Ball, Business, Communication, Corporate, Decision, Determination, Follow, Illustration, Individuality, Leadership, Line, Many, Object, Path, Reflection, Row, Shine, Sphere, Success, Symbol

Area Chart Ppt PowerPoint Presentation Gallery Icons
This is a area chart ppt powerpoint presentation gallery icons. This is a two stage process. The stages in this process are financial year, sales in percentage, product, finance, graph.

Multi Channel Marketing Chart With Operations And Promotions Ppt PowerPoint Presentation Show Deck PDF
Presenting this set of slides with name multi channel marketing chart with operations and promotions ppt powerpoint presentation show deck pdf. This is a five stage process. The stages in this process are sales, product line, brand building, operations, promotion . This is a completely editable PowerPoint presentation and is available for immediate download. Download now and impress your audience.
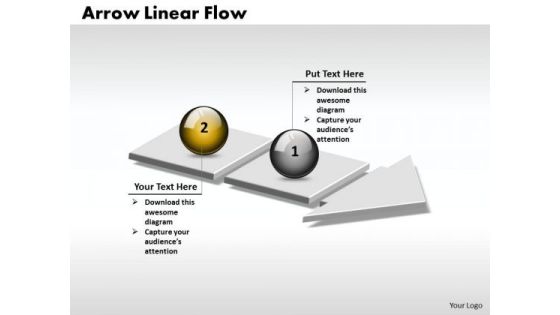
Ppt 3d Arrow Linear Process Flow PowerPoint Template Of 2 Phase Diagram Templates
PPT 3d arrow linear process flow powerpoint template of 2 phase diagram Templates-These circular shapes are simple but very pretty to use with a small amount of text.-PPT 3d arrow linear process flow powerpoint template of 2 phase diagram Templates-3d, Abstract, Arrows, Background, Ball, Business, Communication, Corporate, Decision, Determination, Follow, Illustration, Individuality, Leadership, Line, Many, Object, Path, Reflection, Row, Shine, Sphere, Success, Symbol

Ppt 3d Arrow Linear Series Of 2 State Diagram PowerPoint Templates
PPT 3d arrow linear series of 2 state diagram PowerPoint Templates-These circular shapes are simple but very pretty to use with a small amount of text.-PPT 3d arrow linear series of 2 state diagram PowerPoint Templates-3d, Abstract, Arrows, Background, Ball, Business, Communication, Corporate, Decision, Determination, Follow, Illustration, Individuality, Leadership, Line, Many, Object, Path, Reflection, Row, Shine, Sphere, Success, Symbol
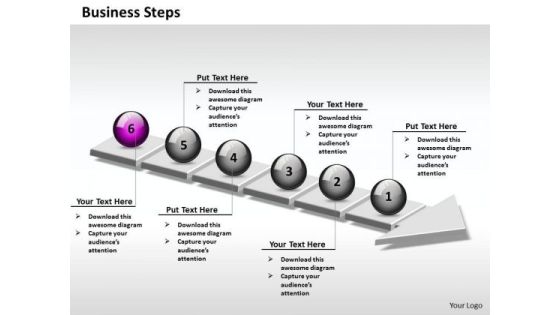
Ppt 3d Linear Abstraction Of Business Steps 6 Power Point Stage PowerPoint Templates
PPT 3d linear abstraction of business steps 6 power point stage PowerPoint Templates-Use this graphics to develop detailed sequence diagrams as the core process in systems design-PPT 3d linear abstraction of business steps 6 power point stage PowerPoint Templates-3d, Abstract, Arrows, Background, Ball, Business, Communication, Corporate, Decision, Determination, Follow, Illustration, Individuality, Leadership, Line, Many, Object, Path, Reflection, Row, Shine, Sphere, Success, Symbol

Column Chart Ppt PowerPoint Presentation Icon Show
This is a column chart ppt powerpoint presentation icon show. This is a two stage process. The stages in this process are column chart, product, years, bar graph, growth.

Column Chart Ppt PowerPoint Presentation Background Designs
This is a column chart ppt powerpoint presentation background designs. This is a two stage process. The stages in this process are bar graph, finance, marketing, strategy, analysis, business.

Combo Chart Ppt PowerPoint Presentation Infographics Infographics
This is a combo chart ppt powerpoint presentation infographics infographics. This is a three stage process. The stages in this process are bar graph, growth, finance, marketing, strategy, business.

Combo Chart Ppt PowerPoint Presentation Show Deck
This is a combo chart ppt powerpoint presentation show deck. This is a three stage process. The stages in this process are growth rate, market size, product, bar graph, growth.
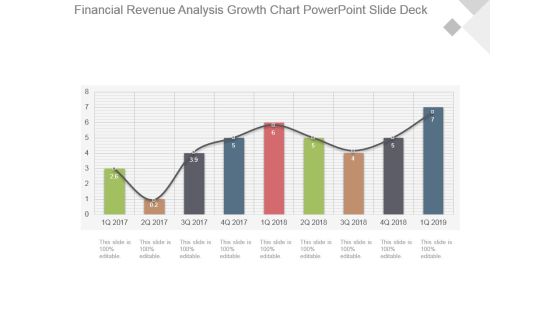
Financial Revenue Analysis Growth Chart Powerpoint Slide Deck
This is a financial revenue analysis growth chart powerpoint slide deck. This is a nine stage process. The stages in this process are growth, success, business, marketing, bar graph.
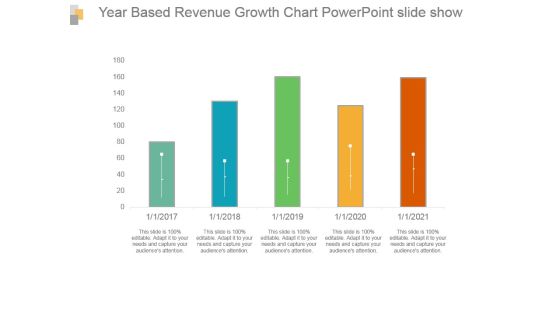
Year Based Revenue Growth Chart Powerpoint Slide Show
This is a year based revenue growth chart powerpoint slide show. This is a five stage process. The stages in this process are bar graph, growth, revenue, year, success.

Combo Chart Ppt PowerPoint Presentation Ideas Visual Aids
This is a combo chart ppt powerpoint presentation ideas visual aids. This is a three stage process. The stages in this process are product, sales, bar graph, business, marketing.

Column Chart Ppt PowerPoint Presentation Model Graphics Download
This is a column chart ppt powerpoint presentation model graphics download. This is a two stage process. The stages in this process are product, financial year, sales in percentage, bar graph, success.

Column Chart Ppt PowerPoint Presentation Gallery Slide Portrait
This is a column chart ppt powerpoint presentation gallery slide portrait. This is a two stage process. The stages in this process are sales in percentage, financial year, product, bar graph, growth.
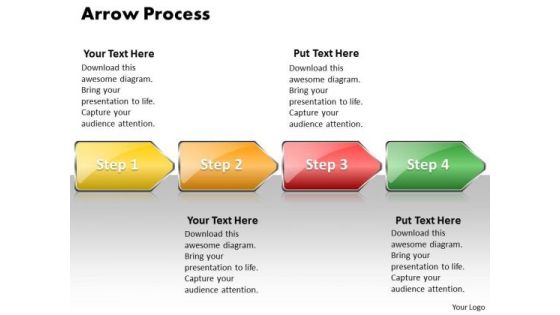
Ppt Arrow Procurement Process PowerPoint Presentation 4 Stages Style 1 Templates
PPT arrow procurement process powerpoint presentation 4 stages style 1 Templates-This Work Flow diagram is a graphical representation of a process. Steps in a process are shown with these arrow shapes.-PPT arrow procurement process powerpoint presentation 4 stages style 1 Templates-Arrow, Art, Attendance, Background, Blank, Blue, Chart, Clip, Education, Graphic, Horizontal, Icon, Illustration, Learning, Line, Listen, Notes, Process, Purple, Read, Red, Review, Science
Four Methods Of Business Forecasting With Icons Ppt PowerPoint Presentation Layouts Backgrounds
Presenting this set of slides with name four methods of business forecasting with icons ppt powerpoint presentation layouts backgrounds. This is a four stage process. The stages in this process are straight line, moving average, simple linear regression, multiple linear regression. This is a completely editable PowerPoint presentation and is available for immediate download. Download now and impress your audience.

Ppt 3d Transparent Layers Cube Visualising Solid Callouts Presentation PowerPoint Templates
PPT 3d transparent layers cube visualising solid callouts presentation PowerPoint Templates--PowerPoint presentations on 3d, Abstract, Artistic, Backdrop, Background, Black, Blend, Cg, Colorful, Cubes, Digital, Dynamic, Fantasy, Fractal, Futuristic, Geometric, Graphics, Green, Grid, High-Tech, Layers, Light, Lines, Mix, Motion, Pattern, Shapes, Shiny, Space, Squares, Style, Stylish, Swirls, Template, Texture, Theme, Tile, Translucent, Transparent, Trendy, Wallpaper-PPT 3d transparent layers cube visualising solid callouts presentation PowerPoint Templates
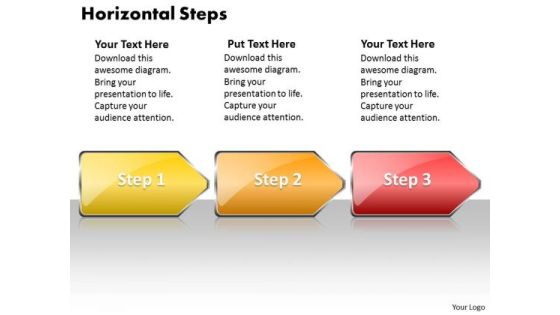
Ppt Arrow Change Management Process PowerPoint Presentation 3 Stages Style 1 Templates
PPT arrow change management process powerpoint presentation 3 stages style 1 Templates-Use this PowerPoint diagram to communicate a great deal of information accurately and efficiently.-PPT arrow change management process powerpoint presentation 3 stages style 1 Templates-Arrow, Art, Attendance, Background, Blank, Blue, Chart, Clip, Clipart, Education, English, Graphic, Horizontal, Icon, Illustration, Landscape, Learning, Line, Listen, Math, Notes, Process, Purple, Read, Red, Review, Science

Data Collection And Analysis Control Chart Ppt PowerPoint Presentation Example File
This is a data collection and analysis control chart ppt powerpoint presentation example file. This is a four stage process. The stages in this process are business, strategy, marketing, bar graph, growth strategy.
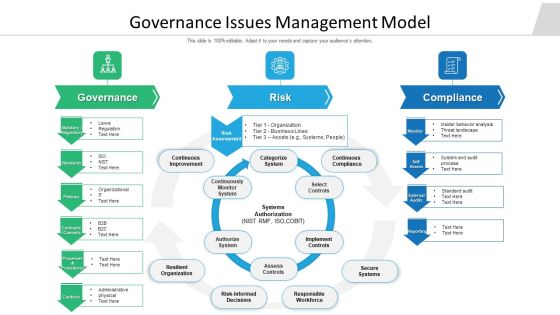
Governance Issues Management Model Ppt Model File Formats PDF
Pitch your topic with ease and precision using this governance issues management model ppt model file formats pdf. This layout presents information on organization, continuous improvement, business lines. It is also available for immediate download and adjustment. So, changes can be made in the color, design, graphics or any other component to create a unique layout.

Principles In Leading Change Management Ppt PowerPoint Presentation File Files
This is a principles in leading change management ppt powerpoint presentation file files. This is a ten stage process. The stages in this process are lead outside the lines, assess and adapt, lead with culture, leverage formal solutions, leverage informal solutions.

Bar Chart Showing Growth Trends Over The Years Ppt PowerPoint Presentation Slides Layout
Presenting this set of slides with name bar chart showing growth trends over the years ppt powerpoint presentation slides layout. This is a five stage process. The stages in this process are education, growth, pencil bar graph. This is a completely editable PowerPoint presentation and is available for immediate download. Download now and impress your audience.

Business Diagram Peoples On Bars Of Progress Presentation Template
This power point template has been crafted with graphic of peoples and bar graph. This PPT contains the concept of progress and growth. Use this PPT for your business and marketing related presentations.

Stacked Bar Ppt PowerPoint Presentation Portfolio Background Image
This is a two stacked bar ppt powerpoint presentation portfolio background image. This is a two stage process. The stages in this process are sales in percentage, graph, business, marketing, strategy.
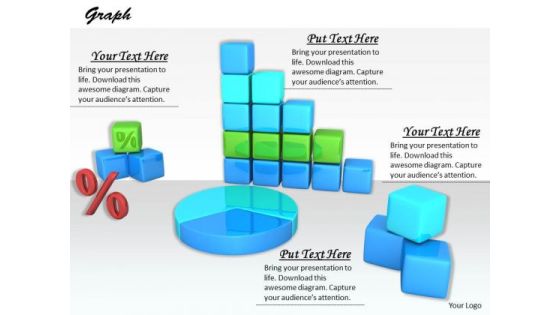
Stock Photo Design For Graphical Representations Of Data PowerPoint Slide
The above image contains a graphic of charts and graphs. Use this professional image in business or sales related presentations. It helps you to explain your plans in all earnest to your colleagues and raise the bar for all.

Portfolio Evaluation Ppt PowerPoint Presentation Infographics Objects
This is a portfolio evaluation ppt powerpoint presentation infographics objects. This is a two stage process. The stages in this process are business, finance, bar graph, pie chart, marketing, analysis, investment.
Ppt Straight Flow 5 Power Point Stage PowerPoint Templates
PPT straight flow 5 power point stages PowerPoint Templates-This linear abstraction PowerPoint slide forms a straight line. Use this Slide to coordinate business plans. This image identifies the concept of stages in process. This attractive image makes your presentations professional and interactive. Deliver amazing presentations to mesmerize your audience.-PPT straight flow 5 power point stage PowerPoint Templates-Abstract, Arrow, Blank, Business, Chart, Circular, Circulation, Concepts, Conceptual, Design, Diagram, Executive, Icon, Idea, Illustration, Management, Model, Numbers, Organization, Procedure, Process, Progression, Resource, Sequence

Business Diagram Brand Equity And Brand Value Presentation Template
Explain the concept of brand equity and brand value with this unique business diagram. This diagram slide contains the graphic of multiple bar graphs. Download this awesome diagram to capture your audiences attention.

Business Diagram Thermometer Graphics Indicating Progress Presentation Template
This power point template diagram has been designed with graphic of thermometer and bar graph. This PPT contains the concept of growth analysis. Use this PPT for business and marketing related presentations.
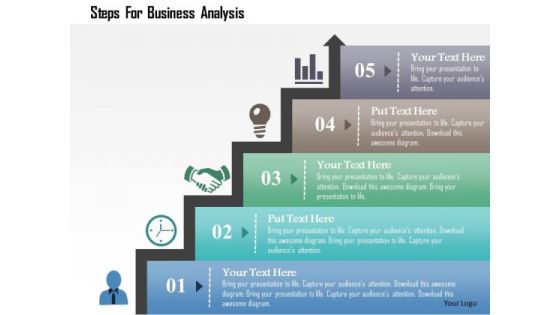
Business Diagram Steps For Business Analysis Presentation Template
Concept of time management has been defined in this power point template diagram. This diagram contains the graphic of bar graph. Amplify your thoughts via this appropriate business template.
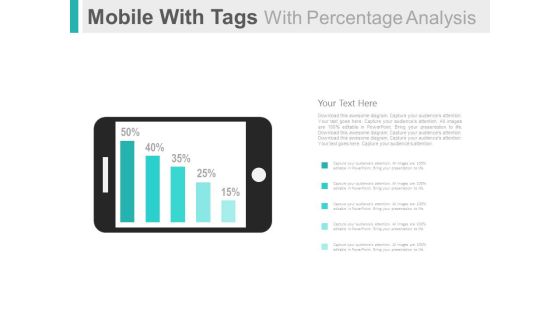
Mobile For Online Survey And Analysis Powerpoint Slides
This PowerPoint template has been designed with graphics of mobile and percentage bar graph. This PPT slide can be used to display online survey and analysis. You can download finance PowerPoint template to prepare awesome presentations.
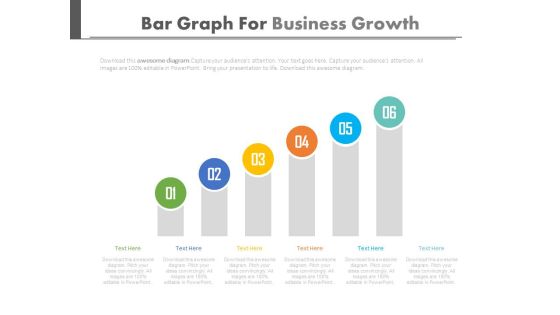
Setting Goals And Developing Strategies Powerpoint Slides
This PowerPoint template is useful for setting goals and developing strategies. This PPT background has a design of six steps bar graph. This PPT slide is suitable for topics like corporate strategic planning.
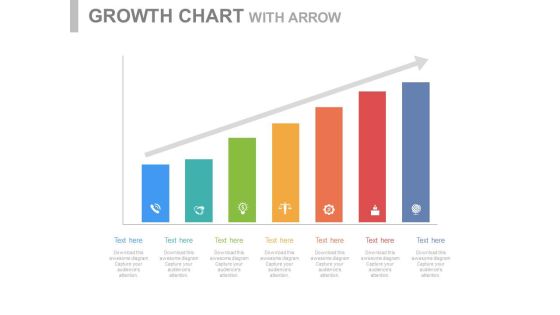
Steps For Developing Strategic Plan Powerpoint Slides
This PowerPoint template is useful for setting goals and developing strategies. This PPT background has a design of seven steps bar graph. This PPT slide is suitable for topics like corporate strategic planning.
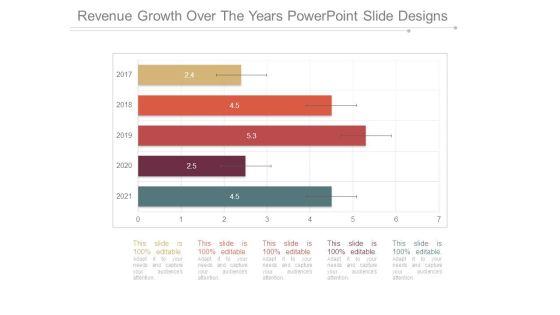
Revenue Growth Over The Years Powerpoint Slide Designs
This is a revenue growth over the years powerpoint slide designs. This is a five stage process. The stages in this process are bar graph, years, business, growth, marketing.

Corporate Growth Over The Years Ppt PowerPoint Presentation Good
This is a corporate growth over the years ppt powerpoint presentation good. This is a five stage process. The stages in this process are business, strategy, marketing, growth, bar graph.

Crm Dashboard Deals By Expected Close Date Ppt PowerPoint Presentation Background Images
This is a crm dashboard deals by expected close date ppt powerpoint presentation background images. This is a five stage process. The stages in this process are bar graph, aug, sep, oct, growth.

Cycle Time By Month Ppt PowerPoint Presentation Guidelines
This is a cycle time by month ppt powerpoint presentation guidelines. This is a twelve stage process. The stages in this process are business, strategy, marketing, process, arrow, finance, bar graph.

Projected Sales Volume Ppt PowerPoint Presentation Pictures
This is a projected sales volume ppt powerpoint presentation pictures. This is a five stage process. The stages in this process are business, strategy, marketing, analysis, liner process, bar graph.
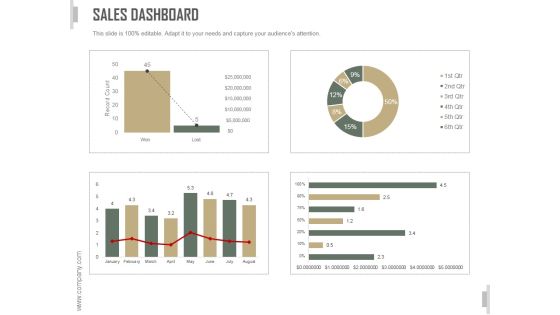
Sales Dashboard Slide Ppt PowerPoint Presentation Template
This is a sales dashboard slide ppt powerpoint presentation template. This is a three stage process. The stages in this process are business, strategy, marketing, analysis, bar graph, growth strategy.
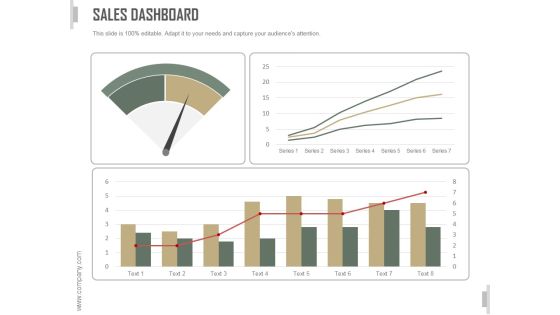
Sales Dashboard Ppt PowerPoint Presentation Design Templates
This is a sales dashboard ppt powerpoint presentation design templates. This is a four stage process. The stages in this process are business, strategy, marketing, analysis, bar graph, growth strategy.
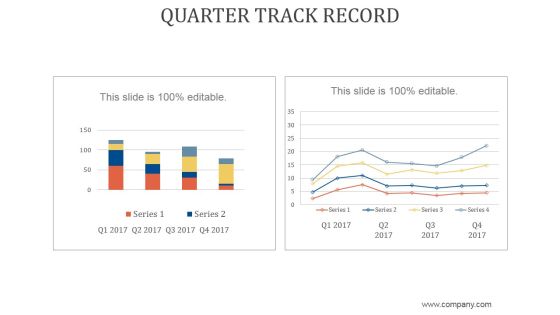
Quarter Track Record Ppt PowerPoint Presentation Samples
This is a quarter track record ppt powerpoint presentation samples. This is a two stage process. The stages in this process are business, strategy, marketing, analysis, growth strategy, bar graph.
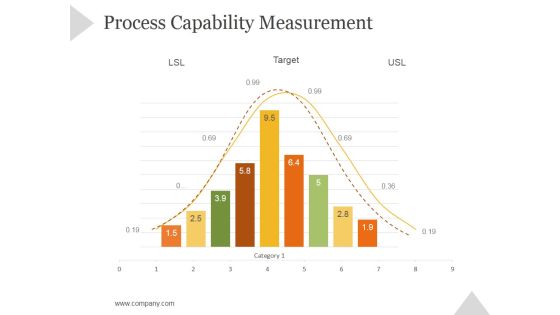
Process Capability Measurement Ppt PowerPoint Presentation Rules
This is a process capability measurement ppt powerpoint presentation rules. This is a nine stage process. The stages in this process are business, strategy, marketing, success, bar graph, growth strategy.

Current Quarter Portfolio Ppt PowerPoint Presentation Visual Aids
This is a current quarter portfolio ppt powerpoint presentation visual aids. This is a two stage process. The stages in this process are business, strategy, marketing, finance, growth strategy, bar graph.

Lead Scoring Template Ppt PowerPoint Presentation Model
This is a lead scoring template ppt powerpoint presentation model. This is a four stage process. The stages in this process are business, marketing, success, bar graph, lead scoring.

Customer Trends Template 1 Ppt PowerPoint Presentation Diagrams
This is a customer trends template 1 ppt powerpoint presentation diagrams. This is a five stage process. The stages in this process are business, marketing, bar graph, finance, management.

Pareto Analysis Tamplate 2 Ppt PowerPoint Presentation Graphics
This is a pareto analysis tamplate 2 ppt powerpoint presentation graphics. This is a twelve stage process. The stages in this process are bar graph, finance, marketing, strategy, analysis, business.

Crm Dashboard Current Lead Status Ppt PowerPoint Presentation Infographic Template Visual Aids
This is a crm dashboard current lead status ppt powerpoint presentation infographic template visual aids. This is a six stage process. The stages in this process are bar graph, finance, marketing, strategy, business, analysis.

Crm Dashboard Deals By Expected Close Date Ppt PowerPoint Presentation Portfolio Icons
This is a crm dashboard deals by expected close date ppt powerpoint presentation portfolio icons. This is a three stage process. The stages in this process are bar graph, finance, marketing, strategy, business, analysis, growth.

Crm Dashboard Top Customers Ppt PowerPoint Presentation Styles Designs
This is a crm dashboard top customers ppt powerpoint presentation styles designs. This is a ten stage process. The stages in this process are business, customer, finance, bar graph, marketing, strategy, analysis.

Crowdfunding Statistics Template 1 Ppt PowerPoint Presentation Good
This is a crowdfunding statistics template 1 ppt powerpoint presentation good. This is a two stage process. The stages in this process are business, location, geographical, finance, bar graph, marketing.

Advertising Spent On Different Mediums Ppt PowerPoint Presentation Infographics Show
This is a advertising spent on different mediums ppt powerpoint presentation infographics show. This is a five stage process. The stages in this process are business, finance, marketing, strategy, bar graph, growth.
Revenue Split By Product Segment Template 1 Ppt PowerPoint Presentation Ideas Icons
This is a revenue split by product segment template 1 ppt powerpoint presentation ideas icons. This is a four stage process. The stages in this process are business, marketing, success, bar graph, product.
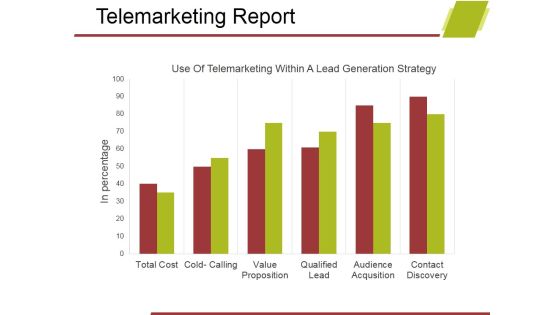
Telemarketing Report Template 1 Ppt PowerPoint Presentation Show Design Ideas
This is a telemarketing report template 1 ppt powerpoint presentation show design ideas. This is a six stage process. The stages in this process are business, bar graph, marketing, analysis, growth, strategy.

Gap Between Current And Required Staff Ppt PowerPoint Presentation Infographic Template Microsoft
This is a gap between current and required staff ppt powerpoint presentation infographic template microsoft. This is a five stage process. The stages in this process are business, bar graph, finance, marketing, strategy, analysis.

Data Analytics Ppt PowerPoint Presentation Icon Master Slide
This is a data analytics ppt powerpoint presentation icon master slide. This is a five stage process. The stages in this process are bar graph, growth, success, business, marketing.
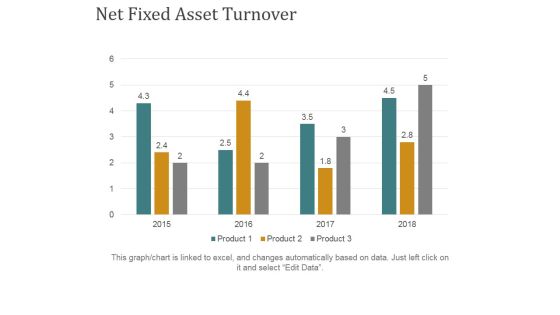
Net Fixed Asset Turnover Ppt PowerPoint Presentation Ideas Grid
This is a net fixed asset turnover ppt powerpoint presentation ideas grid. This is a four stage process. The stages in this process are business, finance, marketing, bar graph, strategy.

World Sector Growth Ppt PowerPoint Presentation Gallery Template
This is a world sector growth ppt powerpoint presentation gallery template. This is a four stage process. The stages in this process are business, bar graph, finance, marketing, strategy.

Adjusted Roce Template 1 Ppt PowerPoint Presentation Styles Background Designs
This is a adjusted roce template 1 ppt powerpoint presentation styles background designs. This is a seven stage process. The stages in this process are bar graph, finance, year, business, marketing.

Adjusted Roce Template 2 Ppt PowerPoint Presentation Icon Pictures
This is a adjusted roce template 2 ppt powerpoint presentation icon pictures. This is a five stage process. The stages in this process are bar graph, finance, percentage, business, marketing.

Annual Run Rate Ppt PowerPoint Presentation Gallery Mockup
This is a annual run rate ppt powerpoint presentation gallery mockup. This is a four stage process. The stages in this process are bar graph, growth, success, business, marketing.
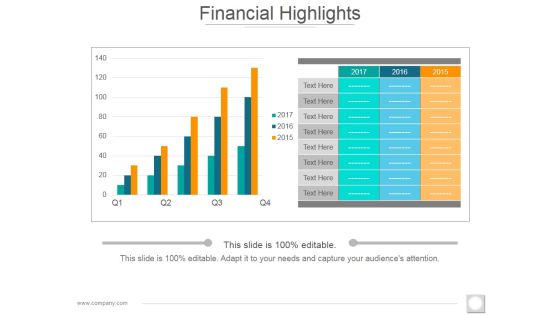
Financial Highlights Template 2 Ppt PowerPoint Presentation Slides Ideas
This is a financial highlights template 2 ppt powerpoint presentation slides ideas. This is a two stage process. The stages in this process are bar graph, growth, success, business, marketing.
Monthly Recurring Revenue Churn Template 1 Ppt PowerPoint Presentation Icon Microsoft
This is a monthly recurring revenue churn template 1 ppt powerpoint presentation icon microsoft. This is a four stage process. The stages in this process are bar graph, growth, success, business, marketing.

Monthly Recurring Revenue Churn Template 2 Ppt PowerPoint Presentation Diagram Images
This is a monthly recurring revenue churn template 2 ppt powerpoint presentation diagram images. This is a eleven stage process. The stages in this process are bar graph, growth, success, business, marketing.

Stacked Area Clustered Column Ppt PowerPoint Presentation Show Guidelines
This is a stacked area clustered column ppt powerpoint presentation show guidelines. This is a four stage process. The stages in this process are in percentage, product, bar graph, growth, success.

Clustered Column Ppt PowerPoint Presentation File Slide
This is a clustered column ppt powerpoint presentation file slide. This is a two stage process. The stages in this process are product, financial year, sales in percentage, bar graph.

Stacked Area Clustered Column Ppt PowerPoint Presentation Summary Professional
This is a stacked area clustered column ppt powerpoint presentation summary professional. This is a three stage process. The stages in this process are product, bar graph, growth, success, in percentage.

Competitor Revenue And Profit Template 1 Ppt PowerPoint Presentation Infographic Template Designs Download
This is a competitor revenue and profit template 1 ppt powerpoint presentation infographic template designs download. This is a five stage process. The stages in this process are revenue, profit, competitor, bar graph, growth.
Product Launch Budget Plan Ppt PowerPoint Presentation Icon Slide
This is a product launch budget plan ppt powerpoint presentation icon slide. This is a seven stage process. The stages in this process are bar graph, icons, percentage, finance, business.
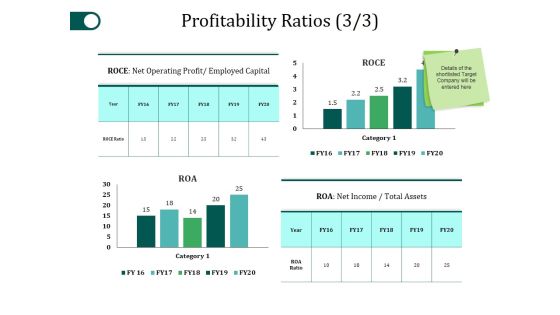
Profitability Ratios Template 3 Ppt PowerPoint Presentation Gallery Slide Portrait
This is a profitability ratios template 3 ppt powerpoint presentation gallery slide portrait. This is a four stage process. The stages in this process are category, roce, net income, business, bar graph.

Competitors Average Price Product Ppt PowerPoint Presentation File Pictures
This is a competitors average price product ppt powerpoint presentation file pictures. This is a five stage process. The stages in this process are bar graph, business, marketing, finance, company.
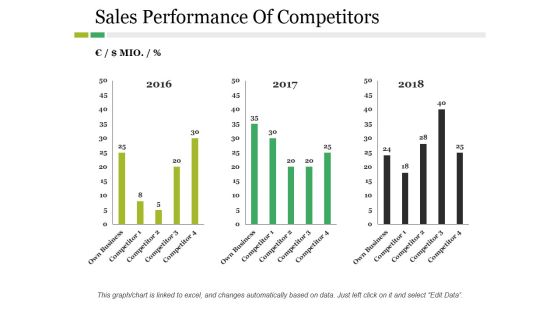
Sales Performance Of Competitors Ppt PowerPoint Presentation Inspiration Example
This is a sales performance of competitors ppt powerpoint presentation inspiration example. This is a three stage process. The stages in this process are business, marketing, year, bar graph, finance.

Clustered Column Ppt PowerPoint Presentation Gallery Structure
This is a clustered column ppt powerpoint presentation gallery structure. This is a two stage process. The stages in this process are product, sales in percentage, financial year, bar graph, finance.

Market Potential Ppt PowerPoint Presentation Complete Deck With Slides
This is a market potential ppt powerpoint presentation complete deck with slides. This is a one stage process. The stages in this process are market, potential, business, management, bar graph.

Competitors Average Price Product Ppt PowerPoint Presentation Icon Layout
This is a competitors average price product ppt powerpoint presentation icon layout. This is a five stage process. The stages in this process are company, bar graph, finance, business, marketing.
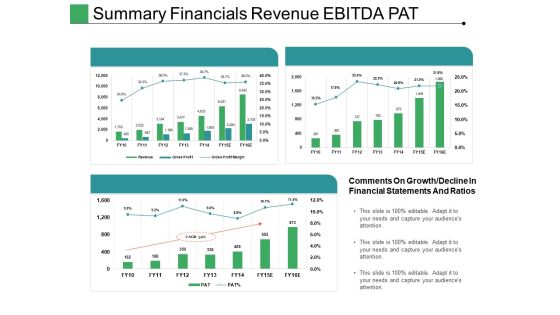
Summary Financials Revenue Ebitda Pat Ppt PowerPoint Presentation Ideas Tips
This is a summary financials revenue ebitda pat ppt powerpoint presentation ideas tips. This is a three stage process. The stages in this process are comments on growth, bar graph, growth, success, business.
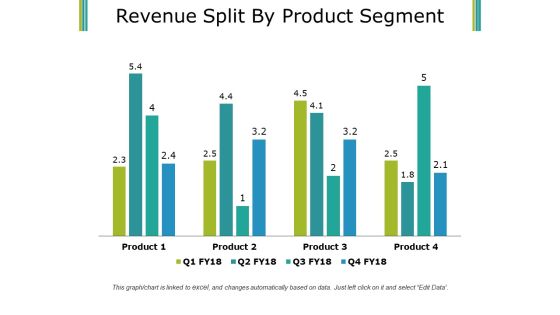
Revenue Split By Product Segment Template 1 Ppt PowerPoint Presentation Infographics Smartart
This is a revenue split by product segment template 1 ppt powerpoint presentation infographics smartart. This is a four stage process. The stages in this process are business, finance, marketing, bar graph, product.

Clustered Column Ppt PowerPoint Presentation Icon Objects
This is a clustered column ppt powerpoint presentation icon objects. This is a two stage process. The stages in this process are clustered column, product, growth, finance, bar graph.
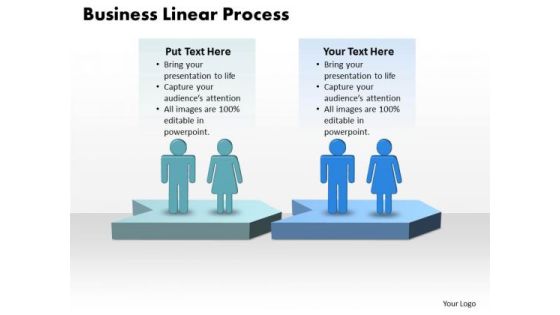
Ppt World Business Presentation Linear Process Diagram PowerPoint Templates
PPT world business presentation linear process diagram PowerPoint Templates-This Diagram is great for showing different departments in a company or different stages of a typical business process-PPT world business presentation linear process diagram PowerPoint Templates-Abstract, Achievement, Action, Arrows, Backgrounds, Business, Chart, Color, Competition, Computer, Concepts, Creative, Design, Different, Direction, Diversity, First, Forward, Graphics, Group, Growth, Icon, Ideas, Illustration, Isolated, Leader, Leadership, Line, Man, Motion, Moving, Pattern, People, Progress, Red, Render, Rendering, Shape, Sign, Solution, Strategy, Success, Symbol
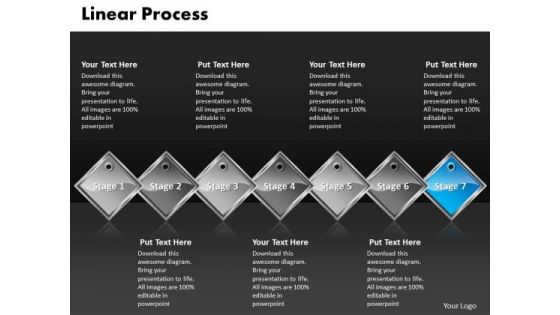
Ppt Blue Diamond Linear Writing Process PowerPoint Presentation 7 Stages Templates
PPT blue diamond linear writing process powerpoint presentation 7 stages Templates-Use this Diamond based Operation Chart Diagram to explore seventh stage of a Linear Process. This chart visualize the process steps, reoccurrences and components or of your company structure or product features.-PPT blue diamond linear writing process powerpoint presentation 7 stages Templates-Abstract, Artwork, Beam, Blue, Concept, Conceptual, Contemporary, Core, Cyberspace, Data, Depth, Dimension, Dynamic, Field, Form, Geometric, Glow, Glowing, Graphic, Hi-Tech, Idea, Illumination, Inner, Inside, Linear, Lines, Writing
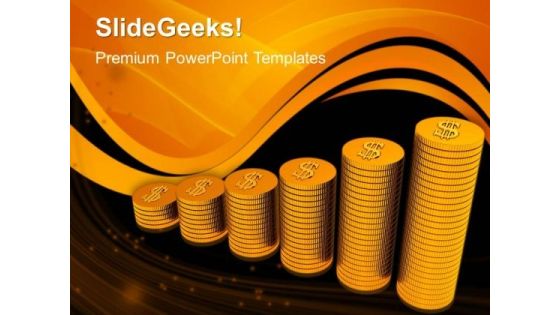
Coins Investment PowerPoint Templates And PowerPoint Themes 1012
Coins Investment PowerPoint Templates And PowerPoint Themes 1012-Use this PowerPoint Template to signify the concept of Bar graph. It consists of the coins forming the Bar graph. This image has been conceived to enable you to emphatically communicate your ideas in your Business PPT presentation. Original thinking is the need of the hour. We provide the means to project your views.-Coins Investment PowerPoint Templates And PowerPoint Themes 1012-This PowerPoint template can be used for presentations relating to-Gold coins, business, money, finance, success, signs

Investment Risk Assessment Of Stocks With Trend Structure PDF
This slide shows the key strategies for risk management in stock market. These strategies are portfolio diversification, bottom line, lower portfolio volatility, etc Showcasing this set of slides titled Investment Risk Assessment Of Stocks With Trend Structure PDF. The topics addressed in these templates are Stock Listing, Trend, Investment. All the content presented in this PPT design is completely editable. Download it and make adjustments in color, background, font etc. as per your unique business setting.

Graphical Representation Of Research IT Bivariate Analysis Techniques Formats PDF
This slide describes the second analysis technique, bivariate analysis for data visualization, which includes three plots line, bar, and scatter. Deliver and pitch your topic in the best possible manner with this graphical representation of research it bivariate analysis techniques formats pdf. Use them to share invaluable insights on bivariate analysis techniques for data visualization and impress your audience. This template can be altered and modified as per your expectations. So, grab it now.

Branches For Visualization Research And Development Bivariate Analysis Techniques For Data Structure PDF
This slide describes the second analysis technique, bivariate analysis for data visualization, which includes three plots line, bar, and scatter. There are so many reasons you need a Branches For Visualization Research And Development Bivariate Analysis Techniques For Data Structure PDF. The first reason is you cant spend time making everything from scratch, Thus, Slidegeeks has made presentation templates for you too. You can easily download these templates from our website easily.
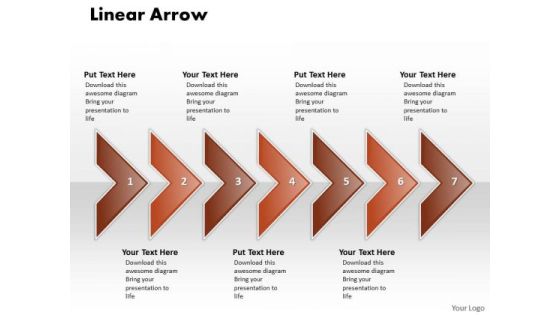
Ppt Linear Arrow Business 7 State PowerPoint Presentation Diagram Templates
PPT linear arrow Business 7 state powerpoint presentation diagram Templates-Most events and in every aspect of life are invariably interlinked. Use this graphic to outline your thoughts and their inherent interdependence to achieve the final outcome.-PPT linear arrow Business 7 state powerpoint presentation diagram Templates-Abstract, Age, Ancient, Antique, Arrows, Art, Artistic, Background, Colors, Decoration, Design, Dynamic, Elegant, Element, Future, Illustration, Index, Linear, Lines, Modern, Old, Paper, Pattern, Scratch, Text, Texture, Up, Vintage
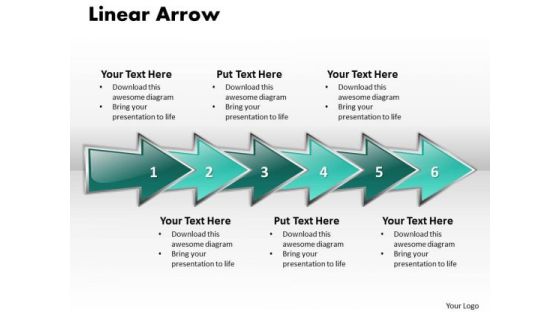
Ppt Linear Arrow Business 6 Stages PowerPoint Templates
PPT linear arrow Business 6 stages PowerPoint Templates-This PowerPoint diagram shows six processes that lead to side of the arrow. you can edit text, color, shade and style as per you need.-PPT linear arrow Business 6 stages PowerPoint Templates-Abstract, Age, Ancient, Antique, Arrows, Art, Artistic, Background, Colors, Decoration, Design, Dynamic, Elegant, Element, Future, Illustration, Index, Linear, Lines, Modern, Old, Paper, Pattern, Scratch, Text, Texture, Up, Vintage

Ppt Linear Arrow Business 7 Stages PowerPoint Templates
PPT linear arrow Business 7 stages PowerPoint Templates-This Diagram can present a simple, high-level view of the operations that a system performs, in the order in which they are performed, or a more detailed view-PPT linear arrow Business 7 stages PowerPoint Templates-Abstract, Age, Ancient, Antique, Arrows, Art, Artistic, Background, Colors, Decoration, Design, Dynamic, Elegant, Element, Future, Illustration, Index, Linear, Lines, Modern, Old, Paper, Pattern, Scratch, Text, Texture, Up, Vintage

Ppt 3d Linear Description Of Free Concept Steps 6 State Diagram PowerPoint Templates
PPT 3d linear description of free concept steps 6 state diagram PowerPoint Templates-Use this diagram to define steps in a process. It can help you to make a great illustration within your presentation.-PPT 3d linear description of free concept steps 6 state diagram PowerPoint Templates-3d, Abstract, Arrows, Background, Ball, Business, Communication, Corporate, Decision, Determination, Follow, Illustration, Individuality, Leadership, Line, Many, Object, Path, Reflection, Row, Shine, Sphere, Success, Symbol
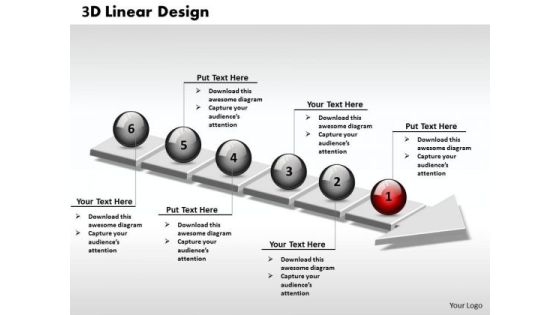
Ppt 3d Linear Design Of Business PowerPoint Presentation Steps 6 Stages Templates
PPT 3d linear design of business powerpoint presentation steps 6 stages Templates-Use this diagram to define steps in a process. It can help you to make a great illustration within your presentation.-PPT 3d linear design of business powerpoint presentation steps 6 stages Templates-3d, Abstract, Arrows, Background, Ball, Business, Communication, Corporate, Decision, Determination, Follow, Illustration, Individuality, Leadership, Line, Many, Object, Path, Reflection, Row, Shine, Sphere, Success, Symbol
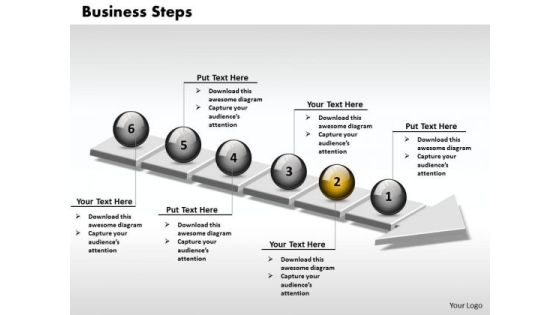
Ppt 3d Linear Illustration Of Business PowerPoint Presentation Steps 6 Stages Templates
PPT 3d linear illustration of business powerpoint presentation steps 6 stages Templates-Use this diagram to define steps in a process. It can help you to make a great illustration within your presentation.-PPT 3d linear illustration of business powerpoint presentation steps 6 stages Templates-3d, Abstract, Arrows, Background, Ball, Business, Communication, Corporate, Decision, Determination, Follow, Illustration, Individuality, Leadership, Line, Many, Object, Path, Reflection, Row, Shine, Sphere, Success, Symbol

Continual Service Improvement Template 1 Ppt PowerPoint Presentation Ideas Example Topics
This is a continual service improvement template 1 ppt powerpoint presentation ideas example topics. This is a four stage process. The stages in this process are business, marketing, combo chart, finance, graph.

Business Sales PowerPoint Templates Business Bar Chart Data Driven Ppt Slides
Business Sales PowerPoint Templates Business bar chart data driven PPT Slides-This PowerPoint d Editable Data-Driven Chart is for visualizing your figures and data. Business Sales PowerPoint Templates Business bar chart data driven PPT Slides-This ppt can be used for concepts relating to-Chat, Illustration, data driven, figures, charts and Graphs.

Bar Chart For Business Sales Analysis Ppt PowerPoint Presentation Styles Icon
Presenting this set of slides with name bar chart for business sales analysis ppt powerpoint presentation styles icon. The topics discussed in these slides are education, growth, pencil bar graph. This is a completely editable PowerPoint presentation and is available for immediate download. Download now and impress your audience.

Bar Chart For Business Sectors Comparison Ppt PowerPoint Presentation Professional Guide
Presenting this set of slides with name bar chart for business sectors comparison ppt powerpoint presentation professional guide. The topics discussed in these slides are education, growth, pencil bar graph. This is a completely editable PowerPoint presentation and is available for immediate download. Download now and impress your audience.

Bar Chart For Facts Stats Growth And Percentage Analysis Ppt PowerPoint Presentation Styles Infographic Template
Presenting this set of slides with name bar chart for facts stats growth and percentage analysis ppt powerpoint presentation styles infographic template. This is a six stage process. The stages in this process are education, growth, pencil bar graph. This is a completely editable PowerPoint presentation and is available for immediate download. Download now and impress your audience.

Bar Chart For Website Performance Analysis Ppt PowerPoint Presentation Layouts Influencers
Presenting this set of slides with name bar chart for website performance analysis ppt powerpoint presentation layouts influencers. The topics discussed in these slides are education, growth, pencil bar graph. This is a completely editable PowerPoint presentation and is available for immediate download. Download now and impress your audience.
Five Stages Bar Chart For Business Profitability Analysis Ppt PowerPoint Presentation Icon Guide
Presenting this set of slides with name five stages bar chart for business profitability analysis ppt powerpoint presentation icon guide. The topics discussed in these slides are education, growth, pencil bar graph. This is a completely editable PowerPoint presentation and is available for immediate download. Download now and impress your audience.

Pencil Bar Chart Showing Marketing Fluctuation Ppt PowerPoint Presentation Outline Show
Presenting this set of slides with name pencil bar chart showing marketing fluctuation ppt powerpoint presentation outline show. The topics discussed in these slides are education, growth, pencil bar graph. This is a completely editable PowerPoint presentation and is available for immediate download. Download now and impress your audience.
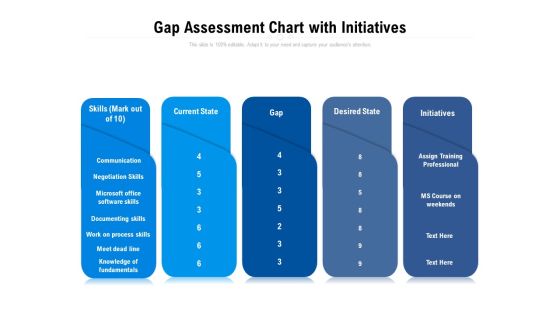
Gap Assessment Chart With Initiatives Ppt PowerPoint Presentation Layouts Graphics PDF
Presenting this set of slides with name gap assessment chart with initiatives ppt powerpoint presentation layouts graphics pdf. This is a five stage process. The stages in this process are communication, negotiation skills, microsoft office software skills, documenting skills, work on process skills, meet dead line, knowledge of fundamentals. This is a completely editable PowerPoint presentation and is available for immediate download. Download now and impress your audience.

Number Of Employees Analysis Chart Of Three Companies Ppt PowerPoint Presentation Outline Pictures PDF
Presenting this set of slides with name number of employees analysis chart of three companies ppt powerpoint presentation outline pictures pdf. This is a four stage process. The stages in this process are service lines, strongest performance, global headcount, assurance, advisory, tas, tax, consumer products, government and public sector, power and utilities. This is a completely editable PowerPoint presentation and is available for immediate download. Download now and impress your audience.
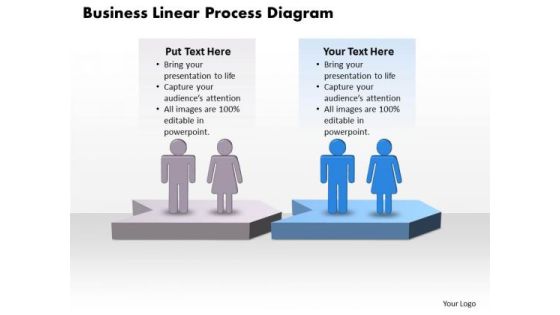
Usa Ppt Theme Business PowerPoint Linear Process Diagram Free 3 Design
USA PPT Theme business powerpoint linear process diagram free 3 design-Use this diagram to amplify on your plans to have dedicated sub groups working on related but distinct tasks. Explain your strategy to co-ordinate activities of these separate groups-USA PPT Theme business powerpoint linear process diagram free 3 design-Abstract, Achievement, Action, Arrows, Backgrounds, Business, Chart, Color, Competition, Computer, Concepts, Creative, Design, Different, Direction, Diversity, First, Forward, Graphics, Group, Growth, Icon, Ideas, Illustration, Isolated, Leader, Leadership, Line, Man, Motion, Moving, Pattern, People, Progress, Red, Render, Rendering, Shape, Sign, Solution, Strategy, Success, Symbol
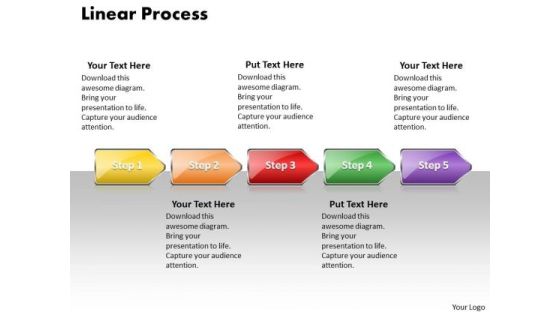
Ppt Arrow Nursing Process PowerPoint Presentation 5 Phase Diagram Style 1 Templates
PPT arrow nursing process powerpoint presentation 5 phase diagram style 1 Templates-This Sequential Steps Diagram is a graphical representation of a process. Steps in a process are shown with these arrow shapes-PPT arrow nursing process powerpoint presentation 5 phase diagram style 1 Templates-Arrow, Art, Attendance, Background, Blank, Blue, Chart, Clip, Clipart, Education, English, Graphic, Horizontal, Icon, Illustration, Learning, Line, Notes, Process, Read, Red, Review, Science

Creating Positioning Techniques For Market Research Running Email Marketing Campaign To Boost Sales Clipart PDF
The following slide outlines an overview of email marketing campaign that can assist corporates to increase organization bottom line. The campaign provides information about purpose, subject line, duration, budget, target audience segmentation, techniques, etc. Present like a pro with Creating Positioning Techniques For Market Research Running Email Marketing Campaign To Boost Sales Clipart PDF Create beautiful presentations together with your team, using our easy to use presentation slides. Share your ideas in real time and make changes on the fly by downloading our templates. So whether you are in the office, on the go, or in a remote location, you can stay in sync with your team and present your ideas with confidence. With Slidegeeks presentation got a whole lot easier. Grab these presentations today.

Ppt Free Business Sample Presentation PowerPoint Process Management Diagram Templates
PPT free business sample presentation powerpoint process management diagram Templates-This Diagram is great for showing different departments in a company or different stages of a typical business process-PPT free business sample presentation powerpoint process management diagram Templates-Abstract, Achievement, Action, Arrows, Backgrounds, Business, Chart, Color, Competition, Computer, Concepts, Creative, Design, Different, Direction, Diversity, First, Forward, Graphics, Group, Growth, Icon, Ideas, Illustration, Isolated, Leader, Leadership, Line, Man, Motion, Moving, Pattern, People, Progress, Red, Render, Rendering, Shape, Sign, Solution, Strategy, Success, Symbol
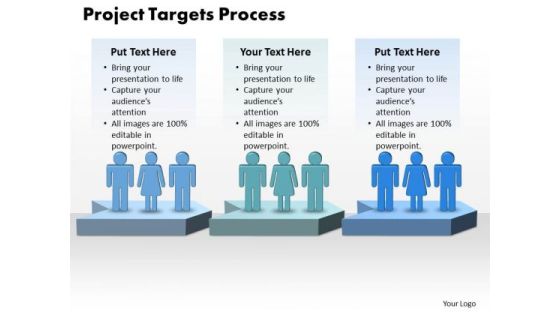
Ppt Project Targets Definition Process 3 Stages PowerPoint Templates
PPT project targets definition process 3 stages PowerPoint Templates-This Diagram is great for showing different departments in a company or different stages of a typical business process-PPT project targets definition process 3 stages PowerPoint Templates-Abstract, Achievement, Action, Arrows, Backgrounds, Business, Chart, Color, Competition, Computer, Concepts, Creative, Design, Different, Direction, Diversity, First, Forward, Graphics, Group, Growth, Icon, Ideas, Illustration, Isolated, Leader, Leadership, Line, Man, Motion, Moving, Pattern, People, Progress, Red, Render, Rendering, Shape, Sign, Solution, Strategy, Success, Symbol
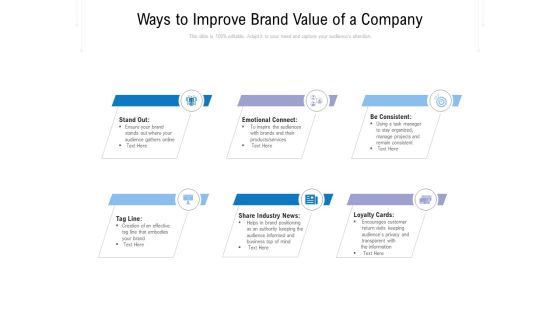
Ways To Improve Brand Value Of A Company Ppt PowerPoint Presentation Inspiration Visual Aids
Presenting this set of slides with name ways to improve brand value of a company ppt powerpoint presentation inspiration visual aids. This is a six stage process. The stages in this process are stand out, emotional connect, be consistent, tag line, share industry news, loyalty cards. This is a completely editable PowerPoint presentation and is available for immediate download. Download now and impress your audience.

Successful Business Men Leader Showing PowerPoint Theme Growth Factors Slides
We present our successful business men leader showing powerpoint theme growth factors Slides.Use our People PowerPoint Templates because It can Bubble and burst with your ideas. Use our Business PowerPoint Templates because You can Be the puppeteer with our PowerPoint Templates and Slides as your strings. Lead your team through the steps of your script. Download and present our Finance PowerPoint Templates because Our PowerPoint Templates and Slides are effectively colour coded to prioritise your plans They automatically highlight the sequence of events you desire. Download and present our Marketing PowerPoint Templates because It can Bubble and burst with your ideas. Present our Signs PowerPoint Templates because Our PowerPoint Templates and Slides are topically designed to provide an attractive backdrop to any subject.Use these PowerPoint slides for presentations relating to chart, growth, market, binder, leader, isolated, human, sales, file, document, economy, white, corporate, business, sign, line, adult, success, growing, male, graphic, finance, pen, report, people, black, close-up, suit, graph, illustration, object, paperwork, holding, executive, professional, showing, paper, organization, progress, information, background, work, manager, office, man, financial, hand, businessman. The prominent colors used in the PowerPoint template are Red, Green, Black.

Business People Do Not Be An Introvert PowerPoint Templates Ppt Backgrounds For Slides
We present our business people do not be an introvert PowerPoint templates PPT backgrounds for slides.Download and present our People PowerPoint Templates because Our PowerPoint Templates and Slides are created with admirable insight. Use them and give your group a sense of your logical mind. Download and present our Arrows PowerPoint Templates because Our PowerPoint Templates and Slides will let you Hit the right notes. Watch your audience start singing to your tune. Download our Signs PowerPoint Templates because Timeline crunches are a fact of life. Meet all deadlines using our PowerPoint Templates and Slides. Use our Shapes PowerPoint Templates because Timeline crunches are a fact of life. Meet all deadlines using our PowerPoint Templates and Slides. Download our Business PowerPoint Templates because Our PowerPoint Templates and Slides are like the strings of a tennis racquet. Well strung to help you serve aces.Use these PowerPoint slides for presentations relating to 3d, achievement, aim, arrow, chart, colorful, competition, concept, connection, curve, different, direction, down, downwards, figure, forward, graph, graphic, green, growth, guy, human, information, isolated, leader, leading, line, little, man, motion, moving, path, people, person, perspective, point, pointer, progress, red, sign, small, stats, symbol, turning, up, upwards, win. The prominent colors used in the PowerPoint template are Yellow, Orange, Red.

Statistical Analysis Of Parallel Data 7 Stages Business Planning Guide PowerPoint Slides
We present our statistical analysis of parallel data 7 stages business planning guide PowerPoint Slides.Download our Communication PowerPoint Templates because the mind is always whirring with new ideas. Use our Business PowerPoint Templates because watch the excitement levels rise as they realise their worth. Download our Arrows PowerPoint Templates because you know Coincidentally it will always point to the top. Use our Success PowerPoint Templates because they represent the proress in our lives. Use our Symbol PowerPoint Templates because with the help of our Slides you can Illustrate how each element flows seamlessly onto the next stage.Use these PowerPoint slides for presentations relating to 3d, Achievement, Action, Aim, Arrows, Black, Business, Color, Communication, Competition, Concept, Connection, Creative, Design, Different, Direction, Element, First, Forward, Graph, Graphic, Group, Growth, Higher, Icon, Illustration, Image, Isolated, Leader, Leadership, Line, Menu, Motion, Orange, Progress, Series, Seven, Sign, Slew, Solution, Success, Swerve, Symbol, Team, Teamwork, Turn, Up. The prominent colors used in the PowerPoint template are Pink, Gray, Black. Customers tell us our statistical analysis of parallel data 7 stages business planning guide PowerPoint Slides are Graceful. Use our Black PowerPoint templates and PPT Slides are Attractive. PowerPoint presentation experts tell us our statistical analysis of parallel data 7 stages business planning guide PowerPoint Slides are Nice. People tell us our Business PowerPoint templates and PPT Slides are Glamorous. We assure you our statistical analysis of parallel data 7 stages business planning guide PowerPoint Slides are Flirty. People tell us our Color PowerPoint templates and PPT Slides are Great.

Stock Photo Green Grass Business Growth Chart PowerPoint Slide
This PowerPoint slide display chart created with green grass. This image slide has been crafted with graphic of green grass bar graph. This image depicts business. Use this image slide to express views on targets, goals, growth and management in your presentations. This image slide exhibits various information which requires visual aid. Enhance the quality of your presentations using this image.

Business Charts For Statistical Analysis Ppt PowerPoint Presentation Pictures Gridlines
Presenting this set of slides with name business charts for statistical analysis ppt powerpoint presentation pictures gridlines. The topics discussed in these slides are education, growth, pencil bar graph. This is a completely editable PowerPoint presentation and is available for immediate download. Download now and impress your audience.

Business Chart Finance PowerPoint Templates And PowerPoint Themes 1012
Visually support your Microsoft office PPT Presentation with our above template illustrating a colored bar graph. This image has been professionally designed to emphasize the concept of statistics. This image has been conceived to enable you to emphatically communicate your ideas in your Business and Financial PPT presentations showing reports, ratings and reviews etc. Deliver amazing presentations to mesmerize your audience.

Ppt Linear Arrow 8 Stages PowerPoint Templates
PPT linear arrow 8 stages PowerPoint Templates-In this Linear Arrow process flow chart, arrows show the flow, or movement, of the process from one step to the next. -PPT linear arrow 8 stages PowerPoint Templates-Arrow, Background, Collection, Completed, Concept, Confirmation, Design, Flow, Graph, Graphic, Illustration, Indication, Indicator, Information, Instruction, Interface, Internet, Layout, Measurement, Order, Phase, Pointer, Process, Progress, Reflection, Scale, Shape, Sign

Ppt Linear Arrow 5 Stages PowerPoint Templates
PPT linear arrow 5 stages PowerPoint Templates-This linear arrow process diagram is a graphic representation of all the major steps of a process.-PPT linear arrow 5 stages PowerPoint Templates-Arrow, Background, Collection, Completed, Concept, Confirmation, Design, Flow, Graph, Graphic, Illustration, Indication, Indicator, Information, Instruction, Interface, Internet, Layout, Measurement, Order, Phase, Pointer, Process, Progress, Reflection, Scale, Shape, Sign

Ppt Linear Arrow 6 Stages PowerPoint Templates
PPT linear arrow 6 stages PowerPoint Templates-This linear arrow process diagram is a graphic representation of all the major steps of a process.-PPT linear arrow 6 stages PowerPoint Templates-Arrow, Background, Collection, Completed, Concept, Confirmation, Design, Flow, Graph, Graphic, Illustration, Indication, Indicator, Information, Instruction, Interface, Internet, Layout, Measurement, Order, Phase, Pointer, Process, Progress, Reflection, Scale, Shape, Sign

Ppt Linear Arrow 11 Stages PowerPoint Templates
PPT linear arrow 11 stages PowerPoint Templates-Use this PowerPoint diagram to define basic work and data flow and quality management processes to increase efficiency of your business.-PPT linear arrow 11 stages PowerPoint Templates-Arrow, Background, Collection, Completed, Concept, Confirmation, Design, Flow, Graph, Graphic, Illustration, Indication, Indicator, Information, Instruction, Interface, Internet, Layout, Measurement, Order, Phase, Pointer, Process, Progress, Reflection, Scale, Shape, Sign

Ppt Linear Flow 8 Stages PowerPoint Templates
PPT linear flow 8 stages PowerPoint Templates-Use this Eight stage improvement process diagram to discuss process measurement and process improvement.-PPT linear flow 8 stages PowerPoint Templates-Arrow, Art, Background, Blank, Business, Chart, Clip, Diagram, Drop, Flow, Graph, Graphic, Gray, Illustration, Process, Shadow, Shape, Step, Symbol, Three, Transparency

Chart For Yearly Business Performance Analysis Ppt PowerPoint Presentation Slide Download
Presenting this set of slides with name chart for yearly business performance analysis ppt powerpoint presentation slide download. The topics discussed in these slides are education, growth, pencil bar graph. This is a completely editable PowerPoint presentation and is available for immediate download. Download now and impress your audience.
Five Steps Business Growth Chart With Icons Ppt PowerPoint Presentation Model Sample
Presenting this set of slides with name five steps business growth chart with icons ppt powerpoint presentation model sample. This is a five stage process. The stages in this process are education, growth, pencil bar graph. This is a completely editable PowerPoint presentation and is available for immediate download. Download now and impress your audience.
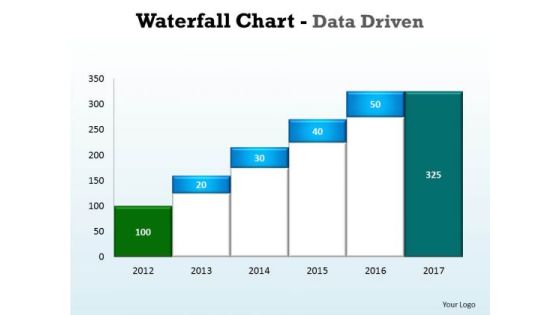
Business Graphic PowerPoint Templates Business Waterfall Chart Data Driven Ppt Slides
Business Graphic PowerPoint Templates Business waterfall chart data driven PPT Slides- This Water Fall chart can display continuous data over time, set against a common scale, and are therefore ideal for showing trends in data at equal intervals-This ppt can be used for concepts relating to-chart,, graph, growth, investment, , market, percentage, , presentation report, results, statistics, stock, success and business.
 Home
Home