Line Graph

Market Downfall Line Graph Ppt PowerPoint Presentation Infographics
This is a market downfall line graph ppt powerpoint presentation infographics. This is a twelve stage process. The stages in this process are business, graph, growth, market, fall.

Plotting Line Graph Ppt Powerpoint Presentation Styles Maker
This is a plotting line graph ppt powerpoint presentation styles maker. This is a five stage process. The stages in this process are scatter plot, probability plots, plot diagram.

Clustered Column Line Graph Ppt PowerPoint Presentation Ideas Demonstration
This is a clustered column line graph ppt powerpoint presentation ideas demonstration. This is a three stage process. The stages in this process are financial, minimum, maximum, marketing, strategy.

Clustered Column Line Graph Ppt PowerPoint Presentation File Clipart
This is a clustered column line graph ppt powerpoint presentation file clipart. This is a three stage process. The stages in this process are finance, marketing, management, investment, analysis.

Clustered Column Line Graph Ppt PowerPoint Presentation Inspiration Deck
This is a clustered column line graph ppt powerpoint presentation inspiration deck. This is a three stage process. The stages in this process are finance, marketing, analysis, investment, million.
Line Graph Icon Representing Growth In Internet Trend Rules PDF
Persuade your audience using this Line Graph Icon Representing Growth In Internet Trend Rules PDF This PPT design covers Four stages, thus making it a great tool to use. It also caters to a variety of topics including Line Graph, Icon Representing, Growth Internet Trend Download this PPT design now to present a convincing pitch that not only emphasizes the topic but also showcases your presentation skills.
Straight Line Graph Ppt PowerPoint Presentation Visual Aids Inspiration Cpb
Presenting this set of slides with name straight line graph ppt powerpoint presentation visual aids inspiration cpb. This is an editable Powerpoint three stages graphic that deals with topics like straight line graph to help convey your message better graphically. This product is a premium product available for immediate download and is 100 percent editable in Powerpoint. Download this now and use it in your presentations to impress your audience.
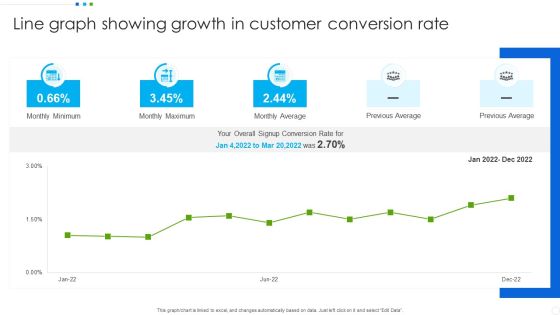
Line Graph Showing Growth In Customer Conversion Rate Inspiration PDF
Pitch your topic with ease and precision using this Line Graph Showing Growth In Customer Conversion Rate Inspiration PDF. This layout presents information on Monthly Average, Customer Conversion Rate, Previous Average. It is also available for immediate download and adjustment. So, changes can be made in the color, design, graphics or any other component to create a unique layout.

Clustered Column Line Graph Ppt PowerPoint Presentation Icon Show
Presenting this set of slides with name clustered column line graph ppt powerpoint presentation icon show. The topics discussed in these slides are business, planning, strategy, marketing, management. This is a completely editable PowerPoint presentation and is available for immediate download. Download now and impress your audience.

Stacked Line Graph Ppt PowerPoint Presentation Portfolio Brochure
Presenting this set of slides with name stacked line graph ppt powerpoint presentation portfolio brochure. The topics discussed in these slides are marketing, business, management, planning, strategy. This is a completely editable PowerPoint presentation and is available for immediate download. Download now and impress your audience.

Business Diagram Line Graph For Dollar Growth Presentation Template
Graphic of dollar symbol and growth arrow has been used to design this power point template. This diagram contains the concept of financial result analysis. Use this business diagram for finance related presentations

Upward Line Graph For Investors Growth Ppt PowerPoint Presentation Gallery Topics PDF
Presenting this set of slides with name upward line graph for investors growth ppt powerpoint presentation gallery topics pdf. The topics discussed in these slide is upward line graph for investors growth. This is a completely editable PowerPoint presentation and is available for immediate download. Download now and impress your audience.
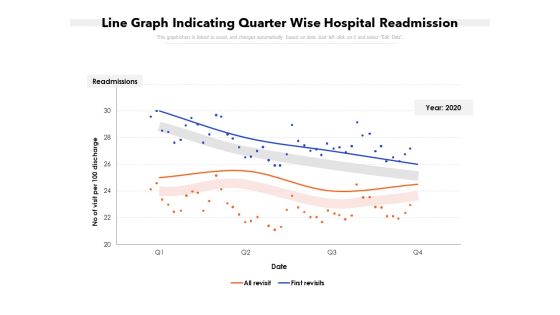
Line Graph Indicating Quarter Wise Hospital Readmission Ppt PowerPoint Presentation Gallery Layouts PDF
Showcasing this set of slides titled line graph indicating quarter wise hospital readmission ppt powerpoint presentation gallery layouts pdf. The topics addressed in these templates are line graph indicating quarter wise hospital readmission. All the content presented in this PPT design is completely editable. Download it and make ajustments in color, background, font etc. as per your unique business setting.
Financial Line Graph Vector Icon Ppt PowerPoint Presentation Infographic Template Mockup
Presenting this set of slides with name financial line graph vector icon ppt powerpoint presentation infographic template mockup. This is a three stage process. The stages in this process are financial line graph vector icon. This is a completely editable PowerPoint presentation and is available for immediate download. Download now and impress your audience.
Line Graph Icon For Business Statistical Analysis Ppt PowerPoint Presentation Gallery Clipart Images PDF
Presenting this set of slides with name line graph icon for business statistical analysis ppt powerpoint presentation gallery clipart images pdf. The topics discussed in these slide is line graph icon for business statistical analysis. This is a completely editable PowerPoint presentation and is available for immediate download. Download now and impress your audience.
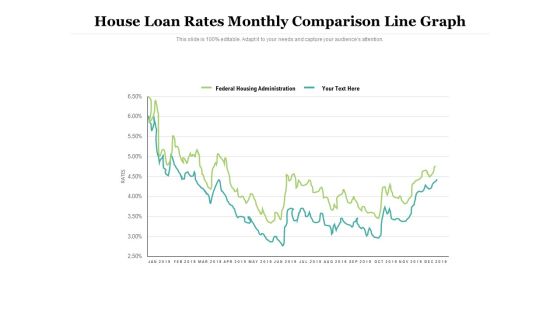
House Loan Rates Monthly Comparison Line Graph Ppt PowerPoint Presentation Slides Graphics Pictures PDF
Showcasing this set of slides titled house loan rates monthly comparison line graph ppt powerpoint presentation slides graphics pictures pdf. The topics addressed in these templates are federal housing administration, house loan rates, line graph. All the content presented in this PPT design is completely editable. Download it and make adjustments in color, background, font etc. as per your unique business setting.
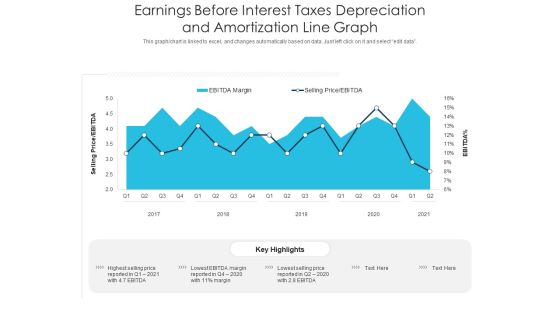
Earnings Before Interest Taxes Depreciation And Amortization Line Graph Ppt PowerPoint Presentation Layouts Aids PDF
Showcasing this set of slides titled earnings before interest taxes depreciation and amortization line graph ppt powerpoint presentation layouts aids pdf. The topics addressed in these templates are earnings before interest taxes depreciation and amortization line graph. All the content presented in this PPT design is completely editable. Download it and make adjustments in color, background, font etc. as per your unique business setting.

Budget Line Graph For Innovation Sprint In Safe Trends Diagrams PDF
This slide shows the line graph representing the budget and innovation sprint trends. It shows the average budget spent on innovation and the upcoming trends in the innovation sprint. Pitch your topic with ease and precision using this Budget Line Graph For Innovation Sprint In Safe Trends Diagrams PDF. This layout presents information on Budget Line Graph, For Innovation Sprint, In Safe Trends. It is also available for immediate download and adjustment. So, changes can be made in the color, design, graphics or any other component to create a unique layout.

Line Graph For Year To Year Comparison Ppt PowerPoint Presentation Show Graphics Example
Presenting this set of slides with name line graph for year to year comparison ppt powerpoint presentation show graphics example. The topics discussed in these slides are revenue trend, bar chart, financial. This is a completely editable PowerPoint presentation and is available for immediate download. Download now and impress your audience.

Competition Market Share Analysis Line Graph Ppt PowerPoint Presentation Portfolio Layouts
Presenting this set of slides with name competition market share analysis line graph ppt powerpoint presentation portfolio layouts. The topics discussed in these slides are marketing, business, management, planning, strategy. This is a completely editable PowerPoint presentation and is available for immediate download. Download now and impress your audience.
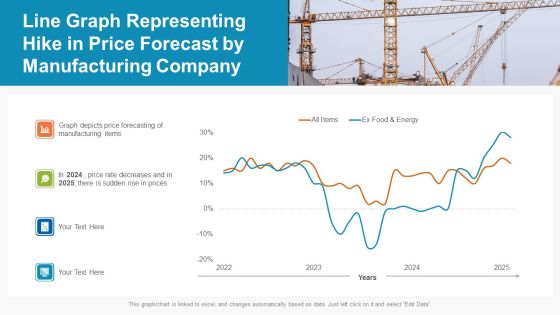
Line Graph Representing Hike In Price Forecast By Manufacturing Company Ppt PowerPoint Presentation File Skills PDF
Pitch your topic with ease and precision using this line graph representing hike in price forecast by manufacturing company ppt powerpoint presentation file skills pdf. This layout presents information on manufacturing, price, price rate decreases. It is also available for immediate download and adjustment. So, changes can be made in the color, design, graphics or any other component to create a unique layout.
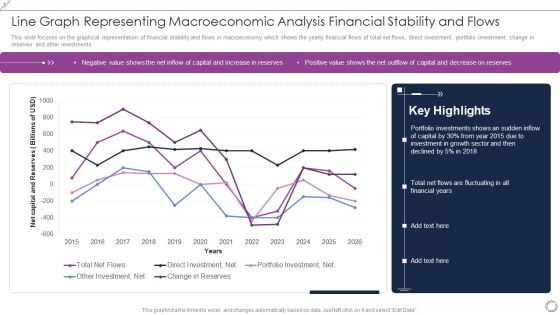
Line Graph Representing Macroeconomic Analysis Financial Stability And Flows Rules PDF
This slide focuses on the graphical representation of financial stability and flows in macroeconomy which shows the yearly financial flows of total net flows, direct investment, portfolio investment, change in reserves and other investments. Showcasing this set of slides titled Line Graph Representing Macroeconomic Analysis Financial Stability And Flows Rules PDF. The topics addressed in these templates are Total Net Flows, Direct Investment, Net, Portfolio Investment, Net. All the content presented in this PPT design is completely editable. Download it and make adjustments in color, background, font etc. as per your unique business setting.
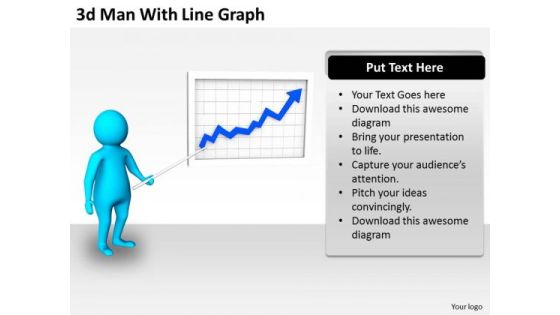
Business Plan And Strategy 3d Man With Line Graph Adaptable Concepts
Our Businessplanandstrategy3dmanwithlinegraphadaptableconcepts Powerpoint Templates Deliver At Your Doorstep. Let Them In For A Wonderful Experience.

Line Chart Graph Bar Ppt PowerPoint Presentation Gallery Layout
Presenting this set of slides with name line chart graph bar ppt powerpoint presentation gallery layout. The topics discussed in these slides are marketing, business, management, planning, strategy. This is a completely editable PowerPoint presentation and is available for immediate download. Download now and impress your audience.
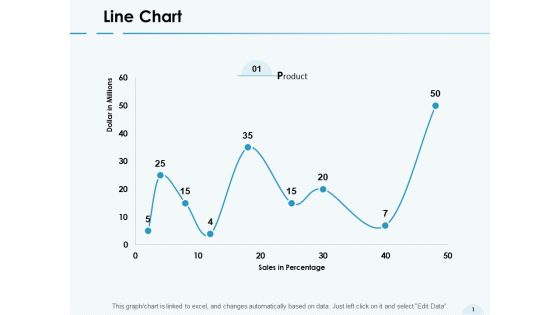
Line Chart Graph Ppt PowerPoint Presentation Gallery Structure
Presenting this set of slides with name line chart graph ppt powerpoint presentation gallery structure. The topics discussed in these slides are marketing, business, management, planning, strategy. This is a completely editable PowerPoint presentation and is available for immediate download. Download now and impress your audience.

Bar Graph With Line Chart For Analysis Powerpoint Slides
This PowerPoint template contains design of bar graph with line chart. You may download this slide to display strategy steps for business growth. You can easily customize this template to make it more unique as per your need.

Line Comparison Graph For Yearly Liquidity Ratio Analysis Comparison Topics PDF
This slide showcases liquidity ratios graph that can help in identifying cash richness and financial position of organization. It showcases comparison for last 6 years and it key components are current ratio, quick ratio and cash ratio. Showcasing this set of slides titled Line Comparison Graph For Yearly Liquidity Ratio Analysis Comparison Topics PDF. The topics addressed in these templates are Term Financing, Cash Shortage, Cash Ratio. All the content presented in this PPT design is completely editable. Download it and make adjustments in color, background, font etc. as per your unique business setting.

Data Analysis Template Driven Line Chart Business Graph PowerPoint Slides Templates
Bottle Your Thoughts In Our data analysis template driven line chart business graph powerpoint slides Templates . Pass It Around For Your Audience To Sip.
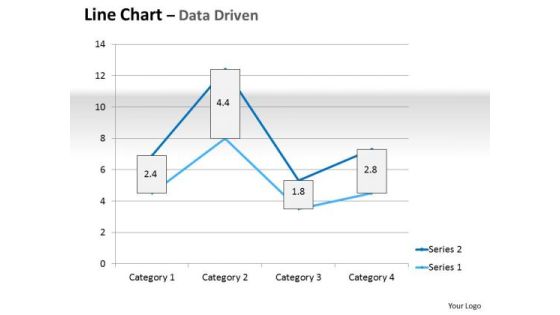
Multivariate Data Analysis Driven Line Chart Market Graph PowerPoint Slides Templates
Plan For All Contingencies With Our multivariate data analysis driven line chart market graph powerpoint slides Templates . Douse The Fire Before It Catches.

Stacked Line With Markers Graph Ppt PowerPoint Presentation Pictures Graphics Example
Presenting this set of slides with name stacked line with markers graph ppt powerpoint presentation pictures graphics example. The topics discussed in these slides are marketing, business, management, planning, strategy. This is a completely editable PowerPoint presentation and is available for immediate download. Download now and impress your audience.

Bar Graph And Line Chart For Comparative Analysis Icon Ppt PowerPoint Presentation Gallery Infographics PDF
Showcasing this set of slides titled bar graph and line chart for comparative analysis icon ppt powerpoint presentation gallery infographics pdf. The topics addressed in these templates are bar graph and line chart for comparative analysis icon. All the content presented in this PPT design is completely editable. Download it and make adjustments in color, background, font etc. as per your unique business setting.

Graph And Spheres Stacked In Line 4 Stages Business Plan PowerPoint Slides
We present our graph and spheres stacked in line 4 stages business plan PowerPoint Slides.Present our Business PowerPoint Templates because You are an avid believer in ethical practices. Highlight the benefits that accrue with our PowerPoint Templates and Slides. Use our Spheres PowerPoint Templates because you can Set pulses racing with our PowerPoint Templates and Slides. They will raise the expectations of your team. Present our Competition PowerPoint Templates because It will Raise the bar of your Thoughts. They are programmed to take you to the next level. Present our Shapes PowerPoint Templates because You can Bait your audience with our PowerPoint Templates and Slides. They will bite the hook of your ideas in large numbers. Use our Success PowerPoint Templates because You can Be the star of the show with our PowerPoint Templates and Slides. Rock the stage with your ideas.Use these PowerPoint slides for presentations relating to bar, graph, statistics, economy, render, success, representation, diagram, graphic, achievment, obstruction, chevron, accounting, finances, energy eco, steps, figure, tall, barrier, strategy, ladder, up, planning, high, climb, stripes, growth, maintenance, profit, successful, repair, return, gradient, sustainability, financial, construction, upwards, increasing. The prominent colors used in the PowerPoint template are Blue light, Blue, Green.

Budgetary Trends Graph Icon With Magnifying Glass And Trend Line Introduction PDF
Presenting Budgetary Trends Graph Icon With Magnifying Glass And Trend Line Introduction PDF to dispense important information. This template comprises four stages. It also presents valuable insights into the topics including Budgetary Trends, Graph Icon, Magnifying Glass. This is a completely customizable PowerPoint theme that can be put to use immediately. So, download it and address the topic impactfully.
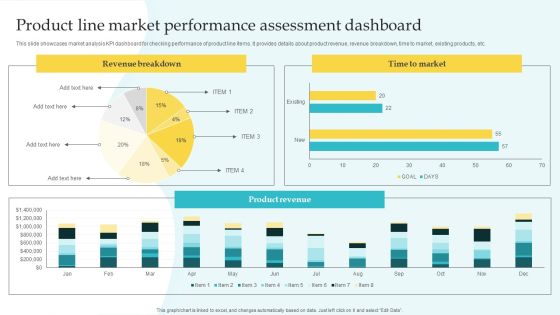
Commodity Line Expansion Product Line Market Performance Assessment Download PDF
This slide showcases market analysis KPI dashboard for checking performance of product line items. It provides details about product revenue, revenue breakdown, time to market, existing products, etc. Explore a selection of the finest Commodity Line Expansion Product Line Market Performance Assessment Download PDF here. With a plethora of professionally designed and pre-made slide templates, you can quickly and easily find the right one for your upcoming presentation. You can use our Commodity Line Expansion Product Line Market Performance Assessment Download PDF to effectively convey your message to a wider audience. Slidegeeks has done a lot of research before preparing these presentation templates. The content can be personalized and the slides are highly editable. Grab templates today from Slidegeeks.
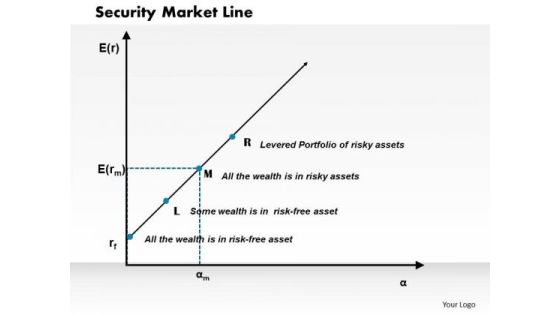
Business Framework Security Market Line PowerPoint Presentation
This diagram displays graph of security market line. You can use line graph to plot changes in data over time, such as monthly revenue and earnings changes or daily changes in stock market prices.
Line Chart Ppt PowerPoint Presentation Gallery Icon
This is a line chart ppt powerpoint presentation gallery icon. This is a two stage process. The stages in this process are business, marketing, line, graph, success.
Line Chart Ppt PowerPoint Presentation Icon Elements
This is a line chart ppt powerpoint presentation icon elements. This is a two stage process. The stages in this process are line graph, marketing, presentation, business, management.
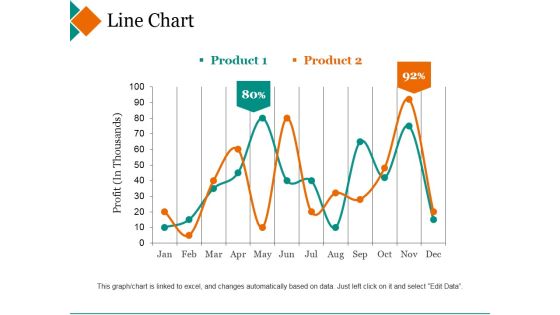
Line Chart Ppt PowerPoint Presentation Inspiration Deck
This is a line chart ppt powerpoint presentation inspiration deck. This is a two stage process. The stages in this process are product, profit, percentage, finance, line graph.

Clustered Column Line Slides PDF
Deliver and pitch your topic in the best possible manner with this clustered column line slides pdf. Use them to share invaluable insights on clustered column line and impress your audience. This template can be altered and modified as per your expectations. So, grab it now.

Commodity Line Expansion Brand Product Line Extension Planning Mockup PDF
This slide showcases product line extension plan significant for marketers in launching new branding campaigns. It provides details existing range, brand identity, market trends, competition, target market, demand, profit margin, range, etc. Are you in need of a template that can accommodate all of your creative concepts This one is crafted professionally and can be altered to fit any style. Use it with Google Slides or PowerPoint. Include striking photographs, symbols, depictions, and other visuals. Fill, move around, or remove text boxes as desired. Test out color palettes and font mixtures. Edit and save your work, or work with colleagues. Download Commodity Line Expansion Brand Product Line Extension Planning Mockup PDF and observe how to make your presentation outstanding. Give an impeccable presentation to your group and make your presentation unforgettable.

Line Chart Business PowerPoint Presentation
Establish Your Dominion With Our Line Chart Business Powerpoint Presentation Powerpoint Templates. Rule The Stage With Your Thoughts.
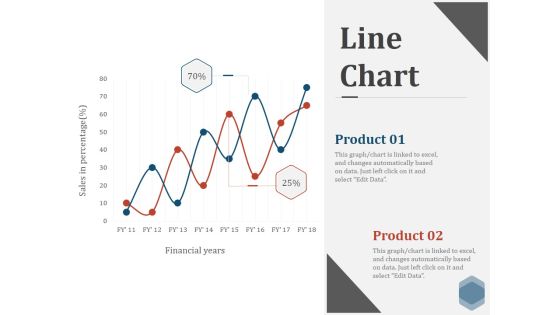
Line Chart Ppt PowerPoint Presentation Show Visuals
This is a line chart ppt powerpoint presentation show visuals. This is a two stage process. The stages in this process are financial, graph, line, marketing, success.
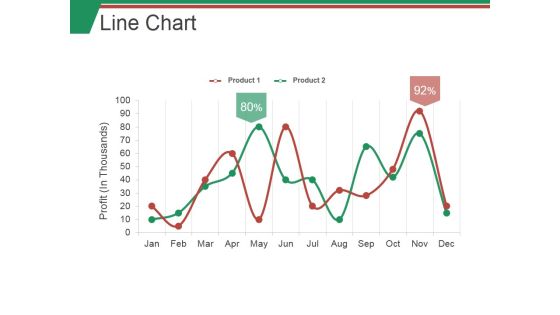
Line Chart Ppt PowerPoint Presentation Inspiration Microsoft
This is a line chart ppt powerpoint presentation inspiration microsoft. This is a two stage process. The stages in this process are business, marketing, graph, line, success.
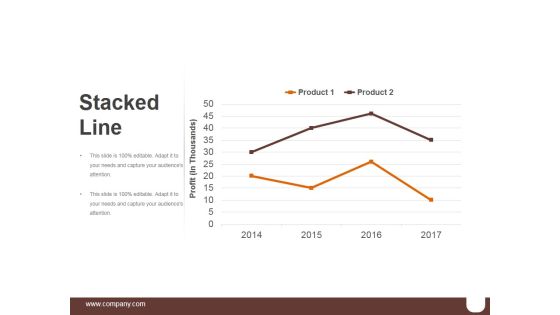
Stacked Line Ppt PowerPoint Presentation Background Images
This is a stacked line ppt powerpoint presentation background images. This is a two stage process. The stages in this process are business, marketing, graph, success, line.

Clustered Column Line Ppt PowerPoint Presentation Professional
This is a clustered column line ppt powerpoint presentation professional. This is a three stage process. The stages in this process are clustered column line, product, bar graph, marketing, finance.
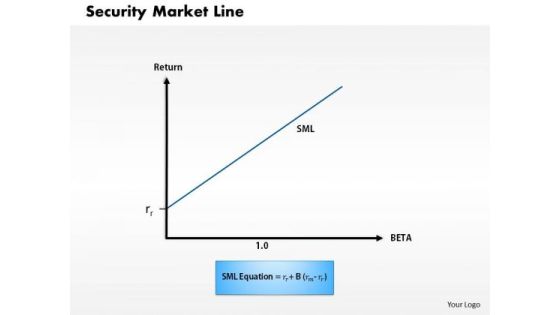
Business Framework Security Market Line 1 PowerPoint Presentation
This diagram displays graph of security market line. You can use line graph to plot changes in data over time, such as monthly revenue and earnings changes or daily changes in stock market prices.

Business Framework Security Market Line 11 PowerPoint Presentation
This diagram displays graph of security market line. You can use line graph to plot changes in data over time, such as monthly revenue and earnings changes or daily changes in stock market prices.

Line Chart Ppt PowerPoint Presentation Portfolio Guidelines
Presenting this set of slides with name line chart ppt powerpoint presentation portfolio guidelines. The topics discussed in these slide is line chart. This is a completely editable PowerPoint presentation and is available for immediate download. Download now and impress your audience.

Line Chart Ppt PowerPoint Presentation Model Examples
Presenting this set of slides with name line chart ppt powerpoint presentation model examples. The topics discussed in these slide is line chart. This is a completely editable PowerPoint presentation and is available for immediate download. Download now and impress your audience.

Line Chart Ppt PowerPoint Presentation Show Outline
Presenting this set of slides with name line chart ppt powerpoint presentation show outline. The topics discussed in these slide is line chart. This is a completely editable PowerPoint presentation and is available for immediate download. Download now and impress your audience.
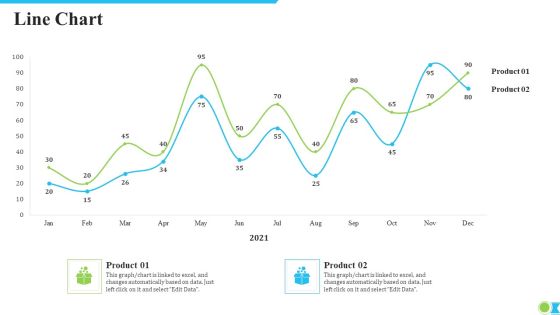
Line Chart Ppt Visual Aids Outline PDF
Deliver an awe-inspiring pitch with this creative line chart ppt visual aids outline pdf. bundle. Topics like line chart can be discussed with this completely editable template. It is available for immediate download depending on the needs and requirements of the user.
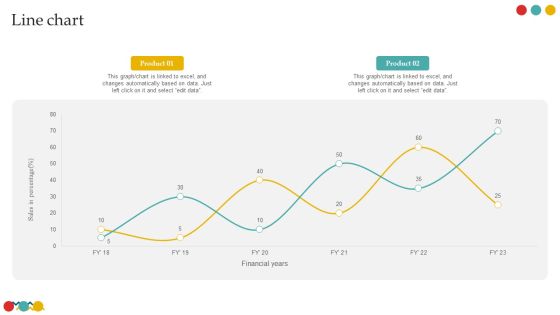
Line Chart Successful Rebranding Guide Designs PDF
Create an editable Line Chart Successful Rebranding Guide Designs PDF that communicates your idea and engages your audience. Whether you are presenting a business or an educational presentation, pre-designed presentation templates help save time. Line Chart Successful Rebranding Guide Designs PDF is highly customizable and very easy to edit, covering many different styles from creative to business presentations. Slidegeeks has creative team members who have crafted amazing templates. So, go and get them without any delay.

Line Chart Ppt PowerPoint Presentation Visual Aids
This is a line chart ppt powerpoint presentation visual aids. This is a two stage process. The stages in this process are product, line chart, growth, strategy, business.

Line Chart Ppt PowerPoint Presentation Layout
This is a line chart ppt powerpoint presentation layout. This is a two stage process. The stages in this process are business, marketing, line chart, finance, management.

Line Chart Ppt PowerPoint Presentation Summary Picture
This is a line chart ppt powerpoint presentation summary picture. This is a two stage process. The stages in this process are business, marketing, line chart, management, product.

Line Chart Ppt PowerPoint Presentation Model Elements
This is a line chart ppt powerpoint presentation model elements. This is a eight stage process. The stages in this process are business, strategy, analysis, planning, line chart.

Line Chart Ppt PowerPoint Presentation Professional Gridlines
This is a line chart ppt powerpoint presentation professional gridlines. This is a two stage process. The stages in this process are business, marketing, growth, success, line chart.

Line Chart Ppt PowerPoint Presentation File Diagrams
This is a line chart ppt powerpoint presentation file diagrams. This is a two stage process. The stages in this process are line chart, business, marketing, strategy, finance.

Line Chart Ppt PowerPoint Presentation Summary Demonstration
This is a line chart ppt powerpoint presentation summary demonstration. This is a two stage process. The stages in this process are business, profit, line chart, percentage, finance.

Line Chart Ppt PowerPoint Presentation Ideas Tips
This is a line chart ppt powerpoint presentation ideas tips. This is a two stage process. The stages in this process are line chart, growth, strategy, business, analysis.

Line Chart Ppt PowerPoint Presentation Model Model
This is a line chart ppt powerpoint presentation model model. This is a two stage process. The stages in this process are line chart, growth, strategy, business, analysis.
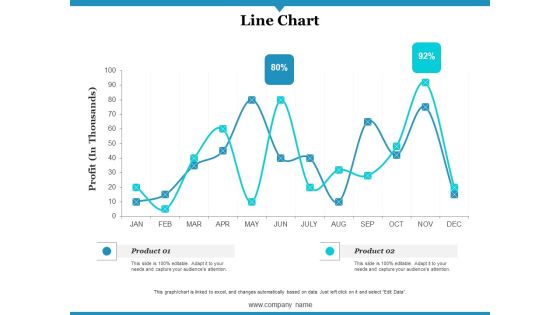
Line Chart Ppt PowerPoint Presentation Gallery Infographics
This is a line chart ppt powerpoint presentation gallery infographics. This is a two stage process. The stages in this process are profit, product, line chart.

Line Chart Ppt PowerPoint Presentation Layouts Microsoft
This is a line chart ppt powerpoint presentation layouts microsoft. This is a two stage process. The stages in this process are business, marketing, strategy, line, success.

Line Chart Ppt PowerPoint Presentation Ideas Professional
This is a line chart ppt powerpoint presentation ideas professional. This is a two stage process. The stages in this process are finance, business, success, line, growth.
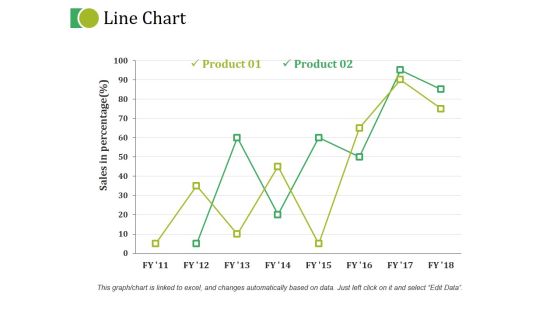
Line Chart Ppt PowerPoint Presentation Inspiration Good
This is a line chart ppt powerpoint presentation inspiration good. This is a two stage process. The stages in this process are line, finance, marketing, strategy, planning.

Line Chart Ppt PowerPoint Presentation Show Pictures
This is a line chart ppt powerpoint presentation show pictures. This is a two stage process. The stages in this process are business, marketing, line, finance, planning.
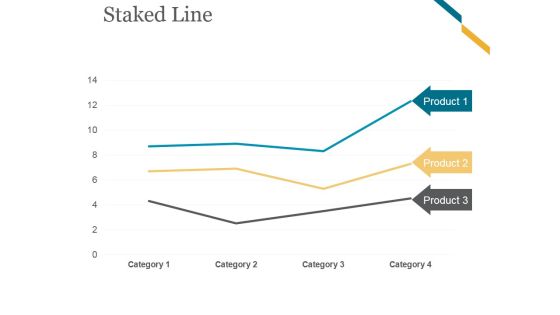
Staked Line Ppt PowerPoint Presentation Designs Download
This is a staked line ppt powerpoint presentation designs download. This is a three stage process. The stages in this process are business, marketing, line chart, analysis, product.
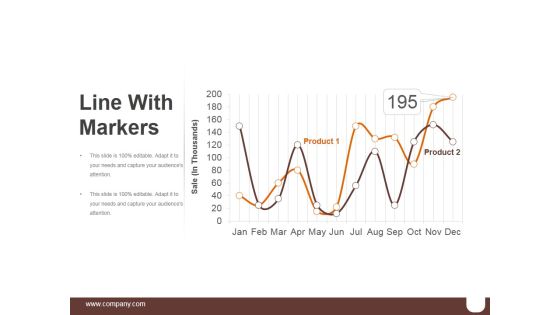
Line With Markers Ppt PowerPoint Presentation Microsoft
This is a line with markers ppt powerpoint presentation microsoft. This is a two stage process. The stages in this process are business, marketing, line chart, finance, management.
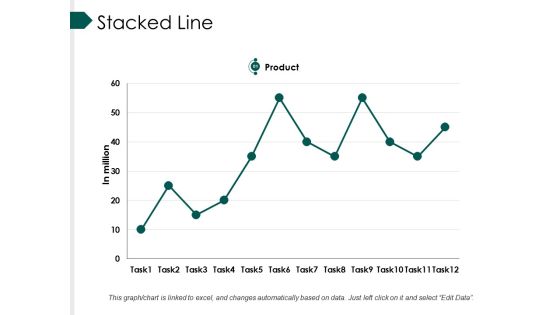
Stacked Line Ppt PowerPoint Presentation Summary Inspiration
This is a stacked line ppt powerpoint presentation summary inspiration. This is a twelve stage process. The stages in this process are line chart, marketing, strategy, planning, finance.

Stacked Line Ppt PowerPoint Presentation Outline
This is a stacked line ppt powerpoint presentation outline. This is a three stage process. The stages in this process are projects, marketing, stacked line, finance, product.

Stacked Line Ppt PowerPoint Presentation Infographics
This is a stacked line ppt powerpoint presentation infographics. This is a two stage process. The stages in this process are business, marketing, growth, success, line.

Stacked Line Ppt PowerPoint Presentation File Objects
This is a stacked line ppt powerpoint presentation file objects. This is a three stage process. The stages in this process are stacked line, finance, marketing, strategy, business.
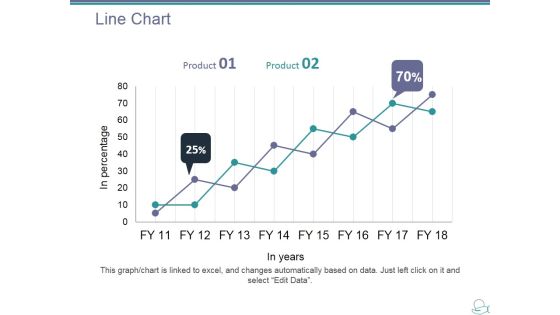
Line Chart Ppt PowerPoint Presentation Layouts Show
This is a line chart ppt powerpoint presentation layouts show. This is a two stage process. The stages in this process are product, in years, in percentage, line chart, growth.

Line Chart Ppt PowerPoint Presentation Professional Grid
This is a line chart ppt powerpoint presentation professional grid. This is a two stage process. The stages in this process are sales in percentage, financial years, product, line chart.
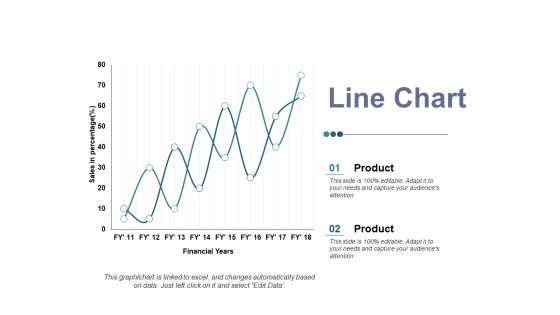
Line Chart Ppt PowerPoint Presentation Ideas Elements
This is a line chart ppt powerpoint presentation ideas elements. This is a two stage process. The stages in this process are product, sales in percentage, financial year, business, line chart.
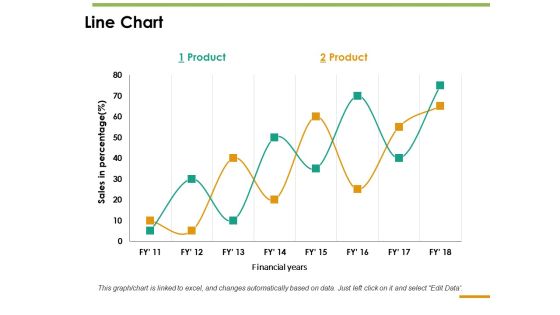
Line Chart Ppt PowerPoint Presentation Inspiration Guide
This is a line chart ppt powerpoint presentation inspiration guide. This is a two stage process. The stages in this process are line chart, sales in percentage, product, financial years.
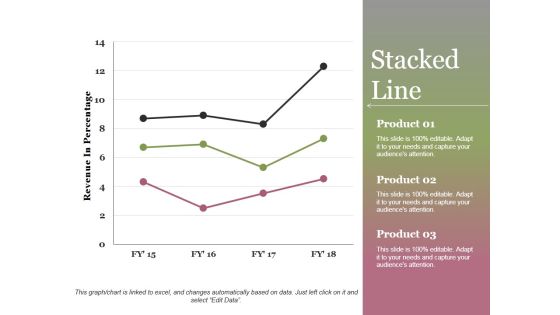
Stacked Line Ppt PowerPoint Presentation Show
This is a stacked line ppt powerpoint presentation show. This is a three stage process. The stages in this process are revenue in percentage, product, stacked line, growth, success.
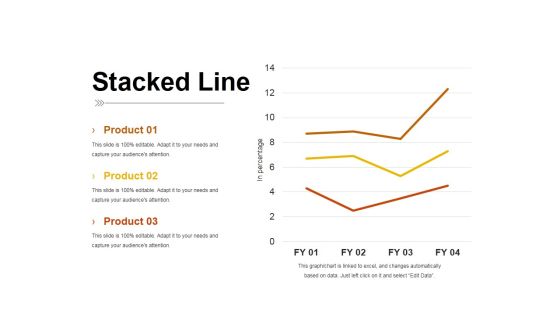
Stacked Line Ppt PowerPoint Presentation Inspiration Pictures
This is a stacked line ppt powerpoint presentation inspiration pictures. This is a three stage process. The stages in this process are product, stacked line, in percentage, business, growth.
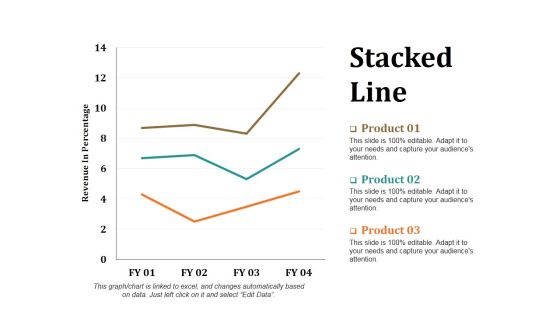
Stacked Line Ppt PowerPoint Presentation Layouts Portrait
This is a stacked line ppt powerpoint presentation layouts portrait. This is a three stage process. The stages in this process are revenue in percentage, stacked line, product, growth, success.
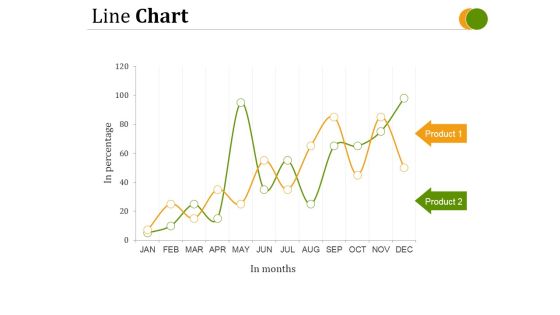
Line Chart Ppt PowerPoint Presentation Microsoft
This is a line chart ppt powerpoint presentation microsoft. This is a two stage process. The stages in this process are line chart, business, marketing, success, management.

Line Chart Ppt PowerPoint Presentation Ideas Portfolio
This is a line chart ppt powerpoint presentation ideas portfolio. This is a two stage process. The stages in this process are line chart, in years, in percentage.

Line Chart Ppt PowerPoint Presentation File Slide
This is a line chart ppt powerpoint presentation file slide. This is a one stage process. The stages in this process are line chart, business, growth, marketing, management.
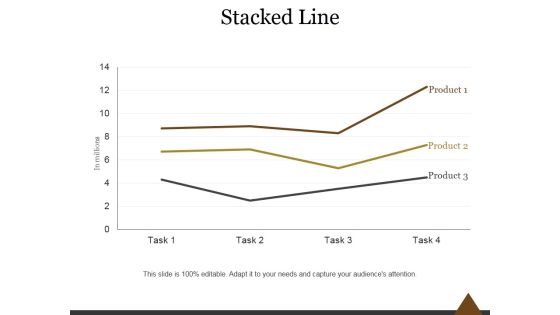
Stacked Line Ppt PowerPoint Presentation Graphics
This is a stacked line ppt powerpoint presentation graphics. This is a three stage process. The stages in this process are business, marketing, stacked, line, success.
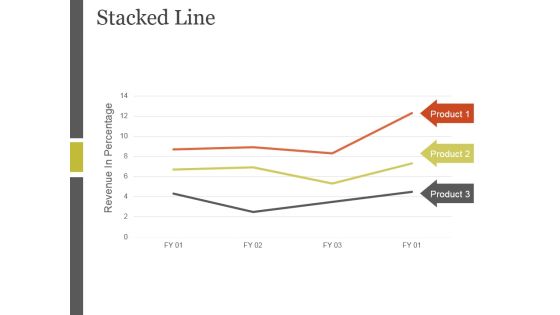
Stacked Line Ppt PowerPoint Presentation Inspiration
This is a stacked line ppt powerpoint presentation inspiration. This is a three stage process. The stages in this process are revenue in percentage, stacked line, product.
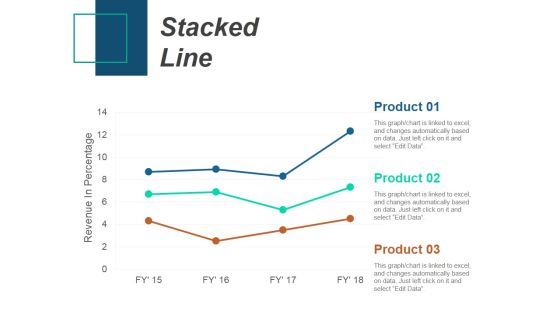
Stacked Line Ppt PowerPoint Presentation Infographics Slideshow
This is a stacked line ppt powerpoint presentation infographics slideshow. This is a three stage process. The stages in this process are stacked line, revenue in percentage, product.

Clustered Column Line Ppt PowerPoint Presentation Samples
This is a clustered column line ppt powerpoint presentation samples. This is a four stage process. The stages in this process are finance, percentage, success, growth, bar graph.
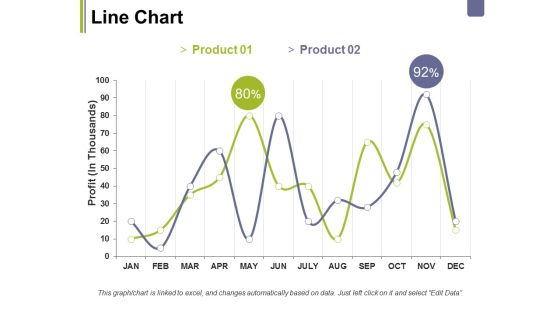
Line Chart Ppt PowerPoint Presentation Layouts Topics
This is a line chart ppt powerpoint presentation layouts topics. This is a two stage process. The stages in this process are business, profit, chart, percentage, graph, marketing.

Line Chart Ppt PowerPoint Presentation Summary Rules
This is a line chart ppt powerpoint presentation summary rules. This is a two stage process. The stages in this process are profit, business, marketing, graph, finance.
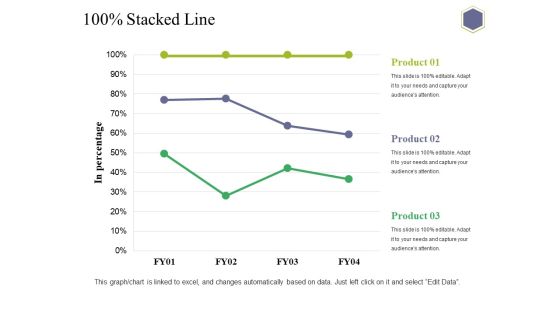
Stacked Line Ppt PowerPoint Presentation Professional Introduction
This is a stacked line ppt powerpoint presentation professional introduction. This is a three stage process. The stages in this process are in percentage, business, marketing, strategy, graph.
Scatter Line Ppt PowerPoint Presentation Icon Ideas
This is a scatter line ppt powerpoint presentation icon ideas. This is a nine stage process. The stages in this process are business, marketing, strategy, planning, finance.
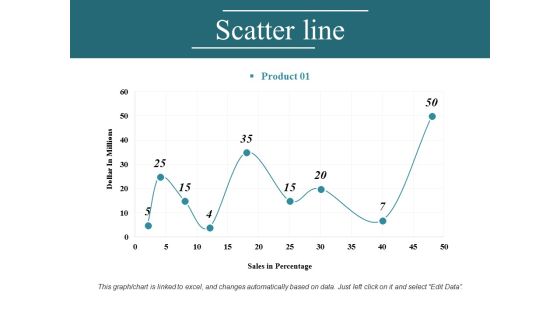
Scatter Line Ppt PowerPoint Presentation File Gallery
This is a scatter line ppt powerpoint presentation file gallery. This is a nine stage process. The stages in this process are business, marketing, strategy, finance, planning.

Line Chart Ppt PowerPoint Presentation Styles Introduction
This is a line chart ppt powerpoint presentation styles introduction. This is a two stage process. The stages in this process are in percentage, product, chart, business, marketing.
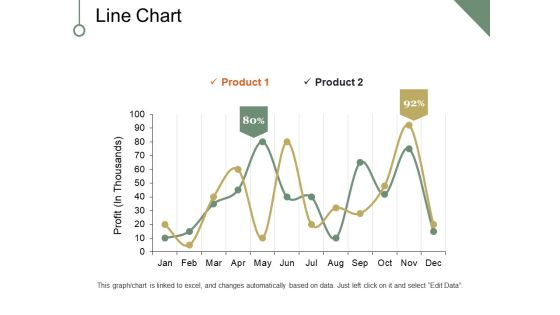
Line Chart Ppt PowerPoint Presentation Pictures Portfolio
This is a line chart ppt powerpoint presentation pictures portfolio. This is a two stage process. The stages in this process are profit, business, marketing, finance, chart.

Line Chart Ppt PowerPoint Presentation Portfolio Deck
This is a line chart ppt powerpoint presentation portfolio deck. This is a two stage process. The stages in this process are business, marketing, profit, chart, percentage.
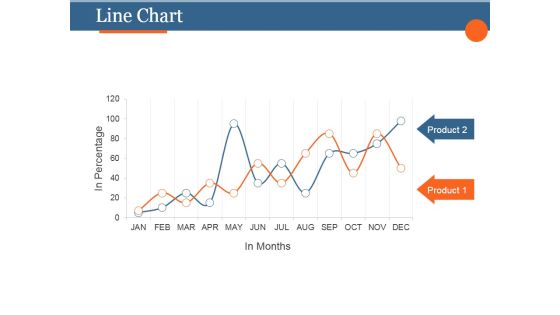
Line Chart Ppt PowerPoint Presentation Background Image
This is a line chart ppt powerpoint presentation background image. This is a two stage process. The stages in this process are product, planning, strategy, marketing, management.

Line Chart Ppt PowerPoint Presentation Ideas
This is a line chart ppt powerpoint presentation ideas. This is a two stage process. The stages in this process are marketing, in percentage, sun, mon, tue, wed.

Line Chart Ppt PowerPoint Presentation Show
This is a line chart ppt powerpoint presentation show. This is a seven stage process. The stages in this process are sun, mon, tue, wed.
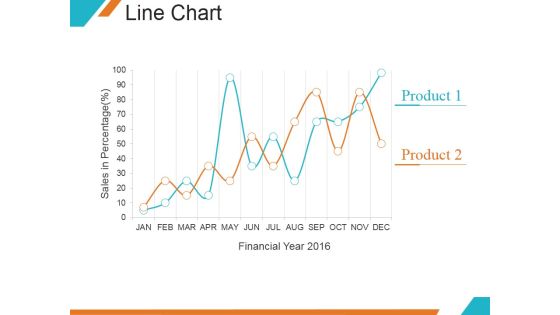
Line Chart Ppt PowerPoint Presentation Samples
This is a line chart ppt powerpoint presentation samples. This is a two stage process. The stages in this process are financial year, product, growth, marketing.
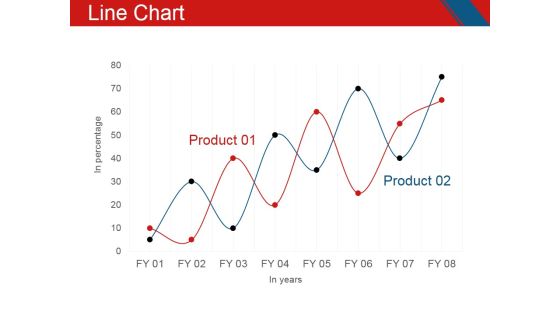
Line Chart Ppt PowerPoint Presentation File Layout
This is a line chart ppt powerpoint presentation file layout. This is a two stage process. The stages in this process are business, management, growth, product, marketing.
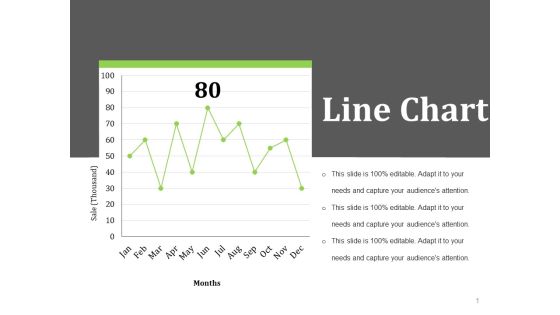
Line Chart Ppt PowerPoint Presentation Slides Template
This is a line chart ppt powerpoint presentation slides template. This is a one stage process. The stages in this process are months, sale thousand, business, marketing, finance.

Line Chart Ppt PowerPoint Presentation Gallery Slide
This is a line chart ppt powerpoint presentation gallery slide. This is a two stage process. The stages in this process are in millions, business, marketing, growth, strategy.
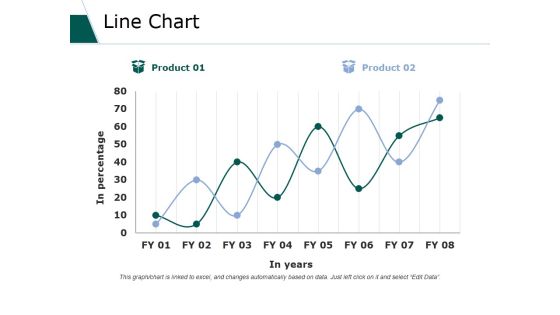
Line Chart Ppt PowerPoint Presentation Gallery Information
This is a line chart ppt powerpoint presentation gallery information. This is a two stage process. The stages in this process are business, marketing, strategy, planning, finance.
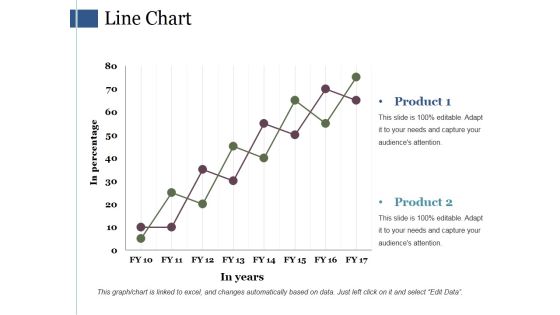
Line Chart Ppt PowerPoint Presentation Guide
This is a line chart ppt powerpoint presentation guide. This is a two stage process. The stages in this process are business, marketing, finance, strategy, planning.
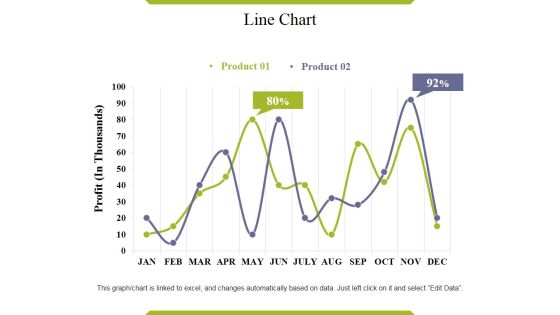
Line Chart Ppt PowerPoint Presentation File Maker
This is a line chart ppt powerpoint presentation file maker. This is a two stage process. The stages in this process are business, marketing, strategy, finance, planning.

Line Chart Ppt PowerPoint Presentation Model Sample
This is a line chart ppt powerpoint presentation model sample. This is a two stage process. The stages in this process are business, marketing, planning, finance, growth.

Line Chart Ppt PowerPoint Presentation Inspiration Smartart
This is a line chart ppt powerpoint presentation inspiration smartart. This is a two stage process. The stages in this process are business, marketing, strategy, planning, finance.
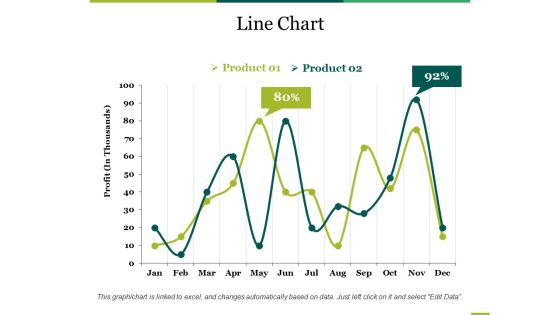
Line Chart Ppt PowerPoint Presentation Show Maker
This is a line chart ppt powerpoint presentation show maker. This is a two stage process. The stages in this process are business, marketing, strategy, finance, planning.

Line Chart Ppt PowerPoint Presentation Slides Inspiration
This is a line chart ppt powerpoint presentation slides inspiration. This is a two stage process. The stages in this process are business, marketing, strategy, planning, finance.
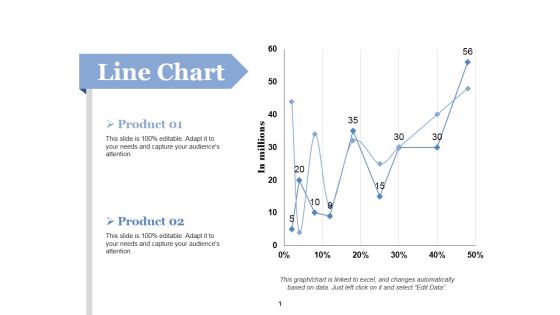
Line Chart Ppt PowerPoint Presentation Layouts Portfolio
This is a line chart ppt powerpoint presentation layouts portfolio. This is a two stage process. The stages in this process are marketing, in millions, growth, strategy, business.
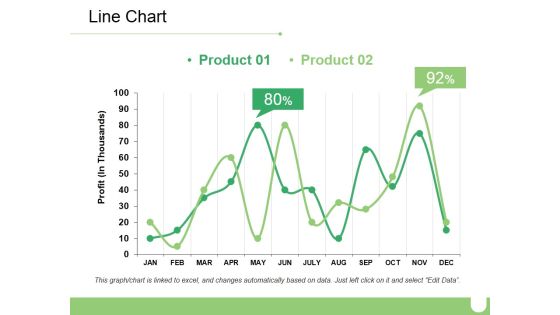
Line Chart Ppt PowerPoint Presentation Ideas Diagrams
This is a line chart ppt powerpoint presentation ideas diagrams. This is a two stage process. The stages in this process are business, marketing, percentage, financial, profit.

Line Chart Ppt PowerPoint Presentation Summary Topics
This is a line chart ppt powerpoint presentation summary topics. This is a three stage process. The stages in this process are business, marketing, strategy, planning, finance.

Line Chart Ppt PowerPoint Presentation Model Summary
This is a line chart ppt powerpoint presentation model summary. This is a two stage process. The stages in this process are business, marketing, strategy, planning, finance.

Line Chart Ppt PowerPoint Presentation Styles Backgrounds
This is a line chart ppt powerpoint presentation styles backgrounds. This is a three stage process. The stages in this process are business, marketing, strategy, planning, finance.
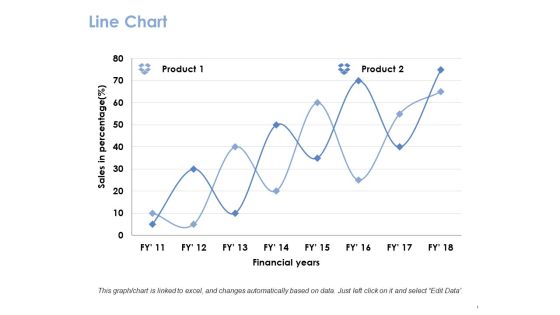
Line Chart Ppt PowerPoint Presentation Gallery Guide
This is a line chart ppt powerpoint presentation gallery guide. This is a two stage process. The stages in this process are product, financial years, sales in percentage.
Line Chart Ppt PowerPoint Presentation Icon Inspiration
This is a line chart ppt powerpoint presentation icon inspiration. This is a two stage process. The stages in this process are product, financial years, sales in percentage.

Line Chart Ppt PowerPoint Presentation File Sample
This is a line chart ppt powerpoint presentation file sample. This is a two stage process. The stages in this process are finance, marketing, management, investment, analysis.
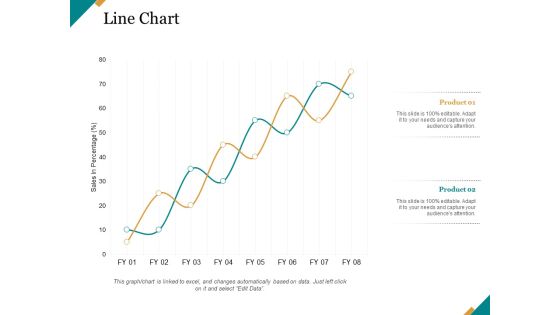
Line Chart Ppt PowerPoint Presentation Pictures Graphics
This is a line chart ppt powerpoint presentation pictures graphics. This is a two stage process. The stages in this process are finance, marketing, management, investment, analysis.

Stacked Line Ppt PowerPoint Presentation Portfolio Deck
This is a stacked line ppt powerpoint presentation portfolio deck. This is a three stage process. The stages in this process are in percentage, product, business, marketing, finance.

Stacked Line Ppt PowerPoint Presentation Summary Themes
This is a stacked line ppt powerpoint presentation summary themes. This is a three stage process. The stages in this process are business, marketing, strategy, management, finance.
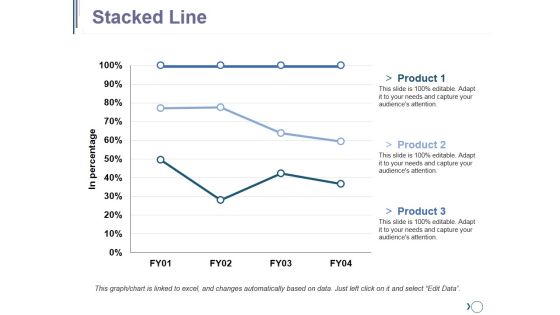
Stacked Line Ppt PowerPoint Presentation Portfolio Samples
This is a stacked line ppt powerpoint presentation portfolio samples. This is a three stage process. The stages in this process are finance, planning, business, marketing, strategy.
 Home
Home