Line Graph

Annual Run Rate Ppt PowerPoint Presentation Designs Download
This is a annual run rate ppt powerpoint presentation designs download. This is a four stage process. The stages in this process are business, marketing, success, business plan, bar graph.
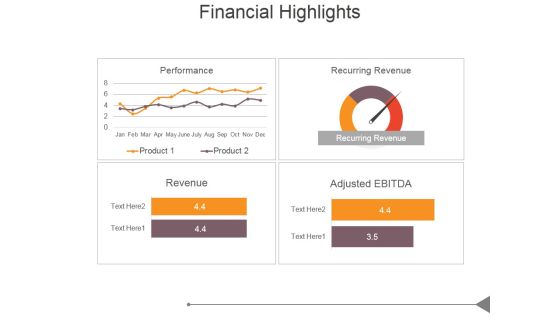
Financial Highlights Template 1 Ppt PowerPoint Presentation Model
This is a financial highlights template 1 ppt powerpoint presentation model. This is a four stage process. The stages in this process are business, marketing, success, business plan, bar graph.
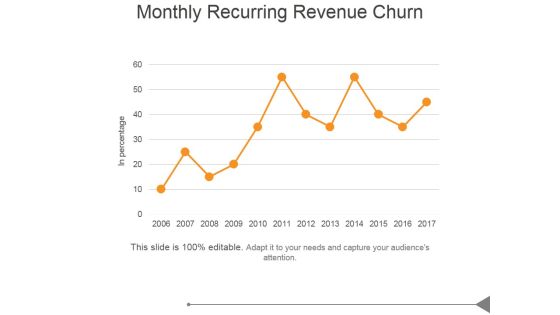
Monthly Recurring Revenue Churn Ppt PowerPoint Presentation Images
This is a monthly recurring revenue churn ppt powerpoint presentation images. This is a five stage process. The stages in this process are business, marketing, success, bar graph, growth.
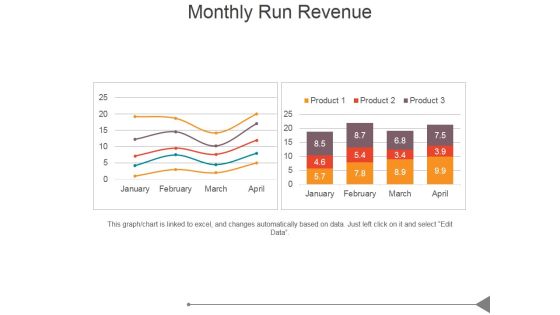
Monthly Run Revenue Ppt PowerPoint Presentation Design Ideas
This is a monthly run revenue ppt powerpoint presentation design ideas. This is a two stage process. The stages in this process are business, marketing, success, bar graph, growth.

Real Estate Home Price Index Ppt PowerPoint Presentation Example
This is a real estate home price index ppt powerpoint presentation example. This is a one stage process. The stages in this process are bar graph, business, marketing, success, management.

Real Estate Home Sales Ppt PowerPoint Presentation Pictures
This is a real estate home sales ppt powerpoint presentation pictures. This is a one stage process. The stages in this process are bar graph, business, marketing, success, management.

Real Estate Home Price Index Ppt PowerPoint Presentation Samples
This is a real estate home price index ppt powerpoint presentation samples. This is a one stage process. The stages in this process are in percentage, business, bar graph, marketing, success, management.

Comparison Of Prices Ppt PowerPoint Presentation Designs Download
This is a comparison of prices ppt powerpoint presentation designs download. This is a two stage process. The stages in this process are comparison of prices, marketing, in percentage, bar graph, business.
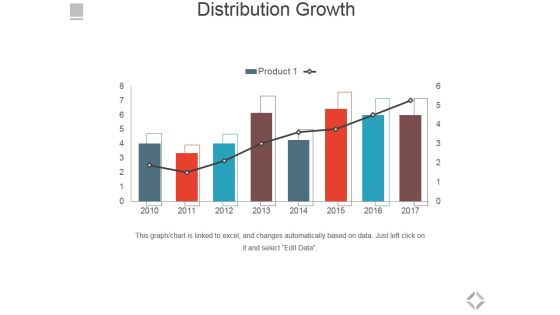
Distribution Growth Ppt PowerPoint Presentation Slides Clipart
This is a distribution growth ppt powerpoint presentation slides clipart. This is a eight stage process. The stages in this process are distribution growth, bar graph, business, marketing, success.

Midstream Organic Growth Ppt PowerPoint Presentation Ideas Graphics Tutorials
This is a midstream organic growth ppt powerpoint presentation ideas graphics tutorials. This is a three stage process. The stages in this process are business, marketing, bar graph, management, financials.
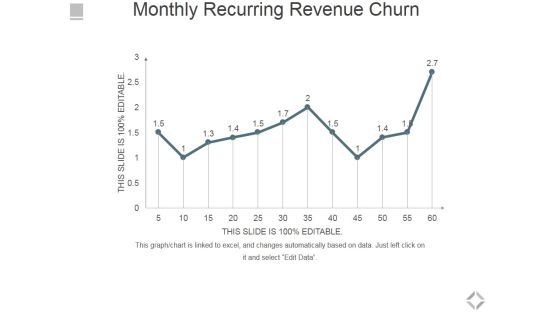
Monthly Recurring Revenue Churn Ppt PowerPoint Presentation Infographics Microsoft
This is a monthly recurring revenue churn ppt powerpoint presentation infographics microsoft. This is a one stage process. The stages in this process are bar graph, business, marketing, success, growth.
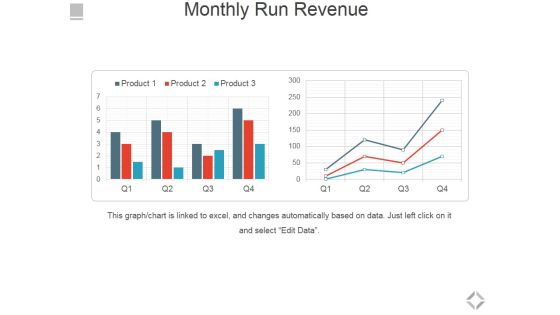
Monthly Run Revenue Ppt PowerPoint Presentation Show Styles
This is a monthly run revenue ppt powerpoint presentation show styles. This is a two stage process. The stages in this process are bar graph, business, marketing, success, growth.
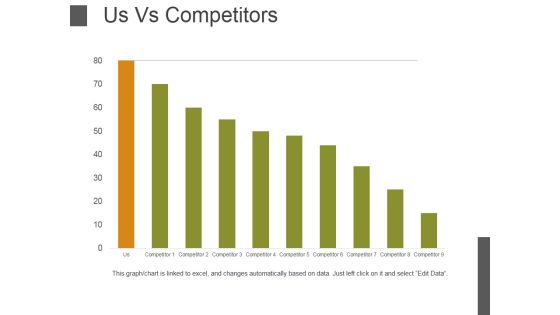
Us Vs Competitors Template 1 Ppt PowerPoint Presentation Model File Formats
This is a us vs competitors template 1 ppt powerpoint presentation model file formats. This is a nine stage process. The stages in this process are bar graph, business, marketing, management, success.

Gap Between Current And Required Staff Ppt PowerPoint Presentation File Tips
This is a gap between current and required staff ppt powerpoint presentation file tips. This is a five stage process. The stages in this process are number of staff, bar graph, business, marketing, success.
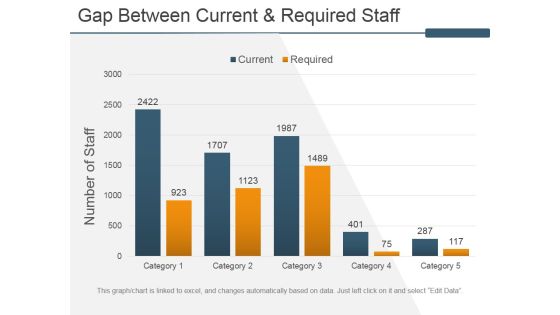
Gap Between Current And Required Staff Ppt PowerPoint Presentation Inspiration Slides
This is a gap between current and required staff ppt powerpoint presentation inspiration slides. This is a five stage process. The stages in this process are number of staff, bar graph, business, marketing, success.

Competitive Analysis Template 1 Ppt PowerPoint Presentation Icon Show
This is a competitive analysis template 1 ppt powerpoint presentation icon show. This is a six stage process. The stages in this process are competitive, analysis, business, marketing, bar graph.

Telemarketing Report Template 2 Ppt PowerPoint Presentation Styles Model
This is a telemarketing report template 2 ppt powerpoint presentation styles model. This is a six stage process. The stages in this process are use of telemarketing within a lead generation strategy, business, bar graph, marketing, success.
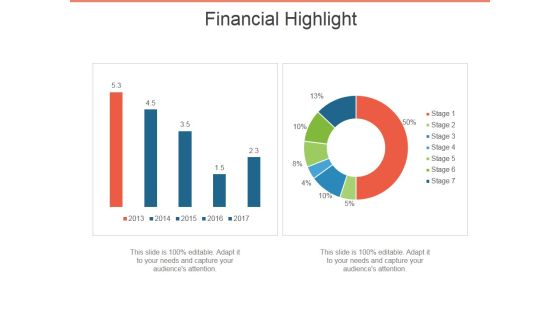
Financial Highlight Template 1 Ppt PowerPoint Presentation Ideas Themes
This is a financial highlight template 1 ppt powerpoint presentation ideas themes. This is a two stage process. The stages in this process are financial, highlight, business, bar graph, marketing.
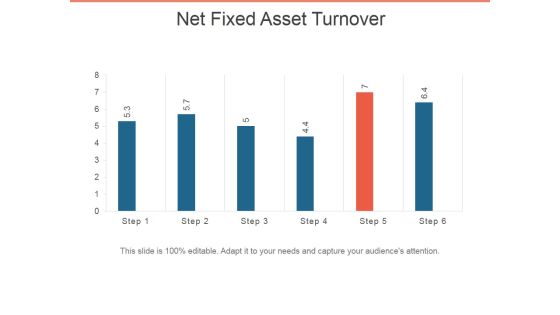
Net Fixed Asset Turnover Ppt PowerPoint Presentation Infographic Template Pictures
This is a net fixed asset turnover ppt powerpoint presentation infographic template pictures. This is a six stage process. The stages in this process are bar graph, business, marketing, presentation, success.

Profit After Tax Pat Ppt PowerPoint Presentation Inspiration Slide
This is a profit after tax pat ppt powerpoint presentation inspiration slide. This is a five stage process. The stages in this process are bar graph, business, marketing, growth, management.

World Sector Growth Ppt PowerPoint Presentation Infographics Objects
This is a world sector growth ppt powerpoint presentation infographics objects. This is a four stage process. The stages in this process are bar graph, business, marketing, success, presentation.
Distribution Growth Ppt PowerPoint Presentation Slides Icons
This is a distribution growth ppt powerpoint presentation slides icons. This is a six stage process. The stages in this process are business, bar graph, finance, marketing, strategy, growth.
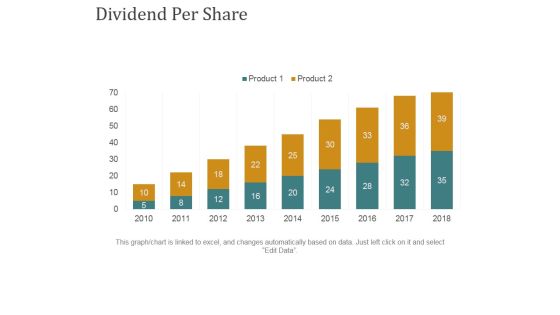
Dividend Per Share Ppt PowerPoint Presentation Summary Rules
This is a dividend per share ppt powerpoint presentation summary rules. This is a nine stage process. The stages in this process are business, bar graph, finance, marketing, strategy, growth.

Competency Rating Template 1 Ppt PowerPoint Presentation Outline Smartart
This is a competency rating template 1 ppt powerpoint presentation outline smartart. This is a eight stage process. The stages in this process are job related competencies, competency rating, bar graph, business, marketing.

Employee Turnover Rate Formula Ppt PowerPoint Presentation Pictures Aids
This is a employee turnover rate formula ppt powerpoint presentation pictures aids. This is a five stage process. The stages in this process are employee turnover, rate of tune over, business, marketing, bar graph.
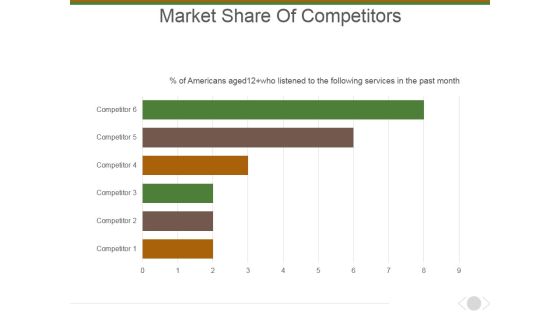
Market Share Of Competitors Ppt PowerPoint Presentation Layouts Picture
This is a market share of competitors ppt powerpoint presentation layouts picture. This is a six stage process. The stages in this process are marketing, business, management, bar graph, presentation.
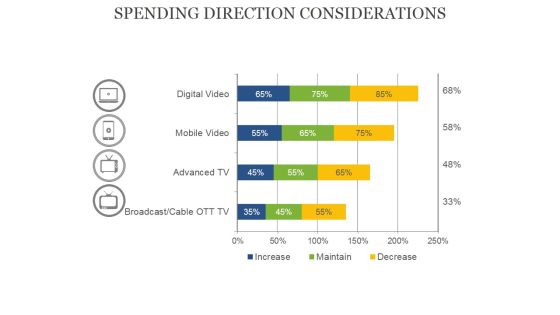
Spending Direction Considerations Ppt PowerPoint Presentation Portfolio Graphics Template
This is a spending direction considerations ppt powerpoint presentation portfolio graphics template. This is a four stage process. The stages in this process are bar graph, business, presentation, percentage, finance.

Quarter Track Record Ppt PowerPoint Presentation File Clipart Images
This is a quarter track record ppt powerpoint presentation file clipart images. This is a two stage process. The stages in this process are bar graph, growth, success, business, marketing.
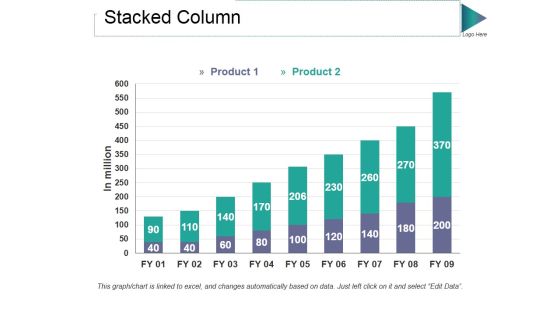
Stacked Column Ppt PowerPoint Presentation Styles Graphic Tips
This is a stacked column ppt powerpoint presentation styles graphic tips. This is a two stage process. The stages in this process are product, in million, bar graph, growth, success.

Clustered Column Ppt PowerPoint Presentation Pictures Graphics Template
This is a clustered column ppt powerpoint presentation pictures graphics template. This is a two stage process. The stages in this process are product, growth, success, business, bar graph.
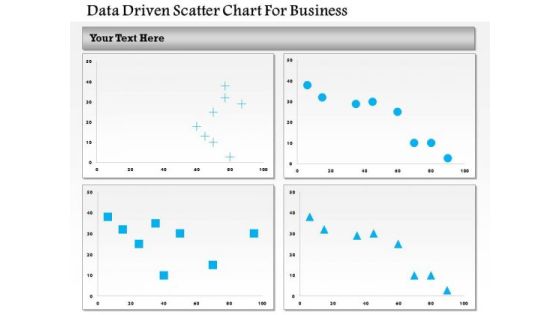
Business Diagram Data Driven Scatter Chart For Business PowerPoint Slide
This business diagram has been designed with four comparative charts. This slide suitable for data representation. You can also use this slide to present business analysis and reports. Use this diagram to present your views in a wonderful manner.
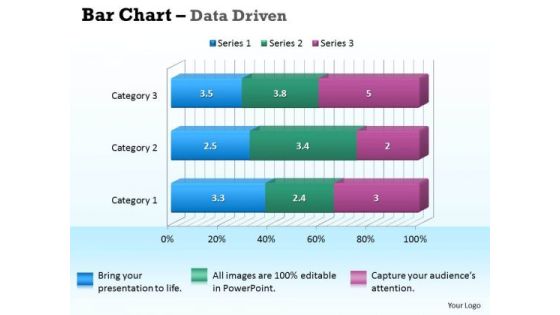
Data Analysis In Excel 3d Bar Chart For Business Information PowerPoint Templates
Our data analysis in excel 3d bar chart for business information Powerpoint Templates Deliver At Your Doorstep. Let Them In For A Wonderful Experience.
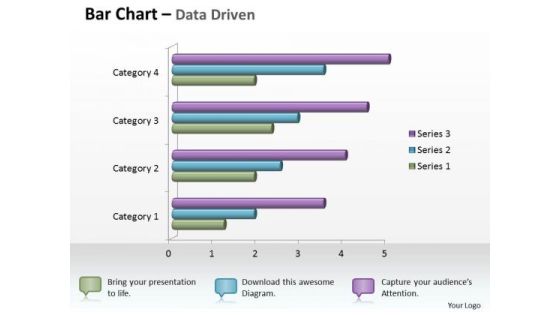
Data Analysis In Excel 3d Bar Chart For Business Statistics PowerPoint Templates
Knock On The Door To Success With Our data analysis in excel 3d bar chart for business statistics Powerpoint Templates . Be Assured Of Gaining Entry.

Data Analysis In Excel 3d Bar Chart For Comparison Of Time Series PowerPoint Templates
Double Your Chances With Our data analysis in excel 3d bar chart for comparison of time series Powerpoint Templates . The Value Of Your Thoughts Will Increase Two-Fold.
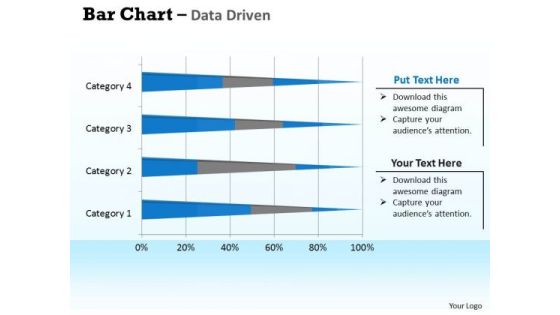
Data Analysis In Excel 3d Bar Chart For Interpretation PowerPoint Templates
Double Up Our data analysis in excel 3d bar chart for interpretation Powerpoint Templates With Your Thoughts. They Will Make An Awesome Pair.

Data Analysis Programs 3d Bar Chart For Market Surveys PowerPoint Templates
Draw On The Experience Of Our data analysis programs 3d bar chart for market surveys Powerpoint Templates . They Imbibe From Past Masters.
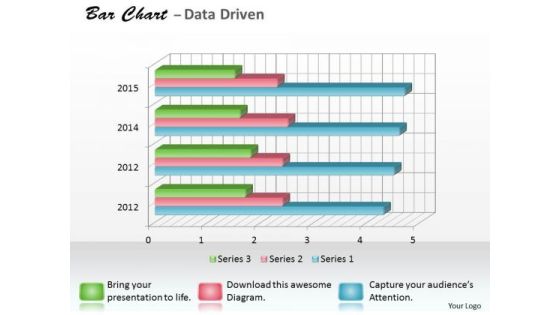
Data Analysis Programs 3d Bar Chart For Research In Statistics PowerPoint Templates
Draw It Out On Our data analysis programs 3d bar chart for research in statistics Powerpoint Templates . Provide Inspiration To Your Colleagues.
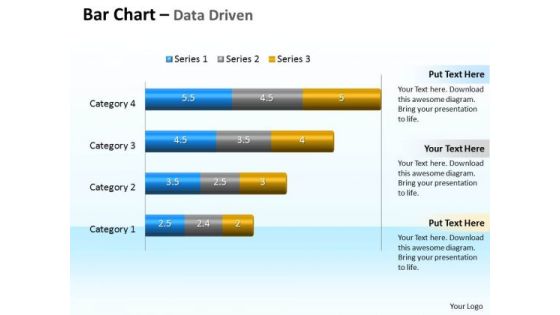
Data Analysis Programs 3d Bar Chart To Compare Categories PowerPoint Templates
Discover Decisive Moments With Our data analysis programs 3d bar chart to compare categories Powerpoint Templates . They Help Make That Crucial Difference.
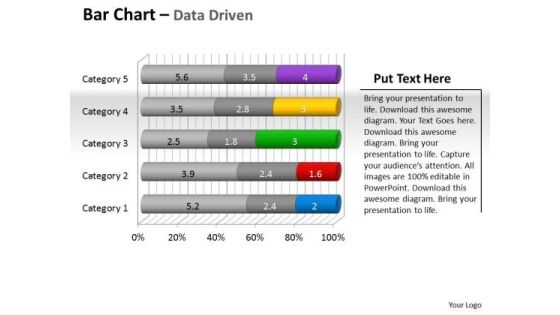
Data Analysis Programs 3d Bar Chart To Put Information PowerPoint Templates
Draw Up Your Agenda On Our data analysis programs 3d bar chart to put information Powerpoint Templates . Coax Your Audience Into Acceptance.
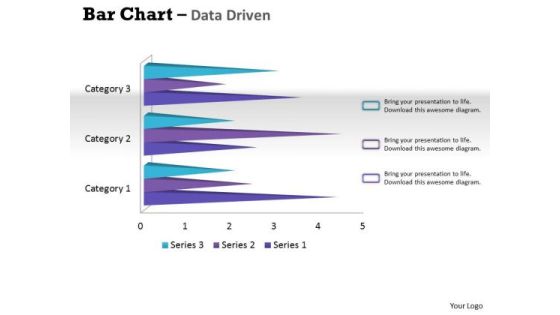
Data Analysis Techniques 3d Bar Chart For Financial Solutions PowerPoint Templates
Make Your Dreams A Reality With Our data analysis techniques 3d bar chart for financial solutions Powerpoint Templates . Your Ideas Will Begin To Take Shape.
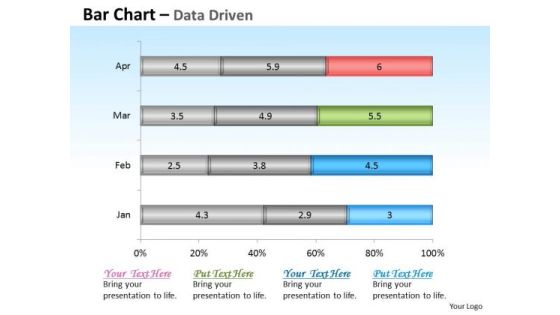
Financial Data Analysis Driven Base Bar Chart Design PowerPoint Slides Templates
Get The Domestics Right With Our financial data analysis driven base bar chart design powerpoint slides Templates . Create The Base For Thoughts To Grow.
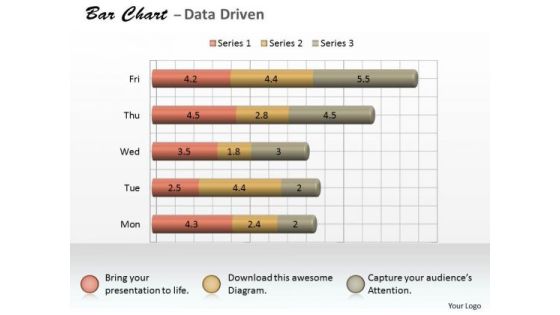
Microsoft Excel Data Analysis 3d Bar Chart As Research Tool PowerPoint Templates
Knock On The Door To Success With Our microsoft excel data analysis 3d bar chart as research tool Powerpoint Templates . Be Assured Of Gaining Entry.
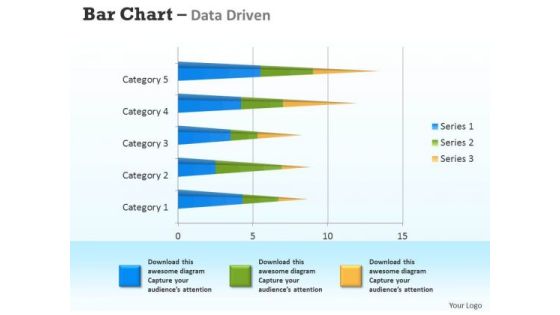
Microsoft Excel Data Analysis 3d Bar Chart For Analyzing Survey PowerPoint Templates
Connect The Dots With Our microsoft excel data analysis 3d bar chart for analyzing survey Powerpoint Templates . Watch The Whole Picture Clearly Emerge.
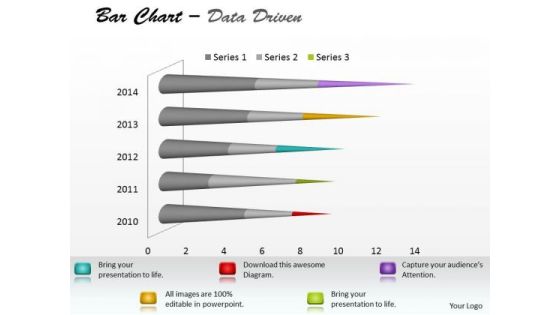
Microsoft Excel Data Analysis Bar Chart To Communicate Information PowerPoint Templates
With Our microsoft excel data analysis bar chart to communicate information Powerpoint Templates You Will Be Doubly Sure. They Possess That Stamp Of Authority.

Microsoft Excel Data Analysis Bar Chart To Compare Quantities PowerPoint Templates
Our microsoft excel data analysis bar chart to compare quantities Powerpoint Templates Leave No One In Doubt. Provide A Certainty To Your Views.
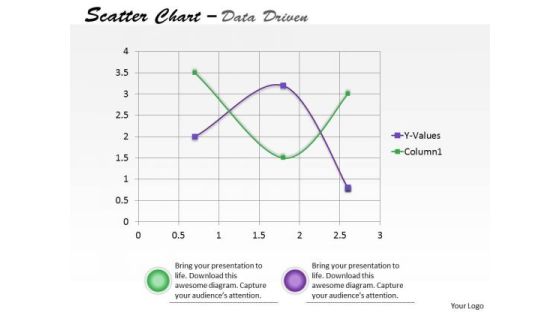
Data Analysis On Excel Driven Scatter Chart To Predict Future Movements PowerPoint Slides Templates
Our data analysis on excel driven scatter chart to predict future movements powerpoint slides Templates Enjoy Drama. They Provide Entertaining Backdrops.
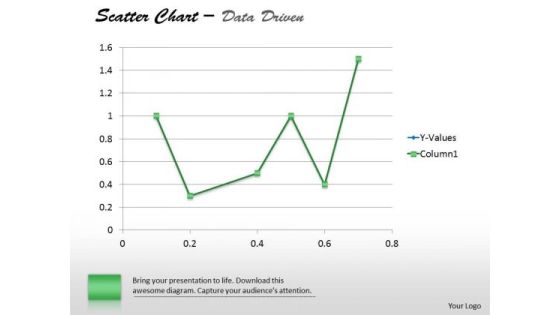
Financial Data Analysis Driven Demonstrate Statistics With Scatter Chart PowerPoint Slides Templates
Establish The Dominance Of Your Ideas. Our financial data analysis driven demonstrate statistics with scatter chart powerpoint slides Templates Will Put Them On Top.
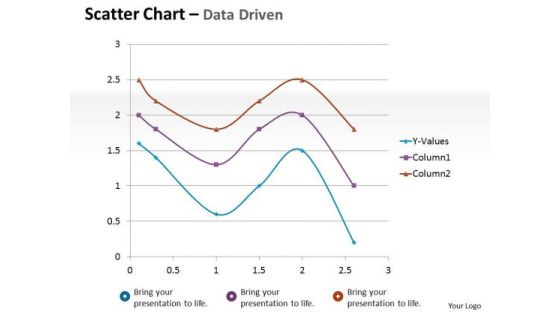
Financial Data Analysis Driven Scatter Chart Mathematical Diagram PowerPoint Slides Templates
Dominate Proceedings With Your Ideas. Our financial data analysis driven scatter chart mathematical diagram powerpoint slides Templates Will Empower Your Thoughts.
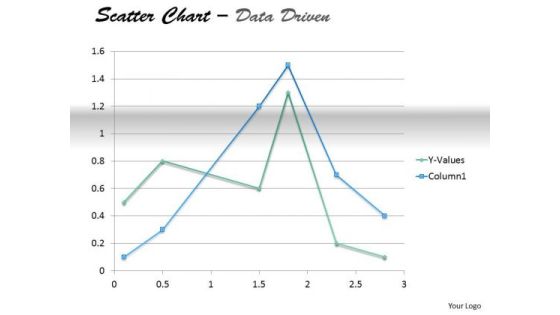
Examples Of Data Analysis Market Driven Present In Scatter Chart PowerPoint Slides Templates
Your Thoughts Will Take To Our examples of data analysis market driven present in scatter chart powerpoint slides Templates Like A Duck To Water. They Develop A Binding Affinity.

Area Chart Ppt PowerPoint Presentation Diagrams
This is a area chart ppt powerpoint presentation diagrams.This is a two stage process. The stages in this process are in percentage, area chart, product.

Area Chart Ppt PowerPoint Presentation File Microsoft
This is a area chart ppt powerpoint presentation file microsoft. This is a two stage process. The stages in this process are business, strategy, marketing, planning, area chart.

Area Chart Ppt PowerPoint Presentation Icon Microsoft
This is a area chart ppt powerpoint presentation icon microsoft. This is a two stage process. The stages in this process are business, strategy, analysis, planning, area chart.

Area Chart Ppt PowerPoint Presentation Inspiration Images
This is a area chart ppt powerpoint presentation inspiration images. This is a two stage process. The stages in this process are area chart, product, sales in percentage.

Area Chart Ppt PowerPoint Presentation Inspiration Rules
This is a area chart ppt powerpoint presentation inspiration rules. This is a two stage process. The stages in this process are area chart, business, marketing, sales in percentage, product.

Area Chart Ppt PowerPoint Presentation Inspiration Themes
This is a area chart ppt powerpoint presentation inspiration themes. This is a two stage process. The stages in this process are sales in percentage, product, area chart, business, marketing.

Area Chart Ppt PowerPoint Presentation Professional
This is a area chart ppt powerpoint presentation professional. This is a one stage process. The stages in this process are product, in percentage, jan, feb, mar, apr.

Area Chart Ppt PowerPoint Presentation Samples
This is a area chart ppt powerpoint presentation samples. This is a two stage process. The stages in this process are financial year, sales in percentage, jan, feb.

Area Chart Ppt PowerPoint Presentation Slides Deck
This is a area chart ppt powerpoint presentation slides deck. This is a two stage process. The stages in this process are financial, sales in percentage, business, marketing, management.

Combo Chart Ppt PowerPoint Presentation Icon Format Ideas
This is a combo chart ppt powerpoint presentation icon format ideas. This is a three stage process. The stages in this process are bar, marketing, strategy, planning, growth.

Area Chart Ppt PowerPoint Presentation Slides Graphics Design
This is a area chart ppt powerpoint presentation slides graphics design. This is a two stage process. The stages in this process are area chart, in percentage, product.

Area Chart Ppt PowerPoint Presentation Show Slide Portrait
This is a area chart ppt powerpoint presentation show slide portrait. This is a two stage process. The stages in this process are business, strategy, marketing, analysis, area chart.

Area Chart Ppt PowerPoint Presentation Infographics Graphics Tutorials
This is a area chart ppt powerpoint presentation infographics graphics tutorials. This is a two stage process. The stages in this process are product, area chart, sales in percentage.

Area Chart Ppt PowerPoint Presentation Icon Layout Ideas
This is a area chart ppt powerpoint presentation icon layout ideas. This is a two stage process. The stages in this process are area chart, sales in percentage, years, planning, business.

Area Chart Ppt PowerPoint Presentation Inspiration Clipart Images
This is a area chart ppt powerpoint presentation inspiration clipart images. This is a two stage process. The stages in this process are area chart, growth, finance, business, strategy.

Area Chart Ppt PowerPoint Presentation Pictures Graphics Design
This is a area chart ppt powerpoint presentation pictures graphics design. This is a two stage process. The stages in this process are charts, success, finance, percentage, growth.
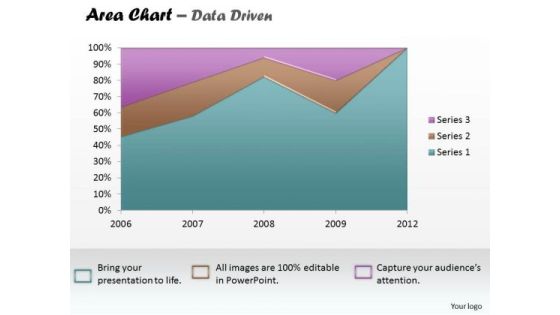
Data Analysis Excel Business Reporting Area Chart PowerPoint Templates
Establish The Dominance Of Your Ideas. Our data analysis excel business reporting area chart Powerpoint Templates Will Put Them On Top.

Data Analysis Template Driven Visualization Area Chart PowerPoint Slides Templates
Draw On The Energy Of Our data analysis template driven visualization area chart powerpoint slides Templates . Your Thoughts Will Perk Up.
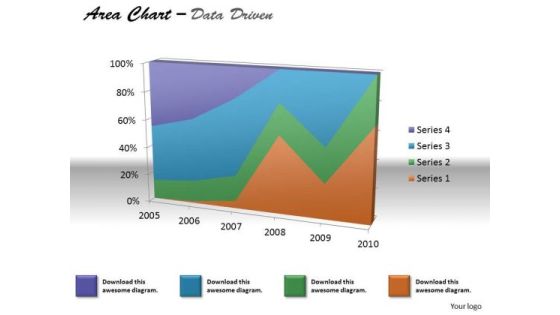
Financial Data Analysis Area Chart For Various Values PowerPoint Templates
Document The Process On Our financial data analysis area chart for various values Powerpoint Templates . Make A Record Of Every Detail.

Business Diagram Laptop With Data Driven Area Chart PowerPoint Slide
This diagram has been designed with laptop and data driven area chart. Download this diagram to give your presentations more effective look. It helps in clearly conveying your message to clients and audience.

Area Chart Financial Ppt PowerPoint Presentation Outline Professional
This is a area chart financial ppt powerpoint presentation outline professional. This is a four stage process. The stages in this process are product, sales in percentage, financial year.
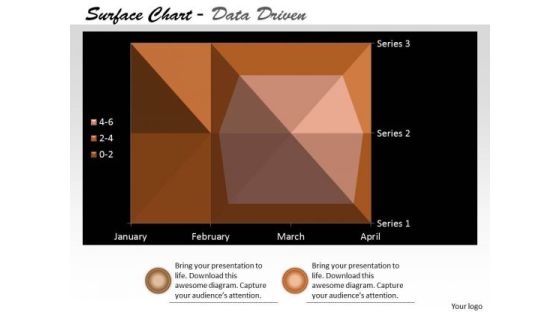
Multivariate Data Analysis Surface Chart Plots Trends PowerPoint Templates
Our multivariate data analysis surface chart plots trends Powerpoint Templates Heighten Concentration. Your Audience Will Be On The Edge.

Business Diagram Colored Column Chart For Result Analysis PowerPoint Slide
This Power Point diagram has been designed with graphic of column chart. It contains diagram of bar char depicting annual business progress report. Use this diagram to build professional presentations for your viewers.
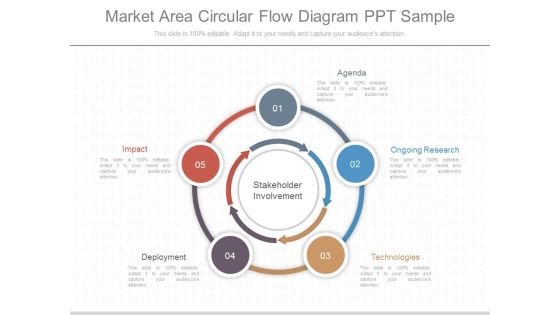
Market Area Circular Flow Diagram Ppt Sample
This is a market area circular flow diagram ppt sample. This is a five stage process. The stages in this process are agenda, ongoing research, technologies, deployment, impact.

Linear Flow Power Point PowerPoint Presentation Template
Put Them On The Same Page With Our Linear Flow Power Point PowerPoint Presentation Template Powerpoint Templates. Your Team Will Sing From The Same Sheet. Push The Envelope With Our Business Strategy Powerpoint Templates. Let Your Thoughts Rise Above The Norm.
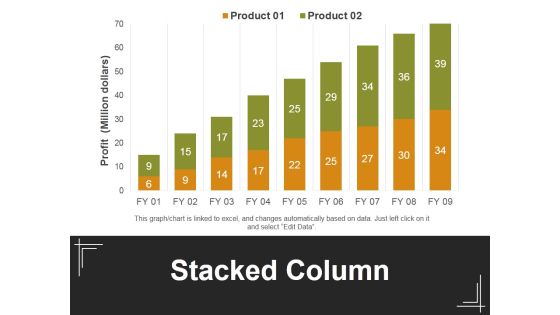
Stacked Column Ppt PowerPoint Presentation Outline Maker
This is a stacked column ppt powerpoint presentation outline maker. This is a two stage process. The stages in this process are profit, stacked bar, product, business, marketing.

Industry Snapshot Ppt PowerPoint Presentation Styles Microsoft
This is a industry snapshot ppt powerpoint presentation styles microsoft. This is a two stage process. The stages in this process are employment, revenue, bar, marketing, success.
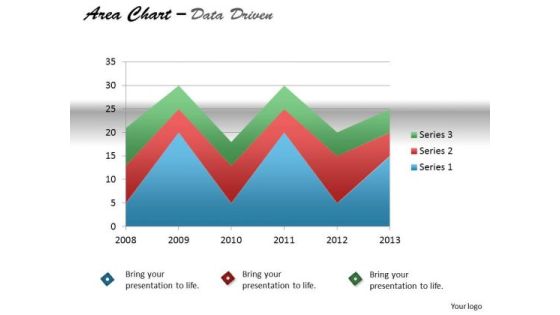
Quantitative Data Analysis Driven Display Series With Area Chart PowerPoint Slides Templates
Our quantitative data analysis driven display series with area chart powerpoint slides Templates Enjoy Drama. They Provide Entertaining Backdrops.
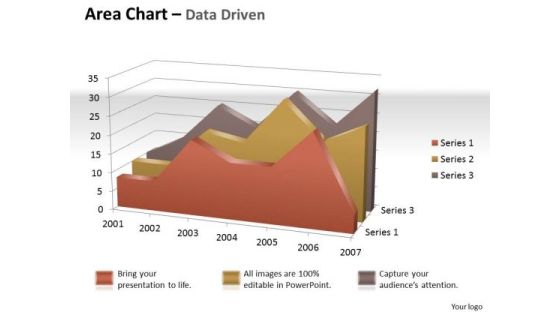
Data Analysis In Excel 3d Visual Display Of Area Chart PowerPoint Templates
Brace Yourself, Arm Your Thoughts. Prepare For The Hustle With Our data analysis in excel 3d visual display of area chart Powerpoint Templates .

Data Analysis In Excel Area Chart For Business Process PowerPoint Templates
Your Grasp Of Economics Is Well Known. Help Your Audience Comprehend Issues With Our data analysis in excel area chart for business process Powerpoint Templates .

Data Analysis On Excel Driven Stacked Area Chart PowerPoint Slides Templates
Be The Dramatist With Our data analysis on excel driven stacked area chart powerpoint slides Templates . Script Out The Play Of Words.
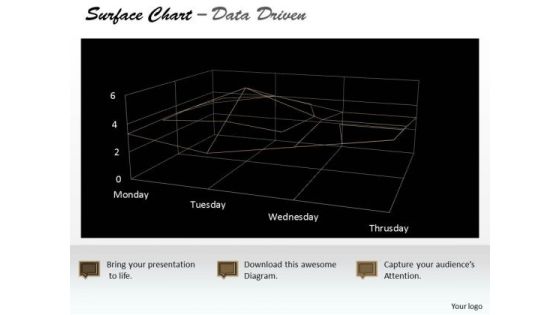
Data Analysis Template Driven Surface Chart Indicating Areas PowerPoint Slides Templates
Highlight Your Drive With Our data analysis template driven surface chart indicating areas powerpoint slides Templates . Prove The Fact That You Have Control.
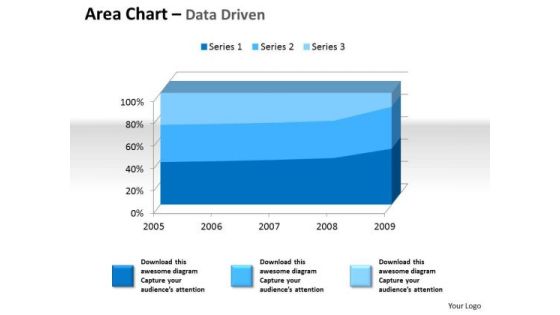
Examples Of Data Analysis Market 3d Area Chart For Quantiative PowerPoint Templates
Drum It Up With Our examples of data analysis market 3d area chart for quantiative Powerpoint Templates . Your Thoughts Will Raise The Tempo.
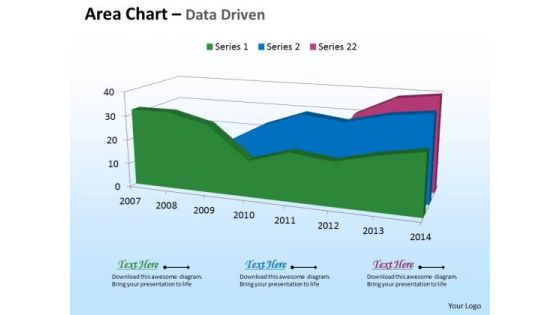
Microsoft Excel Data Analysis 3d Area Chart For Time Based PowerPoint Templates
Deliver The Right Dose With Our microsoft excel data analysis 3d area chart for time based Powerpoint Templates . Your Ideas Will Get The Correct Illumination.
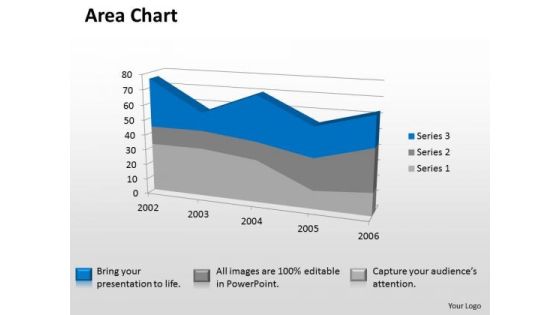
Microsoft Excel Data Analysis 3d Area Chart Showimg Change In Values PowerPoint Templates
Our microsoft excel data analysis 3d area chart showimg change in values Powerpoint Templates Deliver At Your Doorstep. Let Them In For A Wonderful Experience.

Organization Profile Area Of Focus Ppt PowerPoint Presentation Visual Aids
This is a organization profile area of focus ppt powerpoint presentation visual aids. This is a one stage process. The stages in this process are organization profile, business, marketing, circular, process.
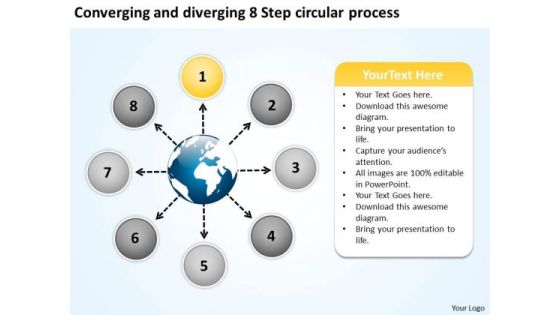
Diverging 8 Step Circular Process Ppt 2 Relative Flow Arrow Chart PowerPoint Templates
We present our diverging 8 step circular process ppt 2 Relative Flow Arrow Chart PowerPoint templates.Use our Ring Charts PowerPoint Templates because you can Unravel the desired and essential elements of your overall strategy. Download and present our Circle Charts PowerPoint Templates because this diagram put it all together to form the complete picture and reach the goal. Use our Process and flows PowerPoint Templates because this template helps you to bring your audiences to the table. Use our Marketing PowerPoint Templates because The marketplace is the merger of your dreams and your ability. Present our Flow charts PowerPoint Templates because they help to lay the base of your trend of thought.Use these PowerPoint slides for presentations relating to Arrows, business, chart, circle, company,concept, continuity, continuous, cycle,dependency, diagram, direction,dynamic,endless, graph,iteration, iterative, method, path, phase,presentation, process, production,progress, progression, report, rotation,sequence. The prominent colors used in the PowerPoint template are Yellow, White, Black. People tell us our diverging 8 step circular process ppt 2 Relative Flow Arrow Chart PowerPoint templates are designed by professionals Professionals tell us our cycle PowerPoint templates and PPT Slides are Adorable. We assure you our diverging 8 step circular process ppt 2 Relative Flow Arrow Chart PowerPoint templates are designed by professionals PowerPoint presentation experts tell us our cycle PowerPoint templates and PPT Slides are Elegant. We assure you our diverging 8 step circular process ppt 2 Relative Flow Arrow Chart PowerPoint templates are designed to make your presentations professional. People tell us our chart PowerPoint templates and PPT Slides are Stylish.
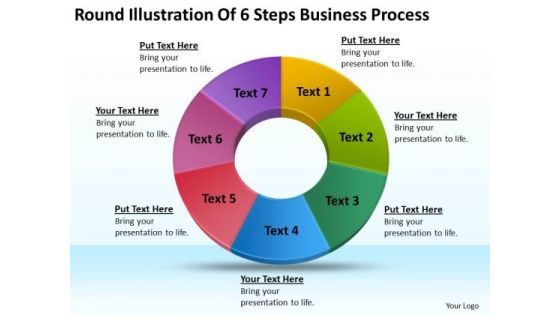
Business PowerPoint Templates Download Process Plan Outline Slides
We present our business powerpoint templates download process plan outline Slides.Use our Process and Flows PowerPoint Templates because Our PowerPoint Templates and Slides will provide weight to your words. They will bring out the depth of your thought process. Present our Ring Charts PowerPoint Templates because You can Inspire your team with our PowerPoint Templates and Slides. Let the force of your ideas flow into their minds. Present our Flow Charts PowerPoint Templates because You are well armed with penetrative ideas. Our PowerPoint Templates and Slides will provide the gunpowder you need. Download and present our Success PowerPoint Templates because It can be used to Set your controls for the heart of the sun. Our PowerPoint Templates and Slides will be the propellant to get you there. Present our Marketing PowerPoint Templates because You can Zap them with our PowerPoint Templates and Slides. See them reel under the impact.Use these PowerPoint slides for presentations relating to Abstract, achievement, analyzing, bar, blue, business, chart, circle, color, concept, diagram, finance, graph, graphic, growth, icon, illustration, investment, part,pie, progress, rate, report, sector, sign, spiral, staircase, statistic, stats, steps, success, symbol, up, white. The prominent colors used in the PowerPoint template are Blue, Purple, Green.

Data Analysis Template Driven Stock Chart For Market Trends PowerPoint Slides Templates
Drive Your Team Along The Road To Success. Take The Wheel With Our data analysis template driven stock chart for market trends powerpoint slides Templates .

Examples Of Data Analysis Market 3d Business Trend Series Chart PowerPoint Templates
Duct It Through With Our examples of data analysis market 3d business trend series chart Powerpoint Templates . Your Ideas Will Reach Into Their Minds Intact.

Stacked Area Clustered Column Ppt PowerPoint Presentation Clipart
This is a stacked area clustered column ppt powerpoint presentation clipart. This is a four stage process. The stages in this process are in percentage, stacked area clustered column, product.

Stacked Area Clustered Column Ppt PowerPoint Presentation Styles Gridlines
This is a stacked area clustered column ppt powerpoint presentation styles gridlines. This is a three stage process. The stages in this process are dollars, in percentage, finance, growth strategy, business, strategy.

Process To Change Organization How Do You Write Business Plan PowerPoint Templates
We present our process to change organization how do you write business plan PowerPoint templates.Use our Business PowerPoint Templates because It is Aesthetically crafted by artistic young minds. Our PowerPoint Templates and Slides are designed to display your dexterity. Present our Marketing PowerPoint Templates because Our PowerPoint Templates and Slides are truly out of this world. Even the MIB duo has been keeping tabs on our team. Use our Light Bulbs PowerPoint Templates because Our PowerPoint Templates and Slides will let you Hit the target. Go the full distance with ease and elan. Present our Circle Charts PowerPoint Templates because It will Raise the bar of your Thoughts. They are programmed to take you to the next level. Present our Process and Charts PowerPoint Templates because our PowerPoint Templates and Slides are the string of your bow. Fire of your ideas and conquer the podium.Use these PowerPoint slides for presentations relating to Lightbulb, icon, electric, white, lamp, bulb, yellow, diagram, electricity, orange, light, incandescence, graphic, process, element, halogen, incandescent, graph,illustration, energy, filament, clipart, planning, design, clip, set, infographic, transparency, art, wire, globe, glass. The prominent colors used in the PowerPoint template are Orange, Gray, White.

Cyledrical Shape Spheres On Top For Five Stage Ppt Business Proposal Plan PowerPoint Templates
We present our cyledrical shape spheres on top for five stage ppt business proposal plan PowerPoint templates.Use our Spheres PowerPoint Templates because It will get your audience in sync. Use our Process and Flows PowerPoint Templates because You can Create a matrix with our PowerPoint Templates and Slides. Feel the strength of your ideas click into place. Download and present our Flow Charts PowerPoint Templates because You can Double your output with our PowerPoint Templates and Slides. They make beating deadlines a piece of cake. Use our Business PowerPoint Templates because They will bring a lot to the table. Their alluring flavours will make your audience salivate. Download our Shapes PowerPoint Templates because Watching this your Audience will Grab their eyeballs, they wont even blink.Use these PowerPoint slides for presentations relating to Diagram, chart, market, statistics, square, grow, infograph, bar, corporate, business, vector, success, presentation, growing, circle, finance,analyst, goal, report, marketing, different, accounting, management, graph, illustration, geometric, sphere, design, growth, text, infographic, progress, profit,information, increase, aim, analyze, financial, rising, measure. The prominent colors used in the PowerPoint template are Pink, Blue, Blue light.

Linear Periodization Volume And Time Ppt PowerPoint Presentation Summary Topics
This is a linear periodization volume and time ppt powerpoint presentation summary topics. This is a two stage process. The stages in this process are linear periodization, linear growth, linear progression.

Clustered Column Ppt PowerPoint Presentation Inspiration Pictures
This is a clustered column ppt powerpoint presentation inspiration pictures. This is a two stage process. The stages in this process are clustered bar, product, planning, business, in price.

Internal Analysis Workforce Trends Ppt PowerPoint Presentation Summary Example Topics
This is a internal analysis workforce trends ppt powerpoint presentation summary example topics. This is a four stage process. The stages in this process are workforce trends, percentage, business, marketing, management.

Internal Analysis Workforce Trends Ppt PowerPoint Presentation Model Infographics
This is a internal analysis workforce trends ppt powerpoint presentation model infographics. This is a four stage process. The stages in this process are workforce trends, internal analysis, business, marketing, success.

Circles With Arrows In Linear Flow Powerpoint Templates
Circles with arrows in linear order have been displayed in this business slide. This business diagram helps to exhibit process of target planning. Use this diagram to build an exclusive presentation.
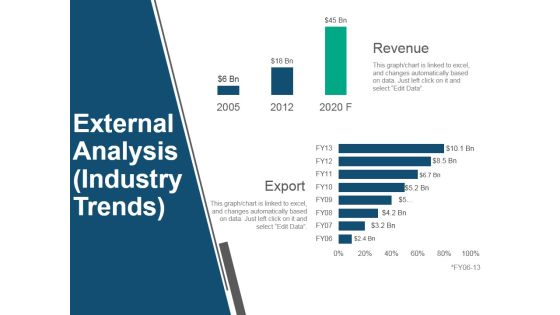
External Analysis Industry Trends Ppt PowerPoint Presentation Inspiration Portfolio
This is a external analysis industry trends ppt powerpoint presentation inspiration portfolio. This is a two stage process. The stages in this process are revenue, export, business, marketing, presentation.
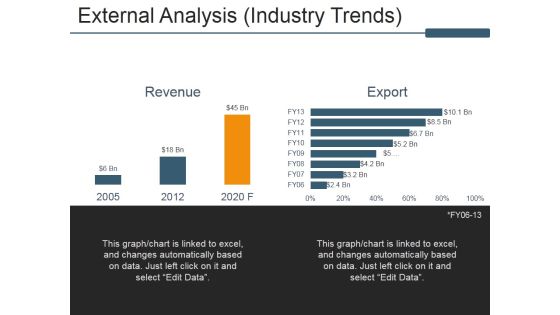
External Analysis Industry Trends Ppt PowerPoint Presentation Infographic Template Summary
This is a external analysis industry trends ppt powerpoint presentation infographic template summary. This is a two stage process. The stages in this process are revenue, export, external analysis, business, marketing.
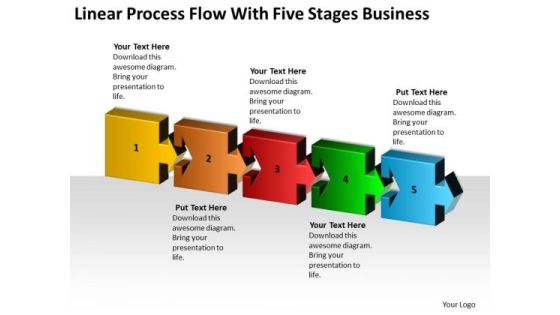
Linear Process Flow With Five Stages Business Ppt Plan Guidelines PowerPoint Templates
We present our linear process flow with five stages business ppt plan guidelines PowerPoint templates.Use our Process and Flows PowerPoint Templates because Our PowerPoint Templates and Slides will provide you the cutting edge. Slice through the doubts in the minds of your listeners. Use our Marketing PowerPoint Templates because Our PowerPoint Templates and Slides are designed to help you succeed. They have all the ingredients you need. Download our Puzzles or Jigsaws PowerPoint Templates because Our PowerPoint Templates and Slides will Embellish your thoughts. They will help you illustrate the brilliance of your ideas. Use our Shapes PowerPoint Templates because Timeline crunches are a fact of life. Meet all deadlines using our PowerPoint Templates and Slides. Present our Flow Charts PowerPoint Templates because You will get more than you ever bargained for. Use these PowerPoint slides for presentations relating to Process, business, stage, people, chart, person, background, square, seminar, step, flow, plan, concept, sign, template, diagram, circle, graphic, analysis, idea, four, cycle, connection, strategy, transfer, empty, showing, connect,pointing, meeting, education, draw, manager, analyze . The prominent colors used in the PowerPoint template are Yellow, Orange, Red.
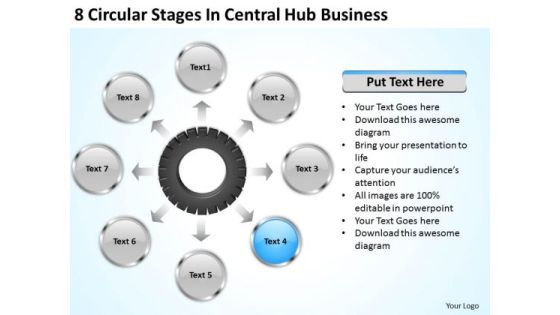
Business Level Strategy Stages Central Hub Definition
We present our business level strategy stages central hub definition.Use our Process and Flows PowerPoint Templates because Our PowerPoint Templates and Slides are like the strings of a tennis racquet. Well strung to help you serve aces. Use our Circle Charts PowerPoint Templates because Our PowerPoint Templates and Slides offer you the needful to organise your thoughts. Use them to list out your views in a logical sequence. Download our Ring Charts PowerPoint Templates because You can Be the star of the show with our PowerPoint Templates and Slides. Rock the stage with your ideas. Download and present our Flow Charts PowerPoint Templates because It will Raise the bar of your Thoughts. They are programmed to take you to the next level. Download our Marketing PowerPoint Templates because You can Flag mark the road ahead with our PowerPoint Templates and Slides. They will unfurl your brilliant plans to your audience.Use these PowerPoint slides for presentations relating to Arrows, blank, business, central, centralized, chart, circle, circular,circulation, concept, conceptual, converging, design, diagram, eight, executive,icon, idea, illustration, management, map, mapping, mba, model, numbers,organization, outwards, pointing, procedure, process, radial, radiating,relationship, resource, sequence, sequential, seven, square, strategy. The prominent colors used in the PowerPoint template are Blue light, Gray, White.
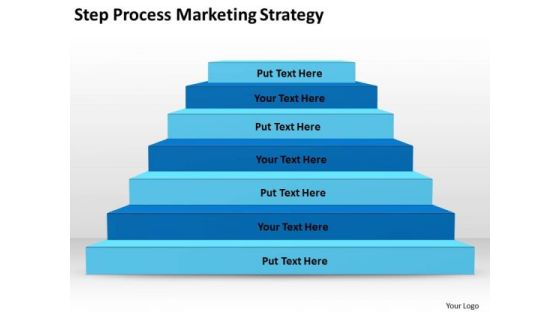
Step Process Marketing Strategy Ppt Business Plan Models PowerPoint Templates
We present our step process marketing strategy ppt business plan models PowerPoint templates.Present our Flow Charts PowerPoint Templates because They will Put your wonderful verbal artistry on display. Our PowerPoint Templates and Slides will provide you the necessary glam and glitter. Present our Business PowerPoint Templates because Our PowerPoint Templates and Slides will fulfill your every need. Use them and effectively satisfy the desires of your audience. Use our Process and Flows PowerPoint Templates because Our PowerPoint Templates and Slides will let you Clearly mark the path for others to follow. Download our Marketing PowerPoint Templates because Our PowerPoint Templates and Slides are conceived by a dedicated team. Use them and give form to your wondrous ideas. Download our Shapes PowerPoint Templates because It can Bubble and burst with your ideas.Use these PowerPoint slides for presentations relating to Stairs, bar, black, business, concept, corporate, design, development, diagram, document, economics, element, growth,illustration, infochart, infographics, information, layout, marketing, media, modern, number, options, presentation, process, retro, stair, statistics, stats, step,success, symbol, vector, vintage, visualization. The prominent colors used in the PowerPoint template are Blue, Blue light, Black.

2 Steps For Strategic Planning Procedure Business Outline Example PowerPoint Templates
We present our 2 steps for strategic planning procedure business outline example PowerPoint templates.Use our Symbol PowerPoint Templates because knowledge is power goes the popular saying. Download and present our Arrows PowerPoint Templates because it helps you to inform your team of your innovative ideas. Use our Business PowerPoint Templates because the great Bald headed Eagle embodies your personality. the eagle eye to seize upon the smallest of opportunities. Use our Flow charts PowerPoint Templates because it Saves your time as a prized possession, an ideal aid to give an ideal presentation. Use our Process and Flows PowerPoint Templates because you have the plans ready for them to absorb and understand.Use these PowerPoint slides for presentations relating to Arrow, Arrows, Block, Business, Chart, Design, Development, Diagram, Direction, Element, Flow, Flowchart, Graph, Linear, Management, Organization, Process, Program, Section, Sign, Solution, Symbol. The prominent colors used in the PowerPoint template are Blue, Gray, White. Professionals tell us our 2 steps for strategic planning procedure business outline example PowerPoint templates are Flirty. We assure you our Block PowerPoint templates and PPT Slides are Multicolored. People tell us our 2 steps for strategic planning procedure business outline example PowerPoint templates are designed by professionals Customers tell us our Diagram PowerPoint templates and PPT Slides are Radiant. Use our 2 steps for strategic planning procedure business outline example PowerPoint templates will make you look like a winner. We assure you our Chart PowerPoint templates and PPT Slides are the best it can get when it comes to presenting.

Kaizen Report Form Ppt PowerPoint Presentation Summary
This is a kaizen report form ppt powerpoint presentation summary. This is a two stage process. The stages in this process are team members, problem description, area, solution description, benefit description, implementation status.

Financial Statement Ppt PowerPoint Presentation Outline Layout Ideas
This is a financial statement ppt powerpoint presentation outline layout ideas. This is a five stage process. The stages in this process are revenue growth, deal drop off by stage, revenue trends, top 5 industries contribution, trends of sales cycle times.

3d Stages Of Process Analysis 8 Concepts Cycle Spoke Chart PowerPoint Templates
We present our 3d stages of process analysis 8 concepts Cycle Spoke Chart PowerPoint templates.Present our Business PowerPoint Templates because infrastructure growth is an obvious requirement of today.inform your group on how exactly this potential is tailor made for you. Download and present our Circle Charts PowerPoint Templates because you can Unravel the desired and essential elements of your overall strategy. Present our Shapes PowerPoint Templates because Our PowerPoint Templates and Slides are specially created by a professional team with vast experience. They diligently strive to come up with the right vehicle for your brilliant Ideas. Download our Process and Flows PowerPoint Templates because you can Break it all down to Key Result Areas. Download and present our Success PowerPoint Templates because your quest has taken you well onto the path of success.Use these PowerPoint slides for presentations relating to Achieve, act, actions, around, arrows,assess, assessment, business, circle,concept, cycle, decide, decision,direction, illustration, isolated, plan,process, steps, strategy, succeed,symbol, isolated, isometric, market,motion, movement, organization, p perspective, presentation,process, processchart, recycle, report,ring, sign, step, stock. The prominent colors used in the PowerPoint template are Green dark , Gray, White. The feedback we get is that our 3d stages of process analysis 8 concepts Cycle Spoke Chart PowerPoint templates are designed by professionals The feedback we get is that our assessment PowerPoint templates and PPT Slides are Pretty. Presenters tell us our 3d stages of process analysis 8 concepts Cycle Spoke Chart PowerPoint templates are Royal. The feedback we get is that our actions PowerPoint templates and PPT Slides are Chic. PowerPoint presentation experts tell us our 3d stages of process analysis 8 concepts Cycle Spoke Chart PowerPoint templates are Nice. Customers tell us our arrows PowerPoint templates and PPT Slides are Nice.

Crm Dashboard Sales Dashboard Template Ppt PowerPoint Presentation Inspiration
This is a crm dashboard sales dashboard template ppt powerpoint presentation inspiration. This is a five stage process. The stages in this process are sales by product march, lead owner breakdown, total lead ownership, month over month closing trend.
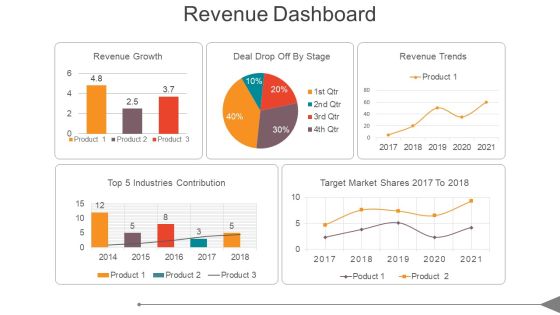
Revenue Dashboard Ppt PowerPoint Presentation Show
This is a revenue dashboard ppt powerpoint presentation show. This is a five stage process. The stages in this process are top 5 industries contribution, revenue growth, deal drop off by stage, revenue trends, target market shares 2017 to 2018.

Crm Dashboard Sales Dashboard Ppt PowerPoint Presentation Themes
This is a crm dashboard sales dashboard ppt powerpoint presentation themes. This is a four stage process. The stages in this process are month over month closing trend, lead owner breakdown, total lead ownership, sales by product march 2017.

Demand Forecasting Template 1 Ppt PowerPoint Presentation Styles Gridlines
This is a demand forecasting template 1 ppt powerpoint presentation styles gridlines. This is a four stage process. The stages in this process are trends, qualitative input, base forecast, seasonality factors.

Circular Infographic Of Positioning Market Powerpoint Template
Use this PowerPoint to display market positioning. This PPT slide contains diagram of circular infographic. This PowerPoint Template has been designed to portray your concepts in visual manner.

Four Options Circular Layout Powerpoint Templates
Create stunning presentations with our professional template containing four options infographic circular layout. Download this slide for business workflows. Accelerate the impact of your ideas with this PowerPoint Slide.
Set Of Circular Flyer With Icons PowerPoint Templates
Looking for a planned beautifully made continuous process diagram for your presentation? Here is the right diagram for you. Six circular flyer with icons that completely depicts that the continuous process is going on. You can add this template in your PPT presentation to shows what is the continuous process in the management system or how things are repetitive in this business. This PowerPoint slide can also be used to depict how each system in the business is synced with one another. Icons and colors are editable. So choose this template and make the right choice.

Team Building Examples Ppt Sample
This is a team building examples ppt sample. This is a one stage process. The stages in this process are me, my boss, my peer, my lead.
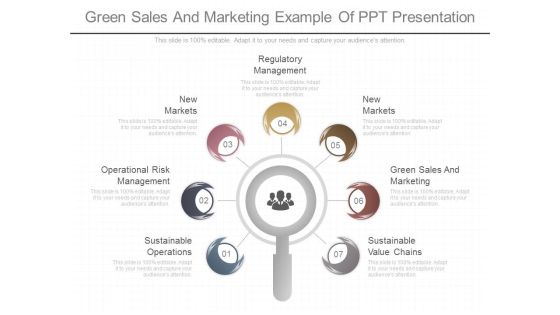
Green Sales And Marketing Example Of Ppt Presentation
This is a green sales and marketing example of ppt presentation. This is a seven stage process. The stages in this process are sustainable operations, operational risk management, markets new, regulatory management, markets markets new, green sales and marketing, sustainable value chains.

Web Based Crm For Small Business Ppt Slides Styles
This is a web based crm for small business ppt slides styles. This is a ten stage process. The stages in this process are sales, support, marketing, collections, reports, inventory, security, work flow, customize, email sms.

Net Promoter Score Marketing Layout Powerpoint Templates
This is a net promoter score marketing layout powerpoint templates. This is a three stage process. The stages in this process are net promoter score, know your business, know your customer, know your market.
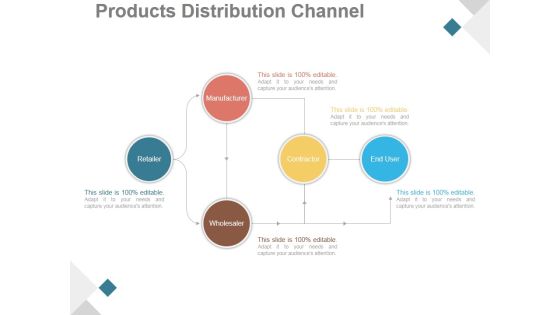
Products Distribution Channel Ppt PowerPoint Presentation Ideas
This is a products distribution channel ppt powerpoint presentation ideas. This is a five stage process. The stages in this process are retailer, manufacturer, wholesaler, contractor, end user.

Preparation Of Auditing Programme Flowchart Ppt PowerPoint Presentation Picture
This is a preparation of auditing programme flowchart ppt powerpoint presentation picture. This is a one stage process. The stages in this process are mailbox event, system event, user session event, process control event, process control event.

Optimizing Media Budget Ppt PowerPoint Presentation Inspiration
This is a optimizing media budget ppt powerpoint presentation inspiration. This is a three stage process. The stages in this process are media spend, traffic, sales.
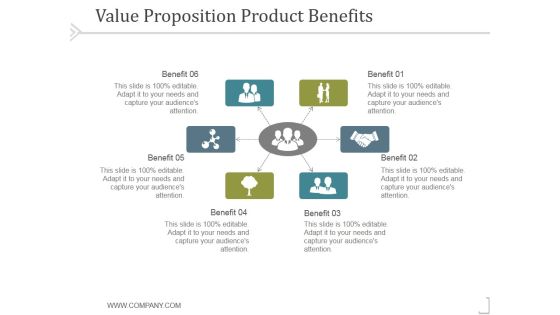
Value Proposition Product Benefits Template 1 Ppt PowerPoint Presentation Sample
This is a value proposition product benefits template 1 ppt powerpoint presentation sample. This is a six stage process. The stages in this process are business, strategy, marketing, success, process.

Critical Path Method Ppt PowerPoint Presentation Model
This is a critical path method ppt powerpoint presentation model. This is a eight stage process. The stages in this process are business, strategy, analysis, marketing, critical path.
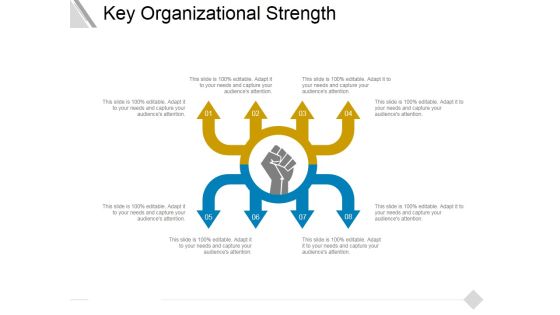
Key Organizational Strength Ppt PowerPoint Presentation Outline Designs Download
This is a key organizational strength ppt powerpoint presentation outline designs download. This is a eight stage process. The stages in this process are strength, business, management, organizational, strategy.
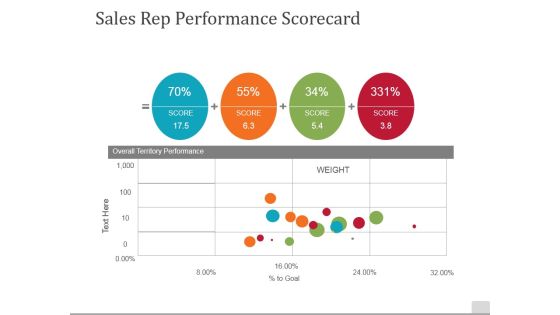
Sales Rep Performance Scorecard Ppt PowerPoint Presentation Gallery Design Templates
This is a sales rep performance scorecard ppt powerpoint presentation gallery design templates. This is a four stage process. The stages in this process are overall territory performance, weight, score.

Fine Tuning Of Concept Ppt PowerPoint Presentation Styles Ideas
This is a fine tuning of concept ppt powerpoint presentation styles ideas. This is a two stage process. The stages in this process are refine project plan, determine decision making authority, definition of target processes, interfaces and systems adjustments, data migration plan, composition of project team.

Comparison Ppt PowerPoint Presentation Icon Guide
This is a comparison ppt powerpoint presentation icon guide. This is a four stage process. The stages in this process are business, marketing, planning, strategy, finance.

Rescue Statistics Business PowerPoint Templates And PowerPoint Themes 1112
Rescue Statistics Business PowerPoint Templates And PowerPoint Themes 1112-This PowerPoint Template contains an image of lifesaver and multicolored bar graphs which depict the concept of rescue statistics. Use our Success PowerPoint Templates because; amplify your thoughts via our appropriate templates. Use our Business PowerPoint Templates because, Business Template: - There is a vision, a need you can meet. Present your views using our innovative slides and be assured of leaving a lasting impression.-Rescue Statistics Business PowerPoint Templates And PowerPoint Themes 1112-This PowerPoint template can be used for presentations relating to-Rescue Statistics, Business, Security, Marketing, Finance, Abstract

Financial Strength Ppt PowerPoint Presentation Shapes
This is a financial strength ppt powerpoint presentation shapes. This is a four stage process. The stages in this process are business, marketing, success, business plan, bar graph.

Key To Business Global Issues PowerPoint Templates Ppt Backgrounds For Slides 0113
We present our Key To Business Global Issues PowerPoint Templates PPT Backgrounds For Slides 0113.Download and present our Globe PowerPoint Templates because It can Leverage your style with our PowerPoint Templates and Slides. Charm your audience with your ability. Use our Security PowerPoint Templates because you can Set pulses racing with our PowerPoint Templates and Slides. They will raise the expectations of your team. Download and present our Success PowerPoint Templates because Our PowerPoint Templates and Slides will Activate the energies of your audience. Get their creative juices flowing with your words. Use our Signs PowerPoint Templates because You can Create a matrix with our PowerPoint Templates and Slides. Feel the strength of your ideas click into place. Use our Money PowerPoint Templates because Our PowerPoint Templates and Slides are specially created by a professional team with vast experience. They diligently strive to come up with the right vehicle for your brilliant Ideas. Use these PowerPoint slides for presentations relating to Bar graph in key with globe, signs, money, security, success, globe. The prominent colors used in the PowerPoint template are Blue navy, Yellow, Brown. We assure you our Key To Business Global Issues PowerPoint Templates PPT Backgrounds For Slides 0113 will make the presenter successul in his career/life. Professionals tell us our in PowerPoint templates and PPT Slides are designed to make your presentations professional. We assure you our Key To Business Global Issues PowerPoint Templates PPT Backgrounds For Slides 0113 are effectively colour coded to prioritise your plans They automatically highlight the sequence of events you desire. The feedback we get is that our money PowerPoint templates and PPT Slides provide you with a vast range of viable options. Select the appropriate ones and just fill in your text. Customers tell us our Key To Business Global Issues PowerPoint Templates PPT Backgrounds For Slides 0113 provide great value for your money. Be assured of finding the best projection to highlight your words. Customers tell us our globe PowerPoint templates and PPT Slides are specially created by a professional team with vast experience. They diligently strive to come up with the right vehicle for your brilliant Ideas.

Scatter Chart Template 3 Ppt PowerPoint Presentation Styles Demonstration
This is a scatter chart template 3 ppt powerpoint presentation styles demonstration. This is a one stage process. The stages in this process are sales in percentage, finance, business, marketing, growth.
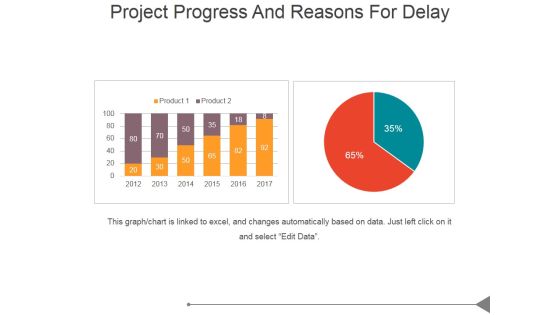
Project Progress And Reasons For Delay Ppt PowerPoint Presentation Designs Download
This is a project progress and reasons for delay ppt powerpoint presentation designs download. This is a two stage process. The stages in this process are business, marketing, success, bar graph, management.
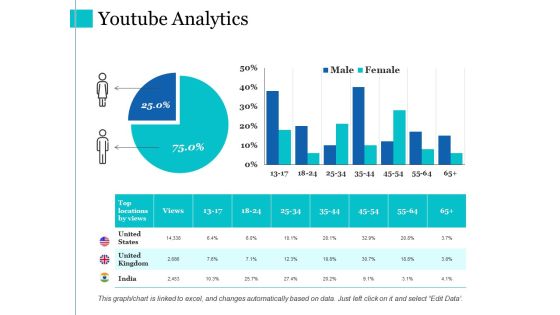
Youtube Analytics Ppt PowerPoint Presentation Layouts Graphic Images
This is a youtube analytics ppt powerpoint presentation layouts graphic images. This is a three stage process. The stages in this process are youtube analytics, finance, percentage, bar graph.

Data Analysis Excel Driven Multiple Series Scatter Chart PowerPoint Slides Templates
Your Listeners Will Never Doodle. Our data analysis excel driven multiple series scatter chart powerpoint slides Templates Will Hold Their Concentration.

Area Chart Ppt PowerPoint Presentation Professional Infographics
This is a area chart ppt powerpoint presentation professional infographics. This is a two stage process. The stages in this process are business, strategy, analysis, planning, area chart.

Area Chart Ppt PowerPoint Presentation Outline Deck
This is a area chart ppt powerpoint presentation outline deck. This is a two stage process. The stages in this process are area chart, finance, marketing, analysis, business.

Area Chart Ppt PowerPoint Presentation Visual Aids Show
This is a area chart ppt powerpoint presentation visual aids show. This is a two stage process. The stages in this process are area chart, growth, strategy, finance, business.

6 Steps For Business Development Ppt How Do Write A Plan PowerPoint Templates
We present our 6 steps for business development ppt how do write a plan PowerPoint templates.Download and present our Process and Flows PowerPoint Templates because Our PowerPoint Templates and Slides will definately Enhance the stature of your presentation. Adorn the beauty of your thoughts with their colourful backgrounds. Present our Success PowerPoint Templates because Our PowerPoint Templates and Slides will let you meet your Deadlines. Download and present our Flow Charts PowerPoint Templates because These PowerPoint Templates and Slides will give the updraft to your ideas. See them soar to great heights with ease. Download and present our Shapes PowerPoint Templates because You can Raise a toast with our PowerPoint Templates and Slides. Spread good cheer amongst your audience. Download and present our Business PowerPoint Templates because Our PowerPoint Templates and Slides will generate and maintain the level of interest you desire. They will create the impression you want to imprint on your audience.Use these PowerPoint slides for presentations relating to Icon, pie, chart, business, profile, white, bar, new, success, symbol, elements, diagram, circle, graphic,data, stock, report, marketing, analyzing, shape, graph, steps, illustration, round, up, aspirations, design, color, growth, backgrounds, progress, part,inspiration, information, improvement, staircase, portion, ideas, exchange. The prominent colors used in the PowerPoint template are Pink, Gray, Blue light.

Crm Dashboard Sales Dashboard Template Ppt PowerPoint Presentation Professional Layout
This is a crm dashboard sales dashboard template ppt powerpoint presentation professional layout. This is a four stage process. The stages in this process are lead owner breakdown, sales by product march 2017, total lead ownership, month over month closing trend.

Circular Flow Infographic Chart Powerpoint Templates
Circular infographic has been displayed in this business slide. This business diagram helps to exhibit process of target planning. Use this diagram to build an exclusive presentation.

Colorful Circles With Icons Powerpoint Templates
Circular infographic has been displayed in this business slide. This business diagram helps to exhibit process of strategic planning. Use this diagram to build an exclusive presentation.
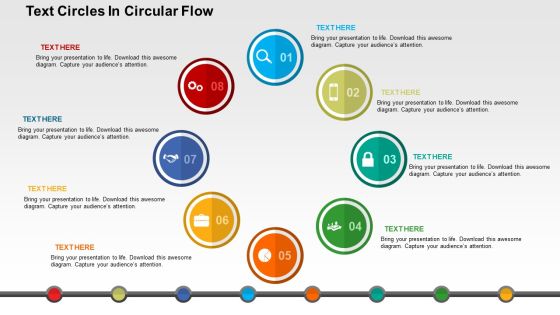
Text Circles In Circular Flow Powerpoint Templates
If anything that can depict a continuous flow of information or data, then it has to be this template which is one of our top rated PowerPoint templates. You can use this multicolored slide to represent various steps involved in a nonstop process. This template can also be perfect choice to denote a continuous process or a process which is repetitive in nature. The diagram is self-explanatory to a lot of extent and with the right icons it is will surely pass the right message in one go. This design can be your perfect solution to depict a loop in anything ranging from a business organization to a communication process.

Audit Risk Management Ppt PowerPoint Presentation Slide
This is a audit risk management ppt powerpoint presentation slide. This is a three stage process. The stages in this process are test of details, analytical procedures, test of control, procedures to understand internal control, risk assessment procedures, inherent risk, control risk, detection risk.

Bar Chart Dollar Business PowerPoint Templates And PowerPoint Themes 0912
Bar Chart Dollar Business PowerPoint Templates And PowerPoint Themes 0912-Microsoft Powerpoint Templates and Background with dollar bar graph-Dollar bar graph, money, finance, success, future, business
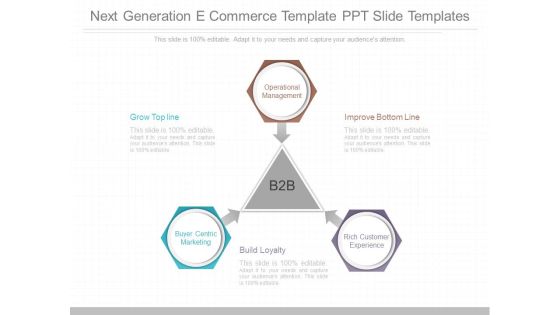
Next Generation E Commerce Template Ppt Slide Templates
This is a next generation e commerce template ppt slide templates. This is a three stage process. The stages in this process are b2b, operational management, buyer centric marketing, rich customer experience, grow top line, build loyalty, improve bottom line.

Atl And Btl Promotion Ppt PowerPoint Presentation Gallery Show
This is a atl and btl promotion ppt powerpoint presentation gallery show. This is a three stage process. The stages in this process are above the line, below the line, consumer.
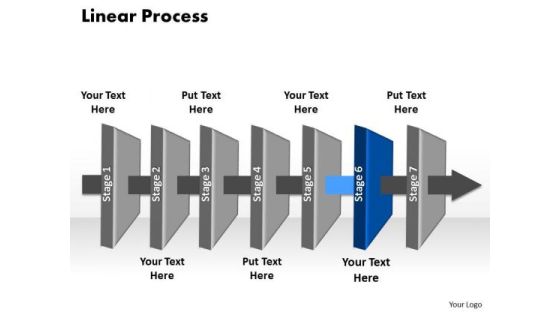
Ppt Ozone Layer PowerPoint Presentation 6 Social Linear Process Templates
PPT ozone layer PowerPoint presentation 6 social linear process Templates-Use this 3D PowerPoint Diagram to represent the Seven stages of Sequential Process. It portrays beeline, continuous, even, horizontal, in bee line, in straight line, linear , nonstop, not crooked, point-blank, right, shortest, straight, straightaway, though, true, unbroken etc.-PPT ozone layer PowerPoint presentation 6 social linear process Templates-abstract, achievement, adding, analyzing, arrow, art, background, blank, blue, business, chart, color, colorful, cycle, data, design, diagram, element, flow, graph, graphic, gray, green, icon, linear, management, market, numbers, percent, process, project, round, stock, success, up, value
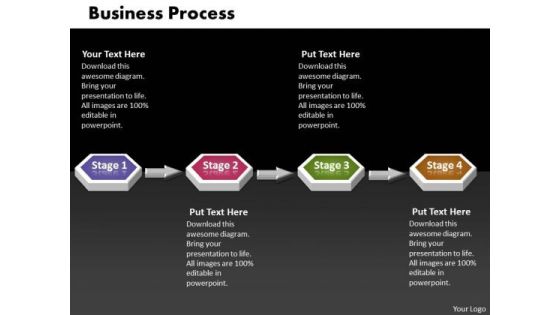
Ppt 4 Phase Diagram 3d Sequential Business PowerPoint Theme Process Templates
PPT 4 phase diagram 3d sequential business powerpoint theme process Templates-Use this 3D PowerPoint Diagram to describe three stages of Continuous Process. It portrays beeline, Sequential, even, horizontal, in bee line, linear , nonstop, not crooked, point-blank, right, straight, straightaway, though, true, unbroken etc.-PPT 4 phase diagram 3d sequential business powerpoint theme process Templates-arrow, art, background, blank, business, chart, clip, diagram, drop, eps10, flow, four, graph, graphic, gray, green, illustration, process, shadow, shape, step, symbol, transparency, vector, white

Talent Acquisition And Management Framework Ppt Slide
This is a talent acquisition and management framework ppt slide. This is a one stage process. The stages in this process are core competence, below the line, employee value proposition, personal purpose, strategy, structure, process, evolving and dynamic value proposition, leadership, organizational purpose, recognition, rewards, above the line, customer value proposition, engagement.\n\n\n\n\n\n\n\n\n\n\n\n\n\n\n\n

Coordinated Global Product Development Strategies Ppt Summary
This is a coordinated global product development strategies ppt summary. This is a ten stage process. The stages in this process are goals, target market, marketing, sales, distribution, manufacturing, labor, purchasing, r and d, finance and control, product line.
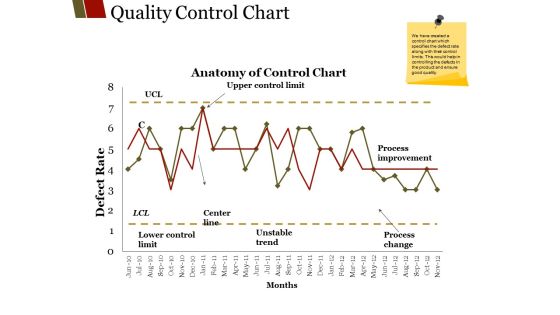
Quality Control Chart Ppt PowerPoint Presentation File Graphics Design
This is a quality control chart ppt powerpoint presentation file graphics design. This is a two stage process. The stages in this process are unstable trend, months center line, lower control limit, process improvement.
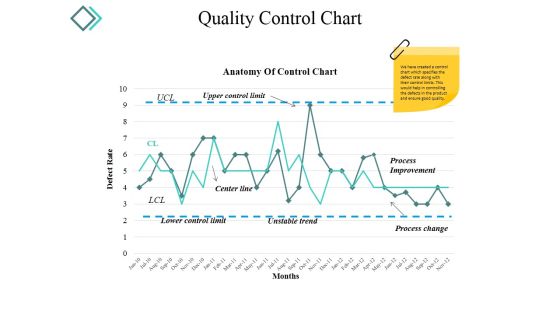
Quality Control Chart Ppt PowerPoint Presentation Model Background Images
This is a quality control chart ppt powerpoint presentation model background images. This is a two stage process. The stages in this process are center line, process improvement, process change, unstable trend.
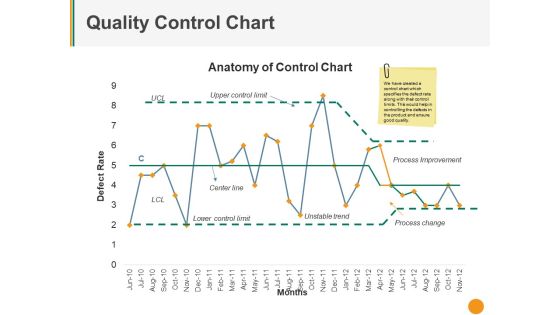
Quality Control Chart Ppt PowerPoint Presentation Pictures Deck
This is a quality control chart ppt powerpoint presentation pictures deck. This is a one stage process. The stages in this process are upper control limit, center line, unstable trend, process improvement, process change.
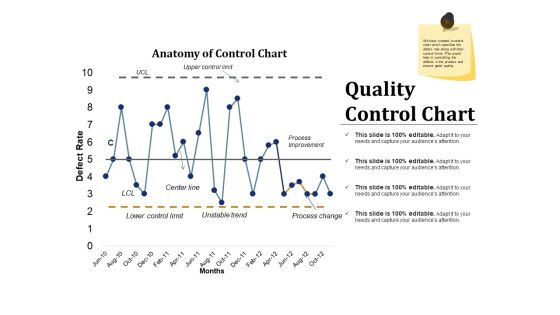
Quality Control Chart Ppt PowerPoint Presentation Inspiration Example Introduction
This is a quality control chart ppt powerpoint presentation inspiration example introduction. This is a two stage process. The stages in this process are process improvement, process change, unstable trend, lower control limit, center line.
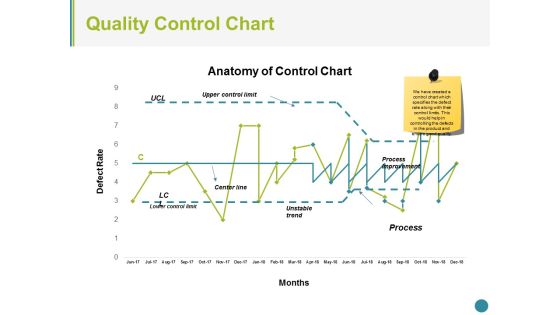
Quality Control Chart Ppt PowerPoint Presentation Infographic Template Slide Portrait
This is a quality control chart ppt powerpoint presentation infographic template slide portrait. This is a three stage process. The stages in this process are upper control limit, center line, unstable trend, process change, process improvement, lower control limit.

Bar Chart Ppt PowerPoint Presentation Slides Shapes
This is a bar chart ppt powerpoint presentation slides shapes. This is a seven stage process. The stages in this process are bar graph, finance, marketing, strategy, analysis.

Six Sigma Linear Circles Chart Presentation Powerpoint Templates
This is a six sigma linear circles chart presentation powerpoint templates. This is a five stage process. The stages in this process are bottom line, trained individuals, engagement, project by project, customer focused.

Successful Person Business PowerPoint Templates And PowerPoint Themes 0512
Microsoft Powerpoint Templates and Background with businessman and bar graph-Successful Person Business PowerPoint Templates And PowerPoint Themes 0512-These PowerPoint designs and slide layouts can be used for themes relating to -Businessman and bar graph, finance, people, business, shapes, success

Bi Level Optimization Ppt PowerPoint Presentation Model Summary
This is a bi level optimization ppt powerpoint presentation model summary. This is a two stage process. The stages in this process are bounds, optimal configuration, objective level lines, icons, business.

Bi Level Optimization Ppt PowerPoint Presentation Gallery Icons
This is a bi level optimization ppt powerpoint presentation gallery icons. This is a two stage process. The stages in this process are objective level lines, bounds, optimal configuration, feasible configurations, business, marketing.

Bi Level Optimization Ppt PowerPoint Presentation Infographics Icon
This is a bi level optimization ppt powerpoint presentation infographics icon. This is a two stage process. The stages in this process are icons, business, marketing, bound, objective level lines.

Bar Chart Ppt PowerPoint Presentation Styles Graphics Example
This is a bar chart ppt powerpoint presentation styles graphics example. This is a nine stage process. The stages in this process are graph, growth, success, business, finance.
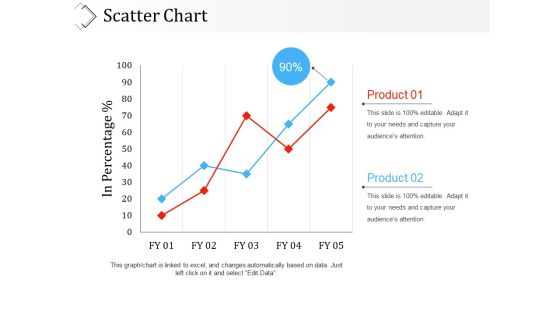
Scatter Chart Ppt PowerPoint Presentation Outline Picture
This is a scatter chart ppt powerpoint presentation outline picture. This is a two stage process. The stages in this process are in percentage, business, marketing, product, graph.
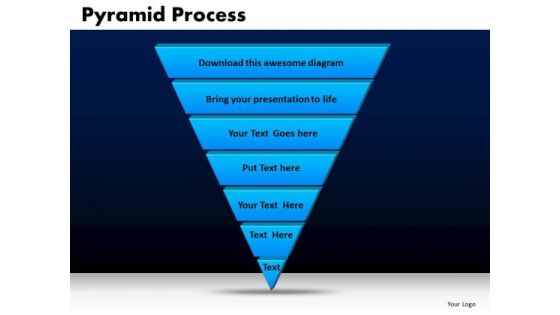
Business Triangles PowerPoint Templates Chart Pyramid Process Ppt Slides
Business Triangles PowerPoint Templates Chart Pyramid Process PPT Slides-A Pyramid Diagram may be defined as representation of data in the form of a triangle separated by horizontal lines. The widest section may contain the general topic while the narrowest section may contain a much more specific topic. -Business Triangles PowerPoint Templates Chart Pyramid Process PPT Slides-This template can be used for presentations relating to 3d, Bar, Business, Chart, Class, Conceptual, Corner, FInance, Graph, Graphic, Hierarchy, Investment, Layer, Level, Performance, Planner, Priority, Progress, Pyramid, Render, Status, Strategy, System, Triangle
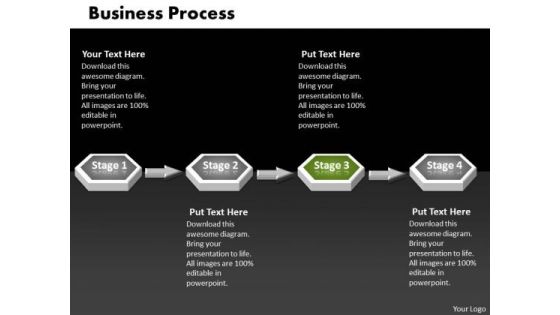
Ppt Green PowerPoint Slide Stage 3d Sequential Linear Process Templates
PPT green powerpoint slide stage 3d sequential linear process Templates-This Business PowerPoint Diagram shows 3d linear abstraction to represent Business related issues. It uses four stages. It indicates employment, field, function, game, line, and livelihood. It is helpful to organize information. -PPT green powerpoint slide stage 3d sequential linear process Templates-arrow, art, basic, blank, business, capital, chart, chevron, clip, clipart, colorful, conglomerates, consumer, copy, cyclical, energy, financial, flow, goods, graph, graphic, healthcare, illustration, infographic, information, investment, isolated, market, materials, non, round, sectors, services, slide, space, stock, technology, text,

Six Sigma Strands Chart Ppt Examples Slides
This is a six sigma strands chart ppt examples slides. This is a six stage process. The stages in this process are bottom line, trained individuals, data driven approach, customer focused, project by project, engagement, benefits of six sigma.
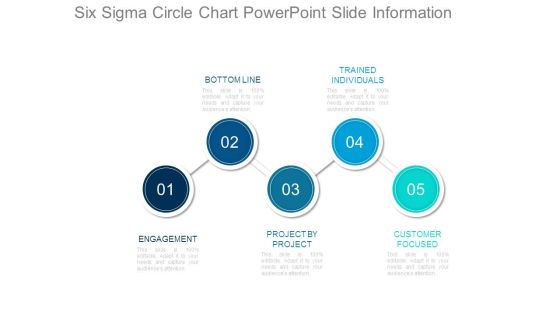
Six Sigma Circle Chart Powerpoint Slide Information
This is a six sigma circle chart powerpoint slide information. This is a five stage process. The stages in this process are bottom line, trained individuals, engagement, project by project, customer focused.
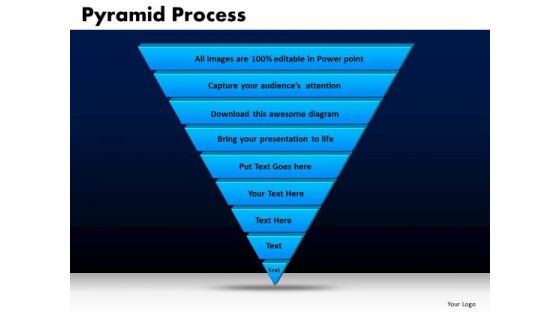
Business Triangles PowerPoint Templates Editable Pyramid Process Ppt Slides
Business Triangles PowerPoint Templates Editable Pyramid Process PPT Slides-A Pyramid Diagram may be defined as representation of data in the form of a triangle separated by horizontal lines. The widest section may contain the general topic while the narrowest section may contain a much more specific topic. -Business Triangles PowerPoint Templates Editable Pyramid Process PPT Slides-This template can be used for presentations relating to 3d, Bar, Business, Chart, Class, Conceptual, Corner, FInance, Graph, Graphic, Hierarchy, Investment, Layer, Level, Performance, Planner, Priority, Progress, Pyramid, Render, Status, Strategy, System, Triangle

PowerPoint Slides Pyramid Process Chart Ppt Theme
PowerPoint Slides pyramid Process Chart PPT Theme-This Pyramid Diagram may be defined as representation of data in the form of a triangle separated by horizontal lines. The widest section may contain the general topic while the narrowest section may contain a much more specific topic-business, chart, color, concept, conceptual, construction, corporate, creating, data, design, diagram, direction, focus, graph, group, growth, hierarchy, illustration, information, isolated, layer, layered, level, manage, management, model, object, organization, performance, population, presentation, principal, process, progress, pyramid, rank, resource, shape, stage, structure, support, symbol, top, triangle, vector-PowerPoint Slides pyramid Process Chart PPT Theme
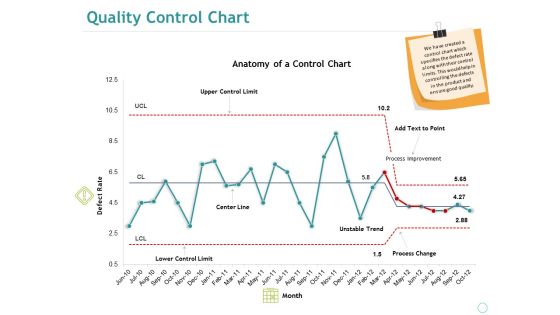
Quality Control Chart Ppt PowerPoint Presentation Summary Sample
This is a quality control chart ppt powerpoint presentation summary sample. This is a one stage process. The stages in this process are anatomy of a control chart, defect rate, upper control limit, center line, lower control limit.

Ppt Pyramid Diagram Pattern Certificate Templates PowerPoint
PPT pyramid diagram pattern certificate templates powerpoint-A Pyramid Diagram may be defined as representation of data in the form of a triangle separated by horizontal lines. The widest section may contain the general topic while the narrowest section may contain a much more specific topic.This diagarm highlights the depth of your thought process.-PPT pyramid diagram pattern certificate templates powerpoint-Business, Chart, Color, Data Pyramid, Diagram, Graph, Group, Growth, Hierarchy, Illustration, Layer, Layered, Layered Pyramid, Level, Multicolor, Object, Performance, Presentation, Progress, Pyramid, Rank, Seam, Segment, Set, Shape, Stage, Structure, Symbol, System, Top

Lime Investor Fundraising Elevator Limebike Service To Seattles Columbia City Ppt Inspiration Grid PDF
Following slide highlights the service comparison of lime bike with pronto bike to Seattles Columbia city through a graph. This is a lime investor fundraising elevator limebike service to seattles columbia city ppt inspiration grid pdf template with various stages. Focus and dispense information on three stages using this creative set, that comes with editable features. It contains large content boxes to add your information on topics like mountlake terrace, current, limebike coverage, pronto bike program coverage, store line. You can also showcase facts, figures, and other relevant content using this PPT layout. Grab it now.

Ppt Collinear Representation Of 5 Concepts PowerPoint Templates
PPT collinear representation of 5 concepts PowerPoint Templates-Use this 3D PowerPoint Diagram to represent the five stages of Sequential Process. It portrays beeline, continuous, even, horizontal, in bee line, in straight line, linear , nonstop, not crooked, point-blank, right, shortest, straight, straightaway, though, true, unbroken etc.-PPT collinear representation of 5 concepts PowerPoint Templates-Arrow, Background, Process, Business, Chart, Diagram, Financial, Graphic, Gray, Icon, Illustration, Management, Orange, Perspective, Process, Reflection, Stage, Spheres, Text, Transparency
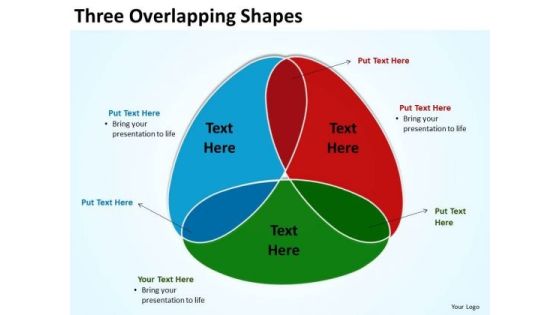
PowerPoint Backgrounds Education Three Overlapping Ppt Designs
PowerPoint Backgrounds Education Three Overlapping PPT Designs--Abstract, Art, Artistic, Background, Color, Curve, Design, Fractal, Geometric, Graphic, Illustration, Image, Line, Lobed, Overlapping, Pattern, Perspective, Rectangle, Repeated, Shape, Silver, Square, Steel, Three, Tri, Triad, Triangular, triple
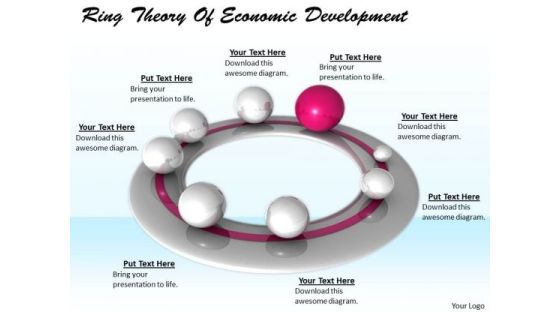
Stock Photo Business Growth Strategy Ring Theory Of Economic Development Clipart
Etch It In Their Brain With Our stock photo business growth strategy ring theory of economic development clipart. Embed Your Concept In Their Minds. Blast A Forehand With Our spheres. Your Ideas Will Go Right Down The Line.

Scatter Chart Ppt PowerPoint Presentation Portfolio Design Inspiration
This is a scatter chart ppt powerpoint presentation portfolio design inspiration. This is a twelve stage process. The stages in this process are graph, growth, success, business.
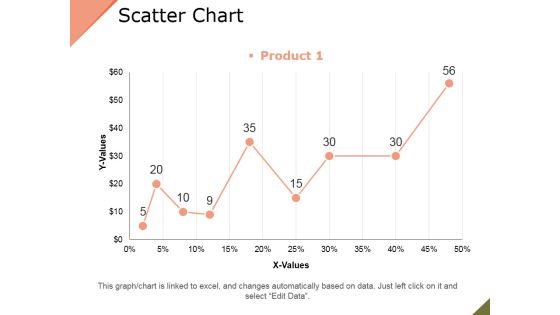
Scatter Chart Ppt PowerPoint Presentation Infographic Template Objects
This is a scatter chart ppt powerpoint presentation infographic template objects. This is a nine stage process. The stages in this process are product, growth, success, graph.

Comparative Table Of Various Debt Funding For Startups Microsoft PDF
This slide depicts comparative chart showcasing multiple debt financing for startups. It covers finances such as venture debt, convertible debt and working capital line. Pitch your topic with ease and precision using this comparative table of various debt funding for startups microsoft pdf. This layout presents information on venture debt, convertible debt, working capital line. It is also available for immediate download and adjustment. So, changes can be made in the color, design, graphics or any other component to create a unique layout.

Lower Costs Relative To Competitor Ppt Sample
This is a lower costs relative to competitor ppt sample. This is a four stage process. The stages in this process are lower costs relative to competitor, border or more attractive product line, superior customer service, wide geographic coverage.

Sample Of Operation Management Topics Diagram Powerpoint Show
This is a sample of operation management topics diagram powerpoint show. This is a eight stage process. The stages in this process are scheduling, aggregate planning, inventory, forecasting, strategy, quality, quality tools, flow and waiting lines.
 Home
Home