Line Graph
Business Diagram Bar Graph With Different Icons For Business Presentation Template
Our above diagram slide displays bar graph graph that shows relationships between different data series. Use this diagram in your presentations to get good remarks from your viewers.

Arrow Around Bar Graph Business PowerPoint Templates And PowerPoint Themes 0712
Arrow Around Bar Graph Business PowerPoint Templates And PowerPoint Themes 0712-Microsoft Powerpoint Templates and Background with circular arrow placed around the bottom of a multi color bar chart
Metallic Arrow Around Bar Graph Finance PowerPoint Templates And PowerPoint Themes 0712
Metallic Arrow Around Bar Graph Finance PowerPoint Templates And PowerPoint Themes 0712-Microsoft Powerpoint Templates and Background with circular arrow placed around the bottom of a bar chart

Trend Chart Depicting Diminishing Graph And Chart Sales And Production Structure PDF
Pitch your topic with ease and precision using this Trend Chart Depicting Diminishing Graph And Chart Sales And Production Structure PDF. This layout presents information on Trend Chart Depicting, Diminishing Graph, Chart Sales And Production. It is also available for immediate download and adjustment. So, changes can be made in the color, design, graphics or any other component to create a unique layout.

Blue Dollar Graph Up Business PowerPoint Templates And PowerPoint Themes 0712
Blue Dollar Graph Up Business PowerPoint Templates And PowerPoint Themes 0712-Microsoft Powerpoint Templates and Background with arrow diagram moving up over dollar graph bar

Bar Graph Showing Revenues Generated By Sales Department Ppt Portfolio Graphics Example PDF
This graph or chart is linked to excel, and changes automatically based on data. Just left click on it and select edit data. Showcasing this set of slides titled bar graph showing revenues generated by sales department ppt portfolio graphics example pdf. The topics addressed in these templates are yearly sales revenues, sales team, profits. All the content presented in this PPT design is completely editable. Download it and make adjustments in color, background, font etc. as per your unique business setting.

IT Security Evaluation Scorecard With Bar Graph Ppt Gallery Design Templates PDF
This graph or chart is linked to excel, and changes automatically based on data. Just left click on it and select Edit Data. Deliver and pitch your topic in the best possible manner with this IT Security Evaluation Scorecard With Bar Graph Ppt Gallery Design Templates PDF. Use them to share invaluable insights on CPU Utilization Memory, Utilization Packet Loss and impress your audience. This template can be altered and modified as per your expectations. So, grab it now.

Area Graph Displaying Yearly Performance Analysis Ppt PowerPoint Presentation Slides Diagrams
Presenting this set of slides with name area graph displaying yearly performance analysis ppt powerpoint presentation slides diagrams. The topics discussed in these slide is area graph displaying yearly performance analysis. This is a completely editable PowerPoint presentation and is available for immediate download. Download now and impress your audience.

Sales By Area Graph Showing Revenue From Top Countries Inspiration PDF
Showcasing this set of slides titled Sales By Area Graph Showing Revenue From Top Countries Inspiration PDF. The topics addressed in these templates are Sales Area, Graph Showing, Revenue Countries. All the content presented in this PPT design is completely editable. Download it and make adjustments in color, background, font etc. as per your unique business setting.

Business Graph Showing Factor Income Trend Ppt PowerPoint Presentation Slides Mockup
Presenting this set of slides with name business graph showing factor income trend ppt powerpoint presentation slides mockup. The topics discussed in these slide is business graph showing factor income trend. This is a completely editable PowerPoint presentation and is available for immediate download. Download now and impress your audience.
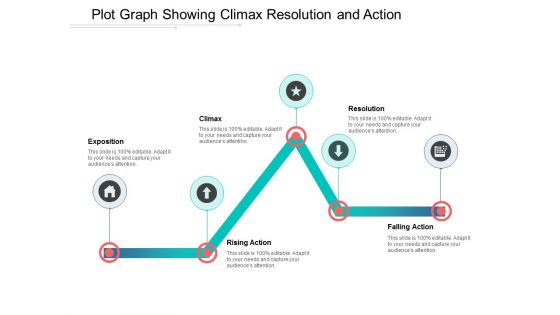
Plot Graph Showing Climax Resolution And Action Ppt Powerpoint Presentation Outline Themes
This is a plot graph showing climax resolution and action ppt powerpoint presentation outline themes. This is a five stage process. The stages in this process are scatter plot, probability plots, plot diagram.
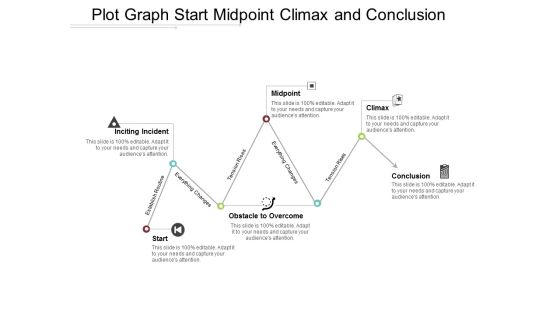
Plot Graph Start Midpoint Climax And Conclusion Ppt Powerpoint Presentation Portfolio Microsoft
This is a plot graph start midpoint climax and conclusion ppt powerpoint presentation portfolio microsoft. This is a six stage process. The stages in this process are scatter plot, probability plots, plot diagram.
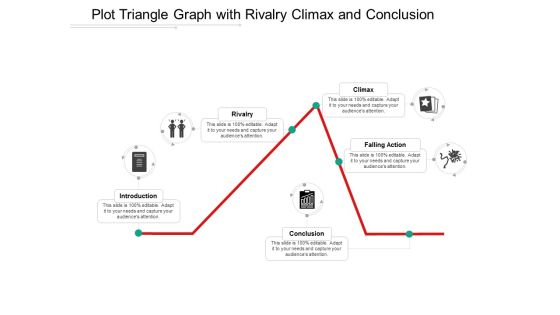
Plot Triangle Graph With Rivalry Climax And Conclusion Ppt Powerpoint Presentation Ideas Design Inspiration
This is a plot triangle graph with rivalry climax and conclusion ppt powerpoint presentation ideas design inspiration. This is a five stage process. The stages in this process are scatter plot, probability plots, plot diagram.

Business Education PowerPoint Templates Business Bar Graph Data Driven Ppt Slides
Business Education PowerPoint Templates Business bar graph data driven PPT Slides-This PowerPoint slide is a data driven Columns Chart. The number of columns depend on the data.-Business Editable PowerPoint Templates Business beveled column chart PPT Slides-This ppt can be used for concepts relating to-chart,, graph, growth, investment, , market, percentage, , presentation report, results, statistics, stock, success and business.
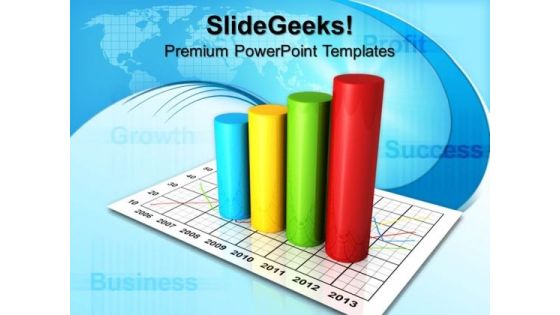
Business Circular Bar Graph Success PowerPoint Templates And PowerPoint Themes 0912
Business Circular Bar Graph Success PowerPoint Templates And PowerPoint Themes Presentations-Microsoft Powerpoint Templates and Background with circular business bar graph-Business Circular Bar Graph Success PowerPoint Templates And PowerPoint Themes PresentationsThis PPT can be used for presentations relating to-Circular business bar graph, cylinders, success, business, marketing, finance

Dollar And Bar Graph Metaphor PowerPoint Templates And PowerPoint Themes 1012
Dollar And Bar Graph Metaphor PowerPoint Templates And PowerPoint Themes 1012-Microsoft Powerpoint Templates and Background with dollar and bar graph-Dollar And Bar Graph Metaphor PowerPoint Templates And PowerPoint Themes 1012-This PowerPoint template can be used for presentations relating to-Dollar and bar graph, money, signs, finance, business, success

Bar Graph Showing Technology Trend Analysis Ppt PowerPoint Presentation File Mockup PDF
Presenting this set of slides with name bar graph showing technology trend analysis ppt powerpoint presentation file mockup pdf. The topics discussed in these slides are expanding rapidly, shrinking slowly. This is a completely editable PowerPoint presentation and is available for immediate download. Download now and impress your audience.

Business Revenue Bar Graph With Business Operational Expenditure Details Summary PDF
This slide represents business revenue bar graph with OPEX details which can be referred by companies to earn more revenue by controlling expenditures. It also provides information about marketing and sales, research and development, administration, total revenue, etc. Pitch your topic with ease and precision using this Business Revenue Bar Graph With Business Operational Expenditure Details Summary PDF. This layout presents information on Cost Of Marketing, Sales, Highest Amount. It is also available for immediate download and adjustment. So, changes can be made in the color, design, graphics or any other component to create a unique layout.

Bar Graph Depicting Liquidity Ratio Analysis For 5 Years Graphics PDF
This showcases bar graph that can help organization to compare the liquidity ratios and take mitigation actions in case of decline. It showcases comparison of cash, quick and current ratio for a period of 5 financial years. Showcasing this set of slides titled Bar Graph Depicting Liquidity Ratio Analysis For 5 Years Graphics PDF. The topics addressed in these templates are Organization To Compare, The Liquidity Ratios, Mitigation Action Decline. All the content presented in this PPT design is completely editable. Download it and make adjustments in color, background, font etc. as per your unique business setting.

Charity Fundraising Marketing Plan Bar Graph Ppt PowerPoint Presentation File Example Introduction PDF
Find highly impressive Charity Fundraising Marketing Plan Bar Graph Ppt PowerPoint Presentation File Example Introduction PDF on Slidegeeks to deliver a meaningful presentation. You can save an ample amount of time using these presentation templates. No need to worry to prepare everything from scratch because Slidegeeks experts have already done a huge research and work for you. You need to download Charity Fundraising Marketing Plan Bar Graph Ppt PowerPoint Presentation File Example Introduction PDF for your upcoming presentation. All the presentation templates are 100 percent editable and you can change the color and personalize the content accordingly. Download now.
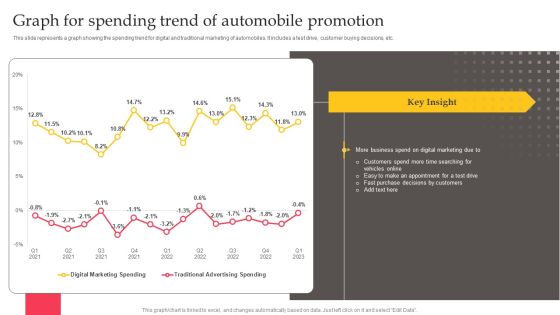
Executing Automotive Marketing Tactics For Sales Boost Graph For Spending Trend Information PDF
This slide represents a graph showing the spending trend for digital and traditional marketing of automobiles. It includes a test drive, customer buying decisions, etc. There are so many reasons you need a Executing Automotive Marketing Tactics For Sales Boost Graph For Spending Trend Information PDF. The first reason is you can not spend time making everything from scratch, Thus, Slidegeeks has made presentation templates for you too. You can easily download these templates from our website easily.

Business Diagram Bar Graph Style Timeline Diagram For Business Presentation Template
This business slide has been designed with bar graph style timeline diagram. Download this diagram to depict business annual plans and growth on your presentations. Make your presentations outshine using this diagram slide.
Dollar Mobile Bar Graph And Monitor Icons In Circles Powerpoint Templates
Our above slide has been designed with dollar, mobile, bar graph and monitor icons. This infographic slide is best to describe text information. You can provide a fantastic explanation of the topic with this slide.

Bar Graph Shows Financial Values Ppt PowerPoint Presentation Infographic Template Gridlines
This is a bar graph shows financial values ppt powerpoint presentation infographic template gridlines. This is a two stage process. The stages in this process are bar, marketing, strategy, finance, planning.

5 Level Bar Graph For Analysis With Icons Ppt PowerPoint Presentation Shapes
This is a 5 level bar graph for analysis with icons ppt powerpoint presentation shapes. This is a five stage process. The stages in this process are business, strategy, marketing, icons, growth, management.

Bar Graph To Show Company Sales Budget Ppt PowerPoint Presentation Sample
This is a bar graph to show company sales budget ppt powerpoint presentation sample. This is a four stage process. The stages in this process are business, finance, growth, success, marketing, arrow.

Bar Graph Icon For Data Analysis Ppt PowerPoint Presentation Pictures Ideas
This is a bar graph icon for data analysis ppt powerpoint presentation pictures ideas. This is a four stage process. The stages in this process are financial analysis, quantitative, statistical modelling.

Bar Graph Finance Planning Ppt PowerPoint Presentation Infographic Template Master Slide
This is a bar graph finance planning ppt powerpoint presentation infographic template master slide. This is a two stage process. The stages in this process are finance, analysis, business, investment, marketing.

Stock Photo World Map On Bar Graph For Data Growth Image Graphics For PowerPoint Slide
This image is designed with blue graph with world map printed on it. This conceptual image portrays the concepts of global business and global economy. This image slide will help you express your views to target audience.
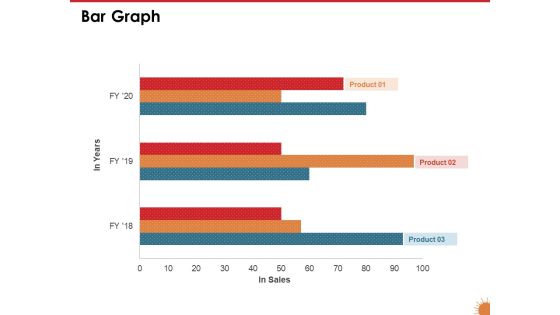
Impact Of COVID 19 On The Hospitality Industry Bar Graph Portrait PDF
Presenting this set of slides with name impact of covid 19 on the hospitality industry bar graph portrait pdf. The topics discussed in these slide is bar chart. This is a completely editable PowerPoint presentation and is available for immediate download. Download now and impress your audience.

Bar Graph Showing Car Production Report Ppt PowerPoint Presentation Outline Master Slide PDF
Presenting this set of slides with name bar graph showing car production report ppt powerpoint presentation outline master slide pdf. The topics discussed in these slides are sedan model, hatchbacks model, 2017 to 2020. This is a completely editable PowerPoint presentation and is available for immediate download. Download now and impress your audience.

Bar Graph Showing Increase In Annual Cost Ppt PowerPoint Presentation Infographic Template Inspiration PDF
Presenting this set of slides with name bar graph showing increase in annual cost ppt powerpoint presentation infographic template inspiration pdf. The topics discussed in these slides are 2015 to 2020. This is a completely editable PowerPoint presentation and is available for immediate download. Download now and impress your audience.

Bar Graph Showing Sales Projections Ppt PowerPoint Presentation Styles Graphics Download PDF
Presenting this set of slides with name bar graph showing sales projections ppt powerpoint presentation styles graphics download pdf. The topics discussed in these slides are Sales, Forecasted Sales. This is a completely editable PowerPoint presentation and is available for immediate download. Download now and impress your audience.

Bar Graph Showing Imported And Domestic Film Profit Ppt PowerPoint Presentation Icon Model PDF
Presenting this set of slides with name bar graph showing imported and domestic film profit ppt powerpoint presentation icon model pdf. The topics discussed in these slides are imported films, domestic films. This is a completely editable PowerPoint presentation and is available for immediate download. Download now and impress your audience.

Bar Graph Showing Profit Analysis Ppt PowerPoint Presentation Icon Deck PDF
Presenting this set of slides with name bar graph showing profit analysis ppt powerpoint presentation icon deck pdf. The topics discussed in these slides are gross revenue, income. This is a completely editable PowerPoint presentation and is available for immediate download. Download now and impress your audience.
Bar Graph Showing Of Business Income And Expenditure Ppt PowerPoint Presentation Icon Show PDF
Presenting this set of slides with name bar graph showing of business income and expenditure ppt powerpoint presentation icon show pdf. The topics discussed in these slides are expenses, revenue. This is a completely editable PowerPoint presentation and is available for immediate download. Download now and impress your audience.

Business Power Consumption Statistics Bar Graph Ppt PowerPoint Presentation Gallery Slides PDF
Presenting this set of slides with name business power consumption statistics bar graph ppt powerpoint presentation gallery slides pdf. The topics discussed in these slides are electricity, consumption, plant. This is a completely editable PowerPoint presentation and is available for immediate download. Download now and impress your audience.

Bar Graph For Business Sales And Profit Assessment Ppt PowerPoint Presentation File Tips PDF
Presenting this set of slides with name bar graph for business sales and profit assessment ppt powerpoint presentation file tips pdf. The topics discussed in these slides are sales, gross margin, net profit. This is a completely editable PowerPoint presentation and is available for immediate download. Download now and impress your audience.

Bar Graph For Return On Investment Analysis Ppt PowerPoint Presentation Infographics Structure PDF
Presenting this set of slides with name bar graph for return on investment analysis ppt powerpoint presentation infographics structure pdf. The topics discussed in these slides are sales, roi. This is a completely editable PowerPoint presentation and is available for immediate download. Download now and impress your audience.

Bar Graph Showing License Users Of Three Countries Ppt PowerPoint Presentation Outline Guide PDF
Presenting this set of slides with name bar graph showing license users of three countries ppt powerpoint presentation outline guide pdf. The topics discussed in these slides are 2017 to 2020. This is a completely editable PowerPoint presentation and is available for immediate download. Download now and impress your audience.

Bar Graph Showing Profit Ratio Analysis Ppt PowerPoint Presentation Styles Brochure PDF
Presenting this set of slides with name bar graph showing profit ratio analysis ppt powerpoint presentation styles brochure pdf. The topics discussed in these slides are 2015 to 2020. This is a completely editable PowerPoint presentation and is available for immediate download. Download now and impress your audience.

Bar Graph Showing Sales Cost And Profit Analysis Ppt PowerPoint Presentation Infographics Images PDF
Presenting this set of slides with name bar graph showing sales cost and profit analysis ppt powerpoint presentation infographics images pdf. The topics discussed in these slides are sales, cost, roi, profit. This is a completely editable PowerPoint presentation and is available for immediate download. Download now and impress your audience.

Bar Graph Showing The Reasons Behind Bad Employee Performance Ppt PowerPoint Presentation Slides Tips PDF
Presenting this set of slides with name bar graph showing the reasons behind bad employee performance ppt powerpoint presentation slides tips pdf. The topics discussed in these slides are work environment, job satisfaction, promotion prospects, respect from colleagues, job security, competent boss, relaxed working environment. This is a completely editable PowerPoint presentation and is available for immediate download. Download now and impress your audience.
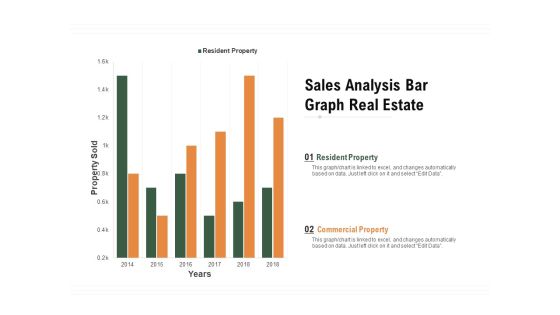
Sales Analysis Bar Graph Real Estate Ppt PowerPoint Presentation Infographic Template Show PDF
Pitch your topic with ease and precision using this sales analysis bar graph real estate ppt powerpoint presentation infographic template show pdf. This layout presents information on resident property, commercial property, property sold, 2014 to 2018. It is also available for immediate download and adjustment. So, changes can be made in the color, design, graphics or any other component to create a unique layout.

Bar Graph Depicting Hike In Price Rate In Recent Years Ppt PowerPoint Presentation Gallery Guidelines PDF
Showcasing this set of slides titled bar graph depicting hike in price rate in recent years ppt powerpoint presentation gallery guidelines pdf. The topics addressed in these templates are prices, target, inflation rate. All the content presented in this PPT design is completely editable. Download it and make adjustments in color, background, font etc. as per your unique business setting.
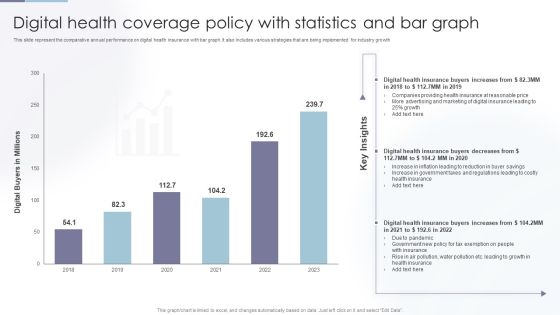
Digital Health Coverage Policy With Statistics And Bar Graph Clipart PDF
Showcasing this set of slides titled Digital Health Coverage Policy With Statistics And Bar Graph Clipart PDF. The topics addressed in these templates are Digital Health, Health Insurance, Insurance At Reasonable. All the content presented in this PPT design is completely editable. Download it and make adjustments in color, background, font etc. as per your unique business setting.

Horizontal Bar Graph With Profit Percentage Of Company Ppt PowerPoint Presentation Shapes
This is a horizontal bar graph with profit percentage of company ppt powerpoint presentation shapes. This is a five stage process. The stages in this process are business, strategy, marketing, analysis, slide bar, target.
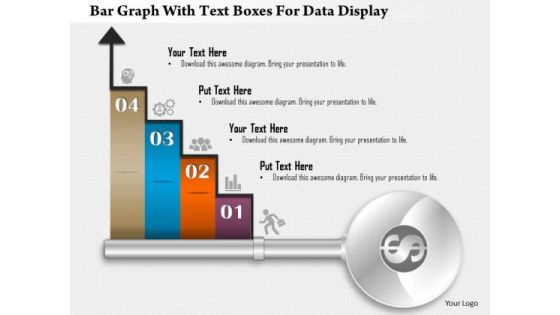
Business Diagram Bar Graph With Text Boxes For Data Display Presentation Template
Our above business diagram displays bar graph. It contains four steps on bar graph with icons. Use this diagram to display four stages of business growth. Download this Power Point slide to build quality presentation for your viewers.

Area Graph Showing Sales Trends Over Time Ppt PowerPoint Presentation Model Background Designs
This is a area graph showing sales trends over time ppt powerpoint presentation model background designs. This is a three stage process. The stages in this process are financial analysis, quantitative, statistical modelling.

Cost Reduction Bar Graph For Organization Optimization Ppt Inspiration Vector PDF
This slide represent cost saving with benefits in an organization and areas where more efficiencies are utilized. It includes travel, administrative and hiring. Pitch your topic with ease and precision using this Cost Reduction Bar Graph For Organization Optimization Ppt Inspiration Vector PDF. This layout presents information on Total Cost Benefits, Promoting Employees, Providing Perks. It is also available for immediate download and adjustment. So, changes can be made in the color, design, graphics or any other component to create a unique layout.

Business Diagram Graph Of Sustainable Environment With Business Growth Presentation Template
This diagram displays bar graph with globes and growth arrow. This image depicts concepts of green environment and business growth .Use this diagram to present your views in a wonderful manner.

Financial Projection Graph Template 1 Ppt PowerPoint Presentation Professional Example Introduction
This is a financial projection graph template 1 ppt powerpoint presentation professional example introduction. This is a three stage process. The stages in this process are business, bar graph, finance, marketing, strategy, analysis.

Financial Projection Graph Template 2 Ppt PowerPoint Presentation Infographic Template Gallery
This is a financial projection graph template 2 ppt powerpoint presentation infographic template gallery. This is a three stage process. The stages in this process are business, bar graph, finance, marketing, strategy, analysis.

Employee Retention Graph For Hotel Business Ppt PowerPoint Presentation Show Skills PDF
Presenting this set of slides with name employee retention graph for hotel business ppt powerpoint presentation show skills pdf. The topics discussed in these slides are bar, counter, kitchen, management, other, server, support. This is a completely editable PowerPoint presentation and is available for immediate download. Download now and impress your audience.

Circular Bar Graph Business Success PowerPoint Templates And PowerPoint Themes 1012
Circular Bar Graph Business Success PowerPoint Templates And PowerPoint Themes 1012-The above template displays a diagram of blue circular progress bars. This image represent the concept of business growth and success. This template imitates economy, finance, global, goal, growth, ideas, information, management, profit and statistics. This image has been conceived to enable you to emphatically communicate your ideas in your Business and Marketing PPT presentations. Use this template for financial analysis, business reviews and statistics. Go ahead and add charm to your presentations with our high quality template.-Circular Bar Graph Business Success PowerPoint Templates And PowerPoint Themes 1012-This PowerPoint template can be used for presentations relating to-Circular success graph, marketing, business, finance, success, circle charts
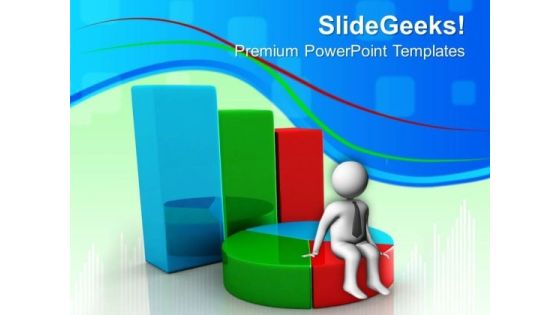
Bar Graph And Pie Chart Marketing PowerPoint Templates And PowerPoint Themes 0612
Bar Graph And Pie Chart Marketing PowerPoint Templates And PowerPoint Themes 0612-Microsoft Powerpoint Templates and Background with bar and pie chart
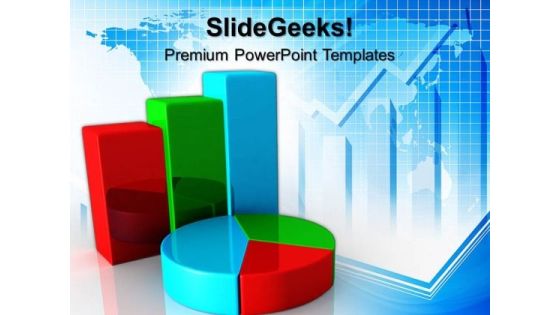
Bar Graph And Pie Chart Global PowerPoint Templates And PowerPoint Themes 0612
Bar Graph And Pie Chart Global PowerPoint Templates And PowerPoint Themes Business PPT Templates-Bar and pie chart, background, business, success, finance, marketing
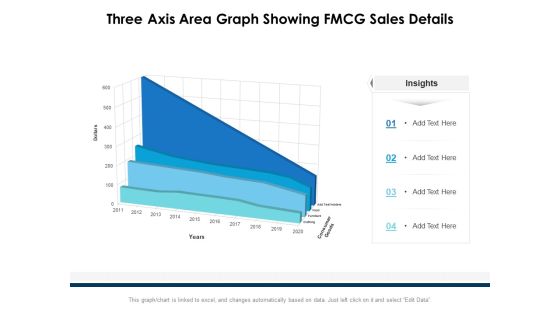
Three Axis Area Graph Showing FMCG Sales Details Ppt PowerPoint Presentation Ideas Layouts PDF
Presenting this set of slides with name three axis area graph showing fmcg sales details ppt powerpoint presentation ideas layouts pdf. The topics discussed in these slides are consumer goods, dollars, 2011 to 2020. This is a completely editable PowerPoint presentation and is available for immediate download. Download now and impress your audience.

Bar Graph And Pie Chat Business PowerPoint Templates And PowerPoint Themes 0712
Bar Graph And Pie Chat Business PowerPoint Templates And PowerPoint Themes 0712-Microsoft Powerpoint Templates and Background with bar and pie chart

Lego Bar Graph Building Business PowerPoint Templates And PowerPoint Themes 0512
Lego Bar Graph Building Business PowerPoint Templates And PowerPoint Themes PPT designs-Microsoft Powerpoint Templates and Background with achievement chart from building blocks
 Home
Home