Line Graph

Bar Graph Depicting Integrated Business Planning Across Organization Designs PDF
This slide shows graphical representation of integrated planning across different areas of organization which includes sales or business development, marketing, finance and production with best in class, average and laggard Showcasing this set of slides titled bar graph depicting integrated business planning across organization designs pdf. The topics addressed in these templates are bar graph depicting integrated business planning across organization. All the content presented in this PPT design is completely editable. Download it and make adjustments in color, background, font etc. as per your unique business setting.

Graph With Dollar Money PowerPoint Templates And PowerPoint Backgrounds 0511
Microsoft PowerPoint Template and Background with bar graph with dollars and a blue upward arrow
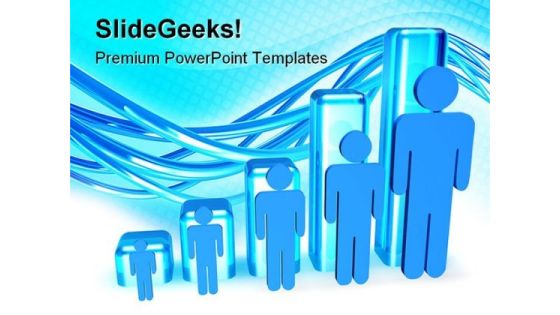
Manpower Graph People PowerPoint Templates And PowerPoint Backgrounds 0811
Microsoft PowerPoint Template and Background with bar graph showing increase in people size

Manpower Graph People PowerPoint Themes And PowerPoint Slides 0811
Microsoft PowerPoint Theme and slide with bar graph showing increase in people size
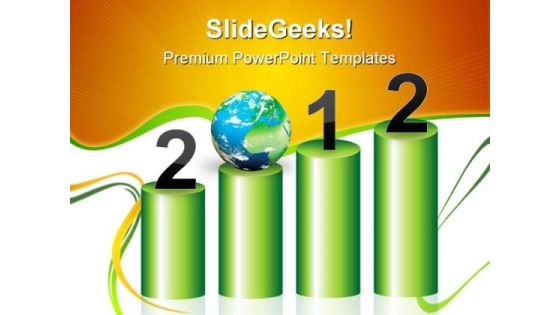
Graph 2012 Global PowerPoint Templates And PowerPoint Backgrounds 1211
Microsoft PowerPoint Template and Background with 2012 and globe on bar graph

Profit Graph Business PowerPoint Templates And PowerPoint Backgrounds 1211
Microsoft PowerPoint Template and Background with bar graph with rising arrow showing profit

Success Graph Business PowerPoint Templates And PowerPoint Backgrounds 1211
Microsoft PowerPoint Template and Background with bar graph with rising arrow showing success

Graph With Arrow Business PowerPoint Templates And PowerPoint Themes 0212
Microsoft Powerpoint Templates and Background with bar graph with rising arrow

Success Graph Business PowerPoint Templates And PowerPoint Themes 0212
Microsoft Powerpoint Templates and Background with bar graph with rising arrow

Lego Graph Business PowerPoint Templates And PowerPoint Themes 0412
Microsoft Powerpoint Templates and Background with Lego Blocks Showing success bar graph

3d Puzzle 11 Staged Process Diagram Ppt Line Business Plan PowerPoint Templates
We present our 3d puzzle 11 staged process diagram ppt line business plan PowerPoint templates.Present our Success PowerPoint Templates because You can Zap them with our PowerPoint Templates and Slides. See them reel under the impact. Present our Business PowerPoint Templates because They will Put your wonderful verbal artistry on display. Our PowerPoint Templates and Slides will provide you the necessary glam and glitter. Download and present our Puzzles or Jigsaws PowerPoint Templates because Our PowerPoint Templates and Slides will fulfill your every need. Use them and effectively satisfy the desires of your audience. Use our Arrows PowerPoint Templates because You are working at that stage with an air of royalty. Let our PowerPoint Templates and Slides be the jewels in your crown. Present our Process and Flows PowerPoint Templates because Our PowerPoint Templates and Slides are truly out of this world. Even the MIB duo has been keeping tabs on our team.Use these PowerPoint slides for presentations relating to diagram, flow, arrow, process, chart, round, puzzle, circular, ring, stage, motion, around, sequence, loop, step, refresh, business, concept, curving, success, rotation, presentation, relate, circle, recycle, graphic, element, flowchart, report, work flow, simple, react, repeat, cycle, circulation, illustration, system, strategy, section, reflection, direction, color, colorful, swirl, phase, procedure, movement, part, background, repetition. The prominent colors used in the PowerPoint template are Green, White, Gray.

Bar Graph Percentage Product Ppt PowerPoint Presentation Styles Good
This is a bar graph percentage product ppt powerpoint presentation styles good. This is a three stage process. The stages in this process are area chart, finance, marketing, management, investment.
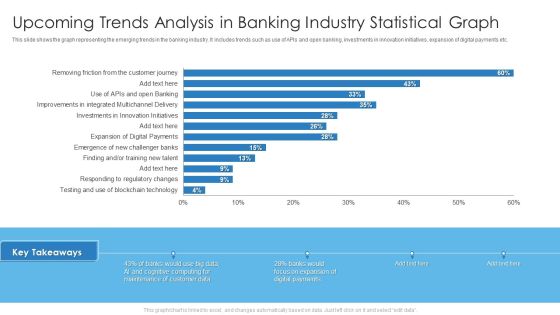
Upcoming Trends Analysis In Banking Industry Statistical Graph Brochure PDF
This slide shows the graph representing the emerging trends in the banking industry. It includes trends such as use of APIs and open banking, investments in innovation initiatives, expansion of digital payments etc. Deliver and pitch your topic in the best possible manner with this Upcoming Trends Analysis In Banking Industry Statistical Graph Brochure PDF. Use them to share invaluable insights on Upcoming Trends Analysis, Banking Industry Statistical Graph and impress your audience. This template can be altered and modified as per your expectations. So, grab it now.

Business Operational Expenditure Bar Graph With Annual Variances Brochure PDF
This slide showcases operating expenditure OPEX bar graph with annual variances assisting companies in controlling the difference of allocated budgets. It also includes information about planned expenses, actual expenses, marketing costs, office costs, employee costs, training, etc. Showcasing this set of slides titled Business Operational Expenditure Bar Graph With Annual Variances Brochure PDF. The topics addressed in these templates are Employee Costs, Planned Expenses, Training Costs. All the content presented in this PPT design is completely editable. Download it and make adjustments in color, background, font etc. as per your unique business setting.

Bar Graph Growth Success PowerPoint Templates And PowerPoint Themes 0712
Bar Graph Gowth Success PowerPoint Templates And PowerPoint Themes 0712-Microsoft Powerpoint Templates and Background with bar chart growth

Profits Bar Graph Finance PowerPoint Templates And PowerPoint Themes 0712
Profits Bar Graph Finance PowerPoint Templates And PowerPoint Themes 0712-Microsoft Powerpoint Templates and Background with profits bar chart

Projects And Assignments Bar Graph Ppt Sample Download
This is a projects and assignments bar graph ppt sample download. This is a five stage process. The stages in this process are business, process, marketing, strategy, graph chart, management.

Distributed Network Graph Algorithm Ppt Powerpoint Presentation Outline Master Slide
This is a distributed network graph algorithm ppt powerpoint presentation outline master slide. This is a four stage process. The stages in this process are scatter plot, probability plots, plot diagram.

Bar Graph Chart Analysis Ppt PowerPoint Presentation Outline Good
Presenting this set of slides with name bar graph chart analysis ppt powerpoint presentation outline good. The topics discussed in these slides are finance, marketing, management, investment, analysis. This is a completely editable PowerPoint presentation and is available for immediate download. Download now and impress your audience.

Bar Graph Chart Analysis Ppt PowerPoint Presentation Gallery Objects
Presenting this set of slides with name bar graph chart analysis ppt powerpoint presentation gallery objects. The topics discussed in these slides are finance, marketing, management, investment, analysis. This is a completely editable PowerPoint presentation and is available for immediate download. Download now and impress your audience.
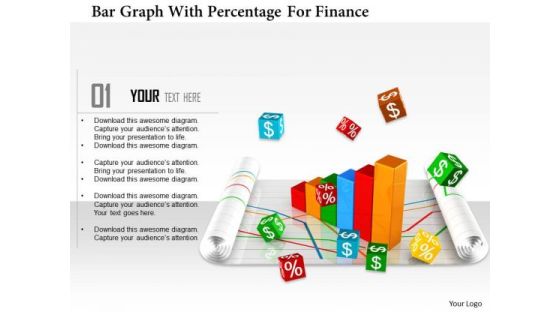
Stock Photo Bar Graph With Percentage For Finance PowerPoint Slide
This Power Point template has been designed with graphic of bar graph and percentage value. This image slide contains the concept of finance and accounting. Use this editable diagram for your business and finance related presentations.
Business Diagram Human Icon Bar Graph For Business Presentation Template
Graphic of human icons and bar graph has been used to decorate this power point template. This PPT contains the concept of business communication and result analysis. Use this PPT for business and marketing related presentations.

Bar Graph Ppt PowerPoint Presentation Infographic Template Deck
This is a bar graph ppt powerpoint presentation infographic template deck. This is a five stage process. The stages in this process are bar chart, business, marketing, strategy, planning.

Bar Graph For Descriptive Analysis Ppt PowerPoint Presentation Shapes
This is a bar graph for descriptive analysis ppt powerpoint presentation shapes. This is a five stage process. The stages in this process are icons, business, marketing, management, process.

Bar Graph Finance Ppt PowerPoint Presentation Infographics Background Designs
This is a bar graph finance ppt powerpoint presentation infographics background designs. This is a two stage process. The stages in this process are finance, analysis, business, investment, marketing.

Bar Graph Percentage Product Ppt PowerPoint Presentation Layouts Microsoft
This is a bar graph percentage product ppt powerpoint presentation layouts microsoft. This is a three stage process. The stages in this process are business, management, marketing, percentage, product.

Bar Graph Product Ppt PowerPoint Presentation Model Graphic Tips
This is a bar graph product ppt powerpoint presentation model graphic tips. This is a three stage process. The stages in this process are product, percentage, business, management, marketing.

Annual Graph For Human Resource Recruitment Trends Summary PDF
The slide shows the HR recruitment trend graph from year 2018 to 2022. It includes number of employees hired per year along with key takeaways. Pitch your topic with ease and precision using this Annual Graph For Human Resource Recruitment Trends Summary PDF. This layout presents information on Employee Recruitment, Rise Employee, Economic Reforms. It is also available for immediate download and adjustment. So, changes can be made in the color, design, graphics or any other component to create a unique layout.

Bar Graph Process Ppt PowerPoint Presentation Portfolio Designs Download
Presenting this set of slides with name bar graph process ppt powerpoint presentation portfolio designs download. The topics discussed in these slides are finance, marketing, management, investment, analysis. This is a completely editable PowerPoint presentation and is available for immediate download. Download now and impress your audience.

Bar Graph Investment Ppt PowerPoint Presentation Infographics Graphics Template
Presenting this set of slides with name bar graph investment ppt powerpoint presentation infographics graphics template. The topics discussed in these slides are finance, marketing, management, investment, analysis. This is a completely editable PowerPoint presentation and is available for immediate download. Download now and impress your audience.

Bar Graph Product Ppt PowerPoint Presentation Icon Layout
Presenting this set of slides with name bar graph product ppt powerpoint presentation icon layout. The topics discussed in these slides are finance, marketing, management, investment, analysis. This is a completely editable PowerPoint presentation and is available for immediate download. Download now and impress your audience.

Complete Brand Promotion Playbook Bar Graph Structure PDF
Deliver an awe inspiring pitch with this creative Complete Brand Promotion Playbook Bar Graph Structure PDF bundle. Topics like Product, Automatically, Excel Changes can be discussed with this completely editable template. It is available for immediate download depending on the needs and requirements of the user.

2018 To 2021 Sales Performance Clustered Bar Graph Graphics PDF
Showcasing this set of slides titled 2018 To 2021 Sales Performance Clustered Bar Graph Graphics PDF. The topics addressed in these templates are Range Of Profits, Increase In Production, Profits Are Stagnant. All the content presented in this PPT design is completely editable. Download it and make adjustments in color, background, font etc. as per your unique business setting.
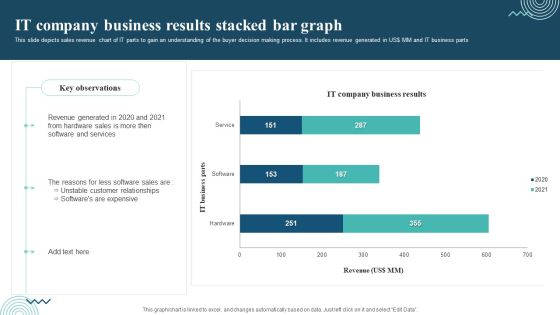
IT Company Business Results Stacked Bar Graph Topics PDF
Showcasing this set of slides titled IT Company Business Results Stacked Bar Graph Topics PDF. The topics addressed in these templates are Revenue Generated, Software And Services, Unstable Customer Relationships. All the content presented in this PPT design is completely editable. Download it and make adjustments in color, background, font etc. As per your unique business setting.
Profits And Discounts On Products Clustered Bar Graph Icons PDF
Showcasing this set of slides titled Profits And Discounts On Products Clustered Bar Graph Icons PDF. The topics addressed in these templates are Profits And Discounts, Less Discounts, Market Penetration. All the content presented in this PPT design is completely editable. Download it and make adjustments in color, background, font etc. as per your unique business setting.
Business Diagram Bar Graph Cube Bars Icons Presentation Template
This diagram displays four staged bar graph with icons. It contains bar graph to present four stages of any business process. Use this professional and customized business diagram in your PowerPoint presentations.

Bar Graph Showing Business Success Ppt PowerPoint Presentation Inspiration
This is a bar graph showing business success ppt powerpoint presentation inspiration. This is a five stage process. The stages in this process are business, success, marketing, management, strategy.

Bar Graph Ppt PowerPoint Presentation Visual Aids Model
This is a bar graph ppt powerpoint presentation visual aids model. This is a three stage process. The stages in this process are business, strategy, analysis, planning, sales in percentage.
Cylinder Bar Graph Business PowerPoint Templates And PowerPoint Themes 0512
Microsoft Powerpoint Templates and Background with bar graph-Cylinder Bar Graph Business PowerPoint Templates And PowerPoint Themes 0512-These PowerPoint designs and slide layouts can be used for themes relating to -Bar graph,success, marketing, sales, business, finance
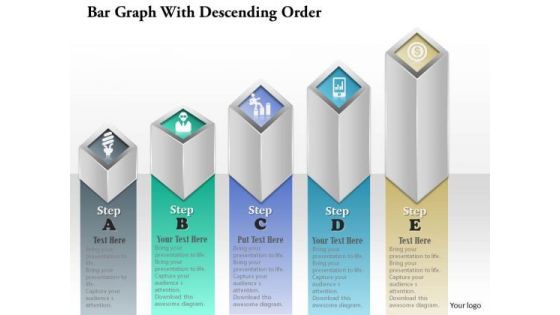
Business Diagram Bar Graph With Ascending Order Presentation Template
Our above diagram displays bar graph in ascending order. It contains bar graph with business icons. Use this amazing diagram for business communication or to present business reports. Download this diagram as a tool for business presentations.
Five Options Bar Graph With Icons Powerpoint Template
This PowerPoint slide has been designed with five options bar graph and icons. This slide of bar graph is suitable for statistical analysis. This professional slide helps in making an instant impact on viewers.

Profit Growth Bar Graph Over The Years Powerpoint Slide Graphics
This is a profit growth bar graph over the years powerpoint slide graphics. This is a four stage process. The stages in this process are bar graph, arrows, years, business, growth, marketing.

Revenue Growth For Bar Graph Ppt Examples Slides
This is a revenue growth for bar graph ppt examples slides. This is a five stage process. The stages in this process are bar graph, years, business, growth, marketing.

Bar Graph With Total Profit Analysis Ppt Images
This is a bar graph with total profit analysis ppt images. This is a nine stage process. The stages in this process are bar graph, business, marketing, growth, success.
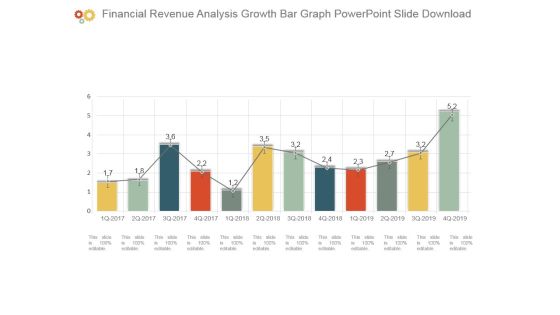
Financial Revenue Analysis Growth Bar Graph Powerpoint Slide Download
This is a financial revenue analysis growth bar graph powerpoint slide download. This is a twelve stage process. The stages in this process are bar graph, business, marketing, growth, success.
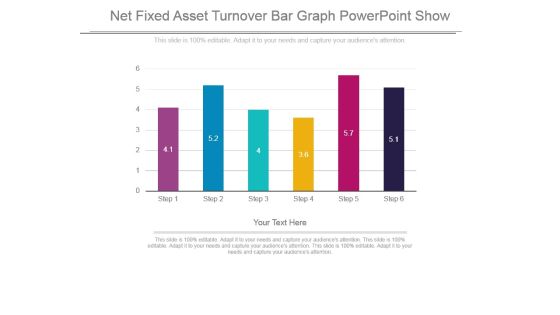
Net Fixed Asset Turnover Bar Graph Powerpoint Show
This is a net fixed asset turnover bar graph powerpoint show. This is a six stage process. The stages in this process are bar graph, presentation, strategy, business, management.

Bar Graph Ppt PowerPoint Presentation Infographic Template Pictures
This is a bar graph ppt powerpoint presentation infographic template pictures. This is a five stage process. The stages in this process are growth, bar graph, process, success, strategy.

Bar Graph Ppt PowerPoint Presentation Slides File Formats
This is a bar graph ppt powerpoint presentation slides file formats. This is a five stage process. The stages in this process are business, marketing, bar graph, timeline, analysis, planning.

Bar Graph Ppt PowerPoint Presentation Model Graphic Tips
This is a bar graph ppt powerpoint presentation model graphic tips. This is a two stage process. The stages in this process are we are dollars in millions, financials years, bar graph, product, business.

Bar Graph Ppt PowerPoint Presentation Icon Clipart Images
This is a bar graph ppt powerpoint presentation icon clipart images. This is a three stage process. The stages in this process are bar graph, finance, marketing, strategy, analysis.

Bar Graph Ppt PowerPoint Presentation Slides Background Image
This is a bar graph ppt powerpoint presentation slides background image. This is a six stage process. The stages in this process are bar graph, finance, marketing, analysis, business.

Bar Graph Ppt PowerPoint Presentation Outline File Formats
This is a bar graph ppt powerpoint presentation outline file formats. This is a nine stage process. The stages in this process are bar graph, business, management, success, strategy.

Bar Graph Ppt PowerPoint Presentation Infographics Slide Download
This is a bar graph ppt powerpoint presentation infographics slide download. This is a four stage process. The stages in this process are bar graph, finance, marketing, strategy, analysis.

Bar Graph Ppt PowerPoint Presentation Pictures Slide Portrait
This is a bar graph ppt powerpoint presentation pictures slide portrait. This is a four stage process. The stages in this process are bar graph, growth, success, business, marketing.

Bar Graph Ppt PowerPoint Presentation Infographic Template Graphics
This is a bar graph ppt powerpoint presentation infographic template graphics. This is a five stage process. The stages in this process are bar graph, finance, marketing, strategy, analysis, business.

Bar Graph Ppt PowerPoint Presentation Inspiration Format Ideas
This is a bar graph ppt powerpoint presentation inspiration format ideas. This is a four stage process. The stages in this process are bar graph, growth, success, business, marketing.

Bar Graph Ppt PowerPoint Presentation Ideas Graphic Tips
This is a bar graph ppt powerpoint presentation ideas graphic tips. This is a three stage process. The stages in this process are financial year, sales in percentage, product, bar graph, growth.

Bar Graph Ppt PowerPoint Presentation Model Graphics Design
This is a bar graph ppt powerpoint presentation model graphics design. This is a four stage process. The stages in this process are bar graph, growth, success, business, marketing.

Bar Graph Ppt PowerPoint Presentation Infographic Template Demonstration
This is a bar graph ppt powerpoint presentation infographic template demonstration. This is a two stage process. The stages in this process are bar graph, product, sales, percentage, financial.
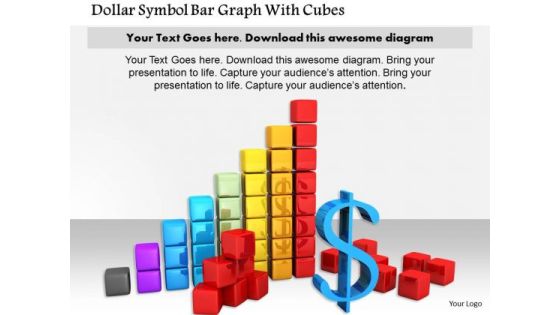
Stock Photo Dollar Symbol Bar Graph With Cubes PowerPoint Slide
This image slide contains bar graph of cubes with dollar symbol. This image is designed with dollar growth graph. Use this slide to display growth of profit in business presentations. Make an impressive presentation by using this image.
 Home
Home