Kpis

Campaign Performance Measurement Powerpoint Templates
This is a campaign performance measurement powerpoint templates. This is a four stage process. The stages in this process are brand, leads, sales, loyalty.

ITIL Strategy Service Excellence Measuring IT Staff Performance Cost Ppt PowerPoint Presentation File Background Image PDF
Presenting this set of slides with name itil strategy service excellence measuring it staff performance cost ppt powerpoint presentation file background image pdf. The topics discussed in these slides are cost, quality, productivity, service level. This is a completely editable PowerPoint presentation and is available for immediate download. Download now and impress your audience.

Project Performance Measurement With Revenue And Efficiency Ppt PowerPoint Presentation Infographics Elements PDF
Presenting this set of slides with name project performance measurement with revenue and efficiency ppt powerpoint presentation infographics elements pdf. This is a four stage process. The stages in this process are productivity, cost, efficiency, revenue. This is a completely editable PowerPoint presentation and is available for immediate download. Download now and impress your audience.

Ecommerce Data Driven Marketing Performance Analysis Dashboard Professional PDF
This slide represents the key metrics dashboard to track and analyze the performance of ecommerce business after implementing data driven marketing strategies. It includes details related to key metrics such as ecommerce revenue, new customers, repeat purchase rate etc. Get a simple yet stunning designed Ecommerce Data Driven Marketing Performance Analysis Dashboard Professional PDF. It is the best one to establish the tone in your meetings. It is an excellent way to make your presentations highly effective. So, download this PPT today from Slidegeeks and see the positive impacts. Our easy-to-edit Ecommerce Data Driven Marketing Performance Analysis Dashboard Professional PDF can be your go-to option for all upcoming conferences and meetings. So, what are you waiting for Grab this template today.

Analyzing And Deploying HR Analytics Diversity Dashboard Of Enterprise Inspiration PDF
This slide shows the key performance metrics dashboard showing data related to HR operations of an organization. It shows key metrics such as gender diversity by business unit, headcount by seniority and age banding etc. Want to ace your presentation in front of a live audience Our Analyzing And Deploying HR Analytics Diversity Dashboard Of Enterprise Inspiration PDF can help you do that by engaging all the users towards you. Slidegeeks experts have put their efforts and expertise into creating these impeccable powerpoint presentations so that you can communicate your ideas clearly. Moreover, all the templates are customizable, and easy-to-edit and downloadable. Use these for both personal and commercial use.
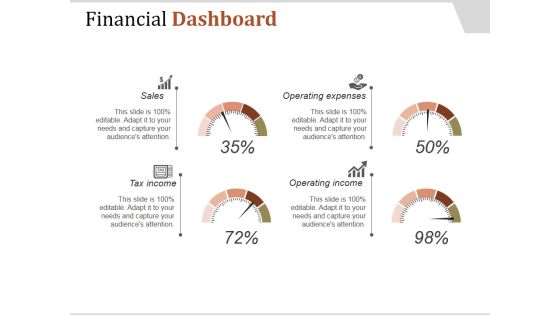
Financial Dashboard Ppt PowerPoint Presentation Influencers
This is a financial dashboard ppt powerpoint presentation influencers. This is a four stage process. The stages in this process are sales, tax income, operating income, operating expenses.
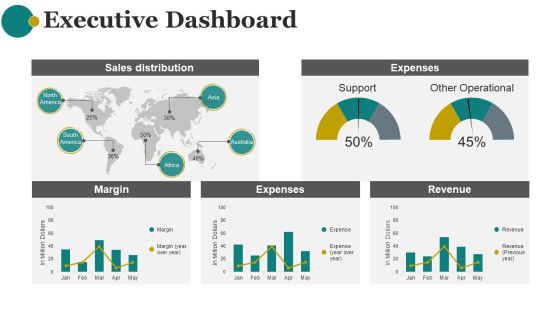
Executive Dashboard Ppt PowerPoint Presentation Graphics
This is a executive dashboard ppt powerpoint presentation graphics. This is a five stage process. The stages in this process are sales distribution, expenses, margin, expenses, revenue.
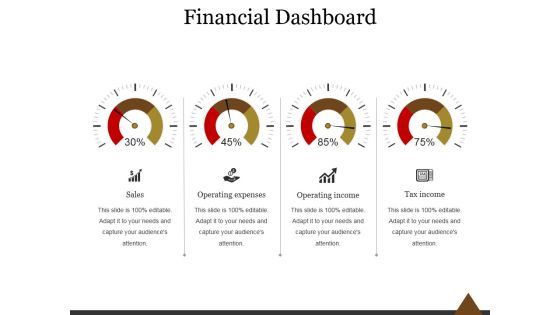
Financial Dashboard Ppt PowerPoint Presentation Information
This is a financial dashboard ppt powerpoint presentation information. This is a four stage process. The stages in this process are sales, operating expenses, operating income, tax income.

Dashboard Ppt PowerPoint Presentation Gallery Layouts
This is a dashboard ppt powerpoint presentation gallery layouts. This is a two stage process. The stages in this process are speed, meter, business, marketing, equipment.
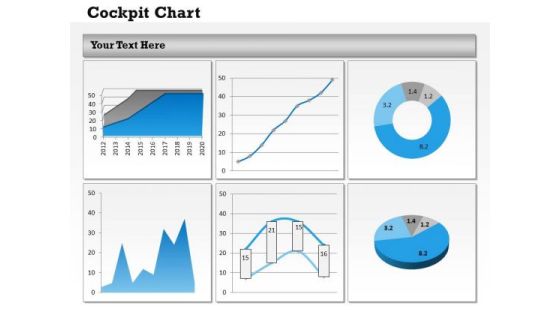
Business Cycle Diagram Organize Business Data In Dashboard Marketing Diagram
Get Out Of The Dock With Our Business Cycle Diagram Organize Business Data In Dashboard Marketing Diagram Powerpoint Templates. Your Mind Will Be Set Free.

Business Diagram Multiple Charts Business Dashboard Marketing Diagram
Document The Process On Our Business Diagram Multiple Charts Business Dashboard Marketing Diagram Powerpoint Templates. Make A Record Of Every Detail.
Business Framework Model Mind Dashboard Solution Concept Business Diagram
Our Business Framework Model Mind Dashboard Solution Concept Business Diagram Powerpoint Templates Team Are A Dogged Lot. They Keep At It Till They Get It Right.
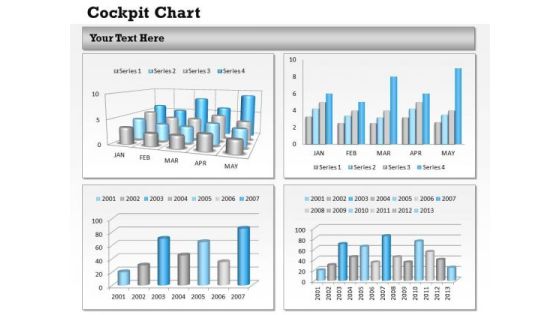
Marketing Diagram Data Driven Dashboard Style Consulting Diagram
Put In A Dollop Of Our Marketing Diagram Data Driven DashBoard Style Consulting Diagram Powerpoint Templates. Give Your Thoughts A Distinctive Flavor.

Mba Models And Frameworks Design Of Business Dashboard Consulting Diagram
Get The Domestics Right With Our MBA Models And Frameworks Design Of Business Dashboard Consulting Diagram Powerpoint Templates. Create The Base For Thoughts To Grow.
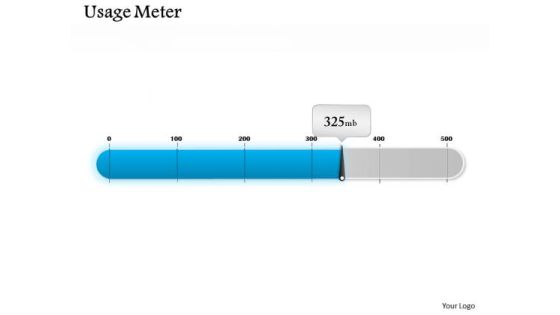
Mba Models And Frameworks Usage Meter Dashboard Design Consulting Diagram
Doll Up Your Thoughts With Our MBA Models And Frameworks Usage Meter Dashboard Design Consulting Diagram Powerpoint Templates. They Will Make A Pretty Picture.

Strategic Management Design Of Business Static Dashboard Marketing Diagram
Establish Your Dominion With Our Strategic Management Design Of Business Static Dashboard Marketing Diagram Powerpoint Templates. Rule The Stage With Your Thoughts.

Strategic Management Progress Meter Dashboard Design Marketing Diagram
Be A Donor Of Great Ideas. Display Your Charity On Our Strategic Management Progress Meter Dashboard Design Marketing Diagram Powerpoint Templates.

Business Framework Model Buisness Graph Dashboard Style Consulting Diagram
Get Out Of The Dock With Our Business Framework Model Business Graph Dashboard Style Consulting Diagram Powerpoint Templates. Your Mind Will Be Set Free.
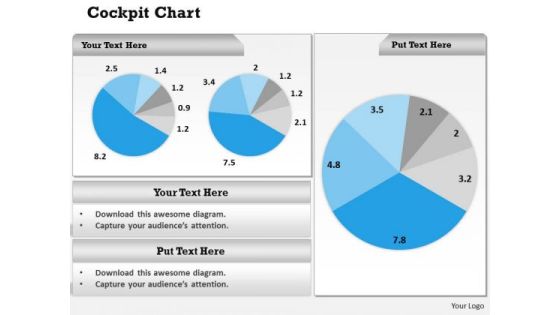
Business Framework Model Business Data Link In Dashboards Strategy Diagram
Document Your Views On Our Business Framework Model Business Data Link In Dashboards Strategy Diagram Powerpoint Templates. They Will Create A Strong Impression.
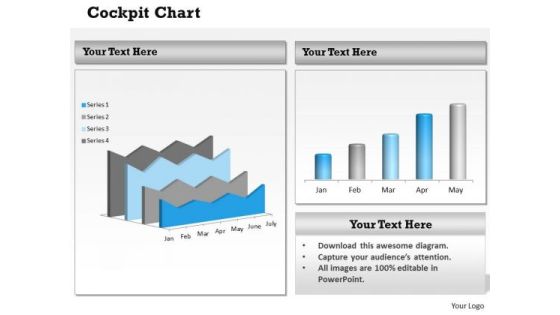
Consulting Diagram Business Dashboard Design Chart Sales Diagram
Document The Process On Our Consulting Diagram Business Dashboard Design Chart Sales Diagram Powerpoint Templates. Make A Record Of Every Detail.
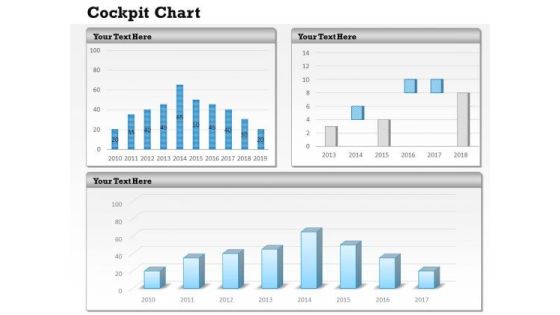
Marketing Diagram Business Intelligence Dashboard Design Sales Diagram
Our Marketing Diagram Business Intelligence Dashboard Design Sales Diagram Powerpoint Templates Team Are A Dogged Lot. They Keep At It Till They Get It Right.
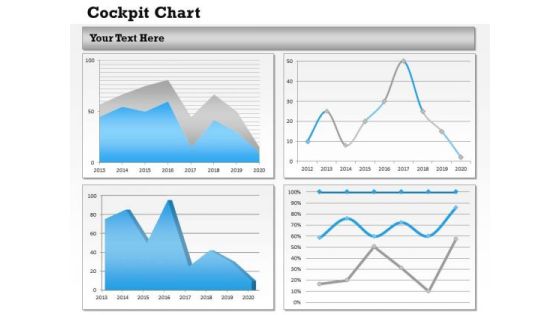
Mba Models And Frameworks Business Reports And Dashboards Consulting Diagram
Get The Doers Into Action. Activate Them With Our MBA Models And Frameworks Business Reports And Dashboards Consulting Diagram Powerpoint Templates.

Sales Diagram Business Charts Dashboard Design Strategic Management
Put In A Dollop Of Our Sales Diagram Business Charts Dashboard Design Strategic Management Powerpoint Templates. Give Your Thoughts A Distinctive Flavor.
Sales Diagram Business Reports In Dashboard Style Strategic Management
Get The Domestics Right With Our Sales Diagram Business Reports In Dashboard Style Strategic Management Powerpoint Templates. Create The Base For Thoughts To Grow.
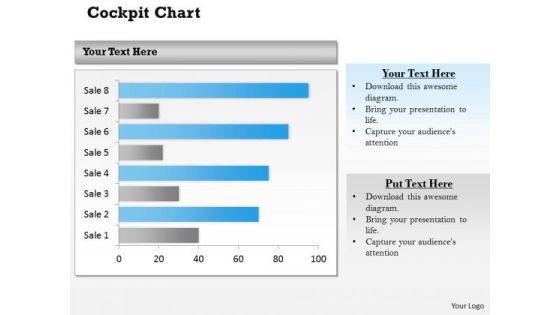
Strategic Management Business Graph Dashboard Layout Business Diagram
Doll Up Your Thoughts With Our Strategic Management Business Graph Dashboard Layout Business Diagram Powerpoint Templates. They Will Make A Pretty Picture.
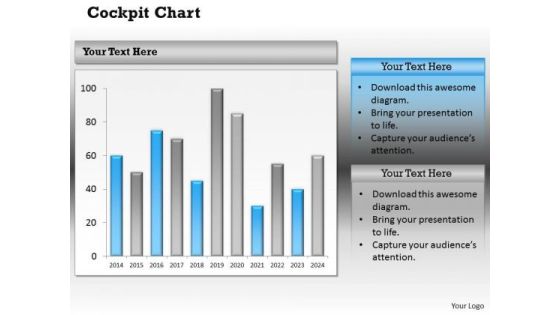
Business Cycle Diagram Dashboard For Executive Reports Strategy Diagram
Document Your Views On Our Business Cycle Diagram Dashboard For Executive Reports Strategy Diagram Powerpoint Templates. They Will Create A Strong Impression.
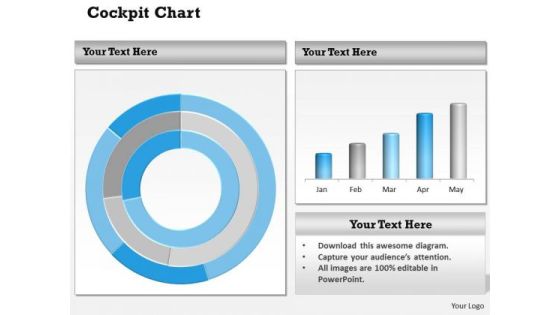
Business Diagram Dashboard Design For Business Communication Marketing Diagram
Document The Process On Our Business Diagram Dashboard Design For Business Communication Marketing Diagram Powerpoint Templates. Make A Record Of Every Detail.

Business Diagram Dashboard Design For Data Management Marketing Diagram
Be The Doer With Our Business Diagram Dashboard Design For Data Management Marketing Diagram Powerpoint Templates. Put Your Thoughts Into Practice.

Consulting Diagram Dashboard Business Information Chart Business Diagram
Get The Domestics Right With Our Consulting Diagram Dashboard Business Information Chart Business Diagram Powerpoint Templates. Create The Base For Thoughts To Grow.
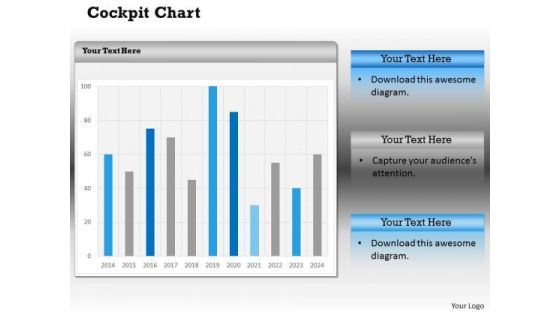
Consulting Diagram Dashboard Design For Quantitative Information Marketing Diagram
Doll Up Your Thoughts With Our Consulting Diagram Dashboard Design For Quantitative Information Marketing Diagram Powerpoint Templates. They Will Make A Pretty Picture.
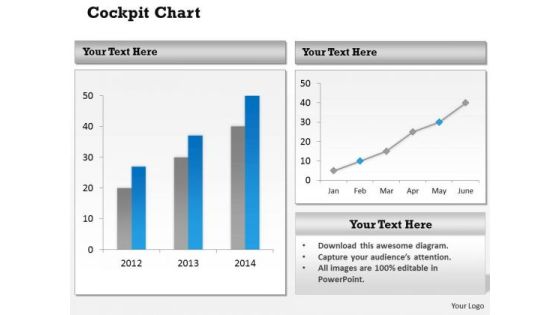
Consulting Diagram Dashboard Design With Data Structure Marketing Diagram
Establish The Dominance Of Your Ideas. Our Consulting Diagram Dashboard Design With Data Structure Marketing Diagram Powerpoint Templates Will Put Them On Top.
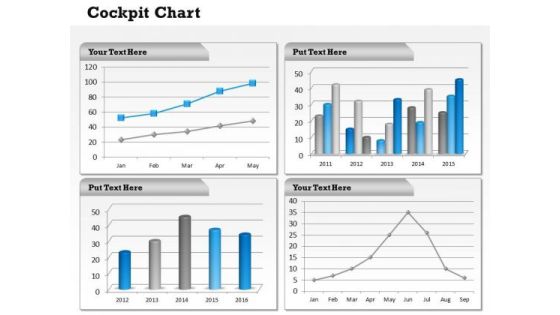
Consulting Diagram Dashboard Layout For Business Reporting Sales Diagram
Dominate Proceedings With Your Ideas. Our Consulting Diagram Dashboard Layout For Business Reporting Sales Diagram Powerpoint Templates Will Empower Your Thoughts.
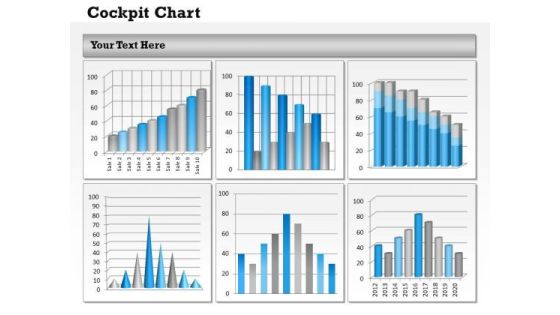
Consulting Diagram Dashboard To Visualize Business Data Consulting Diagram
Establish Your Dominion With Our Consulting Diagram Dashboard To Visualize Business Data Consulting Diagram Powerpoint Templates. Rule The Stage With Your Thoughts.
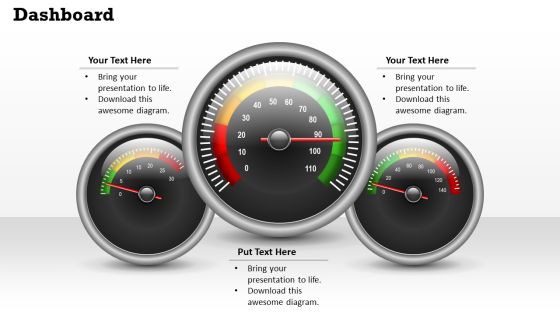
Marketing Diagram Dashboard To Compare Data Sales Diagram
Be A Donor Of Great Ideas. Display Your Charity On Our Marketing Diagram Dashboard To Compare Data Sales Diagram Powerpoint Templates.

Mba Models And Frameworks Dashboard Layout Business Design Sales Diagram
Open Up Doors That Lead To Success. Our MBA Models And Frameworks Dashboard Layout Business Design Sales Diagram Powerpoint Templates Provide The Handles.

Mba Models And Frameworks Dashboard To Compare Information Business Diagram
Our MBA Models And Frameworks Dashboard To compare Information Business Diagram Powerpoint Templates Abhor Doodling. They Never Let The Interest Flag.

Sales Diagram Dashboard For Quantitative Business Data Consulting Diagram
Deliver The Right Dose With Our Sales Diagram Dashboard For Quantitative Business Data Consulting Diagram Powerpoint Templates. Your Ideas Will Get The Correct Illumination.

Sales Diagram Dashboard Meter For Business Information Business Diagram
Our Sales Diagram Dashboard Meter For Business Information Business Diagram Powerpoint Templates Deliver At Your Doorstep. Let Them In For A Wonderful Experience.
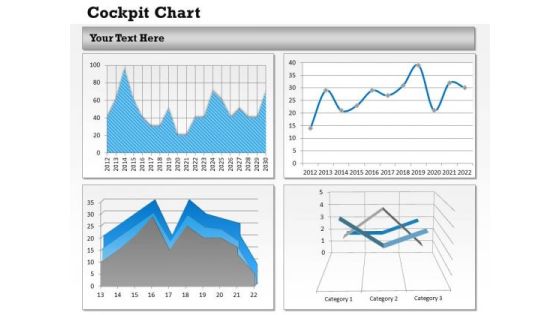
Strategic Management Dashboard Layout For Business Business Cycle Diagram
Knock On The Door To Success With Our Strategic Management Dashboard Layout For Business Business Cycle Diagram Powerpoint Templates. Be Assured Of Gaining Entry.

Resource Administration Accounting Scorecard With Inventory Summary Designs PDF
This graph or chart is linked to excel, and changes automatically based on data. Just left click on it and select Edit Data. Deliver and pitch your topic in the best possible manner with this Resource Administration Accounting Scorecard With Inventory Summary Designs PDF. Use them to share invaluable insights on Product Details, Top Selling Item, Purchase Order and impress your audience. This template can be altered and modified as per your expectations. So, grab it now.

HR Competency Scorecard With Major Actions Ppt Icon Smartart PDF
resource capabilities with respective initiatives to increase organization productivity. This includes competencies such as engagement, quality improvement, teamwork, communication and problem solving. Presenting HR Competency Scorecard With Major Actions Ppt Icon Smartart PDF to dispense important information. This template comprises five stages. It also presents valuable insights into the topics including Engagement, Quality Improvement, Teamwork, Communication. This is a completely customizable PowerPoint theme that can be put to use immediately. So, download it and address the topic impactfully.

Tactical Approach To Vendor Relationship Evaluation Form To Measure Supplier Performance Pictures PDF
This slide focuses on evaluation form to measure supplier performance which includes details about product and service such as code, description, review period, order number and supplier scoring elements.Deliver an awe inspiring pitch with this creative Tactical Approach To Vendor Relationship Evaluation Form To Measure Supplier Performance Pictures PDF bundle. Topics like Supplier Management, Installation And Commissioning, Competence And Training can be discussed with this completely editable template. It is available for immediate download depending on the needs and requirements of the user.

Cios Methodologies To Improve IT Spending Determine It Staff Performance Measurement Designs PDF
This slide provides information regarding IT staff performance measurement in terms of cost, quality, productivity and service level. Deliver an awe inspiring pitch with this creative Cios Methodologies To Improve IT Spending Determine It Staff Performance Measurement Designs PDF bundle. Topics like Reserved Instances, Pricing Recommendations, Running Instances can be discussed with this completely editable template. It is available for immediate download depending on the needs and requirements of the user.

Satisfying Consumers Through Strategic Product Building Plan Dashboard Depicting Product Usage Metrics Inspiration PDF
This slide represents the dashboard that depicts product usage metrics that includes usage statistics, users and sessions on the basis of countries, events trends, product loyalty, product usage by city. Deliver and pitch your topic in the best possible manner with this satisfying consumers through strategic product building plan dashboard depicting product usage metrics inspiration pdf. Use them to share invaluable insights on dashboard depicting product usage metrics and impress your audience. This template can be altered and modified as per your expectations. So, grab it now.
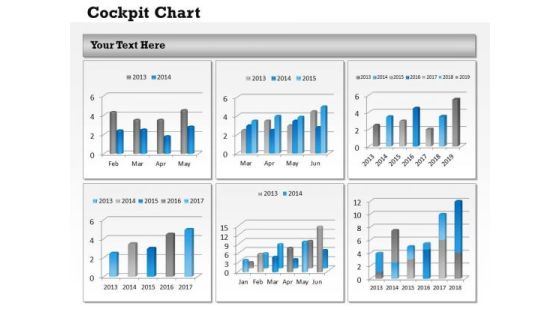
Business Cycle Diagram Display Data In Dashboard Layout Business Diagram
Analyze Ailments On Our Business Cycle Diagram Display Data In Dashboard Layout Business Diagram Powerpoint Templates. Bring Out The Thinking Doctor In You. Dock Your Thoughts With Our Business Cycle Diagram Display Data In Dashboard Layout Business Diagram Powerpoint Templates. They Will Launch Them Into Orbit.
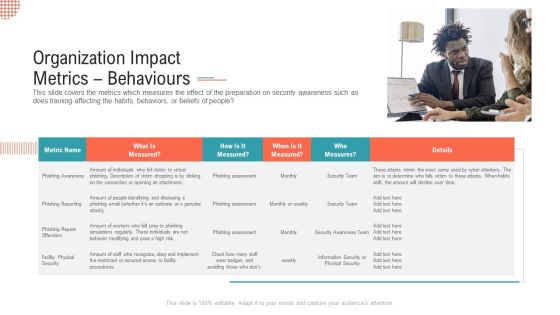
Organization Impact Metrics Behaviours Structure PDF
This slide covers the metrics which measures the effect of the preparation on security awareness such as does training affecting the habits, behaviors, or beliefs of people This is a organization impact metrics behaviours structure pdf. template with various stages. Focus and dispense information on one stage using this creative set, that comes with editable features. It contains large content boxes to add your information on topics like phishing reporting, phishing repeat offenders. You can also showcase facts, figures, and other relevant content using this PPT layout. Grab it now.
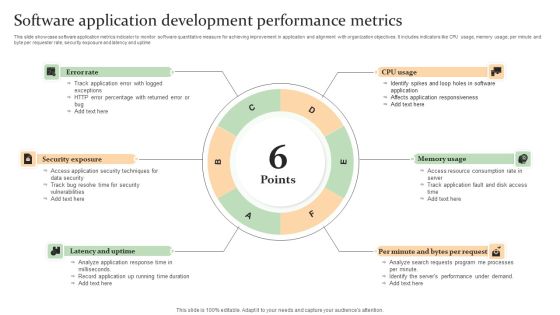
Software Application Development Performance Metrics Mockup PDF
This slide showcase software application metrics indicator to monitor software quantitative measure for achieving improvement in application and alignment with organization objectives. It includes indicators like CPU usage, memory usage, per minute and byte per requester rate, security exposure and latency and uptime Persuade your audience using this Software Application Development Performance Metrics Mockup PDF. This PPT design covers Six stages, thus making it a great tool to use. It also caters to a variety of topics including Latency And Uptime, Memory Usage, Security Exposure . Download this PPT design now to present a convincing pitch that not only emphasizes the topic but also showcases your presentation skills.

People Engagement Performance Dashboard With Variables Growth Ppt Summary Example PDF
This slide shows a People Engagement Performance Dashboard with variables such as engagement score, recognition rate, satisfaction rate, company knowledge rate and other key metrics of employee engagement. Deliver and pitch your topic in the best possible manner with this people engagement performance dashboard with variables growth ppt summary example pdf. Use them to share invaluable insights on 10 key metrics of employee engagement, employee engagement score and impress your audience. This template can be altered and modified as per your expectations. So, grab it now.

Actively Influencing Customers Dashboard For Tracking Marketing Activities At Social Guidelines PDF
This slide covers information regarding the dashboard for tracking essential marketing activities at social media platform in terms of social traffic and conversion, referral traffic by site, key social media metrics. Deliver and pitch your topic in the best possible manner with this Actively Influencing Customers Dashboard For Tracking Marketing Activities At Social Guidelines PDF. Use them to share invaluable insights on Social Events, Social Traffic And Conversion, Referral Traffic By Site, Key Social Metrics and impress your audience. This template can be altered and modified as per your expectations. So, grab it now.

Commodity Marketing KPI Dashboard For International Business Expansion Formats PDF
This slide signifies the product marketing key performance indicator dashboard for international business expansion. It covers information about sales, target, target achievement, gross profit margin, sales by region, growth and inventory outstanding.Pitch your topic with ease and precision using this Commodity Marketing KPI Dashboard For International Business Expansion Formats PDF. This layout presents information on Target Achievement, Receivale Days, Gross Profit. It is also available for immediate download and adjustment. So, changes can be made in the color, design, graphics or any other component to create a unique layout.
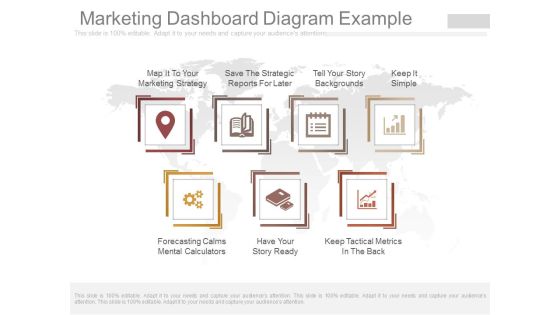
Marketing Dashboard Diagram Example
This is a marketing dashboard diagram example. This is a seven stage process. The stages in this process are map it to your marketing strategy, save the strategic reports for later, tell your story backgrounds, keep it simple, forecasting calms mental calculators, have your story ready, keep tactical metrics in the back.
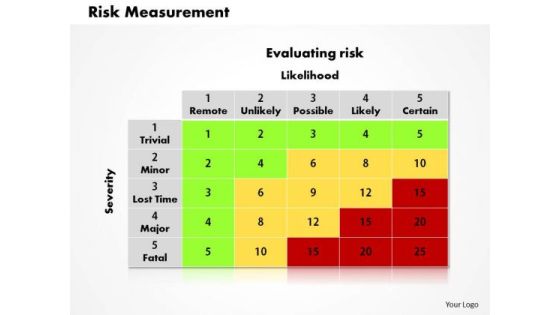
Risk Measurement Business PowerPoint Presentation
Get Out Of The Dock With Our Risk Measurement Business Powerpoint Presentation Powerpoint Templates. Your Mind Will Be Set Free. Play The Doctor With Our success Powerpoint Templates. Control Operations With Your Ideas.
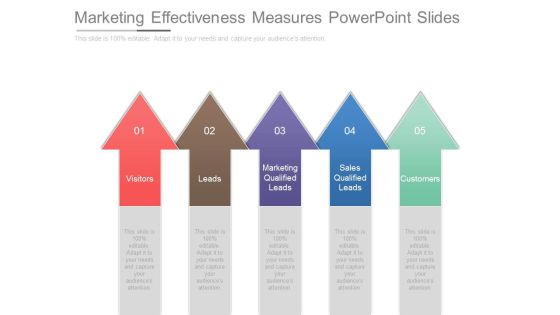
Marketing Effectiveness Measures Powerpoint Slides
This is a marketing effectiveness measures powerpoint slides. This is a five stage process. The stages in this process are visitors, leads, marketing qualified leads, sales qualified leads, customers.
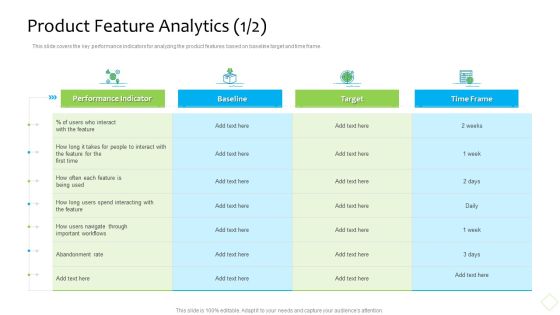
Product Demand Administration Product Feature Analytics Target Themes PDF
This slide covers the key performance indicators for analyzing the product features based on baseline target and time frame. Deliver an awe inspiring pitch with this creative product demand administration product feature analytics target themes pdf bundle. Topics like product feature analytics can be discussed with this completely editable template. It is available for immediate download depending on the needs and requirements of the user.

Alternative Distribution Advertising Platform Marketing Performance Dashboard Structure PDF
This infographic is used to track the multichannel marketing dashboard which covers lead funnel, traffic sources, key metrics, etc. Deliver an awe inspiring pitch with this creative alternative distribution advertising platform marketing performance dashboard structure pdf bundle. Topics like web visits, captured lead, qualified lead, sales accepted, opportunity can be discussed with this completely editable template. It is available for immediate download depending on the needs and requirements of the user.
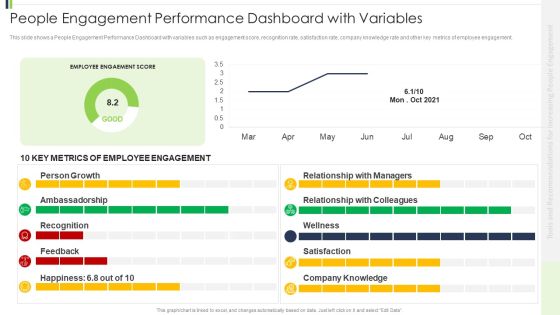
People Engagement Performance Dashboard With Variables Sample PDF
This slide shows a People Engagement Performance Dashboard with variables such as engagement score, recognition rate, satisfaction rate, company knowledge rate and other key metrics of employee engagement. Deliver an awe inspiring pitch with this creative people engagement performance dashboard with variables sample pdf bundle. Topics likeperson growth, ambassadorship, recognition can be discussed with this completely editable template. It is available for immediate download depending on the needs and requirements of the user.

Amalgamation Marketing Pitch Deck Marketing Performance Dashboard Slides PDF
This infographic is used to track the multichannel marketing dashboard which covers lead funnel, traffic sources, key metrics, etc. Deliver an awe inspiring pitch with this creative amalgamation marketing pitch deck marketing performance dashboard slides pdf bundle. Topics like web visits, captured lead, qualified lead, sales accepted, opportunity can be discussed with this completely editable template. It is available for immediate download depending on the needs and requirements of the user.

Electronic Commerce Systems Dashboard Showing E Marketing Performance Portrait PDF
This slide focuses on the dashboard that shows the e-marketing performance such ad lead funnel, traffic sources, monthly leads and key metrics. Deliver an awe inspiring pitch with this creative Electronic Commerce Systems Dashboard Showing E Marketing Performance Portrait PDF bundle. Topics like Lead Funnel, Traffic Sources, Leads This Month can be discussed with this completely editable template. It is available for immediate download depending on the needs and requirements of the user.

Analyzing And Deploying HR Analytics Software Kpi Dashboard Information PDF
This slide shows the dashboard representing data related to human resource operations of the enterprise. It includes key metrics such as vacant positions, YTD personal expenses etc. There are so many reasons you need a Analyzing And Deploying HR Analytics Software Kpi Dashboard Information PDF. The first reason is you cant spend time making everything from scratch, Thus, Slidegeeks has made presentation templates for you too. You can easily download these templates from our website easily.

Project Limitations Dashboard With Cost And Time Graphics PDF
This slide showcases dashboard to track key metrics necessary for project success and effective management of constraints. It includes elements such as health, tasks, progress, workload, etc. Pitch your topic with ease and precision using this Project Limitations Dashboard With Cost And Time Graphics PDF. This layout presents information on Time, Workload, Tasks, Progress. It is also available for immediate download and adjustment. So, changes can be made in the color, design, graphics or any other component to create a unique layout.
 Home
Home