Kpis

Creating Positioning Techniques For Market Research Brand Analytics Kpi Dashboard For Organization Slides PDF
The following slide outlines key performance indicator KPI dashboard that can assist marketers to evaluate brand performance on social media channels. The metrics covered are age group, gender, brand perception, branding themes, celebrity analysis, etc. Boost your pitch with our creative Creating Positioning Techniques For Market Research Brand Analytics Kpi Dashboard For Organization Slides PDF. Deliver an awe-inspiring pitch that will mesmerize everyone. Using these presentation templates you will surely catch everyones attention. You can browse the ppts collection on our website. We have researchers who are experts at creating the right content for the templates. So you do not have to invest time in any additional work. Just grab the template now and use them.
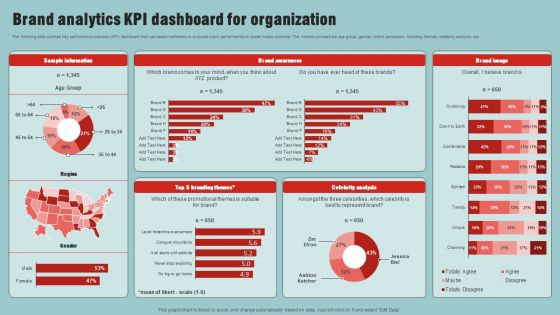
Market Analysis Overview And Different Categories Brand Analytics Kpi Dashboard For Organization Rules PDF
The following slide outlines key performance indicator KPI dashboard that can assist marketers to evaluate brand performance on social media channels. The metrics covered are age group, gender, brand perception, branding themes, celebrity analysis, etc. Present like a pro with Market Analysis Overview And Different Categories Brand Analytics Kpi Dashboard For Organization Rules PDF Create beautiful presentations together with your team, using our easy to use presentation slides. Share your ideas in real time and make changes on the fly by downloading our templates. So whether you are in the office, on the go, or in a remote location, you can stay in sync with your team and present your ideas with confidence. With Slidegeeks presentation got a whole lot easier. Grab these presentations today.

Steps To Effectively Conduct Market Research Brand Analytics KPI Dashboard For Organization Template PDF
The following slide outlines key performance indicator KPI dashboard that can assist marketers to evaluate brand performance on social media channels. The metrics covered are age group, gender, brand perception, branding themes, celebrity analysis, etc. Present like a pro with Steps To Effectively Conduct Market Research Brand Analytics KPI Dashboard For Organization Template PDF Create beautiful presentations together with your team, using our easy to use presentation slides. Share your ideas in real time and make changes on the fly by downloading our templates. So whether you are in the office, on the go, or in a remote location, you can stay in sync with your team and present your ideas with confidence. With Slidegeeks presentation got a whole lot easier. Grab these presentations today.

Brand Analytics Kpi Dashboard For Organization Ppt Portfolio Graphics Design PDF
The following slide outlines key performance indicator KPI dashboard that can assist marketers to evaluate brand performance on social media channels. The metrics covered are age group, gender, brand perception, branding themes, celebrity analysis, etc. Boost your pitch with our creative Brand Analytics Kpi Dashboard For Organization Ppt Portfolio Graphics Design PDF. Deliver an awe inspiring pitch that will mesmerize everyone. Using these presentation templates you will surely catch everyones attention. You can browse the ppts collection on our website. We have researchers who are experts at creating the right content for the templates. So you do not have to invest time in any additional work. Just grab the template now and use them.

Increasing Consumer Engagement With Database KPI Dashboard To Analyze Targeted Email Infographics PDF
The purpose of this slide is to highlight key performance indicator KPI dashboard which can be used by marketers to evaluate targeted email marketing campaign performance. The metrics are requests, opens, clicks, opens by country, opens vs clicks by month, etc. This modern and well arranged Increasing Consumer Engagement With Database KPI Dashboard To Analyze Targeted Email Infographics PDF provides lots of creative possibilities. It is very simple to customize and edit with the Powerpoint Software. Just drag and drop your pictures into the shapes. All facets of this template can be edited with Powerpoint no extra software is necessary. Add your own material, put your images in the places assigned for them, adjust the colors, and then you can show your slides to the world, with an animated slide included.

DAD Framework Agile Delivery Metrics Security Ppt Ideas Skills PDF
Listed Here are the metrics used by the organization to measure agile capability on the basis of product performance, security level and user satisfaction. Deliver and pitch your topic in the best possible manner with this DAD framework agile delivery metrics security ppt ideas skills pdf. Use them to share invaluable insights on security, accuracy of planning, functional coverage, performance, resourse consumption and impress your audience. This template can be altered and modified as per your expectations. So, grab it now.
Website Development Quality Administration Plan With Key Responsibilities Icons PDF
This slide showcases quality management plan that organization can use to keep track of quality metrics during website development project. Its key components are project quality measurement and key responsibilities. Showcasing this set of slides titled Website Development Quality Administration Plan With Key Responsibilities Icons PDF. The topics addressed in these templates are Quality Metrics, Target, Measurement Method. All the content presented in this PPT design is completely editable. Download it and make adjustments in color, background, font etc. as per your unique business setting.
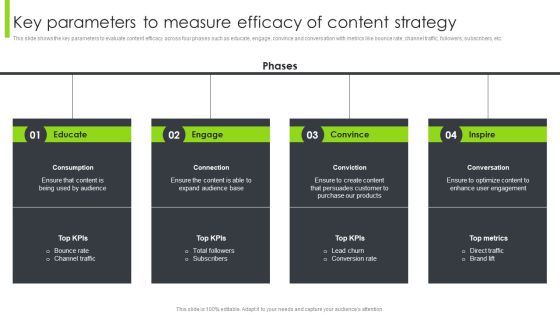
Optimizing Content Marketing Strategies To Enhance Conversion Rate Key Parameters To Measure Efficacy Of Content Strategy Summary PDF
This slide shows the key parameters to evaluate content efficacy across four phases such as educate, engage, convince and conversation with metrics like bounce rate, channel traffic, followers, subscribers, etc. Whether you have daily or monthly meetings, a brilliant presentation is necessary. Optimizing Content Marketing Strategies To Enhance Conversion Rate Key Parameters To Measure Efficacy Of Content Strategy Summary PDF can be your best option for delivering a presentation. Represent everything in detail using Optimizing Content Marketing Strategies To Enhance Conversion Rate Key Parameters To Measure Efficacy Of Content Strategy Summary PDF and make yourself stand out in meetings. The template is versatile and follows a structure that will cater to your requirements. All the templates prepared by Slidegeeks are easy to download and edit. Our research experts have taken care of the corporate themes as well. So, give it a try and see the results.

Kpi Dashboard To Evaluate The New Retail Store Performance Opening Retail Store In Untapped Download PDF
The following slide showcases key performance indicator dashboard which can be used to measure the performance of new store. It covers information about net sales, sales per square foot, average basket size ABS, total visitors count etc.Create an editable Kpi Dashboard To Evaluate The New Retail Store Performance Opening Retail Store In Untapped Download PDF that communicates your idea and engages your audience. Whether you are presenting a business or an educational presentation, pre-designed presentation templates help save time. Kpi Dashboard To Evaluate The New Retail Store Performance Opening Retail Store In Untapped Download PDF is highly customizable and very easy to edit, covering many different styles from creative to business presentations. Slidegeeks has creative team members who have crafted amazing templates. So, go and get them without any delay.

Dashboard For Sales Target Ppt Model
This is a dashboard for sales target ppt model. This is a one stage process. The stages in this process are dashboard, business, marketing, measure.
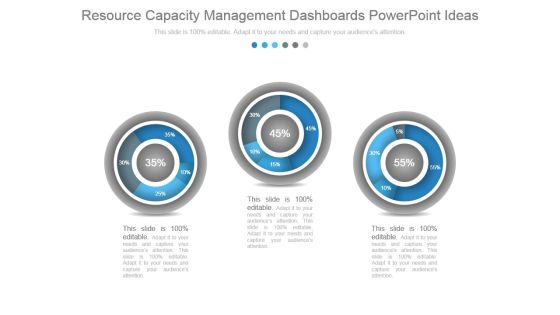
Resource Capacity Management Dashboards Powerpoint Ideas
This is a resource capacity management dashboards powerpoint ideas. This is a three stage process. The stages in this process are dashboard, percentage, measuring, business, marketing.

Dashboard Ppt PowerPoint Presentation Inspiration Examples
This is a dashboard ppt powerpoint presentation inspiration examples. This is a one stage process. The stages in this process are business, strategy, marketing, analysis, dashboard, measuring.

Dashboard Ppt PowerPoint Presentation Portfolio Background Image
This is a dashboard ppt powerpoint presentation portfolio background image. This is a three stage process. The stages in this process are dashboard, measurement, business, marketing.

Dashboard Ppt PowerPoint Presentation Portfolio Maker
This is a dashboard ppt powerpoint presentation portfolio maker. This is a three stage process. The stages in this process are dashboard, measurement, finance, business.

Dashboard Ppt PowerPoint Presentation Icon Influencers
This is a dashboard ppt powerpoint presentation icon influencers. This is a three stage process. The stages in this process are dashboard, measurement, business, marketing.

Dashboard Ppt PowerPoint Presentation Infographics Outfit
This is a dashboard ppt powerpoint presentation infographics outfit. This is a one stage process. The stages in this process are dashboard, measurement, finance, business.

Dashboard Ppt PowerPoint Presentation Inspiration Backgrounds
This is a dashboard ppt powerpoint presentation inspiration backgrounds. This is a three stage process. The stages in this process are low, medium, high, dashboard, measurement.

Dashboard Ppt PowerPoint Presentation Styles Templates
This is a dashboard ppt powerpoint presentation styles templates. This is a two stage process. The stages in this process are low, medium, high, dashboard, measurement.

Strategic Guide To Perform Marketing Digital Marketing Metrics Dashboard To Track Diagrams PDF
This slide presents a dashboard to measure and track performance of digital marketing activities using various metrics. It highlights element such as leads, users, users to leads, leads to MQLs, MQLs to SQLs, SQLs to opportunities, social events and social interactions. Retrieve professionally designed Strategic Guide To Perform Marketing Digital Marketing Metrics Dashboard To Track Diagrams PDF to effectively convey your message and captivate your listeners. Save time by selecting pre-made slideshows that are appropriate for various topics, from business to educational purposes. These themes come in many different styles, from creative to corporate, and all of them are easily adjustable and can be edited quickly. Access them as PowerPoint templates or as Google Slides themes. You dont have to go on a hunt for the perfect presentation because Slidegeeks got you covered from everywhere.
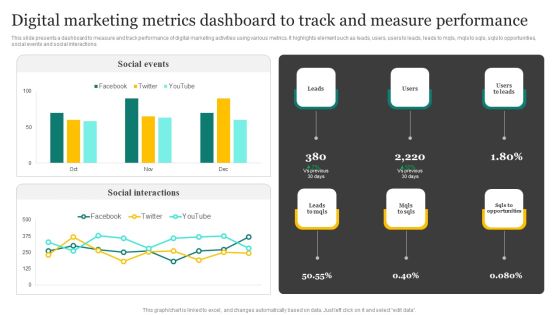
Strategic Promotion Plan Development Stages Digital Marketing Metrics Dashboard To Track Structure PDF
This slide presents a dashboard to measure and track performance of digital marketing activities using various metrics. It highlights element such as leads, users, users to leads, leads to mqls, mqls to sqls, sqls to opportunities, social events and social interactions. Are you in need of a template that can accommodate all of your creative concepts This one is crafted professionally and can be altered to fit any style. Use it with Google Slides or PowerPoint. Include striking photographs, symbols, depictions, and other visuals. Fill, move around, or remove text boxes as desired. Test out color palettes and font mixtures. Edit and save your work, or work with colleagues. Download Strategic Promotion Plan Development Stages Digital Marketing Metrics Dashboard To Track Structure PDF and observe how to make your presentation outstanding. Give an impeccable presentation to your group and make your presentation unforgettable.
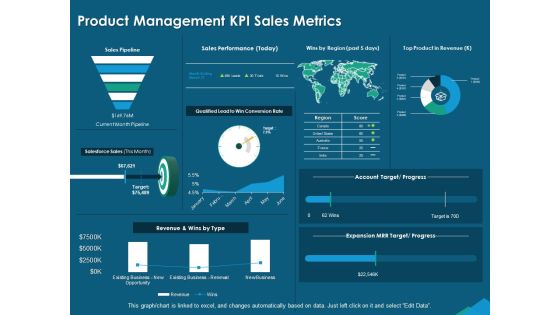
Guide For Managers To Effectively Handle Products Product Management KPI Sales Metrics Template PDF
Presenting this set of slides with name guide for managers to effectively handle products product management kpi sales metrics template pdf. The topics discussed in these slides are top product revenue, sales performance, current month pipeline, salesforce sales, revenue and wins, existing business new opportunity. This is a completely editable PowerPoint presentation and is available for immediate download. Download now and impress your audience.

Product Commercialization Action Plan Product Management KPI Sales Metrics Ppt Show Visuals PDF
Deliver and pitch your topic in the best possible manner with this product commercialization action plan product management KPI sales metrics ppt show visuals pdf. Use them to share invaluable insights on sales performance, product in revenue, account target progress, salesforce, sales pipeline and impress your audience. This template can be altered and modified as per your expectations. So, grab it now.

Balanced Scorecard Information Metrics Ppt Slides
This is a balanced scorecard information metrics ppt slides. This is a four stage process. The stages in this process are assessing risk, conducting decision support, measuring program effectiveness, implementing controls.

Social Media Marketing Metrics Powerpoint Guide
This is a social media marketing metrics powerpoint guide. This is a five stage process. The stages in this process are implementation, track and measure, analysis and adjustment, marketing strategies, content development.

Company Performance Of Construction Company With Key Insights Portrait PDF
This slide showcases the construction companys performance on various areas. It include cost, time, quality and safety management, cash flow indicator etc. Pitch your topic with ease and precision using this company performance of construction company with key insights portrait pdf. This layout presents information on performance, management. It is also available for immediate download and adjustment. So, changes can be made in the color, design, graphics or any other component to create a unique layout.
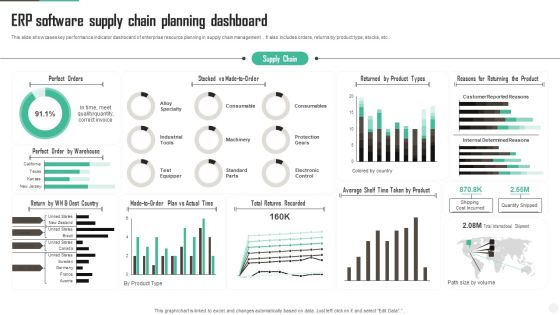
ERP Software Supply Chain Planning Dashboard Diagrams PDF
This slide showcases key performance indicator dashboard of enterprise resource planning in supply chain management . It also includes orders, returns by product type, stocks, etc. Showcasing this set of slides titled ERP Software Supply Chain Planning Dashboard Diagrams PDF Sample. The topics addressed in these templates are Perfect Orders, Dest Country, Actual Time. All the content presented in this PPT design is completely editable. Download it and make adjustments in color, background, font etc. as per your unique business setting.
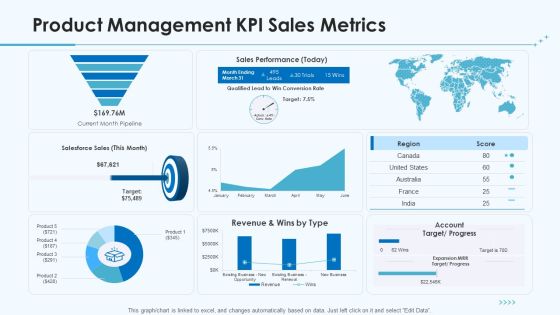
Product Pricing Strategies Product Management KPI Sales Metrics Ppt Pictures Summary PDF
Deliver and pitch your topic in the best possible manner with this product pricing strategies product management kpi sales metrics ppt pictures summary pdf. Use them to share invaluable insights on sales, performance, target, revenue and impress your audience. This template can be altered and modified as per your expectations. So, grab it now.

Competitor Assessment In Product Development Product Management KPI Sales Metrics Rules PDF
Deliver an awe-inspiring pitch with this creative competitor assessment in product development product management kpi sales metrics rules pdf. bundle. Topics like sales performance, salesforce sales can be discussed with this completely editable template. It is available for immediate download depending on the needs and requirements of the user.
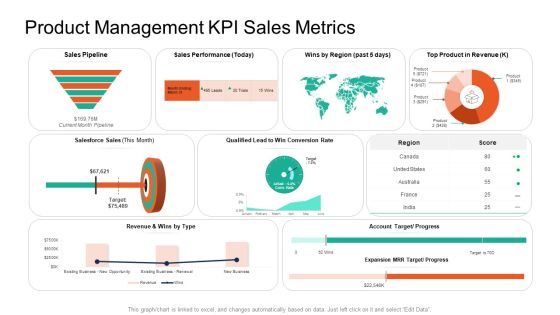
Product Capabilities Product Management KPI Sales Metrics Ppt Show Tips PDF
Deliver and pitch your topic in the best possible manner with this product capabilities product management kpi sales metrics ppt show tips pdf. Use them to share invaluable insights on sales, performance, target, revenue and impress your audience. This template can be altered and modified as per your expectations. So, grab it now.

Product Performance Ppt Sample Presentations
This is a product performance ppt sample presentations. This is a four stage process. The stages in this process are poor, fair, good, great.

Kpi Dashboard Best Practices For Project Management Ppt Powerpoint Presentation Outline Samples
This is a kpi dashboard best practices for project management ppt powerpoint presentation outline samples. This is a three stage process. The stages in this process are business metrics, business kpi, business dashboard.
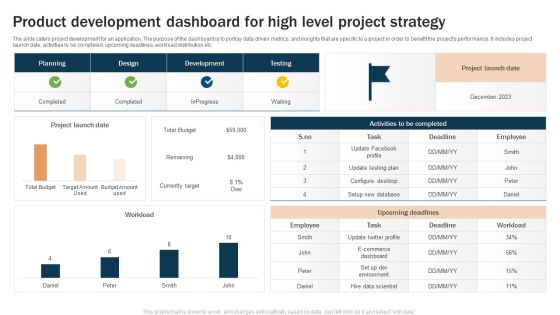
Product Development Dashboard For High Level Project Strategy Microsoft PDF
The slide caters project development for an application. The purpose of the dashboard is to portray data driven metrics, and insights that are specific to a project in order to benefit the projects performance. It includes project launch date, activities to be completed, upcoming deadlines, workload distribution etc. Showcasing this set of slides titled Product Development Dashboard For High Level Project Strategy Microsoft PDF. The topics addressed in these templates are Upcoming Deadlines, Project Launch, Upcoming Deadlines. All the content presented in this PPT design is completely editable. Download it and make adjustments in color, background, font etc. as per your unique business setting.

Project Status Visual Dashboard Indicator Ppt Images Gallery
This is a project status visual dashboard indicator ppt images gallery. This is a four stage process. The stages in this process are business, marketing, dashboard, measure, presentation.

Service Improvement Techniques For Client Retention Dashboard Depicting Performance Metrics Diagrams PDF
This slide provides an overview of customer feedback survey conducted to evaluate their satisfaction level. It includes description, steps and benefits which are measure customer satisfaction This modern and well arranged Service Improvement Techniques For Client Retention Dashboard Depicting Performance Metrics Diagrams PDF provides lots of creative possibilities. It is very simple to customize and edit with the Powerpoint Software. Just drag and drop your pictures into the shapes. All facets of this template can be edited with Powerpoint no extra software is necessary. Add your own material, put your images in the places assigned for them, adjust the colors, and then you can show your slides to the world, with an animated slide included.

Retail Kpi Dashboard Ppt Powerpoint Slides Download
This is a retail kpi dashboard ppt powerpoint slides download. This is a four stage process. The stages in this process are business, marketing, measure, process, finance.

Business Performance Dashboard Analysis Diagram Powerpoint Slides
This is a business performance dashboard analysis diagram powerpoint slides. This is a three stage process. The stages in this process are measure, business, management, presentation, process.

Dashboard Ppt PowerPoint Presentation Gallery Graphics Template
This is a dashboard ppt powerpoint presentation gallery graphics template. This is a three stage process. The stages in this process are low, medium, high, measurement.

Segementation Ppt PowerPoint Presentation Background Designs
This is a segementation ppt powerpoint presentation background designs. This is a three stage process. The stages in this process are segmentation, business, dashboard, process, strategy.

Segementation Ppt PowerPoint Presentation Images
This is a segementation ppt powerpoint presentation images. This is a two stage process. The stages in this process are segmentation, dashboard, management, business, marketing.

Customer Service Benchmarking Ppt PowerPoint Presentation Inspiration
This is a customer service benchmarking ppt powerpoint presentation inspiration. This is a three stage process. The stages in this process are business, marketing, success, dashboard, technology.
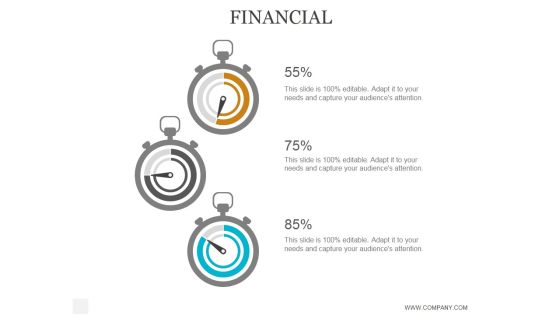
Financial Ppt PowerPoint Presentation Background Designs
This is a financial ppt powerpoint presentation background designs. This is a five stage process. The stages in this process are business, strategy, marketing, analysis, success, finance, dashboard.

Current Status Of Product Ppt PowerPoint Presentation Diagrams
This is a current status of product ppt powerpoint presentation diagrams. This is a three stage process. The stages in this process are product, business, marketing, management, dashboard.

Monitoring Impact Ppt PowerPoint Presentation Example
This is a monitoring impact ppt powerpoint presentation example. This is a three stage process. The stages in this process are business, strategy, marketing, analysis, dashboard.
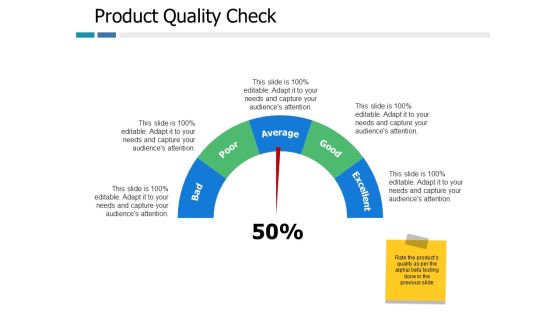
Product Quality Check Ppt PowerPoint Presentation Styles Layouts
This is a product quality check ppt powerpoint presentation styles layouts. This is a five stage process. The stages in this process are business, marketing, management, dashboard.

Digital Marketing KPI Dashboard With Engagement Rate Background PDF
The following slide showcases a comprehensive KPI dashboard which allows the company to track the digital marketing performance. Total visits, cost per click, engagement rate, total impressions, product sales trend, revenue by various channels are some of the key metrics mentioned in the slide. Showcasing this set of slides titled Digital Marketing KPI Dashboard With Engagement Rate Background PDF. The topics addressed in these templates are Demographics, Revenue, Sales. All the content presented in this PPT design is completely editable. Download it and make adjustments in color, background, font etc. as per your unique business setting.
Monthly Sales Performance Tracking And Monitoring Dashboard Diagrams PDF
This slide showcases a dashboard presenting various metrics to measure and analyze sales performance for revenue growth. It includes key components such as number of sales, revenue, profit, cost, sales revenue, sales increment, cost analysis and cross sell. Make sure to capture your audiences attention in your business displays with our gratis customizable Monthly Sales Performance Tracking And Monitoring Dashboard Diagrams PDF. These are great for business strategies, office conferences, capital raising or task suggestions. If you desire to acquire more customers for your tech business and ensure they stay satisfied, create your own sales presentation with these plain slides.
Monthly Sales Performance Tracking And Monitoring Dashboard Designs PDF
This slide showcases a dashboard presenting various metrics to measure and analyze sales performance for revenue growth. It includes key components such as number of sales, revenue, profit, cost, sales revenue, sales increment, cost analysis and cross sell. Make sure to capture your audiences attention in your business displays with our gratis customizable Monthly Sales Performance Tracking And Monitoring Dashboard Designs PDF. These are great for business strategies, office conferences, capital raising or task suggestions. If you desire to acquire more customers for your tech business and ensure they stay satisfied, create your own sales presentation with these plain slides.

Business Newsletter Referral Marketing Program Performance KPI Dashboard Formats PDF
This slide represents KPI dashboard designed to track performance of the program conducted to attract new leads at lower cost with the help of existing customers to generate leads that best fit the organization. It includes key metrics such as total revenue generated, monthly recurring revenue, paying customers etc. Showcasing this set of slides titled Business Newsletter Referral Marketing Program Performance KPI Dashboard Formats PDF. The topics addressed in these templates are Dashboard, Paying Customers, Monthly Recurring Revenue, Total Revenue Generated. All the content presented in this PPT design is completely editable. Download it and make adjustments in color, background, font etc. as per your unique business setting.

Creating A Recruitment Dashboard Powerpoint Sample
This is a creating a recruitment dashboard powerpoint sample. This is a two stage process. The stages in this process are critical success factors, sourcing channels, recruiter efficiency, acceptance rate, key performance indicators, candidate, manager satisfaction, quality of hire, efficiency ratio.

PMO KPI Dashboard With Completion Timeline Background PDF
Showcasing this set of slides titled PMO KPI Dashboard With Completion Timeline Background PDF The topics addressed in these templates are Projects Completion Timeline, Projects Performance Snapshot, Project Health All the content presented in this PPT design is completely editable. Download it and make adjustments in color, background, font etc. as per your unique business setting.
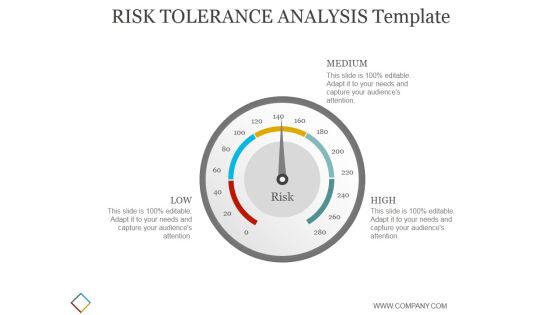
Risk Tolerance Analysis Template Ppt PowerPoint Presentation Background Designs
This is a risk tolerance analysis template ppt powerpoint presentation background designs. This is a one stage process. The stages in this process are business, strategy, marketing, analysis, dashboard.

Current Status Of Product Ppt PowerPoint Presentation Visuals
This is a current status of product ppt powerpoint presentation visuals. This is a three stage process. The stages in this process are business, strategy, marketing, success, analysis, dashboard.

Conversion Rate Template 2 Ppt PowerPoint Presentation Ideas Design Inspiration
This is a conversion rate template 2 ppt powerpoint presentation ideas design inspiration. This is a three stage process. The stages in this process are dashboard, marketing, strategy, analysis, business.

Sales Performance Versus Target Ppt PowerPoint Presentation Pictures Structure
This is a sales performance versus target ppt powerpoint presentation pictures structure. This is a five stage process. The stages in this process are business, dashboard, technology, process, marketing.
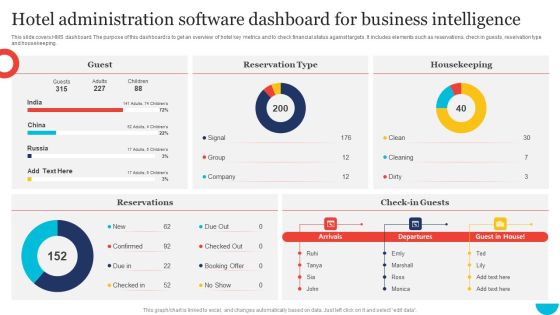
Hotel Administration Software Dashboard For Business Intelligence Infographics PDF
This slide covers HMS dashboard. The purpose of this dashboard is to get an overview of hotel key metrics and to check financial status against targets. It includes elements such as reservations, check in guests, reservation type and housekeeping. Pitch your topic with ease and precision using this Hotel Administration Software Dashboard For Business Intelligence Infographics PDF. This layout presents information on Guest, Housekeeping, Reservation Type. It is also available for immediate download and adjustment. So, changes can be made in the color, design, graphics or any other component to create a unique layout.
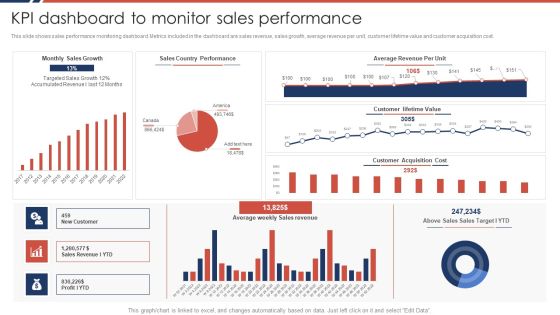
Effective Sales Plan For New Product Introduction In Market KPI Dashboard To Monitor Sales Performance Portrait PDF
This slide shows sales performance monitoring dashboard. Metrics included in the dashboard are sales revenue, sales growth, average revenue per unit, customer lifetime value and customer acquisition cost.Deliver an awe inspiring pitch with this creative Effective Sales Plan For New Product Introduction In Market KPI Dashboard To Monitor Sales Performance Portrait PDF bundle. Topics like Average Revenue, Country Performance, Customer Lifetime can be discussed with this completely editable template. It is available for immediate download depending on the needs and requirements of the user.
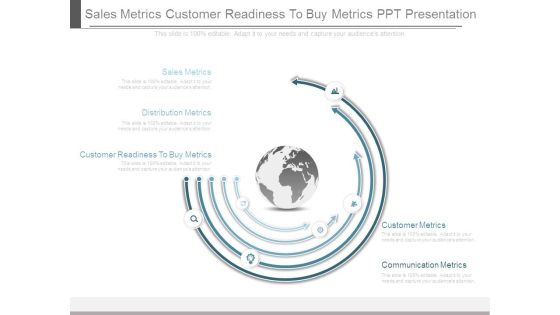
Sales Metrics Customer Readiness To Buy Metrics Ppt Presentation
This is a sales metrics ppt presentation examples. This is a five stage process. The stages in this process are sales metrics, distribution metrics, customer readiness to buy metrics, customer metrics, communication metrics.

Content Advertising Campaign Measuring Campaign Results Background PDF
This slide provides an overview of the dashboard depicting performance indicators used to measure success of the campaign. Metrics covered are page views, new visitors, social shares, CTR, blog subscribers, conversion, new blog subscribers, etc. There are so many reasons you need a Content Advertising Campaign Measuring Campaign Results Background PDF. The first reason is you cannot spend time making everything from scratch, Thus, Slidegeeks has made presentation templates for you too. You can easily download these templates from our website easily.
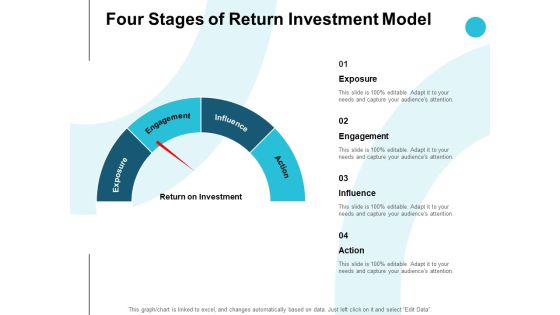
Four Stages Of Return Investment Model Ppt PowerPoint Presentation Pictures Background Image
Presenting this set of slides with name four stages of return investment model ppt powerpoint presentation pictures background image. This is a four stage process. The stages in this process are dashboard, marketing, process, management, planning. This is a completely editable PowerPoint presentation and is available for immediate download. Download now and impress your audience.
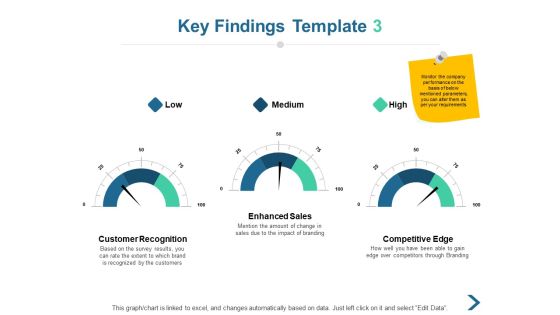
Key Findings Competitive Ppt PowerPoint Presentation Show Inspiration
Presenting this set of slides with name key findings competitive ppt powerpoint presentation show inspiration. This is a three stage process. The stages in this process are dashboard, low, high, management, business. This is a completely editable PowerPoint presentation and is available for immediate download. Download now and impress your audience.
 Home
Home