Kpis

Dashboard Ppt PowerPoint Presentation Visual Aids
This is a dashboard ppt powerpoint presentation visual aids. This is a three stage process. The stages in this process are dashboard, business, marketing, process, success.

Dashboard Ppt PowerPoint Presentation Layouts Graphic Tips
This is a dashboard ppt powerpoint presentation layouts graphic tips. This is a one stage process. The stages in this process are dashboard, strategy, marketing, business, management.

Dashboard Ppt PowerPoint Presentation Summary Styles
This is a dashboard ppt powerpoint presentation summary styles. This is a four stage process. The stages in this process are dashboard, marketing, business, technology, management.

Dashboard Ppt PowerPoint Presentation Show Mockup
This is a dashboard ppt powerpoint presentation show mockup. This is a one stage process. The stages in this process are business, marketing, dashboard, finance, management.

Dashboard Ppt PowerPoint Presentation Outline Grid
This is a dashboard ppt powerpoint presentation outline grid. This is a two stage process. The stages in this process are business, strategy, analysis, planning, dashboard, finance.

Dashboard Ppt PowerPoint Presentation Layouts Graphics Pictures
This is a dashboard ppt powerpoint presentation layouts graphics pictures. This is a three stage process. The stages in this process are business, strategy, analysis, planning, dashboard.

Dashboard Marketing Planning Ppt PowerPoint Presentation Slides Slideshow
This is a dashboard marketing planning ppt powerpoint presentation slides slideshow. This is a three stage process. The stages in this process are dashboard, finance, analysis, business, investment.

Product Marketing Management To Enforce Business Performance Dashboard Showing Digital Professional PDF
Do you know about Slidesgeeks Product Marketing Management To Enforce Business Performance Dashboard Showing Digital Professional PDF These are perfect for delivering any kind od presentation. Using it, create PowerPoint presentations that communicate your ideas and engage audiences. Save time and effort by using our pre designed presentation templates that are perfect for a wide range of topic. Our vast selection of designs covers a range of styles, from creative to business, and are all highly customizable and easy to edit. Download as a PowerPoint template or use them as Google Slides themes.

Product Awareness Strategies To Raise Demand Marketing Performance Dashboard With Advertisement Cost Details Graphics PDF
Present like a pro with Product Awareness Strategies To Raise Demand Marketing Performance Dashboard With Advertisement Cost Details Graphics PDF Create beautiful presentations together with your team, using our easy to use presentation slides. Share your ideas in real time and make changes on the fly by downloading our templates. So whether you are in the office, on the go, or in a remote location, you can stay in sync with your team and present your ideas with confidence. With Slidegeeks presentation got a whole lot easier. Grab these presentations today.

Product And Services Promotion Marketing Performance Dashboard With Advertisement Graphics PDF
This graph or chart is linked to excel, and changes automatically based on data. Just left click on it and select Edit Data. Slidegeeks is here to make your presentations a breeze with Product And Services Promotion Marketing Performance Dashboard With Advertisement Graphics PDF With our easy-to-use and customizable templates, you can focus on delivering your ideas rather than worrying about formatting. With a variety of designs to choose from, youre sure to find one that suits your needs. And with animations and unique photos, illustrations, and fonts, you can make your presentation pop. So whether youre giving a sales pitch or presenting to the board, make sure to check out Slidegeeks first.

Strategic Policy Deployment Chart With Policy Owners And Measures Ppt PowerPoint Presentation Gallery Inspiration PDF
The slide shows the strategic planning X Matrix structure that includes long term goals, annual objectives, and top-level priorities and key metrics to improve the same. Showcasing this set of slides titled strategic policy deployment chart with policy owners and measures ppt powerpoint presentation gallery inspiration pdf. The topics addressed in these templates are policy owner, objective, measures. All the content presented in this PPT design is completely editable. Download it and make adjustments in color, background, font etc. as per your unique business setting.

Dashboard Ppt PowerPoint Presentation Examples
This is a dashboard ppt powerpoint presentation examples. This is a three stage process. The stages in this process are low, medium, high.

Dashboard Ppt PowerPoint Presentation Shapes
This is a dashboard ppt powerpoint presentation shapes. This is a five stage process. The stages in this process are very poor, poor, fair, good, excllent.

Enhance Workforce Productiveness Performance Dashboard Ppt PowerPoint Presentation Complete Deck With Slides
This enhance workforce productiveness performance dashboard ppt powerpoint presentation complete deck with slides acts as backup support for your ideas, vision, thoughts, etc. Use it to present a thorough understanding of the topic. This PPT slideshow can be utilized for both in-house and outside presentations depending upon your needs and business demands. Entailing twelve slides with a consistent design and theme, this template will make a solid use case. As it is intuitively designed, it suits every business vertical and industry. All you have to do is make a few tweaks in the content or any other component to design unique presentations. The biggest advantage of this complete deck is that it can be personalized multiple times once downloaded. The color, design, shapes, and other elements are free to modify to add personal touches. You can also insert your logo design in this PPT layout. Therefore a well-thought and crafted presentation can be delivered with ease and precision by downloading this enhance workforce productiveness performance dashboard ppt powerpoint presentation complete deck with slides PPT slideshow.
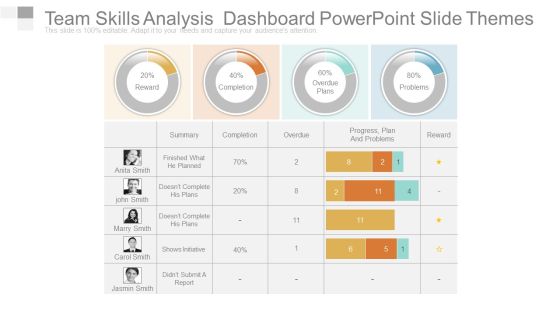
Team Skills Analysis Dashboard Powerpoint Slide Themes
This is a team skills analysis dashboard powerpoint slide themes. This is a four stage process. The stages in this process are reward, completion, overdue, overdue plans, problems.
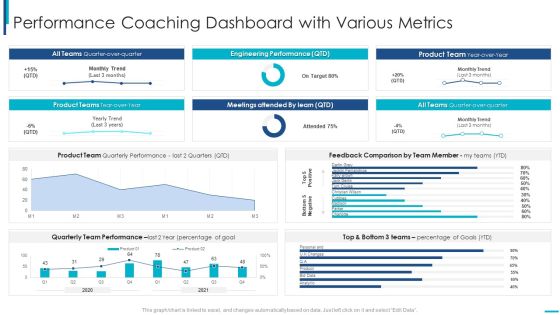
Skill Development Training To Strengthen Employee Performance Performance Coaching Dashboard Information PDF
Deliver an awe inspiring pitch with this creative skill development training to strengthen employee performance performance coaching dashboard information pdf bundle. Topics like quarterly team performance, product teams, engineering performance, product team can be discussed with this completely editable template. It is available for immediate download depending on the needs and requirements of the user.
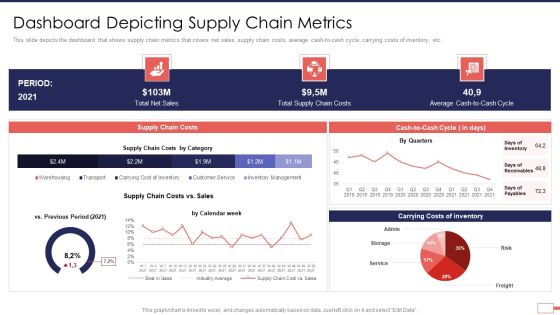
Iot Digital Twin Technology Post Covid Expenditure Management Dashboard Depicting Supply Chain Metrics Sample PDF
This slide depicts the dashboard that shows supply chain metrics that covers net sales, supply chain costs, average cash-to-cash cycle, carrying costs of inventory, etc. Deliver an awe inspiring pitch with this creative iot digital twin technology post covid expenditure management dashboard depicting supply chain metrics sample pdf bundle. Topics like dashboard depicting supply chain metrics can be discussed with this completely editable template. It is available for immediate download depending on the needs and requirements of the user.
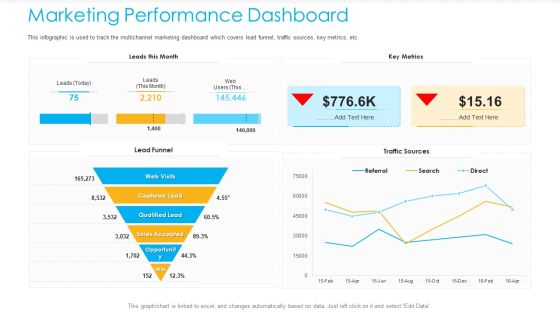
Unified Business To Consumer Marketing Strategy Marketing Performance Dashboard Introduction PDF
This infographic is used to track the multichannel marketing dashboard which covers lead funnel, traffic sources, key metrics, etc.Deliver an awe-inspiring pitch with this creative unified business to consumer marketing strategy marketing performance dashboard introduction pdf bundle. Topics like captured lead, qualified lead, sales accepted can be discussed with this completely editable template. It is available for immediate download depending on the needs and requirements of the user.

Client Support KPI Dashboard Rules PDF
This slide shows key performance indicators of customer service delivery. It includes service level, request volume, cost of revenue, customer satisfaction, customer retention, etc. Pitch your topic with ease and precision using this Client Support KPI Dashboard Rules PDF. This layout presents information on Customer Retention, Cost Per Support, Average Issue Solving Time. It is also available for immediate download and adjustment. So, changes can be made in the color, design, graphics or any other component to create a unique layout.

Dashboard For Tracking Direct Mail Advertising Campaign Performance Inspiration PDF
This slide represents dashboard showcasing direct mail marketing campaign performance progress. It provides information regarding click through rate, campaign performance, web conversions, total revenue etc. Showcasing this set of slides titled Dashboard For Tracking Direct Mail Advertising Campaign Performance Inspiration PDF. The topics addressed in these templates are Product Delivery Rate, Deliverables, App Uninstalls. All the content presented in this PPT design is completely editable. Download it and make adjustments in color, background, font etc. as per your unique business setting.
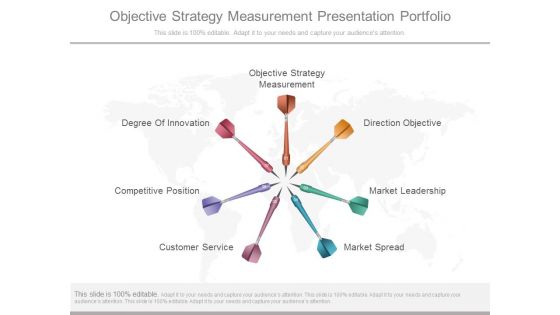
Objective Strategy Measurement Presentation Portfolio
This is a objective strategy measurement presentation portfolio. This is a seven stage process. The stages in this process are objective strategy measurement, direction objective, market leadership, market spread, customer service, competitive position, degree of innovation.

Performance Measurement Powerpoint Slide Backgrounds
This is a performance measurement powerpoint slide backgrounds. This is a four stage process. The stages in this process are selection of source, system control, performance measurement, contract modification.
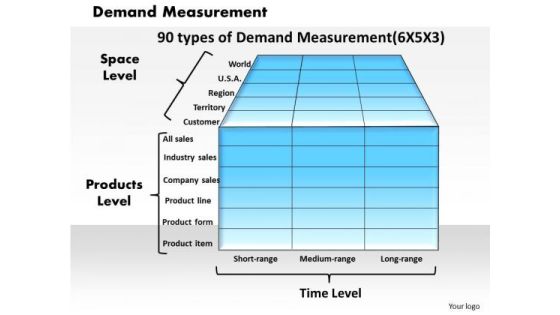
Demand Measurement Business PowerPoint Presentation
Touch Base With Our Demand Measurement Business Powerpoint Presentation Powerpoint Templates. Review Your Growth With Your Audience.

Company Sales And Performance Dashboard Ppt PowerPoint Presentation Inspiration Gallery
Presenting this set of slides with name company sales and performance dashboard ppt powerpoint presentation inspiration gallery. The topics discussed in these slides are month growth in revenue, product sales, profit margins graph . This is a completely editable PowerPoint presentation and is available for immediate download. Download now and impress your audience.

Company Sales And Performance Dashboard Ppt PowerPoint Presentation Inspiration Skills
Presenting this set of slides with name company sales and performance dashboard ppt powerpoint presentation inspiration skills. The topics discussed in these slides are growth revenue, product sales, profits. This is a completely editable PowerPoint presentation and is available for immediate download. Download now and impress your audience.

Company Sales And Performance Dashboard Ppt PowerPoint Presentation Model Ideas
Presenting this set of slides with name company sales and performance dashboard ppt powerpoint presentation model ideas. The topics discussed in these slides are 5 month growth in revenue, 4 year product sales, profit margins graph, 4 year profits . This is a completely editable PowerPoint presentation and is available for immediate download. Download now and impress your audience.

Company Sales And Performance Dashboard Ppt PowerPoint Presentation Slides Background
Presenting this set of slides with name company sales and performance dashboard ppt powerpoint presentation slides background. The topics discussed in these slides are 5 month growth in revenue, 4 year product sales, profit margins graph, 4 year profits. This is a completely editable PowerPoint presentation and is available for immediate download. Download now and impress your audience.
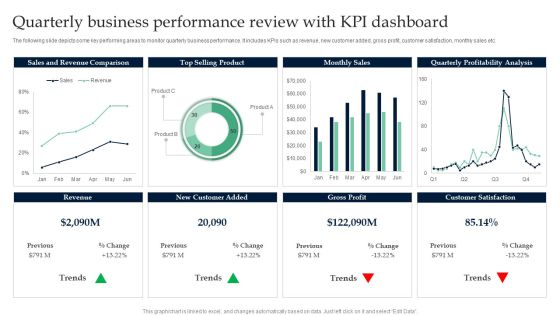
Quarterly Business Performance Review With KPI Dashboard Infographics PDF
Pitch your topic with ease and precision using this Quarterly Business Performance Review With KPI Dashboard Infographics PDF. This layout presents information on Sales And Revenue Comparison, Top Selling Product. It is also available for immediate download and adjustment. So, changes can be made in the color, design, graphics or any other component to create a unique layout.

Competitive Brand Analysis Report Product Positioning And Engagement Ppt PowerPoint Presentation Styles Slides
Presenting this set of slides with name competitive brand analysis report product positioning and engagement ppt powerpoint presentation styles slides. The topics discussed in these slides are competition scorecard, competitors performance, competitors analysis. This is a completely editable PowerPoint presentation and is available for immediate download. Download now and impress your audience.
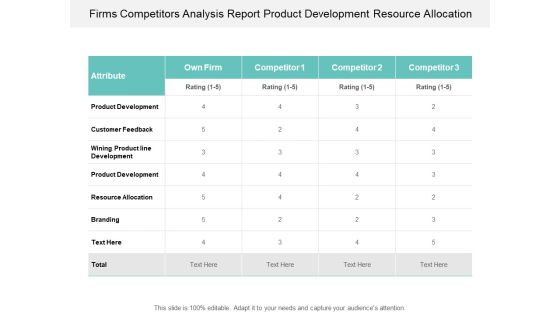
Firms Competitors Analysis Report Product Development Resource Allocation Ppt PowerPoint Presentation Ideas Background
Presenting this set of slides with name firms competitors analysis report product development resource allocation ppt powerpoint presentation ideas background. The topics discussed in these slides are competition scorecard, competitors performance, competitors analysis. This is a completely editable PowerPoint presentation and is available for immediate download. Download now and impress your audience.

Product Comparison Report Market Awareness And Customer Experience Ppt PowerPoint Presentation Summary Design Ideas
Presenting this set of slides with name product comparison report market awareness and customer experience ppt powerpoint presentation summary design ideas. The topics discussed in these slides are competition scorecard, competitors performance, competitors analysis. This is a completely editable PowerPoint presentation and is available for immediate download. Download now and impress your audience.

Product Comparison Report With Capability Assessment Ppt PowerPoint Presentation Infographic Template Graphics Template
Presenting this set of slides with name product comparison report with capability assessment ppt powerpoint presentation infographic template graphics template. The topics discussed in these slides are competition scorecard, competitors performance, competitors analysis. This is a completely editable PowerPoint presentation and is available for immediate download. Download now and impress your audience.

Product Competitor Analysis Report Quality And Availability Ppt PowerPoint Presentation Infographic Template Ideas
Presenting this set of slides with name product competitor analysis report quality and availability ppt powerpoint presentation infographic template ideas. The topics discussed in these slides are competition scorecard, competitors performance, competitors analysis. This is a completely editable PowerPoint presentation and is available for immediate download. Download now and impress your audience.

Dashboard With Increasing Values Powerpoint Slides
This innovative, stunningly beautiful dashboard has been designed for data visualization. It contains pie charts with increasing percentage values. This PowerPoint template helps to display your information in a useful, simple and uncluttered way.

Dashboard With Low High Medium Indication Powerpoint Slides
This innovative, stunningly beautiful dashboard has been designed for data visualization. It contains dashboard with low, high and medium indication. This PowerPoint template helps to display your information in a useful, simple and orderly way.
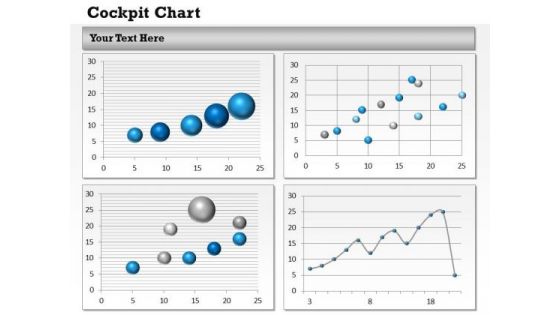
Business Diagram Performance Dashboards For Business Strategic Management
Be The Doer With Our Business Diagram Performance Dashboards For Business Strategic Management Powerpoint Templates. Put Your Thoughts Into Practice.

Marketing Diagram Data Driven Dashboard Design Business Diagram
Get The Doers Into Action. Activate Them With Our Marketing Diagram Data Driven Dashboard Design Business Diagram Powerpoint Templates.
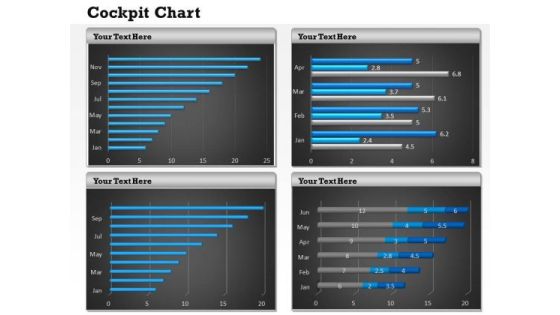
Sales Diagram Visual Design Of Dashboard Strategy Diagram
Dominate Proceedings With Your Ideas. Our Sales Diagram Visual Design Of Dashboard Strategy Diagram Powerpoint Templates Will Empower Your Thoughts.
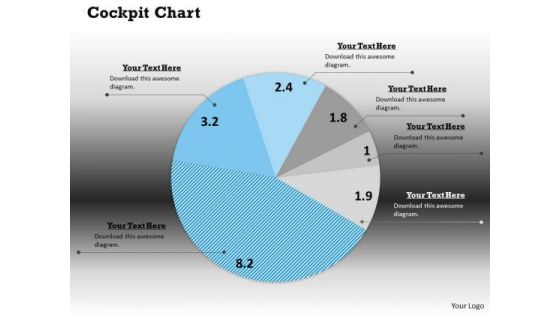
Strategic Management Interactiive Chart Dashboard Design Marketing Diagram
Your Listeners Will Never Doodle. Our Strategic Management Interactiive Chart Dashboard Design Marketing Diagram Powerpoint Templates Will Hold Their Concentration.

Consulting Diagram Business Dashboard Progress Meter Business Diagram
Be The Doer With Our Consulting Diagram Business Dashboard Progress Meter Business Diagram Powerpoint Templates. Put Your Thoughts Into Practice.

Marketing Diagram Dashboard Design For Business Sales Diagram
Your Listeners Will Never Doodle. Our Marketing Diagram Dashboard Design For Business Sales Diagram Powerpoint Templates Will Hold Their Concentration.

Customer Decline Of Sales Analysis Dashboard Rules PDF
The following slide presents a key performance indicating dashboards that can be used by managers in order to analyse customer-lost sales. Major key performance indicators are lost deals rate, lost sales rate, customer data analytics, etc. Pitch your topic with ease and precision using this Customer Decline Of Sales Analysis Dashboard Rules PDF. This layout presents information on Customer Data Analytics. It is also available for immediate download and adjustment. So, changes can be made in the color, design, graphics or any other component to create a unique layout.

Deployment Of Automated Production Technology Sustainable Manufacturing Performance Guidelines PDF
This slide represents sustainable manufacturing performance evaluation framework. It covers process metrics, product metrics, 6r methodology etc.Welcome to our selection of the Deployment Of Automated Production Technology Sustainable Manufacturing Performance Guidelines PDF. These are designed to help you showcase your creativity and bring your sphere to life. Planning and Innovation are essential for any business that is just starting out. This collection contains the designs that you need for your everyday presentations. All of our PowerPoints are 100 precent editable, so you can customize them to suit your needs. This multi-purpose template can be used in various situations. Grab these presentation templates today.

Optimizing Production Process Sustainable Manufacturing Performance Evaluation Formats PDF
This slide represents sustainable manufacturing performance evaluation framework. It covers process metrics, product metrics, 6r methodology etc. Coming up with a presentation necessitates that the majority of the effort goes into the content and the message you intend to convey. The visuals of a PowerPoint presentation can only be effective if it supplements and supports the story that is being told. Keeping this in mind our experts created Optimizing Production Process Sustainable Manufacturing Performance Evaluation Formats PDF to reduce the time that goes into designing the presentation. This way, you can concentrate on the message while our designers take care of providing you with the right template for the situation.

Performance Dashboard For E Commerce Business Financial Operations Infographics PDF
This slide represents performance dashboard for e-commerce financial process illustrating product sales, number of brands, revenue, number of units sold etc.Pitch your topic with ease and precision using this performance dashboard for e commerce business financial operations infographics pdf This layout presents information on category by total revenue, total revenue, purchase by age breakdown It is also available for immediate download and adjustment. So, changes can be made in the color, design, graphics or any other component to create a unique layout.
KPI Dashboard For Tracking Project Team Performance Pictures PDF
Following slide illustrates performance monitoring dashboard that can be used by managers to track their developers team efficiency. It also includes details about billable and non billable hours along with task summary.Deliver an awe inspiring pitch with this creative KPI Dashboard For Tracking Project Team Performance Pictures PDF bundle. Topics like Task Summary, Employee Productivity, Project Manager can be discussed with this completely editable template. It is available for immediate download depending on the needs and requirements of the user.

SEO Dashboard Funnel Metrics Ppt PowerPoint Presentation Visual Aids Layouts Cpb
Presenting this set of slides with name seo dashboard funnel metrics ppt powerpoint presentation visual aids layouts cpb. This is a six stage process. The stages in this process are seo dashboard funnel metrics. This is a completely editable PowerPoint presentation and is available for immediate download. Download now and impress your audience.

Power Management System And Technology KPI Metrics And Dashboard Ppt PowerPoint Presentation Outline Designs Download PDF
Presenting this set of slides with name power management system and technology kpi metrics and dashboard ppt powerpoint presentation outline designs download pdf. This is a two stage process. The stages in this process are kpi metrics, dashboard. This is a completely editable PowerPoint presentation and is available for immediate download. Download now and impress your audience.
Eco Friendly And Feasibility Management KPI Metrics And Dashboard Icons PDF
Deliver an awe-inspiring pitch with this creative eco friendly and feasibility management kpi metrics and dashboard icons pdf. bundle. Topics like kpi metrics, dashboard can be discussed with this completely editable template. It is available for immediate download depending on the needs and requirements of the user.

Summary Of Regional Marketing Strategy Regional Sales Performance Metrics Dashboard Diagrams PDF
Deliver and pitch your topic in the best possible manner with this summary of regional marketing strategy regional sales performance metrics dashboard diagrams pdf. Use them to share invaluable insights on regional sales performance metrics dashboard and impress your audience. This template can be altered and modified as per your expectations. So, grab it now.

Performance Training Action Plan And Extensive Strategies Performance Coaching Dashboard With Various Metrics Infographics PDF
Deliver an awe inspiring pitch with this creative performance training action plan and extensive strategies performance coaching dashboard with various metrics infographics pdf bundle. Topics like performance coaching dashboard with various metrics can be discussed with this completely editable template. It is available for immediate download depending on the needs and requirements of the user.
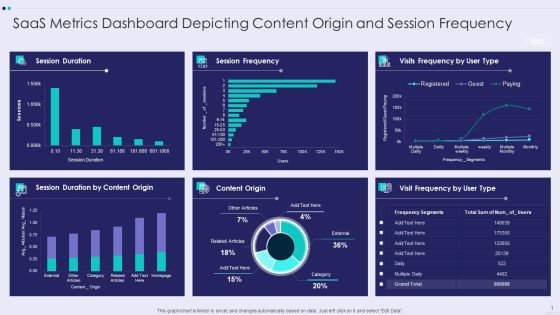
Saas Metrics Dashboard Depicting Content Origin And Session Frequency Formats PDF
Showcasing this set of slides titled Saas Metrics Dashboard Depicting Content Origin And Session Frequency Formats PDF The topics addressed in these templates are Saas Metrics Dashboard Depicting Content Origin And Session Frequency All the content presented in this PPT design is completely editable. Download it and make adjustments in color, background, font etc. as per your unique business setting.
Robotic Process Automation Metrics Performance Analysis KPI Dashboard Icon Graphics PDF
Pitch your topic with ease and precision using this Robotic Process Automation Metrics Performance Analysis KPI Dashboard Icon Graphics PDF. This layout presents information on Robotic Process Automation Metrics, Performance Analysis, Kpi Dashboard Icon. It is also available for immediate download and adjustment. So, changes can be made in the color, design, graphics or any other component to create a unique layout.

Business To Business Account Metrices To Track Sales Team Performance Background PDF
This slide provides information regarding various metrics catered to track sales team performance in terms of average revenue per account, win rate, NPS, along with sales representative performance tracking through number of opportunities created, lead response time, etc. Deliver an awe inspiring pitch with this creative Business To Business Account Metrices To Track Sales Team Performance Background PDF bundle. Topics like Average Revenue Per Account, Customer, Product, Sales Representatives Performance Tracking can be discussed with this completely editable template. It is available for immediate download depending on the needs and requirements of the user.
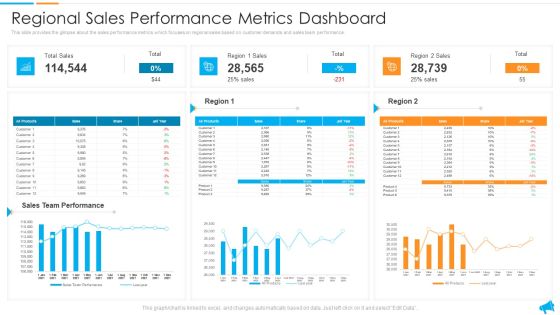
Strategy For Regional Economic Progress Outlining Regional Sales Performance Metrics Dashboard Designs PDF
This slide provides the glimpse about the sales performance metrics which focuses on regional sales based on customer demands and sales team performance. Deliver and pitch your topic in the best possible manner with this strategy for regional economic progress outlining regional sales performance metrics dashboard designs pdf. Use them to share invaluable insights on sales team performance, regional sales performance metrics dashboard and impress your audience. This template can be altered and modified as per your expectations. So, grab it now.
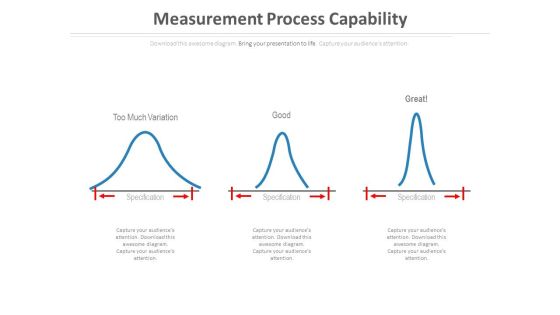
Measurement Process Capability Ppt Slides
This is a measurement process capability ppt slides. This is a three stage process. The stages in this process are business
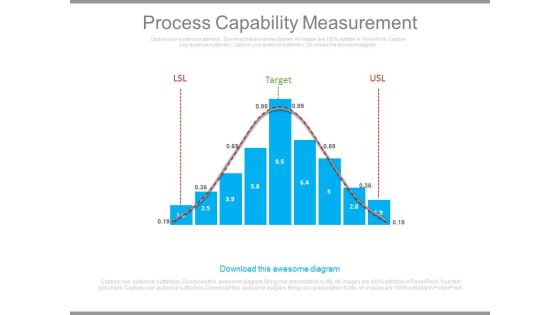
Process Capability Measurement Ppt Slides
This is a process capability measurement ppt slides. This is a nine stage process. The stages in this process are success, business.\n\n

Quality Control Measures Ppt Slides
This is a quality control measures ppt slides. This is a three stage process. The stages in this process are quality policy, quality assurance regulations, quality assurance standard.

Profitability Measurement Ppt Slide Design
This is a profitability measurement ppt slide design. This is a three stage process. The stages in this process are profitability, monitor result, revenue, expenses.
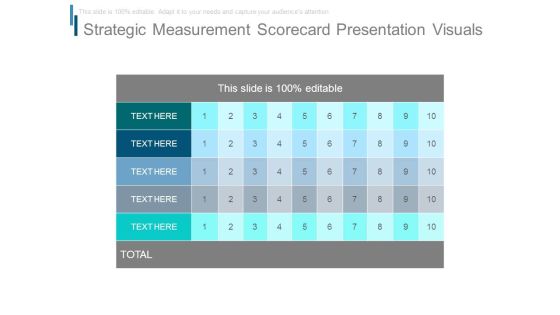
Strategic Measurement Scorecard Presentation Visuals
This is a strategic measurement scorecard presentation visuals. This is a ten stage process. The stages in this process are table, management, strategy, business, scorecard.
 Home
Home