Improvement Chart

Profit After Tax Pat Growth Chart Powerpoint Slide Designs Download
This is a profit after tax pat growth chart powerpoint slide designs download. This is a five stage process. The stages in this process are growth, success, business, strategy, marketing.

Xbar And R Chart Ppt PowerPoint Presentation Example 2015
This is a xbar and r chart ppt powerpoint presentation example 2015. This is a two stage process. The stages in this process are business, strategy, marketing, success, growth strategy.

PowerPoint Slide Designs Chart Quadrant Diagram Ppt Design Slides
PowerPoint Slide Designs Chart Quadrant Diagram PPT Design Slides-These high quality powerpoint pre-designed slides and powerpoint templates have been carefully created by our professional team to help you impress your audience. All slides have been created and are 100% editable in powerpoint. Each and every property of any graphic - color, size, orientation, shading, outline etc. can be modified to help you build an effective powerpoint presentation. Any text can be entered at any point in the powerpoint template or slide. Simply DOWNLOAD, TYPE and PRESENT!

Staked Line Chart Ppt PowerPoint Presentation Model Graphics Download
This is a staked line chart ppt powerpoint presentation model graphics download. This is a two stage process. The stages in this process are business, marketing, growth, finance, management.

Enterprise Value Timing Factors Chart Ppt Examples Professional
This is a enterprise value timing factors chart ppt examples professional. This is a four stage process. The stages in this process are industry dynamics, company performance, organic growth, strategic acquisitions.
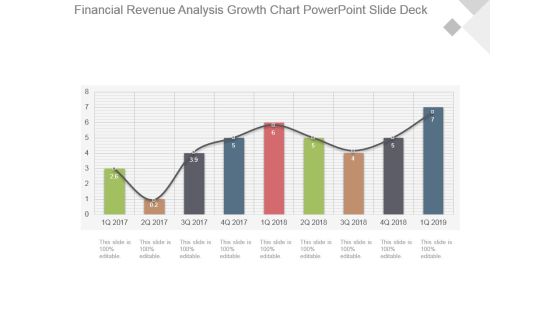
Financial Revenue Analysis Growth Chart Powerpoint Slide Deck
This is a financial revenue analysis growth chart powerpoint slide deck. This is a nine stage process. The stages in this process are growth, success, business, marketing, bar graph.

Circular Chart To Show Business Process Ppt PowerPoint Presentation Microsoft
This is a circular chart to show business process ppt powerpoint presentation microsoft. This is a five stage process. The stages in this process are business, marketing, strategy, process, icons.
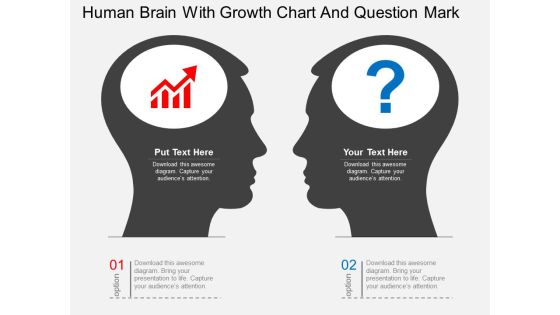
Human Brain With Growth Chart And Question Mark Powerpoint Template
This PowerPoint template has been designed with graphics of human brain with growth chart and question mark. This diagram can be used to display creative thinking in business. Capture the attention of your audience with this slide.
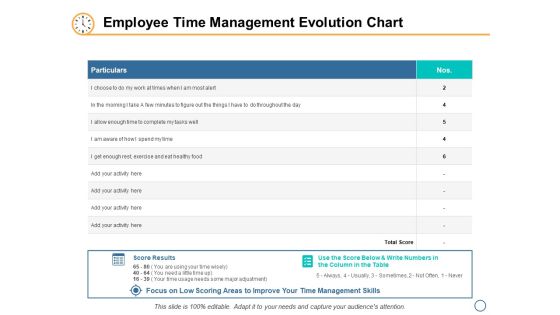
Employee Time Management Evolution Chart Ppt PowerPoint Presentation Slides Outfit
This is a employee time management evolution chart ppt powerpoint presentation slides outfit. This is a two stage process. The stages in this process are business, planning, strategy, marketing, management.
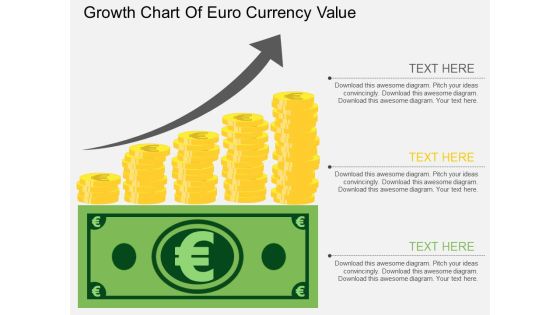
Growth Chart Of Euro Currency Value Powerpoint Template
The above PPT template displays growth chart of Euro currency. This diagram helps to exhibit Euro currency value growth. Adjust the above diagram in your business presentations to visually support your content.
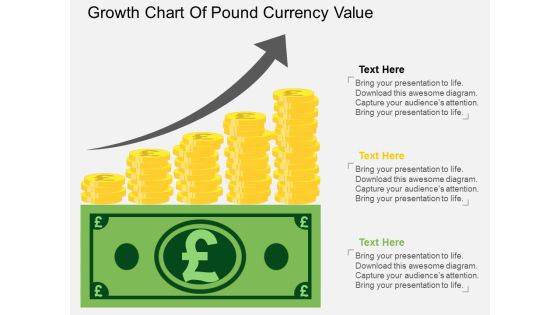
Growth Chart Of Pound Currency Value Powerpoint Template
The above PPT template displays growth chart of Pound currency. This diagram helps to exhibit Pound currency value growth. Adjust the above diagram in your business presentations to visually support your content.
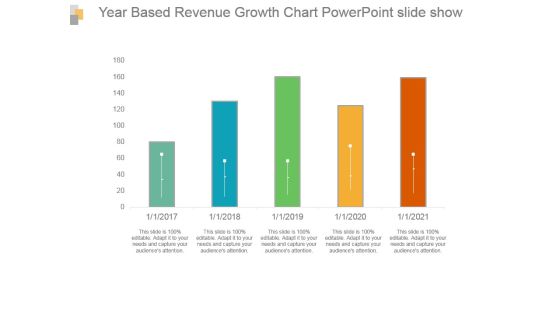
Year Based Revenue Growth Chart Powerpoint Slide Show
This is a year based revenue growth chart powerpoint slide show. This is a five stage process. The stages in this process are bar graph, growth, revenue, year, success.

Curve Chart For Product Life Cycle Presentation Outline
This is a curve chart for product life cycle presentation outline. This is a five stage process. The stages in this process are sales over time, product extension, introduction, growth, maturity, decline, time.

Email Marketing Performance Chart Ppt Powerpoint Presentation Pictures Show
This is a email marketing performance chart ppt powerpoint presentation pictures show. This is a nine stage process. The stages in this process are finance, planning, marketing, business, management, strategy.

Scatter Bubble Chart Template Ppt PowerPoint Presentation Professional Background
This is a scatter bubble chart template ppt powerpoint presentation professional background. This is a six stage process. The stages in this process are business, marketing, strategy, planning, finance.

Content Sharing Gantt Chart With Key Milestones Elements PDF
This slide showcases content distribution Gantt chart that can help to keep track the progress of online marketing process. Its key elements are target audience research, decide content, audit content, content distribution channel decision, KPIs, built editorial content and distribute plus market you content Showcasing this set of slides titled content sharing gantt chart with key milestones elements pdf. The topics addressed in these templates are content sharing gantt chart with key milestones. All the content presented in this PPT design is completely editable. Download it and make adjustments in color, background, font etc. as per your unique business setting.
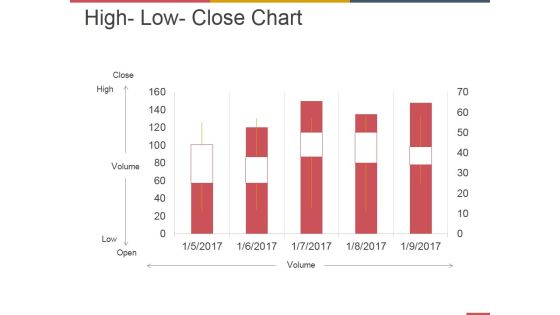
High Low Close Chart Ppt PowerPoint Presentation Summary Ideas
This is a high low close chart ppt powerpoint presentation summary ideas. This is a five stage process. The stages in this process are business, strategy, marketing, analysis, growth.

Bar Chart Ppt PowerPoint Presentation Infographic Template Master Slide
This is a bar chart ppt powerpoint presentation infographic template master slide. This is a two stage process. The stages in this process are growth, finance, business, analysis, marketing.

PowerPoint Presentation Process Layout Business Flow Chart Slides
We present our powerpoint presentation process layout business flow chart Slides.Use our Marketing PowerPoint Templates because networking is an imperative in todays world. You need to access the views of others. Similarly you need to give access to them of your abilities. Use our Leadership PowerPoint Templates because there are so many different pieces to the puzzle. Present our Business PowerPoint Templates because you have selected your team man for man. Download our Shapes PowerPoint Templates because it can bring your ideas to the fore so that all around can know. Dissect each idea to the core and select the best. Use our Arrows PowerPoint Templates because it is all there in bits and pieces.Use these PowerPoint slides for presentations relating to Abstract, Arrow, Arrows, Business, Chart, Design, Development, Diagram, Direction, Element, Flow, Flowchart, Graph, Linear, Management, Model, Motion, Organization, Plan, Process, Program, Section, Segment, Set, Sign, Solution, Strategy, Symbol, Technology,,. The prominent colors used in the PowerPoint template are White, Green, Gray. PowerPoint presentation experts tell us our powerpoint presentation process layout business flow chart Slides are Enchanting. Customers tell us our Chart PowerPoint templates and PPT Slides are Elevated. Use our powerpoint presentation process layout business flow chart Slides are Spectacular. Use our Arrows PowerPoint templates and PPT Slides are Dazzling. We assure you our powerpoint presentation process layout business flow chart Slides are Zippy. People tell us our Chart PowerPoint templates and PPT Slides are Stylish.

Yearly Price List Data Comparison Chart Structure PDF
This slide showcases price catalogue chart that can help in comparing the cost of product in different financial years and calculate the price hiked by organization. It also outlines percentage change in prices Showcasing this set of slides titled yearly price list data comparison chart structure pdf. The topics addressed in these templates are yearly price list data comparison chart. All the content presented in this PPT design is completely editable. Download it and make adjustments in color, background, font etc. as per your unique business setting.

Salesman Principles Playbook Different Products Price Comparison Chart Slides PDF
This slide provides information regarding product price comparison chart that captures information about price per unit, change over list price, reason for proposed price, volumes sold, forecasted growth. Deliver an awe inspiring pitch with this creative salesman principles playbook different products price comparison chart slides pdf bundle. Topics like weekly updates meets, monthly review meetings, quarterly review meetings can be discussed with this completely editable template. It is available for immediate download depending on the needs and requirements of the user.

Three Ponits Chart For Demand Management Process PowerPoint Template
Demand management process can be displayed with this business diagram. It contains graphics of chart with three points. Present your views using this innovative slide and be assured of leaving a lasting impression.
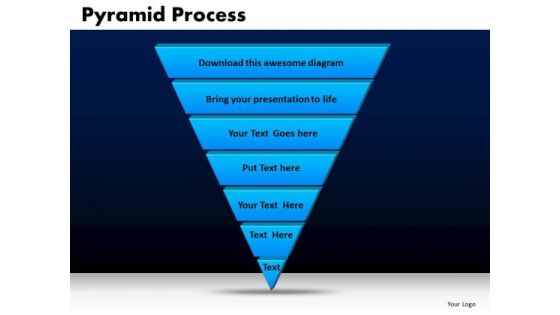
Business Triangles PowerPoint Templates Chart Pyramid Process Ppt Slides
Business Triangles PowerPoint Templates Chart Pyramid Process PPT Slides-A Pyramid Diagram may be defined as representation of data in the form of a triangle separated by horizontal lines. The widest section may contain the general topic while the narrowest section may contain a much more specific topic. -Business Triangles PowerPoint Templates Chart Pyramid Process PPT Slides-This template can be used for presentations relating to 3d, Bar, Business, Chart, Class, Conceptual, Corner, FInance, Graph, Graphic, Hierarchy, Investment, Layer, Level, Performance, Planner, Priority, Progress, Pyramid, Render, Status, Strategy, System, Triangle
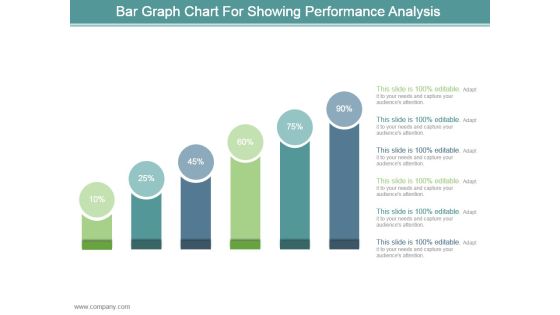
Bar Graph Chart For Showing Performance Analysis Ppt Design
This is a bar graph chart for showing performance analysis ppt design. This is a six stage process. The stages in this process are business, marketing, process, success, presentation.

Agile Kanban Methodology Chart With Stories Ppt Model Show PDF
This slide explains Kanban Methodology through a chart that shows User Story Details, Tasks to be done, Tasks in progress Product Development, Software Quality Check, Testing to be done Automation Processes, Cycle Time Analysis and the activities that are ready to be deployed. Deliver an awe inspiring pitch with this creative agile kanban methodology chart with stories ppt model show pdf bundle. Topics like product development, process enhancements to timely deliver the project, agile kanban methodology chart with stories can be discussed with this completely editable template. It is available for immediate download depending on the needs and requirements of the user.
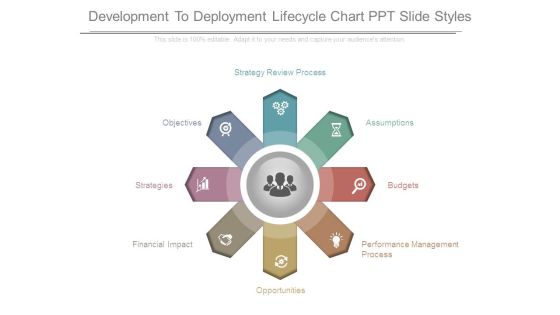
Development To Deployment Lifecycle Chart Ppt Slide Styles
This is a development to deployment lifecycle chart ppt slide styles. This is a eight stage process. The stages in this process are performance management process, opportunities, financial impact, strategies, objectives, strategy review process, assumptions, budgets.

IT Software Web Development Gantt Chart Topics PDF
This slide presents a Gantt chart highlighting various phases of website design plan to help project managers deliver the project on time. It includes phases such as project definition, content, design, development and review. Pitch your topic with ease and precision using this IT Software Web Development Gantt Chart Topics PDF. This layout presents information on Chart, Software, Development. It is also available for immediate download and adjustment. So, changes can be made in the color, design, graphics or any other component to create a unique layout.

Line Chart Ppt PowerPoint Presentation Portfolio Design Templates
This is a line chart ppt powerpoint presentation portfolio design templates. This is a two stage process. The stages in this process are in percentage, in years, percentage, business, graph.
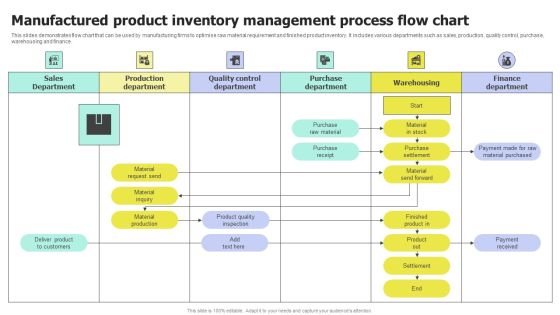
Manufactured Product Inventory Management Process Flow Chart Microsoft PDF
This slide demonstrates flow chart that can be used by manufacturing firms to optimise raw material requirement and finished product inventory. It includes various departments such as sales, production, quality control, purchase, warehousing and finance. Pitch your topic with ease and precision using this Manufactured Product Inventory Management Process Flow Chart Microsoft PDF. This layout presents information on Manufactured Product, Inventory Management, Process Flow Chart. It is also available for immediate download and adjustment. So, changes can be made in the color, design, graphics or any other component to create a unique layout.

Quarterly Relocation Schema Chart Roadmap For Attaining Green Card Themes
Presenting our jaw dropping quarterly relocation schema chart roadmap for attaining green card themes. You can alternate the color, font size, font type, and shapes of this PPT layout according to your strategic process. This PPT presentation is compatible with Google Slides and is available in both standard screen and widescreen aspect ratios. You can also download this well researched PowerPoint template design in different formats like PDF, JPG, and PNG. So utilize this visually appealing design by clicking the download button given below.

Volume High Low Close Chart Ppt PowerPoint Presentation Show Outfit
This is a volume high low close chart ppt powerpoint presentation show outfit. This is a five stage process. The stages in this process are business, strategy, marketing, success, finance, growth.

Column Chart Ppt PowerPoint Presentation Gallery Slide Portrait
This is a column chart ppt powerpoint presentation gallery slide portrait. This is a two stage process. The stages in this process are sales in percentage, financial year, product, bar graph, growth.
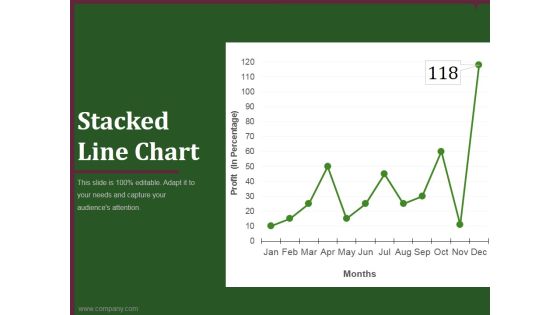
Stacked Line Chart Ppt PowerPoint Presentation Background Image
This is a stacked line chart ppt powerpoint presentation background image. This is a twelve stage process. The stages in this process are business, marketing, analysis, finance, growth strategy.

Volume High Low Close Chart Ppt PowerPoint Presentation Shapes
This is a volume high low close chart ppt powerpoint presentation shapes. This is a five stage process. The stages in this process are business, strategy, analysis, marketing, finance, growth.

Column Chart Ppt PowerPoint Presentation Infographic Template Graphic Images
This is a column chart ppt powerpoint presentation infographic template graphic images. This is a nine stage process. The stages in this process are business, marketing, growth, product, management.
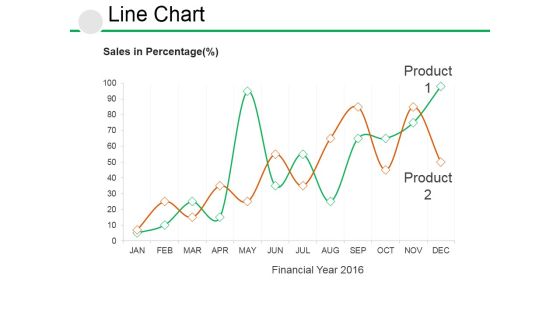
Line Chart Ppt PowerPoint Presentation Visual Aids Example File
This is a line chart ppt powerpoint presentation visual aids example file. This is a two stage process. The stages in this process are business, growth, strategy, analysis, management.

Scatter Bubble Chart Ppt PowerPoint Presentation Professional Model
This is a scatter bubble chart ppt powerpoint presentation professional model. This is a six stage process. The stages in this process are sales in profit, financial year, growth, business, marketing, strategy.

Area Chart Ppt PowerPoint Presentation File Graphic Tips
This is a area chart ppt powerpoint presentation file graphic tips. This is a two stage process. The stages in this process are product, in percentage, financial year, business, growth.

Column Chart Ppt PowerPoint Presentation Gallery Graphics Example
This is a column chart ppt powerpoint presentation gallery graphics example. This is a two stage process. The stages in this process are expenditure in, years, business, marketing, growth.

Column Chart Ppt PowerPoint Presentation Infographic Template Example File
This is a column chart ppt powerpoint presentation infographic template example file. This is a two stage process. The stages in this process are growth, finance, business, marketing, analysis.

Gross Margin Analysis Bar Chart Powerpoint Slide Backgrounds
This is a gross margin analysis bar chart powerpoint slide backgrounds. This is a two stage process. The stages in this process are bar graph, business, marketing, growth, success.

Dividend Per Share Bar Chart Powerpoint Slide Background Designs
This is a dividend per share bar chart powerpoint slide background designs. This is a five stage process. The stages in this process are business, marketing, success, growth, bar graph.

Column Chart Ppt PowerPoint Presentation Model Graphics Download
This is a column chart ppt powerpoint presentation model graphics download. This is a two stage process. The stages in this process are product, financial year, sales in percentage, bar graph, success.

Ppt Slide Funnel Chart For Sales Process Plan
Touch Base With Our PPT Slide funnel chart for sales process plan Powerpoint Templates. Review Your Growth With Your Audience. Take A Deep Dive With Our Business Plan Powerpoint Templates. Get Into The Nitti Gritty Of It All.

Bar Chart Ppt PowerPoint Presentation Infographic Template Skills
This is a bar chart ppt powerpoint presentation infographic template skills. This is a nine stage process. The stages in this process are sales in percentage, finance, business, marketing, strategy, success.

Volume Open High Low Close Chart Ppt PowerPoint Presentation Show
This is a volume open high low close chart ppt powerpoint presentation show. This is a five stage process. The stages in this process are product, marketing, business, management, strategy.

Line Chart Ppt PowerPoint Presentation Model Design Templates
This is a line chart ppt powerpoint presentation model design templates. This is a two stage process. The stages in this process are sales in percentage, financial years, product.

Combo Chart Ppt PowerPoint Presentation Infographic Template Brochure
This is a combo chart ppt powerpoint presentation infographic template brochure. This is a eight stage process. The stages in this process are product, market size, strategy, business, marketing.
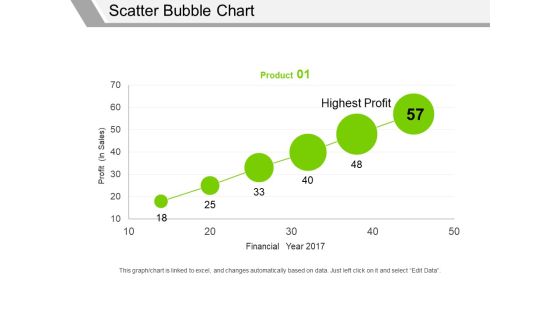
Scatter Bubble Chart Ppt PowerPoint Presentation Professional Graphics Pictures
This is a scatter bubble chart ppt powerpoint presentation professional graphics pictures. This is a one stage process. The stages in this process are profit in sales, financial year, highest profit, product.
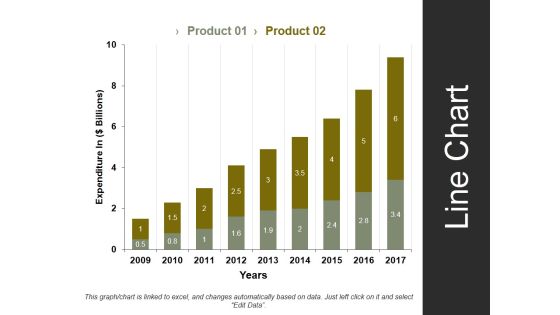
Line Chart Template 1 Ppt PowerPoint Presentation Styles Summary
This is a line chart template 1 ppt powerpoint presentation styles summary. This is a two stage process. The stages in this process are expenditure in, years, business, marketing, strategy.
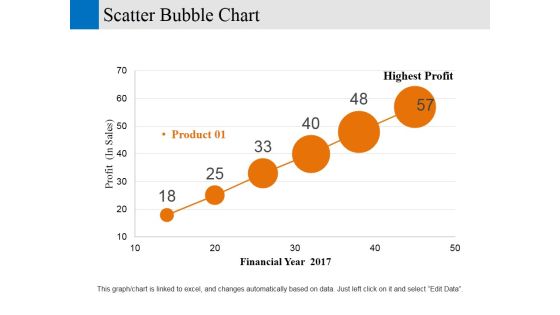
Scatter Bubble Chart Ppt PowerPoint Presentation Gallery Designs Download
This is a scatter bubble chart ppt powerpoint presentation gallery designs download. This is a six stage process. The stages in this process are financial year, profit, business, marketing, strategy.

Column Chart Marketing Management Ppt PowerPoint Presentation Professional Images
This is a column chart marketing management ppt powerpoint presentation professional images. This is a three stage process. The stages in this process are finance, marketing, management, investment, analysis.

Three Months Relocation Schema Chart Roadmap For Permanent Residence Guidelines
Presenting our jaw dropping three months relocation schema chart roadmap for permanent residence guidelines. You can alternate the color, font size, font type, and shapes of this PPT layout according to your strategic process. This PPT presentation is compatible with Google Slides and is available in both standard screen and widescreen aspect ratios. You can also download this well researched PowerPoint template design in different formats like PDF, JPG, and PNG. So utilize this visually appealing design by clicking the download button given below.

Departments And Team Hierarchy Chart Ppt PowerPoint Presentation Styles
This is a departments and team hierarchy chart ppt powerpoint presentation styles. This is a three stage process. The stages in this process are director, financial advisor, marketing head, manager, web designer, graphic designer.

Circular Chart Financial Analysis Team Management Ppt PowerPoint Presentation Guide
This is a circular chart financial analysis team management ppt powerpoint presentation guide. This is a four stage process. The stages in this process are puzzle, teamwork, business, marketing, analysis.

combo chart template 2 ppt powerpoint presentation background images
This is a combo chart template 2 ppt powerpoint presentation background images. This is a four stage process. The stages in this process are business, marketing, finance, timeline, product.

Example Of Channel Distribution Flow Chart Ppt Examples
This is a example of channel distribution flow chart ppt examples. This is a one stage process. The stages in this process are white castle, ford, retailer, delmont, wholesaler, retailer.

Employee Succession Chart For Succession Plan Elements PDF
This slide displays the replacement chart for succession planning of employees in an organisation. It includes the current positions that are vacant, with replacements and their present positions . Presenting Employee Succession Chart For Succession Plan Elements PDF to dispense important information. This template comprises two stages. It also presents valuable insights into the topics including Plan, Employee, Succession. This is a completely customizable PowerPoint theme that can be put to use immediately. So, download it and address the topic impactfully.
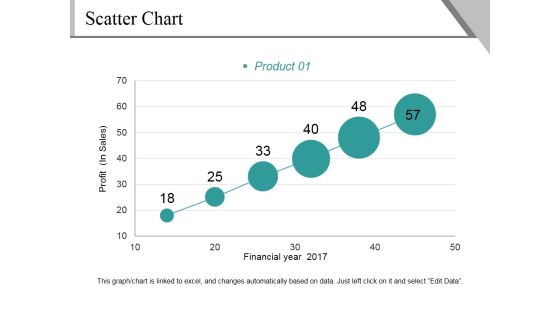
Scatter Chart Ppt PowerPoint Presentation File Background Image
This is a scatter chart ppt powerpoint presentation file background image. This is a six stage process. The stages in this process are profit, financial year, product, growth, success.

Scatter Chart Ppt PowerPoint Presentation Ideas Designs Download
This is a scatter chart ppt powerpoint presentation ideas designs download. This is a one stage process. The stages in this process are product, dollar, in percentage, growth, success.
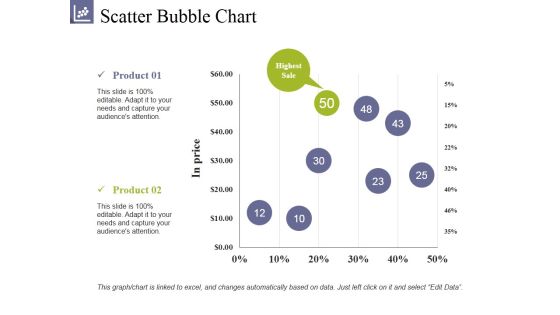
Scatter Bubble Chart Ppt PowerPoint Presentation Summary Clipart
This is a scatter bubble chart ppt powerpoint presentation summary clipart. This is a two stage process. The stages in this process are product, highest sale, in prices, growth, success.

Money Growth Chart On Laptop With Mouse Powerpoint Template
This business slide displays money growth chart on laptop with mouse. This diagram is a data visualization tool that gives you a simple way to present statistical information. This slide helps your audience examine and interpret the data you present.

Area Chart Ppt PowerPoint Presentation Show Layout Ideas
This is a area chart ppt powerpoint presentation show layout ideas. This is a two stage process. The stages in this process are product, in percentage, financial year, growth.

Area Chart Ppt PowerPoint Presentation Infographic Template Samples
This is a area chart ppt powerpoint presentation infographic template samples. This is a two stage process. The stages in this process are in percentage product, business, marketing, growth.
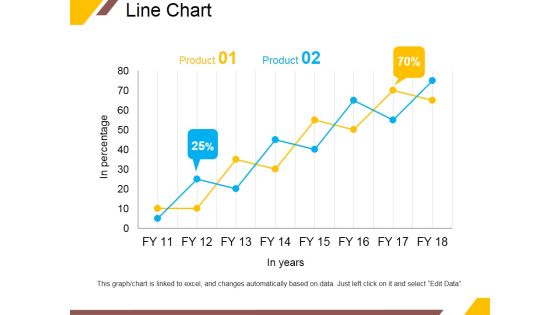
Line Chart Ppt PowerPoint Presentation Portfolio Infographic Template
This is a line chart ppt powerpoint presentation portfolio infographic template. This is a two stage process. The stages in this process are product, in years, business, percentage, growth.
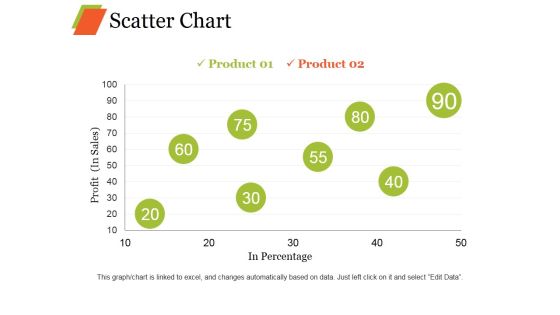
Scatter Chart Ppt PowerPoint Presentation Professional Graphic Images
This is a scatter chart ppt powerpoint presentation professional graphic images. This is a eight stage process. The stages in this process are product, profit, in percentage growth, business.

Successive Demonstration Using Hands Flow Chart Creator PowerPoint Templates
We present our successive demonstration using hands flow chart creator PowerPoint templates. Use our Symbol PowerPoint Templates because, are the tools that helped most of us evolve. Use our Business PowerPoint Templates because, Marketing Strategy Business Template:- Maximizing sales of your product is the intended destination. Use our Metaphor PowerPoint Templates because, Profit fairly earned is what you believe in. Use our Abstract PowerPoint Templates because, Forward thinking is the way to go. Use our Process and Flows PowerPoint Templates because, Original thinking is the need of the hour. Use these PowerPoint slides for presentations relating to Description using hands steps, Business, Collection, Connection, Cursor, Decoration, Design, Dimensional, Direction, Element, Icon, Illustration, Information, Modern, Motion, Paper, Perspective, Plastic, Pointer, Pointing, Process, Recycle, Recycling, Reflective, Set, Shape, Shiny, Sign, Symbol, Technology. The prominent colors used in the PowerPoint template are Green, Gray, and Black

Kano Analysis Line Chart Powerpoint Slide Design Ideas
This is a kano analysis line chart powerpoint slide design ideas. This is a three stage process. The stages in this process are customer needs in the kano model, exciter, performance, basic, implementation level.

Scatter Bubble Chart Ppt PowerPoint Presentation Summary Files
This is a scatter bubble chart ppt powerpoint presentation summary files. This is a six stage process. The stages in this process are product, financial year, profit, highest profit.
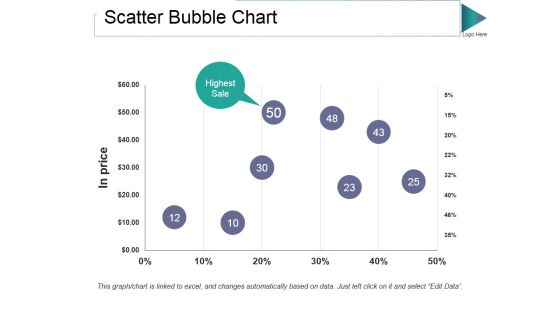
Scatter Bubble Chart Ppt PowerPoint Presentation Gallery Guidelines
This is a scatter bubble chart ppt powerpoint presentation gallery guidelines. This is a one stage process. The stages in this process are in price, highest sale, percentage, finance, business.

Business Analysis Chart Vector Icon Ppt PowerPoint Presentation Professional Display
This is a business analysis chart vector icon ppt powerpoint presentation professional display. This is a four stage process. The stages in this process are business marketing plan, business marketing strategies, business marketing approach.

Gantt Chart For Business Promotion Activities Sample PDF
Design a highly optimized project management report using this well-researched gantt chart for business promotion activities sample pdf. This layout can be used to present the professional details of a task or activity. Showcase the activities allocated to the business executives with this Gantt Chart PowerPoint theme. List down the column tasks in various timeframes and allocate time for each. In addition, also monitor the actual time and make comparisons to interpret the final progress using this innovative Gantt Chart Template. Showcase the work breakdown structure to attract your audience. Download and share it using Google Slides, if it suits your requirement.

Project Gantt Chart Showing Design Blueprint Rules PDF
Design a highly optimized project management report using this well-researched project gantt chart showing design blueprint rules pdf. This layout can be used to present the professional details of a task or activity. Showcase the activities allocated to the business executives with this Gantt Chart PowerPoint theme. List down the column tasks in various timeframes and allocate time for each. In addition, also monitor the actual time and make comparisons to interpret the final progress using this innovative Gantt Chart Template. Showcase the work breakdown structure to attract your audience. Download and share it using Google Slides, if it suits your requirement.

Custom Website Development Chart Powerpoint Slides Templates Download
This is a custom website development chart powerpoint slides templates download. This is a six stage process. The stages in this process are analyze requirement, design architecture, implementation, integration, quality control, refinement, deployment.

Business Development Process Flow Chart Ppt PowerPoint Presentation Icon Show
This is a business development process flow chart ppt powerpoint presentation icon show. This is a three stage process. The stages in this process are operational excellence, operational plan, operational process.

Brand Positioning Chart Ppt PowerPoint Presentation Show Example File
This is a brand positioning chart ppt powerpoint presentation show example file. This is a five stage process. The stages in this process are own product, business, marketing, strategy, analysis.

Succession Planning Modelling Chart Ppt PowerPoint Presentation Professional Outline
This is a succession planning modelling chart ppt powerpoint presentation professional outline. The topics discussed in this diagram are marketing, business, management, planning, strategy This is a completely editable PowerPoint presentation, and is available for immediate download.
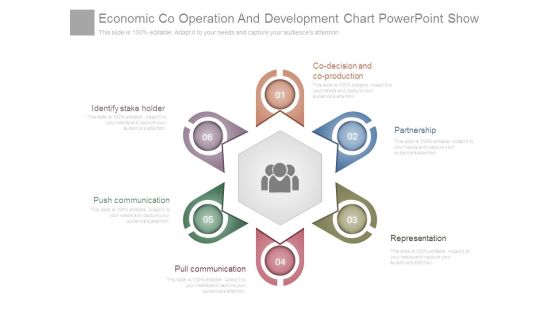
Economic Co Operation And Development Chart Powerpoint Show
This is a economic co operation and development chart powerpoint show. This is a six stage process. The stages in this process are co decision and co production, partnership, representation, pull communication, push communication, identify stake holder.

Organizational Growth Proposal Gantt Chart One Pager Sample Example Document
Presenting you an exemplary Organizational Growth Proposal Gantt Chart One Pager Sample Example Document. Our one-pager comprises all the must-have essentials of an inclusive document. You can edit it with ease, as its layout is completely editable. With such freedom, you can tweak its design and other elements to your requirements. Download this Organizational Growth Proposal Gantt Chart One Pager Sample Example Document brilliant piece now.
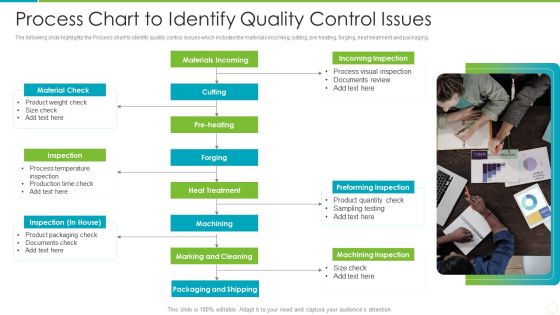
Process Chart To Identify Quality Control Issues Background PDF
The following slide highlights the Process chart to identify quality control issues which includes the materials incoming, cutting, pre heating, forging, heat treatment and packaging. Presenting process chart to identify quality control issues background pdf to dispense important information. This template comprises one stages. It also presents valuable insights into the topics including Materials Incoming, Incoming Inspection, Preforming Inspection. This is a completely customizable PowerPoint theme that can be put to use immediately. So, download it and address the topic impactfully.

Bar Chart Ppt PowerPoint Presentation Infographics Format Ideas
This is a bar chart ppt powerpoint presentation infographics format ideas. This is a two stage process. The stages in this process are bar graph, product, financial year, sales in percentage.

Competitive Analysis Bubble Chart Template 1 Ppt PowerPoint Presentation Influencers
This is a competitive analysis bubble chart template 1 ppt powerpoint presentation influencers. This is a six stage process. The stages in this process are business, strategy, marketing, success, process.
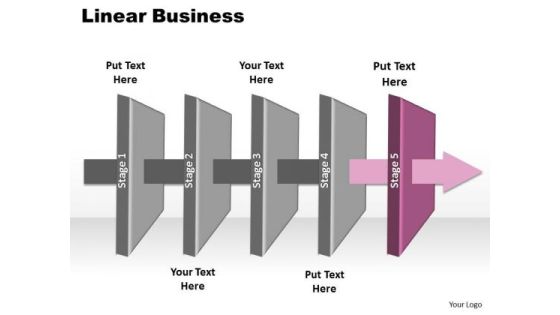
Ppt 5 Layers Internet Marketing PowerPoint Presentation Process Chart Templates
PPT 5 layers internet marketing powerpoint presentation process chart Templates-This PowerPoint Diagram shows you the 3d Horizontal Illustration to explain Internet Marketing. It consists of Five Layers explaining fifth here. It imitates advertise, barter, display, exchange, merchandise, offer for sale, retail, vend, wholesale etc.-PPT 5 layers internet marketing powerpoint presentation process chart Templates-3d, arrow, art, business, chart, chevron, clip, clipart, colorful, compliance, corporate, design, development, diagram, executive, flow, glossy, graph, graphic, green, hierarchy, icon, illustration, implement, infographic, levels, marketing, modern, orange, org, organization, organize, pink, plan, process, red, review, set, shadow, shape, shiny, square, stages, vector

Agile Kanban Methodology Chart With Stories Formats PDF
This slide explains Kanban Methodology through a chart that shows User Story Details, Tasks to be done, Tasks in progress Product Development, Software Quality Check, Testing to be done Automation Processes, Cycle Time Analysis and the activities that are ready to be deployed. Deliver an awe-inspiring pitch with this creative agile kanban methodology chart with stories formats pdf bundle. Topics like agile kanban methodology chart with stories can be discussed with this completely editable template. It is available for immediate download depending on the needs and requirements of the user.

Project Status Bar Chart Ppt PowerPoint Presentation Ideas Objects
This is a project status bar chart ppt powerpoint presentation ideas objects. This is a four stage process. The stages in this process are project management, project progress, project growth.
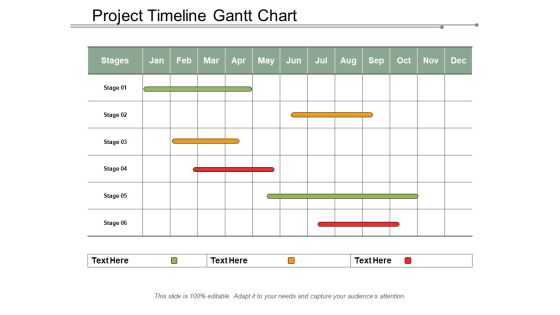
Project Timeline Gantt Chart Ppt PowerPoint Presentation Gallery
This is a project timeline gantt chart ppt powerpoint presentation gallery. This is a three stage process. The stages in this process are project management, project progress, project growth.

Quality Cost Report Trend Chart Ppt PowerPoint Presentation Pictures Themes
This is a quality cost report trend chart ppt powerpoint presentation pictures themes. This is a four stage process. The stages in this process are finance, strategy, marketing, management, business.

Volume Open High Low Close Chart Ppt PowerPoint Presentation Themes
This is a volume open high low close chart ppt powerpoint presentation themes. This is a five stage process. The stages in this process are high, volume, close, low.

Control Chart Template 2 Ppt PowerPoint Presentation Portfolio Summary
This is a control chart template 2 ppt powerpoint presentation portfolio summary. This is a one stage process. The stages in this process are upper control limit, process segment, process change, unstable trend, lower control limit.
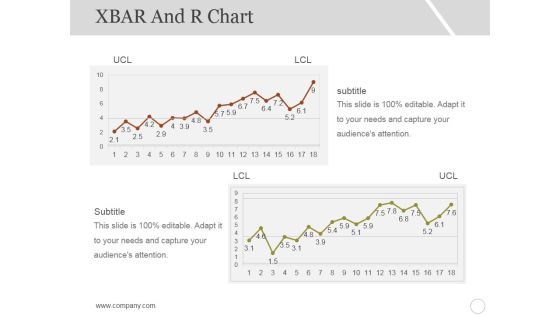
Xbar And R Chart Ppt PowerPoint Presentation Inspiration Styles
This is a xbar and r chart ppt powerpoint presentation inspiration styles. This is a two stage process. The stages in this process are subtitle, lcl, ucl, growth, graph.

Control Chart Template 1 Ppt PowerPoint Presentation Ideas Images
This is a control chart template 1 ppt powerpoint presentation ideas images. This is a two stage process. The stages in this process are average range or quality, upper control limit, lower control limit, time, process average.

Venn Business Chart With Percentage Value Powerpoint Template
This PPT slide contains Venn business chart with percentage values. This PPT diagram is suitable to present data comparison and analysis. Enlighten others on the process with this innovative PowerPoint template.

Automated Email Flow Chart Ppt Powerpoint Presentation Infographics Show
This is a automated email flow chart ppt powerpoint presentation infographics show. This is a three stage process. The stages in this process are check email, achieve, process inbox, do i want replay now, create task in task manager.

Data Collection And Analysis Control Chart Ppt PowerPoint Presentation Visuals
This is a data collection and analysis control chart ppt powerpoint presentation visuals. This is a ten stage process. The stages in this process are upper limit, centerline, lower limit, plotted points.
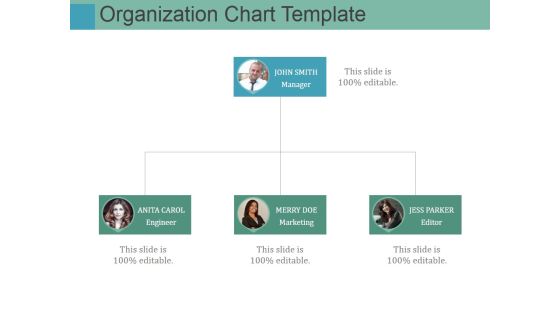
Organization Chart Template Ppt PowerPoint Presentation Infographic Template Styles
This is a organization chart template ppt powerpoint presentation infographic template styles. This is a four stage process. The stages in this process are john smith, anita carol, merry doe, jess parker.

Vision And Mission Statement Chart Ppt PowerPoint Presentation Model Demonstration
This is a vision and mission statement chart ppt powerpoint presentation model demonstration. This is a two stage process. The stages in this process are vision, mission, business, strategy, management.

Line Chart Ppt Powerpoint Presentation Infographic Template Format
This is a line chart ppt powerpoint presentation infographic template format. This is a two stage process. The stages in this process are jan, feb, mar, apr, may, financial.

High Low Close Chart Ppt PowerPoint Presentation Layouts Visual Aids
This is a high low close chart ppt powerpoint presentation layouts visual aids. This is a ten stage process. The stages in this process are volume, high, low, close.
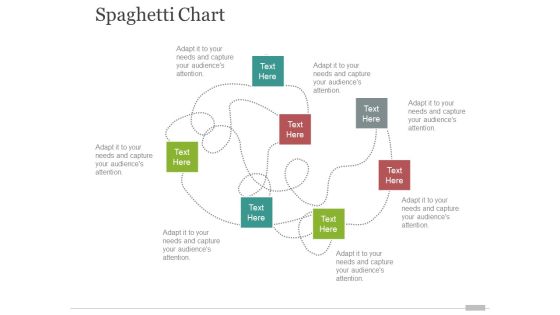
spaghetti chart template 2 ppt powerpoint presentation inspiration portfolio
This is a spaghetti chart template 2 ppt powerpoint presentation inspiration portfolio. This is a seven stage process. The stages in this process are business, marketing, management, analysis, strategy.

Scatter Bubble Chart Ppt PowerPoint Presentation Styles Objects
This is a scatter bubble chart ppt powerpoint presentation styles objects. This is a two stage process. The stages in this process are product, in price, highest sale, percentage, finance.

Hierarchical Organization Chart Ppt PowerPoint Presentation Ideas Skills
This is a hierarchical organization chart ppt powerpoint presentation ideas skills. This is a three stage process. The stages in this process are business ownership, family business, owned business.

Economic Cooperation And Development Chart Powerpoint Slide Themes
This is a economic cooperation and development chart powerpoint slide themes. This is a five stage process. The stages in this process are partnership, participation, consultation, communication, identify, stakeholders.

Business Development Action Plan Chart Template Powerpoint Topics
This is a business development action plan chart template powerpoint topics. This is a six stage process. The stages in this process are review science, making plans, implementing plans, monitoring, evaluation, monitor implementation.

Decision Support And Knowledge Based Systems Chart Powerpoint Images
This is a decision support and knowledge based systems chart powerpoint images. This is a eight stage process. The stages in this process are situation, operational management, tactical management, options, state problem, analyse, strategic management, action.
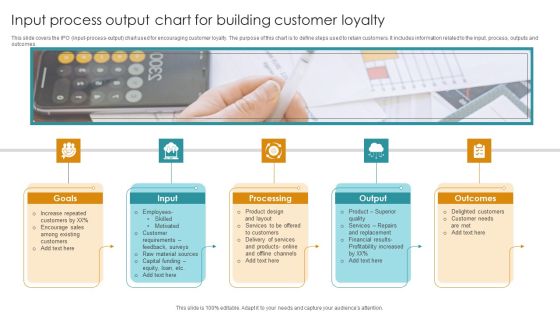
Input Process Output Chart For Building Customer Loyalty Formats PDF
This slide covers the IPO input-process-output chart used for encouraging customer loyalty. The purpose of this chart is to define steps used to retain customers. It includes information related to the input, process, outputs and outcomes. Persuade your audience using this Input Process Output Chart For Building Customer Loyalty Formats PDF. This PPT design covers Five stages, thus making it a great tool to use. It also caters to a variety of topics including Goals, Input, Processing. Download this PPT design now to present a convincing pitch that not only emphasizes the topic but also showcases your presentation skills.

Design Development New Product Chart Good Ppt Example
This is a design development new product chart good ppt example. This is a six stage process. The stages in this process are idea generation, marketing strategy development, product development, idea screening, concept development and testing, test marketing.
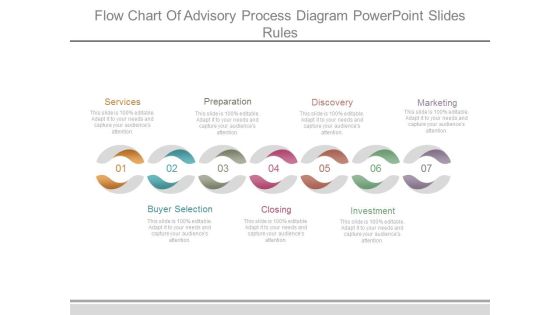
Flow Chart Of Advisory Process Diagram Powerpoint Slides Rules
This is a flow chart of advisory process diagram powerpoint slides rules. This is a seven stage process. The stages in this process are services, buyer selection, preparation, closing, discovery, investment, marketing.
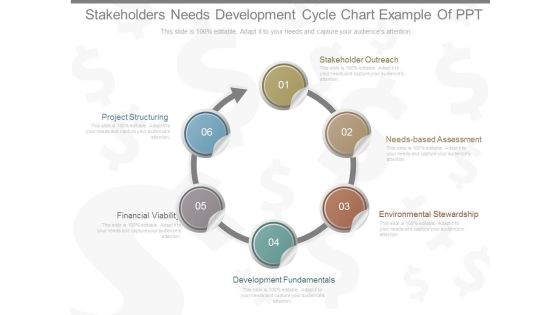
Stakeholders Needs Development Cycle Chart Example Of Ppt
This is a stakeholders needs development cycle chart example of ppt. This is a six stage process. The stages in this process are stakeholder outreach, needs based assessment, environmental stewardship,, development fundamentals, financial viability, project structuring.

Corporate Structure And Organization Chart Development Ppt Powerpoint Guide
This is a corporate structure and organization chart development ppt powerpoint guide. This is a six stage process. The stages in this process are relationship, structure, purpose, mechanisms, rewards, leadership.

Strategy Development Fro Effective Market Chart Powerpoint Guide
This is a strategy development fro effective market chart powerpoint guide. This is a six stage process. The stages in this process are customers, leading distributors, other competitors, suppliers to the target, local provincial governments, associations institutions, target company management.

Volume High Low Close Chart Ppt PowerPoint Presentation Outline Examples
This is a volume high low close chart ppt powerpoint presentation outline examples. This is a five stage process. The stages in this process are high, low, volume, graph, business.

Successive Demonstration Using Hands Production Planning Flow Chart PowerPoint Templates
We present our successive demonstration using hands production planning flow chart PowerPoint templates. Use our Symbol PowerPoint Templates because; In any endeavor people matter most. Use our Business PowerPoint Templates because, Marketing Strategy Business Template:- Maximizing sales of your product is the intended destination. Use our Metaphor PowerPoint Templates because; educate your staff on the means to provide the required support for speedy recovery. Use our Abstract PowerPoint Templates because; Use our creative template to lay down your views. Use our Process and Flows PowerPoint Templates because, Our PowerPoint templates designed for your ideas to sell. Use these PowerPoint slides for presentations relating to Description using hands steps, Business, Collection, Connection, Cursor, Decoration, Design, Dimensional, Direction, Element, Icon, Illustration, Information, Modern, Motion, Paper, Perspective, Plastic, Pointer, Pointing, Process, Recycle, Recycling, Reflective, Set, Shape, Shiny, Sign, Symbol, Technology. The prominent colors used in the PowerPoint template are Blue, Gray, and Black
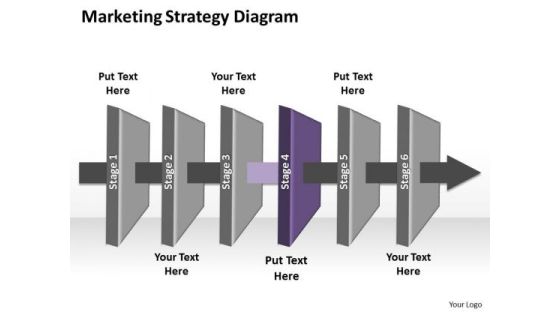
Ppt Linear Forging Process PowerPoint Slides Marketing Startegy Chart Templates
PPT linear forging process powerpoint slides marketing startegy chart Templates-Emphatically define your message with our above template which contains a graphic of boxes as stages and a straight arrow pointing to the right. Use it to show groups of interconnected information. Highlight the depth of your thought process.-PPT linear forging process powerpoint slides marketing startegy chart Templates-3d, Air, Arrow, Art, Business, Chart, Clip, Clipart, Cooling, Diagram, Drip, Drop, Dry, Energy, Eps10, Evaporate, Evaporating, Evaporation, Graphic, Heat, Icon, Illustration, Isolated, Isometric, Layers, Material, Moisture, Process

Tools To Measure Event Marketing Chart Powerpoint Slides Deck Template
This is a tools to measure event marketing chart powerpoint slides deck template. This is a six stage process. The stages in this process are cross functional, business intelligence, sales and promotion, going viral, driving roi, growing fans.
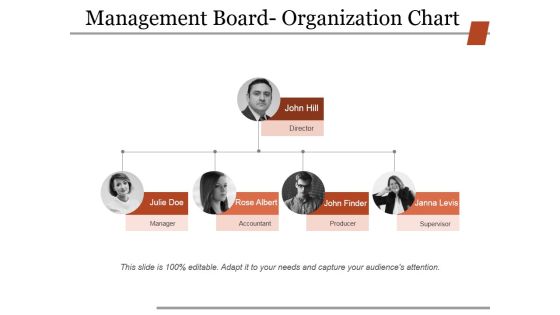
Management Board Organization Chart Ppt PowerPoint Presentation Slides Infographics
This is a management board organization chart ppt powerpoint presentation slides infographics. This is a four stage process. The stages in this process are manager, accountant, producer, supervisor, director.
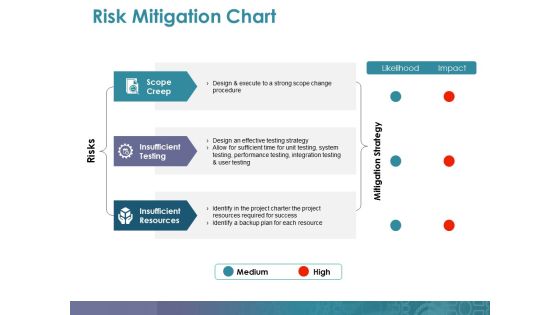
Risk Mitigation Chart Ppt PowerPoint Presentation Professional Guidelines
This is a risk mitigation chart ppt powerpoint presentation professional guidelines. This is a three stage process. The stages in this process are scope creep, insufficient testing, insufficient resources, mitigation strategy, risks.

Customer Loyalty Circle Chart Powerpoint Slide Templates Download
This is a customer loyalty circle chart powerpoint slide templates download. This is a six stage process. The stages in this process are grow, engage, attract, reward, retain, loyalty.
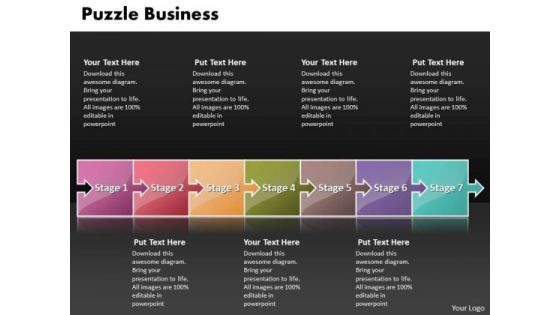
Ppt Puzzle New Business PowerPoint Presentation Process Flow Chart Templates
PPT puzzle new business powerpoint presentation process flow chart Templates-This Diagram shows how items are related to one another. Present your views using our innovative slide and be assured of leaving a lasting impression.-PPT puzzle new business powerpoint presentation process flow chart Templates-Abstract, Arrow, Backgrounds, Business, Computer, Concepts, Connection, Cooperation, Creativity, Crowd, Design, Digital, Digitally, Electric, Equalizer, Generated, Graph, Graphic, Group, Icon, Ideas, Illustration, Image, Individuality, Isolated, Leader, Leadership, Link, Motivation, Music, Objects, Order, Part, Pattern, Piece, Playing, Puzzle

Product Life Cycle Management Chart Ppt Slides Design
This is a product life cycle management chart ppt slides design. This is a eight stage process. The stages in this process are introduction, growth, decline, analyze, plan, source, design, insight.
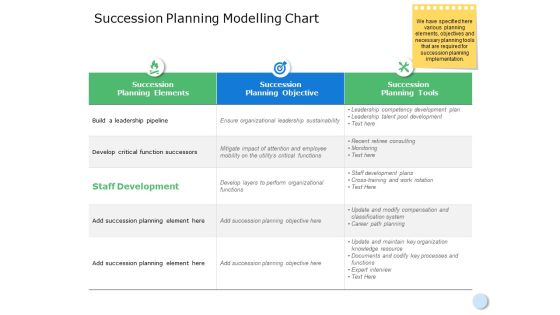
Succession Planning Modelling Chart Ppt Powerpoint Presentation File Professional
This is a succession planning modelling chart ppt powerpoint presentation file professional.The topics discussed in this diagram aresuccession planning elements, compare, planning, business, management. This is a completely editable PowerPoint presentation, and is available for immediate download.
 Home
Home