Improvement Chart
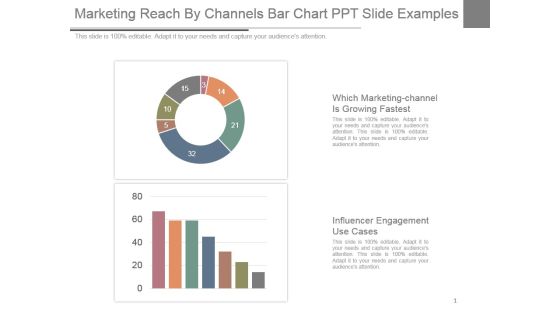
Marketing Reach By Channels Bar Chart Ppt Slide Examples
This is a marketing reach by channels bar chart ppt slide examples. This is a two stage process. The stages in this process are which marketing-channel is growing fastest, influencer engagement use cases.

Flow Chart Plan For Client Project Communication Download PDF
This slide presents a flow chart plan that can be used by managers for streamlining project communication among customers. Major elements include monthly status reports, monthly analytics, weekly analytics, etc. Presenting Flow Chart Plan For Client Project Communication Download PDF to dispense important information. This template comprises one stages. It also presents valuable insights into the topics including Flow Chart Plan, Client Project Communication. This is a completely customizable PowerPoint theme that can be put to use immediately. So, download it and address the topic impactfully.

Ppt Slide Business Illustration Umbrella Chart Strategic Planning
Get The Domestics Right With Our PPT Slide business illustration umbrella chart strategic planning Powerpoint Templates. Create The Base For Thoughts To Grow. Do Away With Dogmatic Approaches. Establish The Value Of Reason With Our Business Plan Powerpoint Templates.
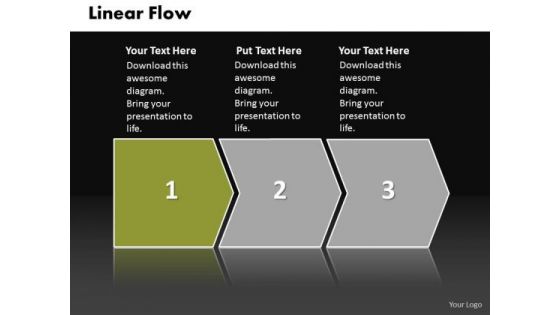
Ppt Consecutive Work Flow Chart PowerPoint Business Communication Diagram Templates
PPT consecutive work flow chart powerpoint business communication diagram Templates-Visually support your Microsoft office PPT Presentation with our above Diagram illustrating first stage using green arrow piece. This way, you can use the idea of a jigsaw quickly and easily in your presentation. Use this Diagram to illustrate your method, piece by piece, and interlock the whole process in the minds of your audience.-PPT consecutive work flow chart powerpoint business communication diagram Templates-3d, Arrow, Background, Banner, Business, Chart, Colorful, Diagram, Direction, Element, Financial, Flow, Gradient, Illustration, Isolated, Mirrored, Placeholder, Presentation, Process, Steps
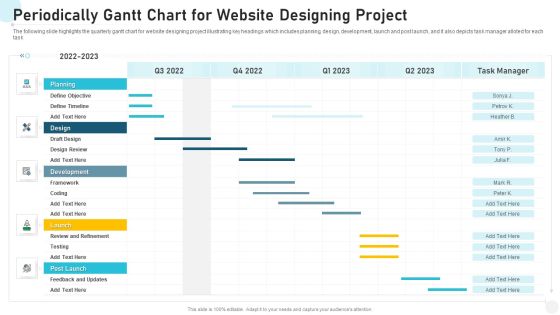
Periodically Gantt Chart For Website Designing Project Portrait PDF
The following slide highlights the quarterly gantt chart for website designing project illustrating key headings which includes planning, design, development, launch and post launch, and it also depicts task manager alloted for each task Showcasing this set of slides titled periodically gantt chart for website designing project portrait pdf. The topics addressed in these templates are periodically gantt chart for website designing project. All the content presented in this PPT design is completely editable. Download it and make adjustments in color, background, font etc. as per your unique business setting.

Succession Planning Modelling Chart Ppt PowerPoint Presentation Professional Gridlines
This is a succession planning modelling chart ppt powerpoint presentation professional gridlines. This is a three stage process. The stages in this process are compare, marketing, business, management, planning.

Stacked Line Chart Finance Ppt Powerpoint Presentation Outline Themes
This is a stacked line chart finance ppt powerpoint presentation outline themes. This is a two stage process. The stages in this process are finance, marketing, management, investment, analysis.
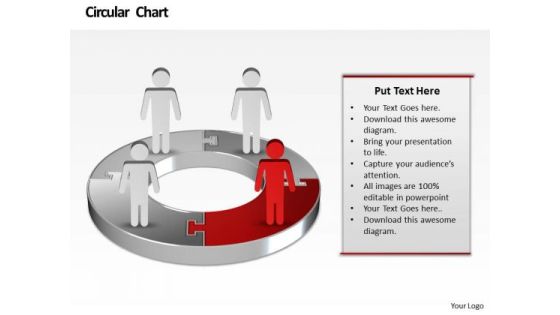
Ppt Illustration Of Financial Pie Chart Marketing Presentation PowerPoint Templates
PPT illustration of financial pie chart marketing presentation powerpoint Templates-You have the people in place, selected the team leaders and all are raring to go. You have the plans ready for them to absorb and understand. Educate your team with your thoughts and logic. -PPT illustration of financial pie chart marketing presentation powerpoint Templates-Abstract, Access, Arrow, Background, Business, Chart, Circle, Concept, Conceptual, Connection, Corporate, Creative, Cycle, Design, Different, Element, Empty, Form, Frame, Graphic, Group, Idea, Illustration, Part, Piece, Place, Process, Red, Shapes, Solution, Special, Speech, Strategy, Symbol
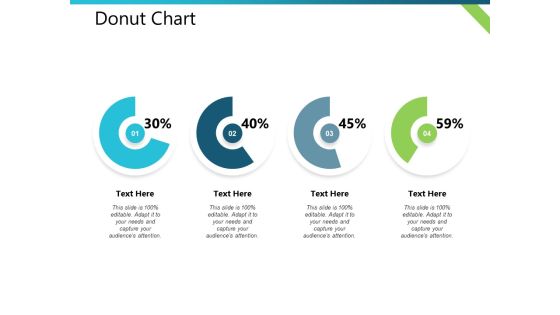
Donut Chart Distribution Plan Ppt PowerPoint Presentation Visual Aids Outline
This is a donut chart distribution plan ppt powerpoint presentation visual aids outline. This is a four stage process. The stages in this process are business, management, financial, marketing, strategy.

Audit Process Workflow Chart For Finance Management Summary PDF
This template consists of a flowchart which depicts audit process to be followed by brand managers for finance management. Key elements include initiate audit process, prepare for auditing, develop audit plan, assign work to auditors etc.

Scatter Bubble Chart Ppt PowerPoint Presentation Infographics Backgrounds
This is a scatter bubble chart ppt powerpoint presentation infographics backgrounds. This is a five stage process. The stages in this process are highest sale, in price, growth, success, business.
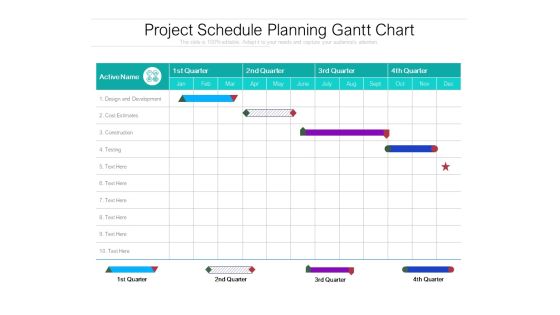
Project Schedule Planning Gantt Chart Ppt PowerPoint Presentation Pictures Guide
Make a highly optimized project management report using this content-ready Gantt Chart PPT Diagram. Effortless yet very clear, this layout proves a useful tool to present the professional details of a task or activity. Showcase the activities and allotted time to the business executives with this Gantt Chart PowerPoint theme. List down the column tasks in various timeframes and the activities associated with each of them here. Further, plot time allocation for various tasks, monitor their actual time and make comparisons to interpret the final progress with this well-structured Gantt Chart Excel Template. You can add all the significant details of a particular project in this chart and showcase it to all the project members so that they can participate in the overall development. Not only this but also our PPT template can help you showcase the work breakdown structure of your project.
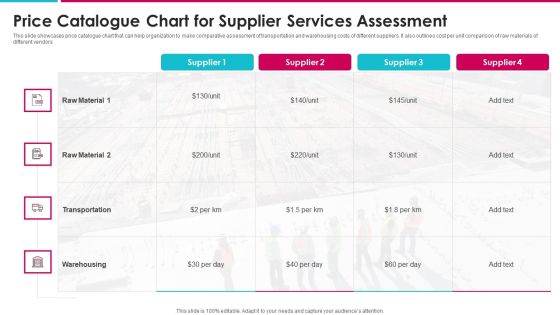
Price Catalogue Chart For Supplier Services Assessment Inspiration PDF
This slide showcases price catalogue chart that can help organization to make comparative assessment of transportation and warehousing costs of different suppliers. It also outlines cost per unit comparison of raw materials of Showcasing this set of slides titled price catalogue chart for supplier services assessment inspiration pdf. The topics addressed in these templates are price catalogue chart for supplier services assessment. All the content presented in this PPT design is completely editable. Download it and make adjustments in color, background, font etc. as per your unique business setting.
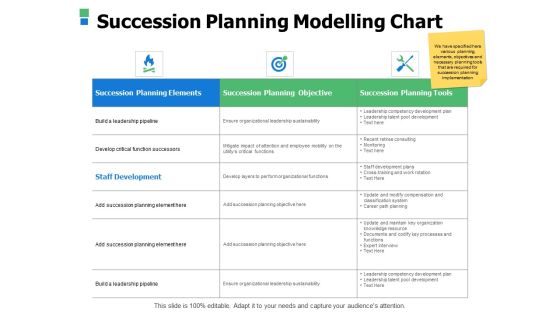
Succession Planning Modelling Chart Ppt Powerpoint Presentation Slides Samples
This is a succession planning modelling chart ppt powerpoint presentation slides samples. The topics discussed in this diagram are business, management, planning, strategy, marketing. This is a completely editable PowerPoint presentation, and is available for immediate download.

Succession Planning Modelling Chart Ppt PowerPoint Presentation Inspiration Slideshow
This is a succession planning modelling chart ppt powerpoint presentation inspiration slideshow. The topics discussed in this diagram are marketing, business, management, planning, strategy This is a completely editable PowerPoint presentation and is available for immediate download.

Employee Time Management Evaluation Chart Ppt PowerPoint Presentation Outline Guidelines
This is a employee time management evaluation chart ppt powerpoint presentation outline guidelines. This is a two stage process. The stages in this process are business, planning, strategy, marketing, management.
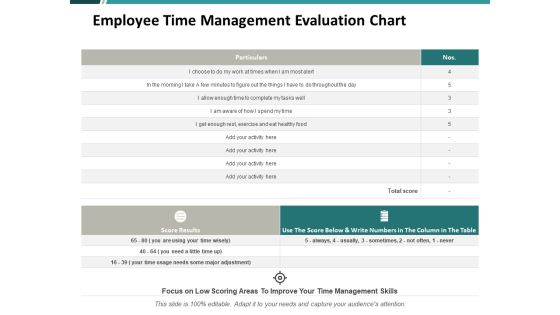
Employee Time Management Evaluation Chart Ppt PowerPoint Presentation Outline Slides
This is a employee time management evaluation chart ppt powerpoint presentation outline slides. This is a three stage process. The stages in this process are compare, marketing, business, management, planning.
Risk Tracker Chart Of The Production One Pager Documents
This one pager covers the risk tracker chart of the company that can be used to track the risk factors and how the company is planning to overcome the same. Presenting you an exemplary Risk Tracker Chart Of The Production One Pager Documents. Our one-pager comprises all the must-have essentials of an inclusive document. You can edit it with ease, as its layout is completely editable. With such freedom, you can tweak its design and other elements to your requirements. Download this Risk Tracker Chart Of The Production One Pager Documents brilliant piece now.
Risk Tracker Chart Of The Enterprise One Pager Documents
This one pager covers the risk tracker chart of the company that can be used to track the risk factors and how the company is planning to overcome the same. Presenting you an exemplary Risk Tracker Chart Of The Enterprise One Pager Documents. Our one-pager comprises all the must-have essentials of an inclusive document. You can edit it with ease, as its layout is completely editable. With such freedom, you can tweak its design and other elements to your requirements. Download this Risk Tracker Chart Of The Enterprise One Pager Documents brilliant piece now.
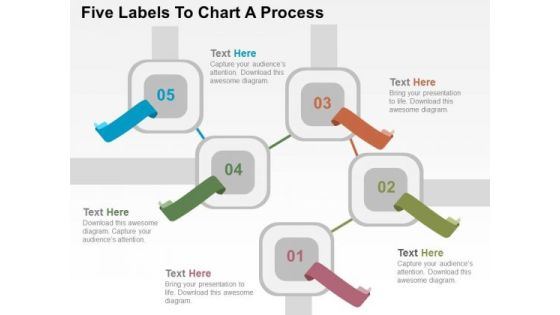
Five Labels To Chart A Process PowerPoint Templates
Our above slide contains graphics of five labels. This PPT label graphics may be used to chart a business process. The Powerpoint Templates can be customized as per requirements of business education or any other theme.

Risk Response Chart Of The Production One Pager Documents
This one pager covers the risk response chart of the company with details on risks, probability low, medium or high, risk impact and strategies to overcome risk. Presenting you a fantastic Risk Response Chart Of The Production One Pager Documents. This piece is crafted on hours of research and professional design efforts to ensure you have the best resource. It is completely editable and its design allow you to rehash its elements to suit your needs. Get this Risk Response Chart Of The Production One Pager Documents A4 One-pager now.

Organization Chart Of Human Resources Department One Pager Documents
This page provides the organizational structure of human resources department along with the key roles and responsibilities of members in the human resource department chart. Presenting you an exemplary Organization Chart Of Human Resources Department One Pager Documents. Our one-pager comprises all the must-have essentials of an inclusive document. You can edit it with ease, as its layout is completely editable. With such freedom, you can tweak its design and other elements to your requirements. Download this Organization Chart Of Human Resources Department One Pager Documents brilliant piece now.
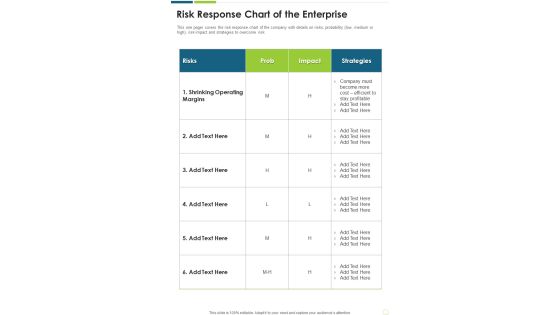
Risk Response Chart Of The Enterprise One Pager Documents
This one pager covers the risk response chart of the company with details on risks, probability low, medium or high, risk impact and strategies to overcome risk. Presenting you a fantastic Risk Response Chart Of The Enterprise One Pager Documents. This piece is crafted on hours of research and professional design efforts to ensure you have the best resource. It is completely editable and its design allow you to rehash its elements to suit your needs. Get this Risk Response Chart Of The Enterprise One Pager Documents A4 One-pager now.

Stock Chart Ppt PowerPoint Presentation Outline Graphics Example
This is a stock chart ppt powerpoint presentation outline graphics example. This is a five stage process. The stages in this process are close, volume, low, high, open, product.

Open High Low Close Chart Ppt PowerPoint Presentation Outline Rules
This is a open high low close chart ppt powerpoint presentation outline rules. This is a two stage process. The stages in this process are product, high, low, close, in percentage.

Quality Cost Report Trend Chart Ppt PowerPoint Presentation Outline Guidelines
This is a quality cost report trend chart ppt powerpoint presentation outline guidelines. This is a two stage process. The stages in this process are quality cost, appraisal cost, internal failure cost, external failure cost.

Donut Pie Chart Finance Ppt Powerpoint Presentation Outline Vector
This is a donut pie chart finance ppt powerpoint presentation outline vector. This is a four stage process. The stages in this process are finance, marketing, management, investment, analysis.

Venn Chart For Process Collaboration Analysis Ppt PowerPoint Presentation Summary
This is a venn chart for process collaboration analysis ppt powerpoint presentation summary. This is a three stage process. The stages in this process are venn, business, marketing, success, management.

Transformation Of Decision Making Process Chart Ppt Slides
This is a transformation of decision making process chart ppt slides. This is a six stage process. The stages in this process are problem classification, boundary conditions, building to action, problem definition, what is right, feedback.

Cost Benefit Analysis Chart Ppt PowerPoint Presentation Slides Example File
This is a cost benefit analysis chart ppt powerpoint presentation slides example file. This is a two stage process. The stages in this process are increase salary, cost benefit, reduced costs, analysis, operating cost.

Cost Benefit Analysis Chart Ppt PowerPoint Presentation Ideas Shapes
This is a cost benefit analysis chart ppt powerpoint presentation ideas shapes. This is a two stage process. The stages in this process are reduced costs, operating cost, benefits, costs, increase salary.
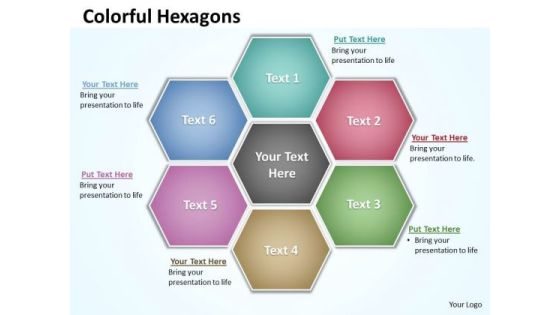
Ppt Hexagon Shapes Chart Presentation PowerPoint Tips Free Download Templates
PPT hexagon shapes chart presentation powerpoint tips free download Templates-This Hexagon diagram is a graphical illustration of the relationships between and among sets of data, groups of objects. . Present your views using this innovative slide and be assured of leaving a lasting impression.-PPT hexagon shapes chart presentation powerpoint tips free download Templates-Abstract, Background, Design, Digital, Elements, Graphic, Grey, Hexagon, Illustration, Light, Modern, Perspective, Triangles, Shapes, Shiny, Style, Technology, Template, Vector, Vertical, Virtual, Wallpaper, Web
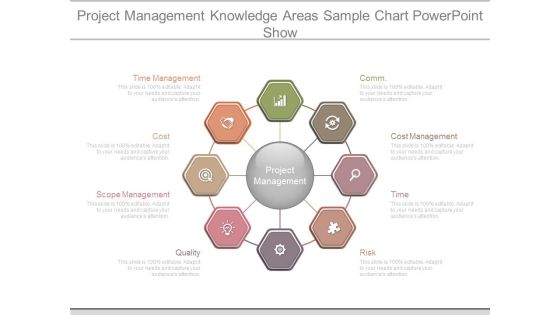
Project Management Knowledge Areas Sample Chart Powerpoint Show
This is a project management knowledge areas sample chart powerpoint show. This is a eight stage process. The stages in this process are comm, cost management, time, risk, quality, scope management, cost, time management, project management.

Raising Chart Finance PowerPoint Templates And PowerPoint Themes 0512
Microsoft Powerpoint Templates and Background with business graph-Raising Chart Finance PowerPoint Templates And PowerPoint Themes 0512-These PowerPoint designs and slide layouts can be used for themes relating to -Business graph, success, money, marketing, finance, shapes

Monetary Strategy Implementation Process Flow Chart Brochure PDF
This slide shows the monetary strategy implementation flow chart. It includes external and internal monetary environment analysis, monetary goals development, monetary strategy development, dividend policy, etc. Pitch your topic with ease and precision using this Monetary Strategy Implementation Process Flow Chart Brochure PDF. This layout presents information on Dividend Policy, Investment Policy, Asset Management. It is also available for immediate download and adjustment. So, changes can be made in the color, design, graphics or any other component to create a unique layout.

Circular Arrow Chart With Business Icons Powerpoint Slides
Graphics of circular arrow chart with icons have been displayed in this business slide. This business diagram helps to exhibit strategy analysis and management. Use this PowerPoint template to visually support your content.

Circular Chart Showing Process Approach Ppt PowerPoint Presentation Backgrounds
This is a circular chart showing process approach ppt powerpoint presentation backgrounds. This is a four stage process. The stages in this process are process approach, business, marketing, success, strategy.

Financial Planning Steps Infographic Chart Ppt Samples Download
This is a financial planning steps infographic chart ppt samples download. This is a five stage process. The stages in this process are investments, retirement, estate planning, risk management, cash flow.
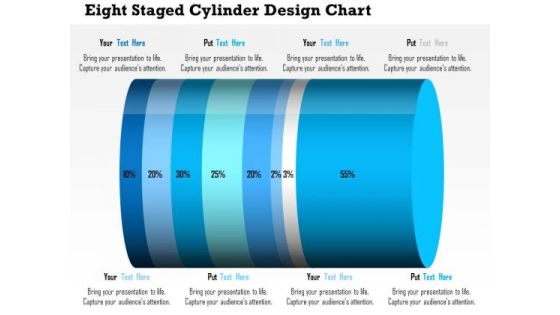
Business Daigram Eight Staged Cylinder Design Chart Presentation Templets
This business diagram contains eight staged cylinder design chart with percentage ratio. Download this diagram to display financial analysis. Use this diagram to make business and marketing related presentations.

Digital Marketing Half Yearly Gantt Chart Elements PDF
This slide contains the six month gantt chart showing the marketing of the product through digital platforms. It includes content, paid programming, email marketing, social media and organic search. Showcasing this set of slides titled Digital Marketing Half Yearly Gantt Chart Elements PDF. The topics addressed in these templates are Email Marketing, Social Media, Organic Search. All the content presented in this PPT design is completely editable. Download it and make adjustments in color, background, font etc. as per your unique business setting.

6 Phase Auditing Process Pie Chart Ppt PowerPoint Presentation Graphics
This is a 6 phase auditing process pie chart ppt powerpoint presentation graphics. This is a six stage process. The stages in this process are communicating results, following up, configuring parameters, establishing priority areas, determining process frequency.

Gantt Chart Events Ppt PowerPoint Presentation Portfolio Graphics
Make a highly optimized project management report using this content-ready Gantt Chart PPT Diagram. Effortless yet very clear, this layout proves a useful tool to present the professional details of a task or activity. Showcase the activities and allotted time to the business executives with this Gantt Chart PowerPoint theme. List down the column tasks in various timeframes and the activities associated with each of them here. Further, plot time allocation for various tasks, monitor their actual time and make comparisons to interpret the final progress with this well-structured Gantt Chart Excel Template. You can add all the significant details of a particular project in this chart and showcase it to all the project members so that they can participate in the overall development. Not only this but also our PPT template can help you showcase the work breakdown structure of your project.
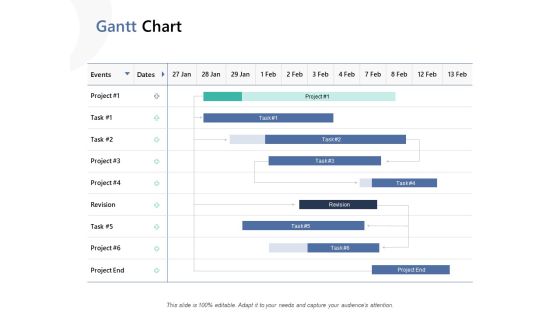
Gantt Chart Ppt PowerPoint Presentation Model Design Inspiration
Make a highly optimized project management report using this content-ready Gantt Chart PPT Diagram. Effortless yet very clear, this layout proves a useful tool to present the professional details of a task or activity. Showcase the activities and allotted time to the business executives with this Gantt Chart PowerPoint theme. List down the column tasks in various timeframes and the activities associated with each of them here. Further, plot time allocation for various tasks, monitor their actual time and make comparisons to interpret the final progress with this well-structured Gantt Chart Excel Template. You can add all the significant details of a particular project in this chart and showcase it to all the project members so that they can participate in the overall development. Not only this but also our PPT template can help you showcase the work breakdown structure of your project.

Gantt Chart Ppt PowerPoint Presentation Infographic Template Influencers
Make a highly optimized project management report using this content-ready Gantt Chart PPT Diagram. Effortless yet very clear, this layout proves a useful tool to present the professional details of a task or activity. Showcase the activities and allotted time to the business executives with this Gantt Chart PowerPoint theme. List down the column tasks in various timeframes and the activities associated with each of them here. Further, plot time allocation for various tasks, monitor their actual time and make comparisons to interpret the final progress with this well-structured Gantt Chart Excel Template. You can add all the significant details of a particular project in this chart and showcase it to all the project members so that they can participate in the overall development. Not only this but also our PPT template can help you showcase the work breakdown structure of your project.

Business Coaching Gantt Chart Ppt PowerPoint Presentation Layouts Files PDF
Make a highly optimized project management report using this content-ready Gantt Chart PPT Diagram. Effortless yet very clear, this layout proves a useful tool to present the professional details of a task or activity. Showcase the activities and allotted time to the business executives with this Gantt Chart PowerPoint theme. List down the column tasks in various timeframes and the activities associated with each of them here. Further, plot time allocation for various tasks, monitor their actual time and make comparisons to interpret the final progress with this well-structured Gantt Chart Excel Template. You can add all the significant details of a particular project in this chart and showcase it to all the project members so that they can participate in the overall development. Not only this but also our PPT template can help you showcase the work breakdown structure of your project.

7 Step Workflow Chart For Software Deployment Introduction PDF
This slide consists of a seven step flow chart for deployment of a software program. The elements covered in the slide are software requirements analysis, resource planning, software maintenance and updates, designing and prototyping etc. Persuade your audience using this 7 Step Workflow Chart For Software Deployment Introduction PDF. This PPT design covers Seven stages, thus making it a great tool to use. It also caters to a variety of topics including Software Requirements Analysis, Resource Planning, Designing And Prototyping. Download this PPT design now to present a convincing pitch that not only emphasizes the topic but also showcases your presentation skills.

90 Day Plan Horizontal Chart Ppt Sample Presentations
This is a 90 day plan horizontal chart ppt sample presentations. This is a eight stage process. The stages in this process are 20 days, 30 days, 40 days, 50 days, 60 days, 70 days, 80 days, 90 days.
Business Diagram Icons Around Pie Chart Presentation Template
Strategy and planning can be displayed with this business diagram. This slide contains the graphic of icons around pie chart Use this editable slide to build quality presentation for your viewers.

Project Work Resource Allocation Gantt Chart Elements PDF
This slide represents Gantt chart for project task allocation. It also showcase project activities, duration, priority, initiation date and end date for task completion. Showcasing this set of slides titled Project Work Resource Allocation Gantt Chart Elements PDF. The topics addressed in these templates are Interpreting Requirements, Benchmarking Products, Customer Identification. All the content presented in this PPT design is completely editable. Download it and make adjustments in color, background, font etc. as per your unique business setting.
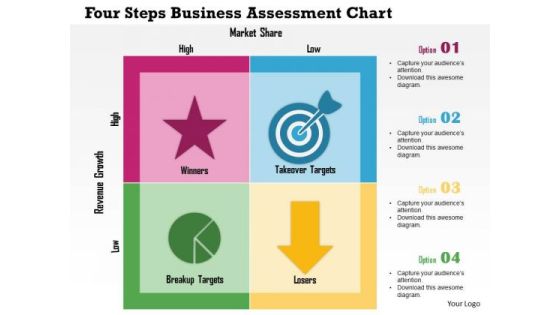
Business Diagram Four Steps Business Assessment Chart Presentation Template
Graphic of four steps assessment chart has been used to design this power point template. This PPT contains the concept of business assessment process. This PPT is suitable for business and marketing related presentations.
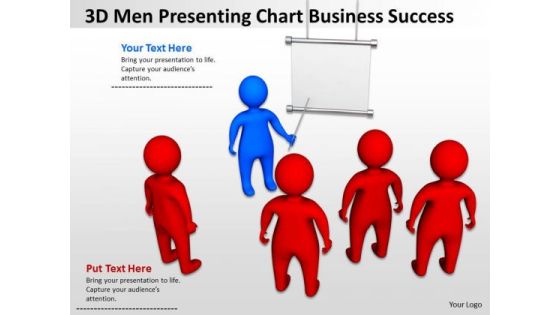
Business Organizational Chart Examples 3d Men Pressenting Success PowerPoint Slides
We present our business organizational chart examples 3d men pressenting success PowerPoint Slides.Present our Communication PowerPoint Templates because Our PowerPoint Templates and Slides ensures Effective communication. They help you put across your views with precision and clarity. Download and present our Business PowerPoint Templates because Our PowerPoint Templates and Slides will let your ideas bloom. Create a bed of roses for your audience. Use our Shapes PowerPoint Templates because Our PowerPoint Templates and Slides will Embellish your thoughts. They will help you illustrate the brilliance of your ideas. Download and present our People PowerPoint Templates because It can Bubble and burst with your ideas. Present our Leadership PowerPoint Templates because Our PowerPoint Templates and Slides will effectively help you save your valuable time. They are readymade to fit into any presentation structure. Use these PowerPoint slides for presentations relating to 3d, Background, Blank, Board, Business, Character, Chart, Communication, Computer, Concept, Consultant, Cooperation, Cute, Dialogue, Discussion, Easel, Empty, Expert, Expertise, Figure, Flipchart, Graphic, Group, Guy, Human, Icon, Idea, Illustration, Leader, Leadership, Manager, Meeting, Men, People, Person, Plan, Pointing, Present, Presentation, Puppet, Speaker, Speech, Teamwork, Whiteboard. The prominent colors used in the PowerPoint template are Red, White, Blue. Presenters tell us our business organizational chart examples 3d men pressenting success PowerPoint Slides are visually appealing. PowerPoint presentation experts tell us our Chart PowerPoint templates and PPT Slides are designed by professionals Professionals tell us our business organizational chart examples 3d men pressenting success PowerPoint Slides will make you look like a winner. People tell us our Chart PowerPoint templates and PPT Slides are designed by a team of presentation professionals. The feedback we get is that our business organizational chart examples 3d men pressenting success PowerPoint Slides are designed by professionals Customers tell us our Chart PowerPoint templates and PPT Slides will get their audience's attention.

Our Product Vs Competition Analysis Chart Powerpoint Slide Background Designs
This is a our product vs competition analysis chart powerpoint slide background designs. This is a four stage process. The stages in this process are business, marketing, success, strategy, compare.

5 Reinforcing Components Arrow Diagram Chart Business Prototyping PowerPoint Slides
We present our 5 reinforcing components arrow diagram chart business prototyping PowerPoint Slides.Use our Arrows PowerPoint Templates because it shows the pyramid which is a symbol of the desire to reach the top in a steady manner. Present our Business PowerPoint Templates because watch the excitement levels rise as they realise their worth. Download and present our Competition PowerPoint Templates because you know your business and have a vision for it. Use our Design PowerPoint Templates because your business and plans for its growth consist of processes that are highly co-related. Download and present our Shapes PowerPoint Templates because the atmosphere in the worplace is electric.Use these PowerPoint slides for presentations relating to arrow, arrows, block, business, chart, design, development, diagram, direction, element, flow, flowchart, graph, linear, management, organization, process, program, section, sign, solution, symbol. The prominent colors used in the PowerPoint template are Blue, Gray, Black. Professionals tell us our 5 reinforcing components arrow diagram chart business prototyping PowerPoint Slides are Efficacious. The feedback we get is that our block PowerPoint templates and PPT Slides are Appealing. We assure you our 5 reinforcing components arrow diagram chart business prototyping PowerPoint Slides are designed by professionals Customers tell us our chart PowerPoint templates and PPT Slides are Fantastic. Presenters tell us our 5 reinforcing components arrow diagram chart business prototyping PowerPoint Slides are Fun. People tell us our block PowerPoint templates and PPT Slides are Nice.

Ppt Slide Cycle Process Business Flow Chart Diagrams
Double Up Our PPT Slide cycle process business flow chart diagrams Powerpoint Templates With Your Thoughts. They Will Make An Awesome Pair. When In Doubt Use Our Business Plan Powerpoint Templates. The Way Ahead Will Become Crystal Clear.
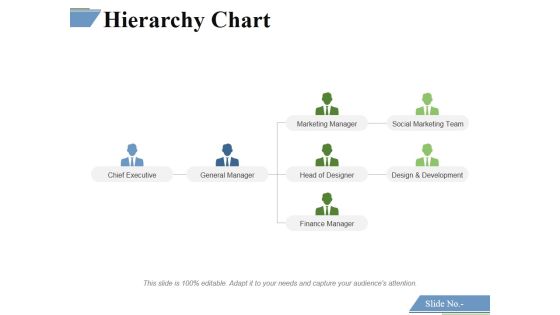
Hierarchy Chart Ppt PowerPoint Presentation Infographic Template Themes
This is a hierarchy chart ppt powerpoint presentation infographic template themes. This is a four stage process. The stages in this process are chief executive, general manager, marketing manager, head of designer, finance manager, design and development, social marketing team.

Percentage Chart For Good Marketing Strategy Powerpoint Slides
This PowerPoint template has been designed with pie chart and percentage values. The PowerPoint template has a high quality design. You can download this PowerPoint slide to make good marketing strategy and business plans.
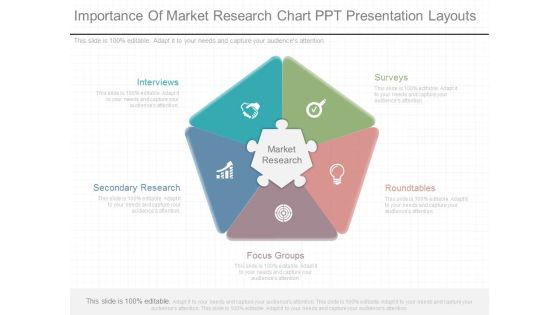
Importance Of Market Research Chart Ppt Presentation Layouts
This is a importance of market research chart ppt presentation layouts. This is a five stage process. The stages in this process are interviews, secondary research, market research, focus groups, surveys, roundtables.

Competitive Analysis Matrix Chart Ppt PowerPoint Presentation Inspiration
This is a competitive analysis matrix chart ppt powerpoint presentation inspiration. This is a six stage process. The stages in this process are product quality, product fidelity, after sales service, customer service, price, shipping speed.

Competitive Analysis Matrix Chart Ppt PowerPoint Presentation Portfolio Format Ideas
This is a competitive analysis matrix chart ppt powerpoint presentation portfolio format ideas. This is a six stage process. The stages in this process are our business, product quality, product fidelity, after sales service, customer service.

Stock Photo Marketing Concepts Earth Pie Chart Globe
Touch Base With Our stock photo marketing concepts earth pie chart globe Powerpoint Templates. Review Your Growth With Your Audience. Take A Deep Dive With Our Globe Powerpoint Templates. Get Into The Nitti Gritty Of It All.
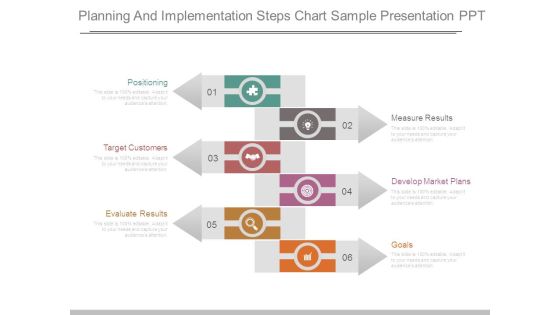
Planning And Implementation Steps Chart Sample Presentation Ppt
This is a planning and implementation steps chart sample presentation ppt. This is a six stage process. The stages in this process are positioning, target customers, evaluate results, measure results, develop market plans, goals.

Business Plan Service Industry Chart Ppt Images Gallery
This is a business plan service industry chart ppt images gallery. This is a six stage process. The stages in this process are development, research, communication, idea generation, environmental scanning, feasibility analysis.
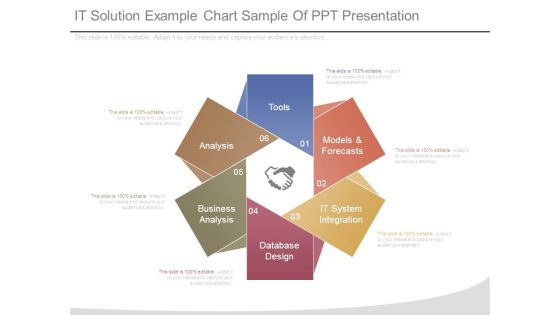
It Solution Example Chart Sample Of Ppt Presentation
This is a it solution example chart sample of ppt presentation. This is a six stage process. The stages in this process are tools, models and forecasts, it system integration, database design, business analysis, analysis.

90 Day Plan Arrow Chart Ppt Sample File
This is a 90 day plan arrow chart ppt sample file. This is a three stage process. The stages in this process are 30 first days, 60 first days, 90 first days.

Competitive Analysis Template 8 Matrix Chart Ppt PowerPoint Presentation Templates
This is a competitive analysis template 8 matrix chart ppt powerpoint presentation templates. This is a six stage process. The stages in this process are our business, product quality, product fidelity, after sales service, customer service, price, shipping speed, competitor.

Competitive Analysis Matrix Chart Ppt PowerPoint Presentation Gallery
This is a competitive analysis matrix chart ppt powerpoint presentation gallery. This is a seven stage process. The stages in this process are our business, product quality, product fidelity, after sales service, customer service, price, shipping speed.
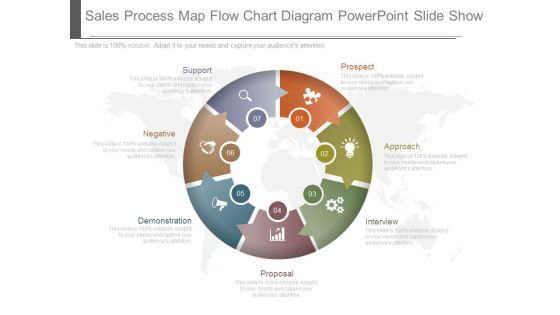
Sales Process Map Flow Chart Diagram Powerpoint Slide Show
This is a sales process map flow chart diagram powerpoint slide show. This is a seven stage process. The stages in this process are prospect, approach, interview, proposal, demonstration, negative, support.
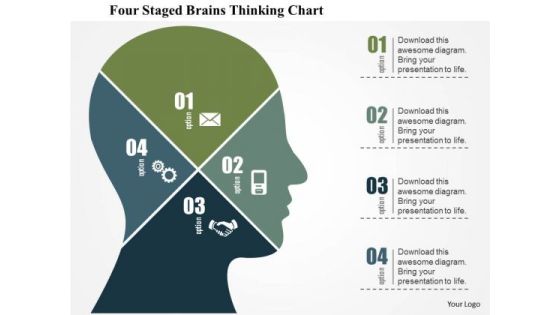
Business Diagram Four Staged Brains Thinking Chart Presentation Template
Graphic of four staged chart in human brain has been used to design this business diagram. This slide depicts concept of thinking process and analysis. Make your presentation more interactive with this business slide.

Competence Cycle For Business Excellence Chart Powerpoint Layout
This is a competence cycle for business excellence chart powerpoint layout. This is a four stage process. The stages in this process are confidence competence cycle, competence, comfort, control, confidence.

Seven Staged Circle Process Chart For Financial Planning Powerpoint Template
Our above PPT slide contains process chart with icons. This PowerPoint template may be used to display strategic planning methodology. This template is designed to attract the attention of your audience.

Pie Chart For Current Sources Of Profit Ppt Background Template
This is a pie chart for current sources of profit ppt background template. This is a five stage process. The stages in this process are finance, success, business, marketing, percentage, donut.
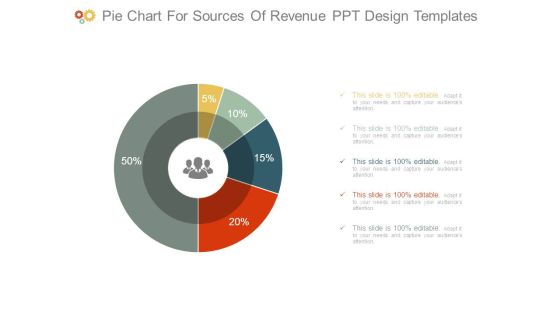
Pie Chart For Sources Of Revenue Ppt Design Templates
This is a pie chart for sources of revenue ppt design templates. This is a five stage process. The stages in this process are finance, success, business, marketing, percentage, donut.
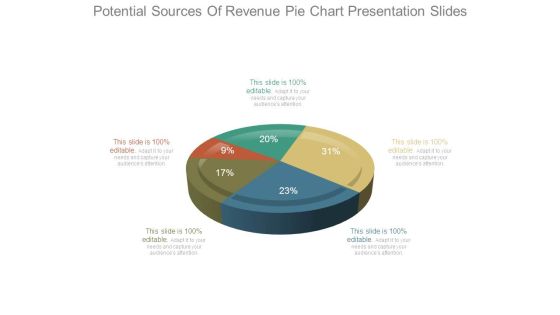
Potential Sources Of Revenue Pie Chart Presentation Slides
This is a potential sources of revenue pie chart presentation slides. This is a five stage process. The stages in this process are finance, success, business, marketing, percentage, pie.

Monthly Task Planning Gantt Chart Ppt PowerPoint Presentation Portfolio Images
This is a monthly task planning gantt chart ppt powerpoint presentation portfolio images. This is a six stage process. The stages in this process are strategy plan, strategy objectives, strategy action.
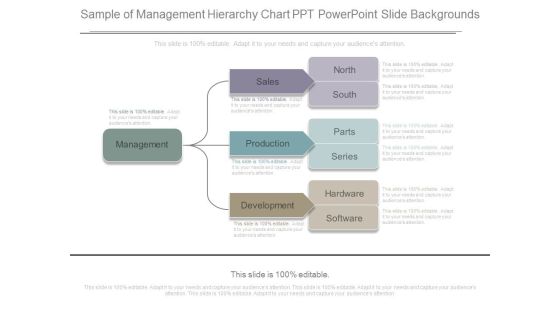
Sample Of Management Hierarchy Chart Ppt Powerpoint Slide Backgrounds
This is a sample of management hierarchy chart ppt powerpoint slide backgrounds. This is a one stage process. The stages in this process are management, sales, production, development, north, south, parts, series, hardware, software.
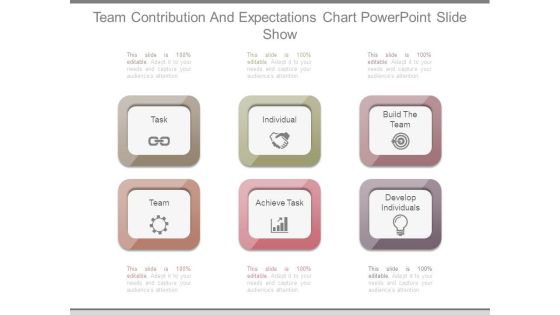
Team Contribution And Expectations Chart Powerpoint Slide Show
This is a team contribution and expectations chart powerpoint slide show. This is a six stage process. The stages in this process are task, individual, build the team, team, achieve task, develop individuals.
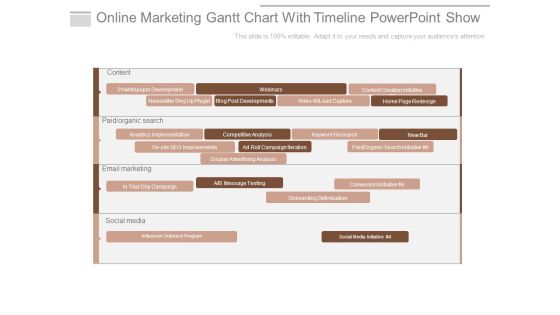
Online Marketing Gantt Chart With Timeline Powerpoint Show
This is a online marketing gantt chart with timeline powerpoint show. This is a four stage process. The stages in this process are content, whitepaper development, webinars, email marketing, social media, content creation initiative, conversion initiative.
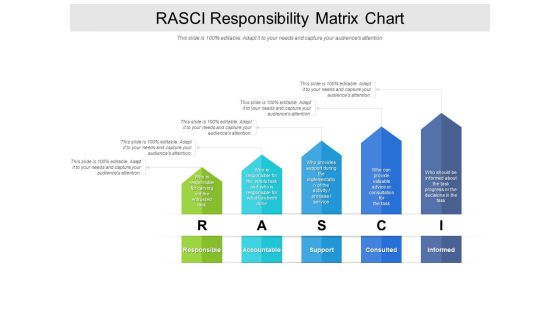
RASCI Responsibility Matrix Chart Ppt PowerPoint Presentation Outline Model
Presenting this set of slides with name rasci responsibility matrix chart ppt powerpoint presentation outline model. The topics discussed in these slides are responsible, accountable, support, consulted, informed. This is a completely editable PowerPoint presentation and is available for immediate download. Download now and impress your audience.

Business Diagram Process Pyramids Bar Chart Business Slide Presentation Template
Graphic of pyramid and bar chart has been used to design this power point template diagram. This PPT diagram contains the concept of business result analysis and process flow. Use this template slide and display result in your presentations.
Six Staged Business Chart With Icons Powerpoint Template
Our professionally designed business diagram is as an effective tool for communicating ideas and planning. It contains circular business chart with icons. Convey your views with this diagram slide. It will amplify the strength of your logic.

Business And It Alignment Strategy Chart Powerpoint Slide Template
This is a business and it alignment strategy chart powerpoint slide template. This is a four stage process. The stages in this process are business strategy, it strategy, it architecture, business architecture.

International Market Segmentation Sample Flow Chart Powerpoint Layout
This is a international market segmentation sample flow chart powerpoint layout. This is a six stage process. The stages in this process are geographic, cultural, the firm, economic, industrial markets, political legal.
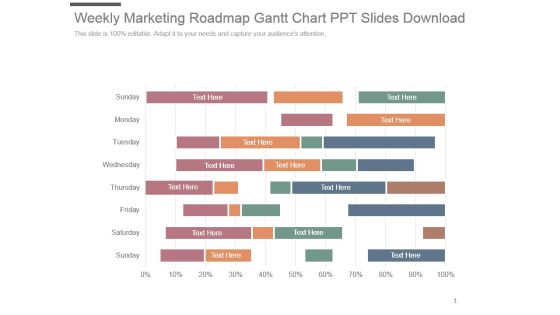
Weekly Marketing Roadmap Gantt Chart Ppt Slides Download
This is a weekly marketing roadmap gantt chart ppt slides download. This is a eight stage process. The stages in this process are sunday, monday, tuesday, wednesday, thursday, friday, saturday, Sunday.

Team Target And Achievements Scatter Chart Ppt PowerPoint Presentation Example
This is a team target and achievements scatter chart ppt powerpoint presentation example. This is a three stage process. The stages in this process are overall territory performance, task done, estimation done, complexity done.

Usa Map Chart Americana PowerPoint Presentation Slides C
Microsoft PowerPoint Slides and Backgrounds with of a multicolored bar chart sitting on top of a transparent extruded map of the united states on a medium gray reflective surface
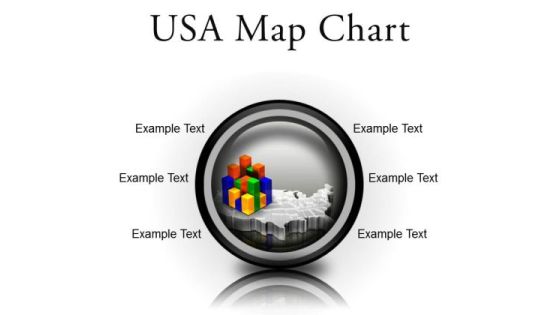
Usa Map Chart Americana PowerPoint Presentation Slides Cc
Microsoft PowerPoint Slides and Backgrounds with of a multicolored bar chart sitting on top of a transparent extruded map of the united states on a medium gray reflective surface
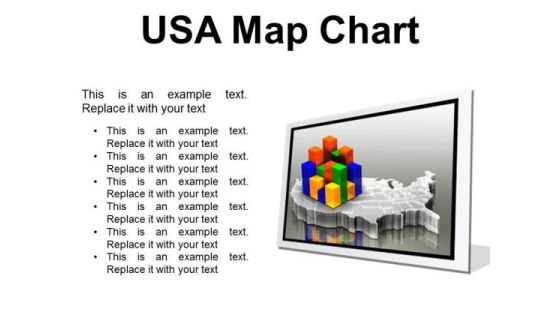
Usa Map Chart Americana PowerPoint Presentation Slides F
Microsoft PowerPoint Slides and Backgrounds with of a multicolored bar chart sitting on top of a transparent extruded map of the united states on a medium gray reflective surface
Usa Map Chart Americana PowerPoint Presentation Slides R
Microsoft PowerPoint Slides and Backgrounds with of a multicolored bar chart sitting on top of a transparent extruded map of the united states on a medium gray reflective surface
Usa Map Chart Americana PowerPoint Presentation Slides S
Microsoft PowerPoint Slides and Backgrounds with of a multicolored bar chart sitting on top of a transparent extruded map of the united states on a medium gray reflective surface
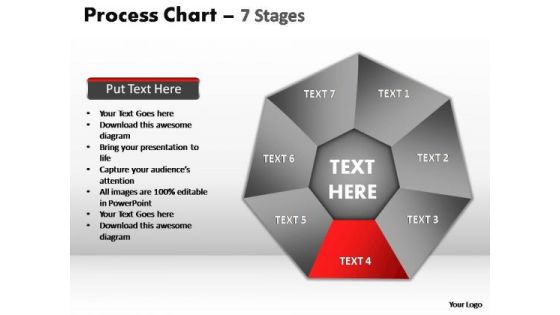
PowerPoint Slide Designs Teamwork Process Chart Ppt Backgrounds
PowerPoint Slide Designs Teamwork process chart PPT Backgrounds-These Fabulous PowerPoint slides and PowerPoint templates have been delicately designed by our professional team to leave long-lasting impressions on your audiences

Process Flow Chart Project Execution Analysis Ppt Ideas
This is a process flow chart project execution analysis ppt ideas. This is a six stage process. The stages in this process are functional design, testing, test plan, user requirements, implementation, commissioning and start up.

Structure Chart For Managing Business Operations Ppt Slide
This is a structure chart for managing business operations ppt slide. This is a six stage process. The stages in this process are priority actions, what system support resources, who responsible, when done, how to measure, annual status.
Pie Chart With Seven Business Icons Powerpoint Templates
Our compelling template consists with a design of pie chart with seven business icons. This slide has been professionally designed to exhibit financial ratio analysis. This template offers an excellent background to build impressive presentation.
Six Steps Spiral Chart With Business Icons Powerpoint Template
This PPT slide has been designed with graphics of six steps spiral chart with icons. This PowerPoint template is suitable to display business strategies and ideas. This professional slide helps in making an instant impact on viewers.

Customer Complaint Handling Process Flow Chart Ppt Model
This is a customer complaint handling process flow chart ppt model. This is a six stage process. The stages in this process are follow company procedure, follow company policy, customer satisfaction, be immediate, be effective, customer offer.
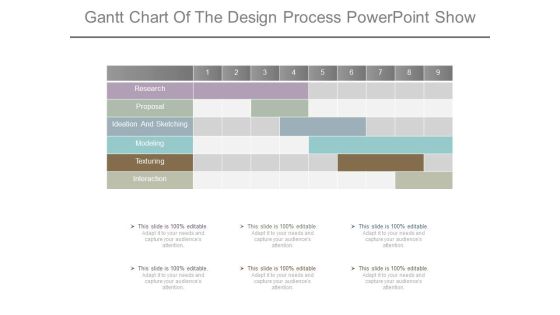
Gantt Chart Of The Design Process Powerpoint Show
This is a gantt chart of the design process powerpoint show. This is a one stage process. The stages in this process are research, proposal, ideation and sketching, modeling, texturing, interaction.

Customer Awareness Process Flow Chart Ppt Presentation Deck
This is a customer awareness process flow chart ppt presentation deck. This is a seven stage process. The stages in this process are loyalty, public relation, sales promotion, advertising, purchase, preference, awareness.
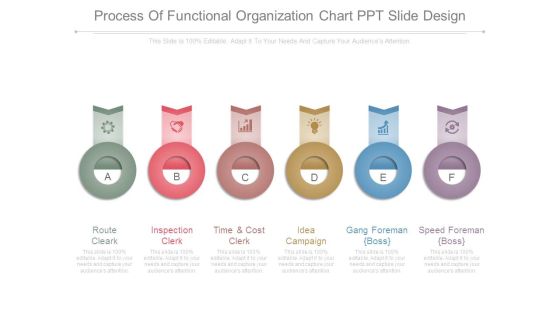
Process Of Functional Organization Chart Ppt Slide Design
This is a process of functional organization chart ppt slide design. This is a six stage process. The stages in this process are route cleark, inspection clerk, time and cost clerk, idea campaign, gang foreman boss, speed foreman boss.
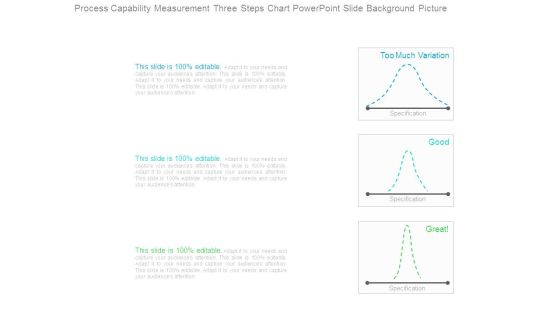
Process Capability Measurement Three Steps Chart Powerpoint Slide Background Picture
This is a process capability measurement three steps chart powerpoint slide background picture. This is a three stage process. The stages in this process are too much variation, specification, good, great.
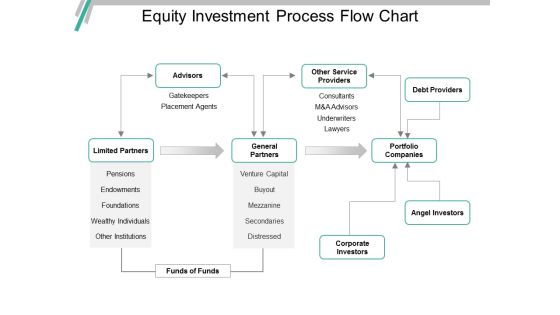
Equity Investment Process Flow Chart Ppt PowerPoint Presentation Ideas
This is a equity investment process flow chart ppt powerpoint presentation ideas. This is a three stage process. The stages in this process are investment, funding, private equity, venture capital.

Competitive Analysis Scatter Chart Template 1 Ppt PowerPoint Presentation Themes
This is a competitive analysis scatter chart template 1 ppt powerpoint presentation themes. This is a six stage process. The stages in this process are business, strategy, marketing, success, analysis.
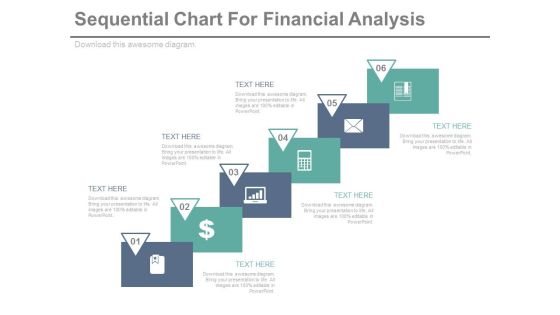
Sequential Steps Chart For Data Analysis Powerpoint Slides
This PowerPoint template has been designed sequential steps chart with icons. This PPT slide can be used to display corporate level financial strategy. You can download finance PowerPoint template to prepare awesome presentations.

Retail Performance Measurement Chart Ppt PowerPoint Presentation Ideas Structure
This is a retail performance measurement chart ppt powerpoint presentation ideas structure. This is a four stage process. The stages in this process are product distribution, distribution system, numeric distribution.
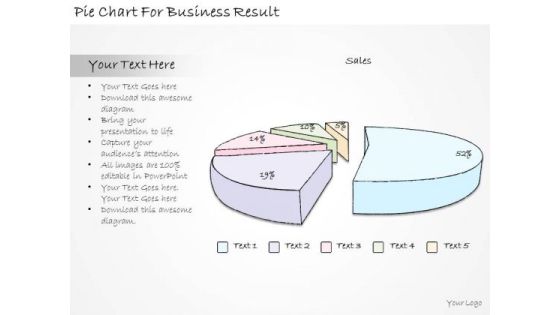
Ppt Slide Pie Chart For Business Result Sales Plan
Drive Your Team Along The Road To Success. Take The Wheel With Our PPT Slide pie chart for business result sales plan Powerpoint Templates. Drive Confidently Over All The Bumps. Our Business Plan Powerpoint Templates Will Absorb The Shocks.

Research Work Plan Table Chart 111 Powerpoint Ideas
This is a research work plan table chart 111 powerpoint ideas. This is a twelve stage process. The stages in this process are business, marketing, table, arrow, success, strategy.

Comparison Chart For Strategic Planning Analysis Ppt PowerPoint Presentation Example
This is a comparison chart for strategic planning analysis ppt powerpoint presentation example. This is a two stage process. The stages in this process are business, finance, marketing, strategy, success.

Brand Trade Show Calendar Gantt Chart Example Ppt Presentation
This is a brand trade show calendar gantt chart example ppt presentation. This is a one stage process. The stages in this process are jan, feb, mar, apr, may, jun, jul, aug, sep, oct, nov, dec.

Stock Photo Corporate Business Strategy 50 Percentage Pie Chart Images
Extract admiration from the audience. Create a forceful impact with our stock photo corporate business strategy 50 percentage pie chart images. Force doors open with our finance. The audience will decide to let your thoughts enter.
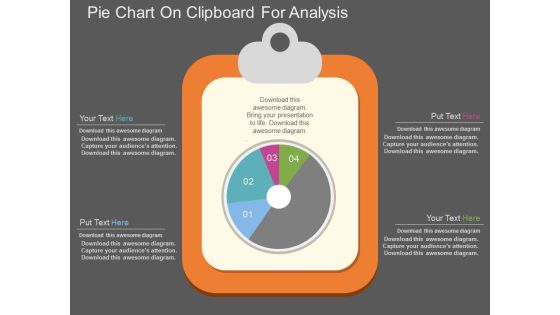
Pie Chart On Clipboard For Analysis Powerpoint Template
This PowerPoint template has been designed with graphics of pie chart on clipboard. Download this PPT slide for business and financial analysis. You may also use this professional template to depict statistical analysis.

Scatter Bubble Chart Ppt PowerPoint Presentation Inspiration Backgrounds
This is a scatter bubble chart ppt powerpoint presentation inspiration backgrounds. This is a five stage process. The stages in this process are highest sale, in price, business, marketing, success.

Bar Chart Ppt PowerPoint Presentation Pictures Background Image
This is a bar chart ppt powerpoint presentation pictures background image. This is a seven stage process. The stages in this process are financial years, sales in percentage, graph, business.
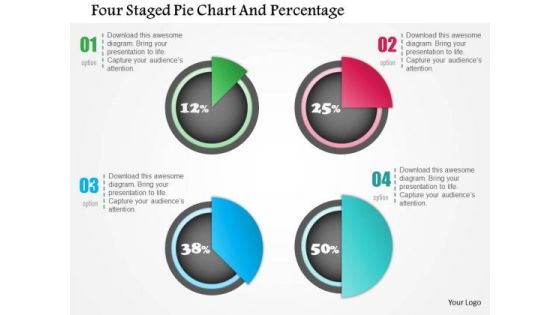
Business Diagram Four Staged Pie Chart And Percentage Presentation Template
Four staged pie chart and percentage values has been used to design this power point template. This PPT contains the concept of financial result analysis. Use this PPT for business and marketing related presentations.

Our Market Research Plan Gantt Chart Powerpoint Slide Backgrounds
This is a our market research plan gantt chart powerpoint slide backgrounds. This is a nine stage process. The stages in this process are jan, feb, mar, apr, may.
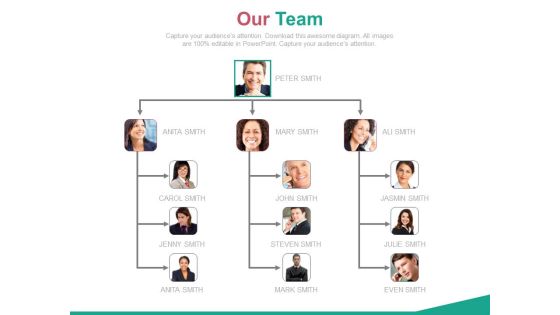
Organizational Chart For Business Intelligence Team Powerpoint Slides
Our above PowerPoint template displays an organizational chart with team pictures. This PPT slide may be used to display working of business intelligence team. You may download this PPT slide to present topics like team strategy and success.
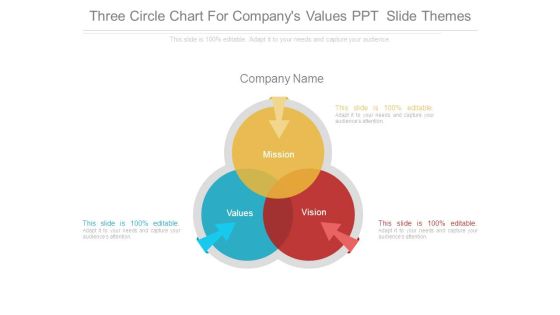
Three Circle Chart For Companys Values Ppt Slide Themes
This is a three circle chart for companys values ppt slide themes. This is a three stage process. The stages in this process are mission, company name, values, vision.

Scatter Bubble Chart Graph Ppt PowerPoint Presentation Infographic Template Maker
This is a scatter bubble chart graph ppt powerpoint presentation infographic template maker. This is a two stage process. The stages in this process are finance, marketing, management, investment, analysis.

Combo Chart Graph Ppt PowerPoint Presentation Infographic Template Layout Ideas
This is a combo chart graph ppt powerpoint presentation infographic template layout ideas. This is a three stage process. The stages in this process are finance, marketing, analysis, investment, million.
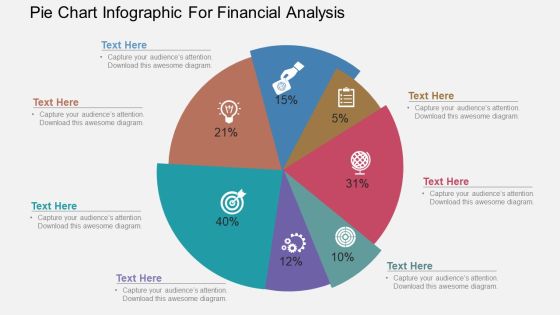
Pie Chart Infographic For Financial Analysis Powerpoint Template
Our above PowerPoint template has been designed with pie chart infographic. This slide is suitable to present financial analysis. Use this business diagram to present your work in a more smart and precise manner.

Project Performance Progress Monitoring Calendar Chart Pictures PDF
This slide covers the project performance measurement schedule chart. It includes the project details along with the project status, task assigned to, start date, end date, and duration of completing each task. Showcasing this set of slides titled Project Performance Progress Monitoring Calendar Chart Pictures PDF. The topics addressed in these templates are Plan Risk Management, Project Definition And Planning, Execution. All the content presented in this PPT design is completely editable. Download it and make adjustments in color, background, font etc. as per your unique business setting.

Cycle Chart Of Mutual Funds Sample Diagram Ppt Images
This is a cycle chart of mutual funds sample diagram ppt images. This is a five stage process. The stages in this process are reinvestment, returns, investors, fund manager, financial securities.
 Home
Home