Improvement Chart
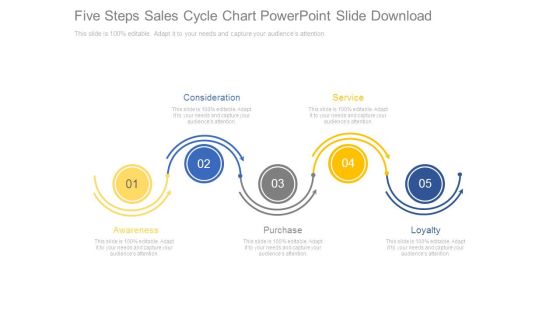
Five Steps Sales Cycle Chart Powerpoint Slide Download
This is a five steps sales cycle chart powerpoint slide download. This is a five stage process. The stages in this process are consideration, service, loyalty, purchase, awareness.

Five Steps Voc Concept Chart Powerpoint Slide Designs
This is a five steps voc concept chart powerpoint slide designs. This is a five stage process. The stages in this process are analysis, marketing, presentation, strategy.
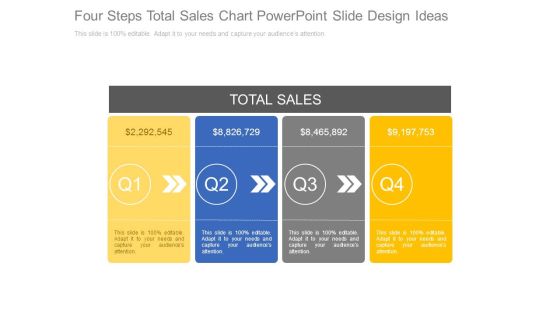
Four Steps Total Sales Chart Powerpoint Slide Design Ideas
This is a four steps total sales chart powerpoint slide design ideas. This is a four stage process. The stages in this process are total sales, marketing.

Puzzle Chart With Possible Solutions Ppt Background Template
This is a puzzle chart with possible solutions ppt background template. This is a four stage process. The stages in this process are puzzles, problem, solution, business, marketing.
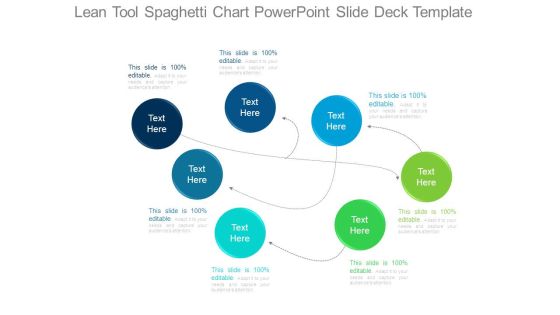
Lean Tool Spaghetti Chart Powerpoint Slide Deck Template
This is a lean tool spaghetti chart powerpoint slide deck template. This is a seven stage process. The stages in this process are business, marketing, arrows, management.
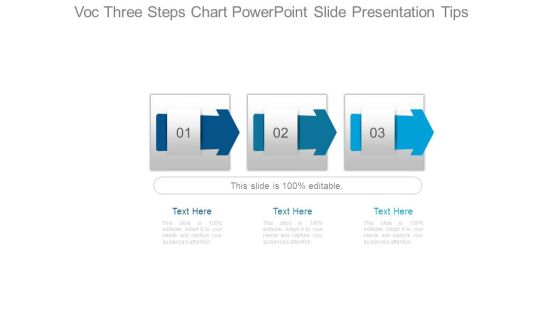
Voc Three Steps Chart Powerpoint Slide Presentation Tips
This is a voc three steps chart powerpoint slide presentation tips. This is a three stage process. The stages in this process are business, marketing, strategy, arrows, management.
What If Modelling Hexagon Chart Powerpoint Slide Graphics
This is a what if modelling hexagon chart powerpoint slide graphics. This is a three stage process. The stages in this process are what if modelling.

Dollar Stacks Chart For Performance Attribution Powerpoint Slide Designs
This is a dollar stacks chart for performance attribution powerpoint slide designs. This is a four stage process. The stages in this process are step.

Vision And Mission Triangle Chart Ppt Background Graphics
This is a vision and mission triangle chart ppt background graphics. This is a three stage process. The stages in this process are mission, value, vision.
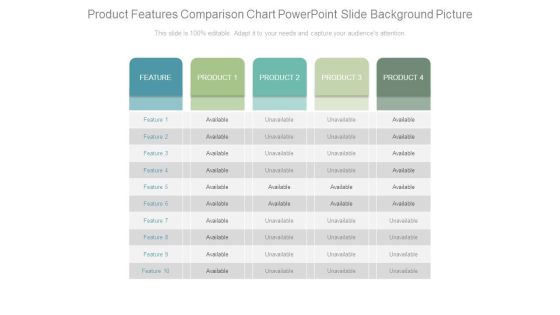
Product Features Comparison Chart Powerpoint Slide Background Picture
This is a product features comparison chart powerpoint slide background picture. This is a four stage process. The stages in this process are feature, product, available, unavailable.
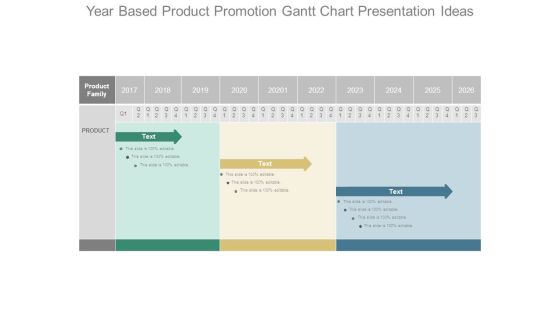
Year Based Product Promotion Gantt Chart Presentation Ideas
This is a year based product promotion gantt chart presentation ideas. This is a three stage process. The stages in this process are product family, product.

Competitive Environment Change Analysis Chart Ppt Slide Template
This is a competitive environment change analysis chart ppt slide template. This is a four stage process. The stages in this process are competitive landscape, brand.

Changes In Competitive Environment Landscape Chart Powerpoint Layout
This is a changes in competitive environment landscape chart powerpoint layout. This is a four stage process. The stages in this process are competitive landscape, brand.
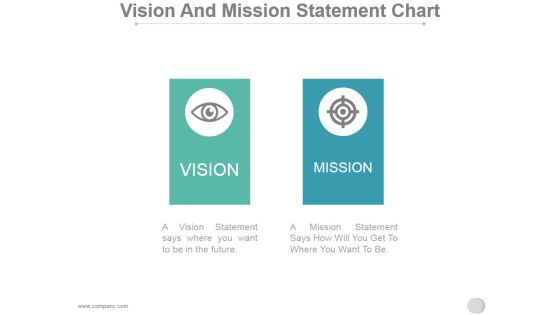
Vision And Mission Statement Chart Ppt PowerPoint Presentation Topics
This is a vision and mission statement chart ppt powerpoint presentation topics. This is a two stage process. The stages in this process are vision, mission.

Competitive Analysis Bubble Chart Ppt PowerPoint Presentation Templates
This is a competitive analysis bubble chart ppt powerpoint presentation templates. This is a six stage process. The stages in this process are product, business, management, marketing, strategy.

Competitive Analysis Scatter Chart Ppt PowerPoint Presentation Samples
This is a competitive analysis scatter chart ppt powerpoint presentation samples. This is a six stage process. The stages in this process are competitive, analysis, business, marketing, management.
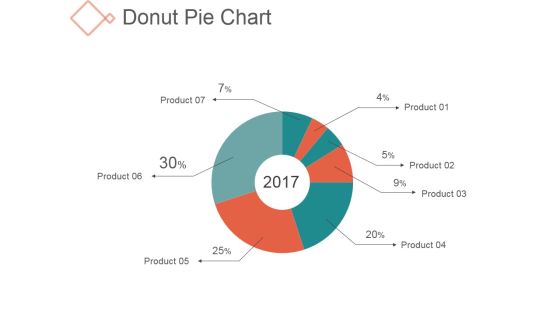
Donut Pie Chart Ppt PowerPoint Presentation Background Images
This is a donut pie chart ppt powerpoint presentation background images. This is a seven stage process. The stages in this process are management, business, finance, percentage.

Radar Chart Ppt PowerPoint Presentation Infographic Template Design Templates
This is a radar chart ppt powerpoint presentation infographic template design templates. This is a seven stage process. The stages in this process are business, shapes, product, marketing.

Stock Chart Ppt PowerPoint Presentation Infographic Template Clipart Images
This is a stock chart ppt powerpoint presentation infographic template clipart images. This is a five stage process. The stages in this process are high, volume, low, close.

Stock Chart Ppt PowerPoint Presentation Summary Background Designs
This is a stock chart ppt powerpoint presentation summary background designs. This is a five stage process. The stages in this process are high, volume, low.
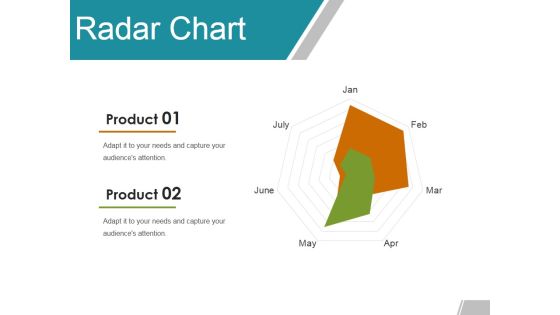
Radar Chart Ppt PowerPoint Presentation Gallery Example Topics
This is a radar chart ppt powerpoint presentation gallery example topics. This is a seven stage process. The stages in this process are product, business, marketing, shapes.

Stock Chart Ppt PowerPoint Presentation Summary Graphics Pictures
This is a stock chart ppt powerpoint presentation summary graphics pictures. This is a five stage process. The stages in this process are high, volume, low, close, finance.

Bar Chart Ppt PowerPoint Presentation Infographic Template Example
This is a bar chart ppt powerpoint presentation infographic template example. This is a seven stage process. The stages in this process are business, finance, marketing, percentage.

Daunt Pie Chart Ppt PowerPoint Presentation Layouts Portrait
This is a daunt pie chart ppt powerpoint presentation layouts portrait. This is a three stage process. The stages in this process are percentage, finance, donut, business.

Donut Pie Chart Ppt PowerPoint Presentation Professional Templates
This is a donut pie chart ppt powerpoint presentation professional templates. This is a three stage process. The stages in this process are finance, donut, business, marketing, strategy.

Basic Gap Analysis Chart Ppt PowerPoint Presentation Professional Portfolio
This is a basic gap analysis chart ppt powerpoint presentation professional portfolio. This is a six stage process. The stages in this process are business, step, marketing, management.
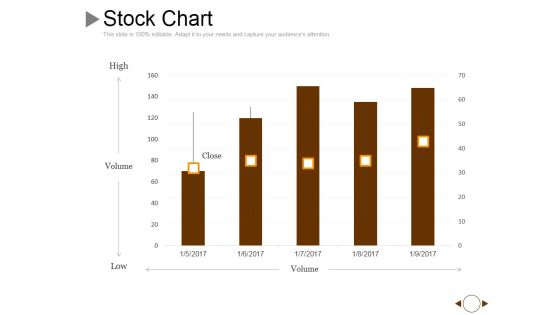
Stock Chart Ppt PowerPoint Presentation Gallery Graphics Example
This is a stock chart ppt powerpoint presentation gallery graphics example. This is a five stage process. The stages in this process are volume, high, low, close.
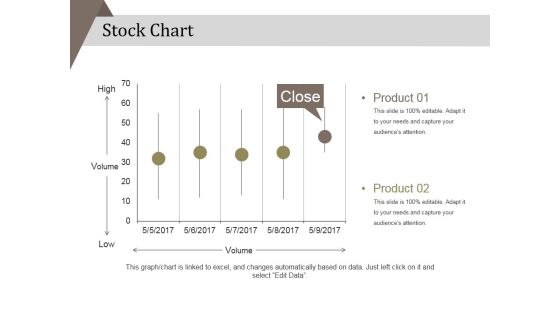
Stock Chart Ppt PowerPoint Presentation Portfolio Background Designs
This is a stock chart ppt powerpoint presentation portfolio background designs. This is a five stage process. The stages in this process are product, high, low .

Radar Chart Ppt PowerPoint Presentation Infographic Template Graphics Template
This is a radar chart ppt powerpoint presentation infographic template graphics template. This is a six stage process. The stages in this process are product, business, marketing, shapes.

Area Chart Ppt PowerPoint Presentation Gallery Clipart Images
This is a area chart ppt powerpoint presentation gallery clipart images. This is a two stage process. The stages in this process are product, profit, business, finance, marketing.

Pie Chart Ppt PowerPoint Presentation Slides Graphics Download
This is a pie chart ppt powerpoint presentation slides graphics download. This is a four stage process. The stages in this process are business, marketing, pie, finance, analysis.
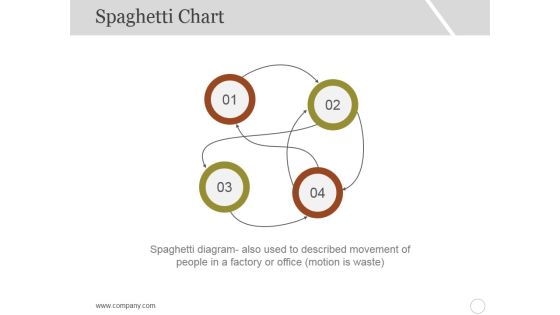
Spaghetti Chart Template 2 Ppt PowerPoint Presentation Inspiration Professional
This is a spaghetti chart template 2 ppt powerpoint presentation inspiration professional. This is a four stage process. The stages in this process are business, marketing, management, numbering.

Doughnut Chart Ppt PowerPoint Presentation Visual Aids Files
This is a doughnut chart ppt powerpoint presentation visual aids files. This is a three stage process. The stages in this process are finance, donut, percentage, business, marketing.

High Low Close Chart Ppt PowerPoint Presentation Infographics Templates
This is a high low close chart ppt powerpoint presentation infographics templates. This is a nine stage process. The stages in this process are high, volume, low, close.

Radar Chart Ppt PowerPoint Presentation Summary Background Designs
This is a radar chart ppt powerpoint presentation summary background designs. This is a two stage process. The stages in this process are product, finance, business, marketing.

Donut Pie Chart Ppt PowerPoint Presentation Show Topics
This is a donut pie chart ppt powerpoint presentation show topics. This is a three stage process. The stages in this process are percentage, finance, donut, business.

Area Chart Ppt PowerPoint Presentation Model Example Topics
This is a area chart ppt powerpoint presentation model example topics. This is a two stage process. The stages in this process are product, percentage, business, marketing, finance.
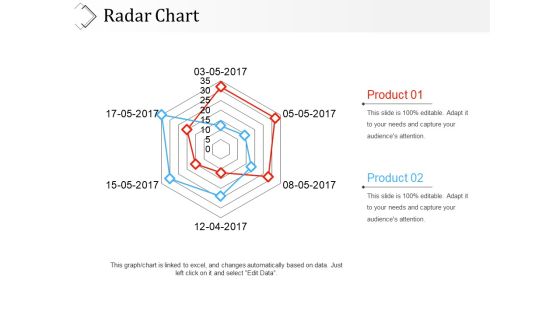
Radar Chart Ppt PowerPoint Presentation File Graphic Tips
This is a radar chart ppt powerpoint presentation file graphic tips. This is a two stage process. The stages in this process are product, finance, marketing, business.

Donut Pie Chart Ppt PowerPoint Presentation File Mockup
This is a donut pie chart ppt powerpoint presentation file mockup. This is a three stage process. The stages in this process are finance, business, percentage, marketing.
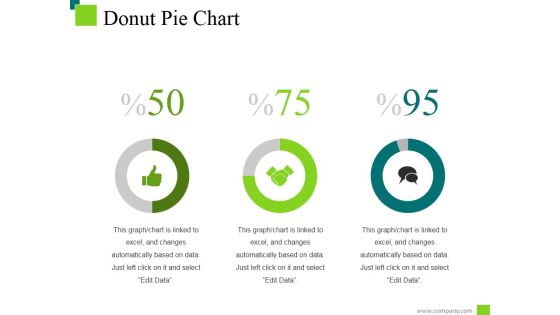
Donut Pie Chart Ppt PowerPoint Presentation Inspiration Deck
This is a donut pie chart ppt powerpoint presentation inspiration deck. This is a three stage process. The stages in this process are percentage, finance, donut, business.
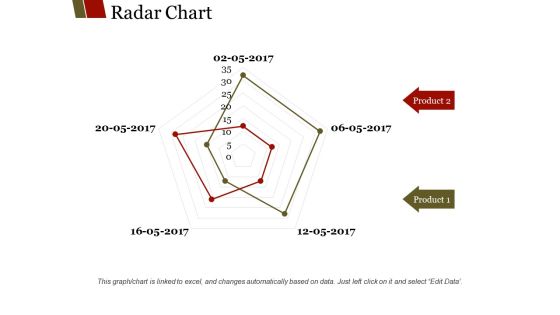
Radar Chart Ppt PowerPoint Presentation Summary Slide Portrait
This is a radar chart ppt powerpoint presentation summary slide portrait. This is a two stage process. The stages in this process are product, business, marketing, finance.
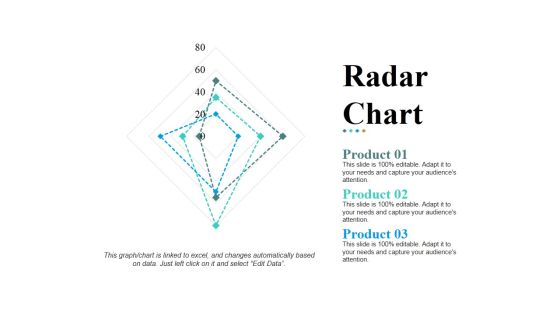
Radar Chart Ppt PowerPoint Presentation Pictures Design Templates
This is a radar chart ppt powerpoint presentation pictures design templates. This is a three stage process. The stages in this process are product, shapes, business, marketing, management.

Stock Chart Ppt PowerPoint Presentation Gallery Graphic Images
This is a stock chart ppt powerpoint presentation gallery graphic images. This is a five stage process. The stages in this process are close, high, volume, low, open.
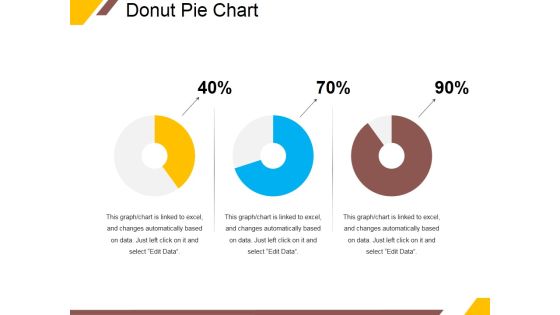
Donut Pie Chart Ppt PowerPoint Presentation Ideas Portrait
This is a donut pie chart ppt powerpoint presentation ideas portrait. This is a three stage process. The stages in this process are percentage, finance, donut, business.
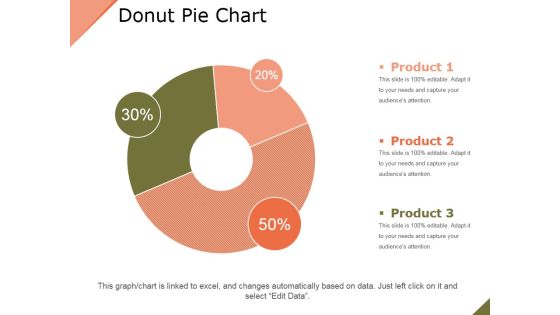
Donut Pie Chart Ppt PowerPoint Presentation Layouts Outfit
This is a donut pie chart ppt powerpoint presentation layouts outfit. This is a three stage process. The stages in this process are product, business, percentage, finance, marketing.

Daunt Pie Chart Ppt PowerPoint Presentation Show Gallery
This is a daunt pie chart ppt powerpoint presentation show gallery. This is a five stage process. The stages in this process are business, marketing, teamwork, communication, strategy.

Donut Pie Chart Ppt PowerPoint Presentation Model Pictures
This is a donut pie chart ppt powerpoint presentation model pictures. This is a six stage process. The stages in this process are product, percentage, finance, year, business.
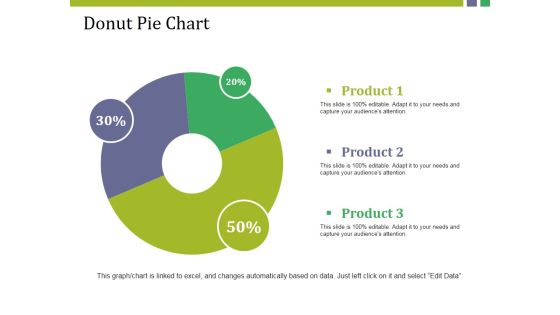
Donut Pie Chart Ppt PowerPoint Presentation Model Show
This is a donut pie chart ppt powerpoint presentation model show. This is a three stage process. The stages in this process are product, donut, percentage, finance, business.
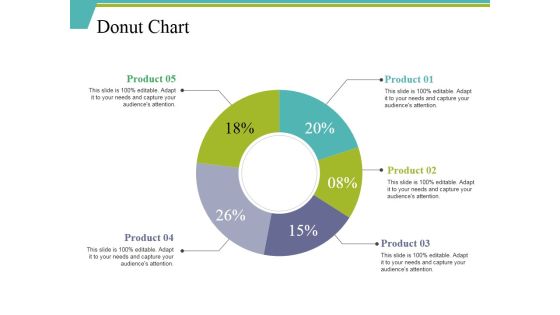
Donut Chart Ppt PowerPoint Presentation Ideas Background Designs
This is a donut chart ppt powerpoint presentation ideas background designs. This is a five stage process. The stages in this process are percentage, finance, donut, business, product.
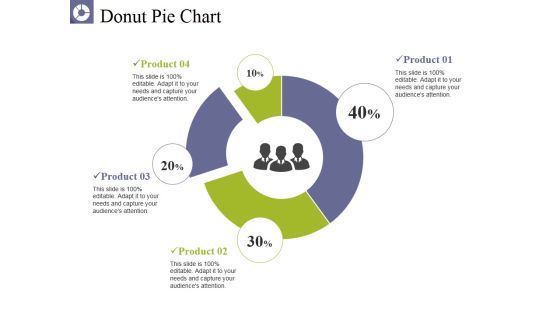
Donut Pie Chart Ppt PowerPoint Presentation Pictures Graphics
This is a donut pie chart ppt powerpoint presentation pictures graphics. This is a four stage process. The stages in this process are product, business, percentage, donut, finance.

Stock Chart Ppt PowerPoint Presentation Slides Graphics Pictures
This is a stock chart ppt powerpoint presentation slides graphics pictures. This is a two stage process. The stages in this process are product, high, volume, low, open.
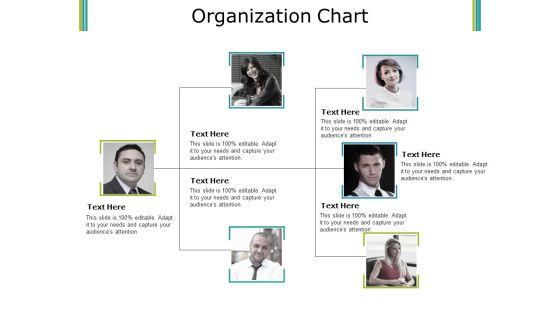
Organization Chart Ppt PowerPoint Presentation Ideas Graphics Download
This is a organization chart ppt powerpoint presentation ideas graphics download. This is a three stage process. The stages in this process are hierarchy, step, teamwork, communication, business.

Bubble Chart Finance Ppt PowerPoint Presentation Ideas Graphics
This is a bubble chart finance ppt powerpoint presentation ideas graphics. This is a two stage process. The stages in this process are finance, marketing, management, investment, analysis.

Column Chart Finance Ppt PowerPoint Presentation Layouts Display
This is a column chart finance ppt powerpoint presentation layouts display. This is a two stage process. The stages in this process are finance, marketing, management, investment, analysis.

Combo Chart Ppt PowerPoint Presentation Layouts Example Topics
This is a combo chart ppt powerpoint presentation layouts example topics. This is a two stage process. The stages in this process are finance, marketing, management, investment, analysis.
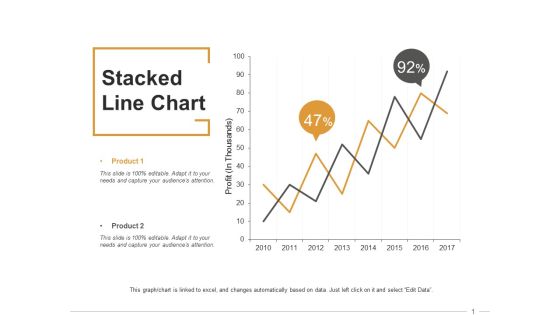
Stacked Line Chart Ppt PowerPoint Presentation Inspiration Format
This is a stacked line chart ppt powerpoint presentation inspiration format. This is a two stage process. The stages in this process are finance, marketing, management, investment, analysis.
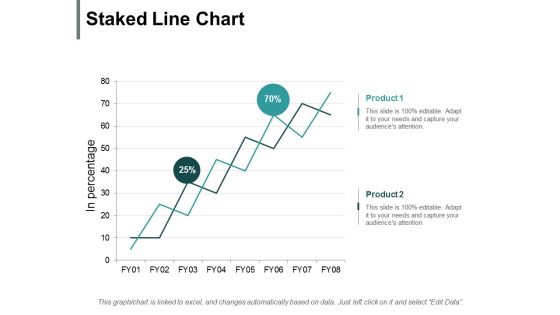
Staked Line Chart Ppt PowerPoint Presentation Ideas Influencers
This is a staked line chart ppt powerpoint presentation ideas influencers. This is a two stage process. The stages in this process are finance, marketing, management, investment, analysis.

Area Chart Finance Ppt PowerPoint Presentation Model Ideas
This is a area chart finance ppt powerpoint presentation model ideas. This is a two stage process. The stages in this process are finance, marketing, analysis, business, investment.

Area Chart Product Finance Ppt PowerPoint Presentation Guide
This is a area chart product finance ppt powerpoint presentation guide. This is a four stage process. The stages in this process are business, management, financial, marketing, sales.

Bubble Chart Finance Ppt PowerPoint Presentation Slides Show
This is a bubble chart finance ppt powerpoint presentation slides show. This is a two stage process. The stages in this process are finance, marketing, analysis, business, investment.

Bubble Chart Product Ppt PowerPoint Presentation Infographics Backgrounds
This is a bubble chart product ppt powerpoint presentation infographics backgrounds. This is a two stage process. The stages in this process are business, management, strategy, marketing, sales.

Column Chart Ppt PowerPoint Presentation Infographics Graphics Template
This is a column chart ppt powerpoint presentation infographics graphics template. This is a two stage process. The stages in this process are percentage, product, business, management, marketing.

Pie Chart Ppt PowerPoint Presentation Infographic Template Topics
This is a pie chart ppt powerpoint presentation infographic template topics. This is a three stage process. The stages in this process are percentage, management, marketing, business.

Scatter Bubble Chart Ppt PowerPoint Presentation Inspiration Demonstration
This is a scatter bubble chart ppt powerpoint presentation inspiration demonstration. This is a two stage process. The stages in this process are percentage, product, business, management, marketing.

Clustered Column Chart Ppt PowerPoint Presentation Ideas Picture
This is a clustered column chart ppt powerpoint presentation ideas picture. This is a three stage process. The stages in this process are percentage, product, management, marketing.
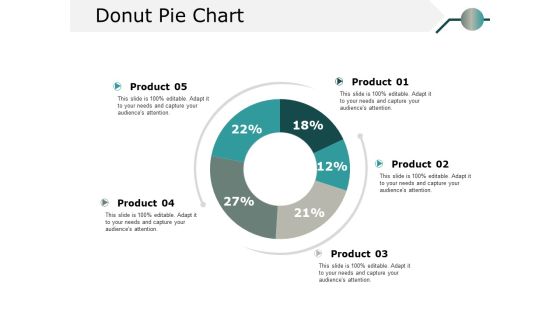
Donut Pie Chart Ppt PowerPoint Presentation Model Information
This is a donut pie chart ppt powerpoint presentation model information. This is a five stage process. The stages in this process are percentage, product, business.

Area Chart Finance Ppt PowerPoint Presentation Infographics Deck
This is a area chart finance ppt powerpoint presentation infographics deck. This is a three stage process. The stages in this process are finance, marketing, management, investment, analysis.

Combo Chart Finance Ppt PowerPoint Presentation Styles Example
This is a combo chart finance ppt powerpoint presentation styles example. This is a three stage process. The stages in this process are finance, marketing, management, investment, analysis.

area chart finance ppt powerpoint presentation pictures format
This is a area chart finance ppt powerpoint presentation pictures format. This is a three stage process. The stages in this process are finance, marketing, management, investment, analysis.
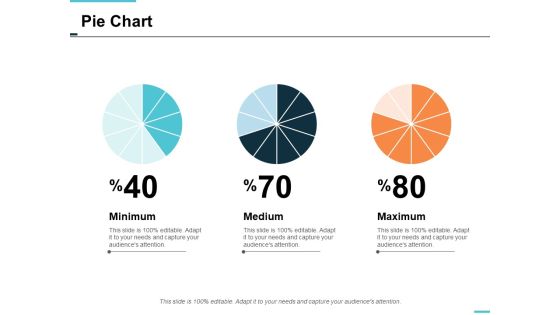
pie chart finance ppt powerpoint presentation styles skills
This is a pie chart finance ppt powerpoint presentation styles skills. This is a three stage process. The stages in this process are finance, marketing, management, investment, analysis.

Clustered Chart Finance Ppt PowerPoint Presentation Summary Guide
This is a clustered chart finance ppt powerpoint presentation summary guide. This is a three stage process. The stages in this process are finance, marketing, management, investment, analysis.

Combo Chart Finance Ppt PowerPoint Presentation Portfolio Guidelines
This is a combo chart finance ppt powerpoint presentation portfolio guidelines. This is a three stage process. The stages in this process are finance, marketing, management, investment, analysis.

Stacked Column Chart Ppt PowerPoint Presentation Slides Files
This is a stacked column chart ppt powerpoint presentation slides files. This is a three stage process. The stages in this process are percentage, product, business, marketing.

Work Delegation Hierarchy Chart Ppt PowerPoint Presentation File Graphic Images
This is a work delegation hierarchy chart ppt powerpoint presentation file graphic images. This is a five stage process. The stages in this process are delegation, deputation, delegacy.
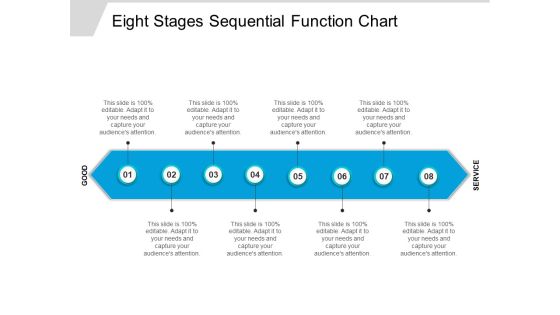
Eight Stages Sequential Function Chart Ppt PowerPoint Presentation Professional Maker
This is a eight stages sequential function chart ppt powerpoint presentation professional maker. This is a eight stage process. The stages in this process are circular, continuity, continuum.

Area Chart Contribution Ppt PowerPoint Presentation Gallery Structure
This is a area chart contribution ppt powerpoint presentation gallery structure. This is a three stage process. The stages in this process are business, management, strategy, analysis, marketing.

Donut Chart Management Ppt Powerpoint Presentation Slides Aids
This is a donut chart management ppt powerpoint presentation slides aids. This is a six stage process. The stages in this process are finance, marketing, management, investment, analysis.

Workload Prioritization Chart Ppt PowerPoint Presentation Infographic Template Images
This is a workload prioritization chart ppt powerpoint presentation infographic template images. This is a four stage process. The stages in this process are business, management, marketing.

Column Chart Finance Ppt Powerpoint Presentation Summary Visuals
This is a column chart finance ppt powerpoint presentation summary visuals. This is a four stage process. The stages in this process are finance, marketing, management, investment, analysis.

area chart finance ppt powerpoint presentation layouts ideas
This is a area chart finance ppt powerpoint presentation layouts ideas. This is a three stage process. The stages in this process are finance, marketing, management, investment, analysis.
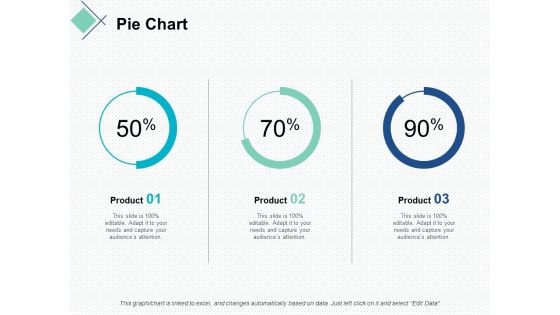
pie chart finance marketing ppt powerpoint presentation slides demonstration
This is a pie chart finance marketing ppt powerpoint presentation slides demonstration. This is a stage process. The stages in this process are finance, marketing, management, investment, analysis.

Project Management Gantt Chart Ppt PowerPoint Presentation Summary Images
This is a project management gantt chart ppt powerpoint presentation summary images. This is a two stage process. The stages in this process are marketing, business, management, compare.

Column Chart Finance Ppt Powerpoint Presentation Gallery Maker
This is a column chart finance ppt powerpoint presentation gallery maker. This is a two stage process. The stages in this process are finance, marketing, management, investment, analysis.

Stock Chart Graph Ppt PowerPoint Presentation Ideas Demonstration
This is a stock chart graph ppt powerpoint presentation ideas demonstration. This is a three stage process. The stages in this process are finance, marketing, management, investment, analysis.
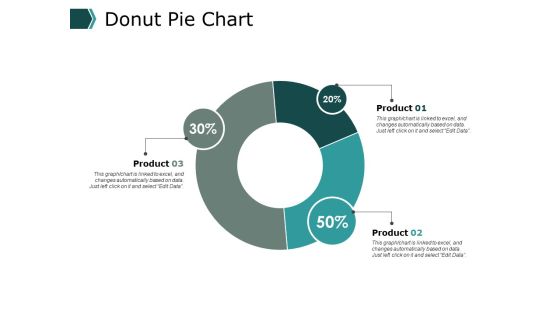
Donut Pie Chart Ppt PowerPoint Presentation Model Deck
This is a donut pie chart ppt powerpoint presentation model deck. This is a three stage process. The stages in this process are finance, marketing, management, investment, analysis.

Column Chart Finance Ppt Powerpoint Presentation Styles Examples
This is a column chart finance ppt powerpoint presentation styles examples. This is a two stage process. The stages in this process are finance, marketing, management, investment, analysis.

Column Chart Finance Ppt PowerPoint Presentation Summary Grid
This is a column chart finance ppt powerpoint presentation summary grid. This is a three stage process. The stages in this process are finance, marketing, management, investment, analysis.

Area Chart Finance Ppt PowerPoint Presentation Summary Structure
This is a area chart finance ppt powerpoint presentation summary structure. This is a two stage process. The stages in this process are finance, marketing, management, investment, analysis.

Pie Chart Finance Ppt PowerPoint Presentation Ideas Templates
This is a pie chart finance ppt powerpoint presentation ideas templates. This is a three stage process. The stages in this process are finance, marketing, management, investment, analysis.
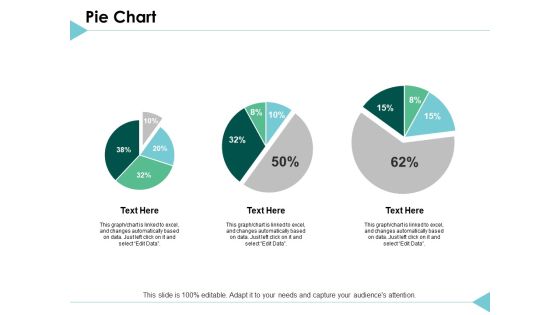
Pie Chart Finance Ppt PowerPoint Presentation Styles Templates
This is a pie chart finance ppt powerpoint presentation styles templates. This is a three stage process. The stages in this process are finance, marketing, analysis, investment, million.

Clustered Chart Graph Ppt PowerPoint Presentation Gallery Backgrounds
This is a clustered chart graph ppt powerpoint presentation gallery backgrounds. This is a three stage process. The stages in this process are finance, marketing, analysis, investment, million.

Area Chart Finance Ppt PowerPoint Presentation Gallery Information
This is a area chart finance ppt powerpoint presentation gallery information. This is a three stage process. The stages in this process are finance, marketing, analysis, investment, million.

Combo Chart Graph Ppt PowerPoint Presentation Professional Guidelines
This is a combo chart graph ppt powerpoint presentation professional guidelines. This is a three stage process. The stages in this process are finance, marketing, analysis, investment, million.

Pie Chart Bar Ppt PowerPoint Presentation Layouts Examples
This is a pie chart bar ppt powerpoint presentation layouts examples. This is a three stage process. The stages in this process are finance, marketing, analysis, investment, million.

Pie Chart Finance Ppt Powerpoint Presentation Gallery Templates
This is a pie chart finance ppt powerpoint presentation gallery templates. This is a four stage process. The stages in this process are finance, marketing, management, investment, analysis.

Column Chart Finance Ppt Powerpoint Presentation Inspiration Images
This is a column chart finance ppt powerpoint presentation inspiration images. This is a two stage process. The stages in this process are finance, marketing, management, investment, analysis.

Combo Chart Finance Ppt Powerpoint Presentation Ideas Slides
This is a combo chart finance ppt powerpoint presentation ideas slides. This is a three stage process. The stages in this process are finance, marketing, management, investment, analysis.
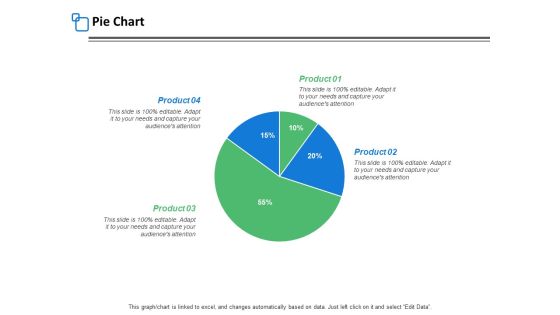
Pie Chart Finance Ppt PowerPoint Presentation Inspiration Templates
This is a pie chart finance ppt powerpoint presentation inspiration templates. This is a four stage process. The stages in this process are finance, marketing, management, investment, analysis.

Combo Chart Ppt PowerPoint Presentation Icon Design Templates
This is a combo chart ppt powerpoint presentation icon design templates. This is a three stage process. The stages in this process are market size, growth rate, product, business, success.
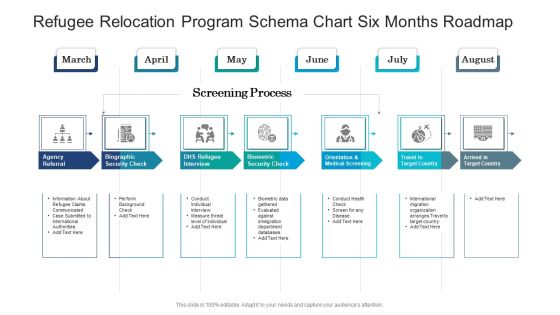
Refugee Relocation Program Schema Chart Six Months Roadmap Professional
Presenting our jaw dropping refugee relocation program schema chart six months roadmap professional. You can alternate the color, font size, font type, and shapes of this PPT layout according to your strategic process. This PPT presentation is compatible with Google Slides and is available in both standard screen and widescreen aspect ratios. You can also download this well researched PowerPoint template design in different formats like PDF, JPG, and PNG. So utilize this visually appealing design by clicking the download button given below.
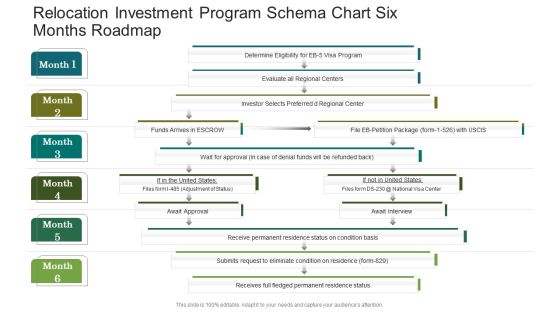
Relocation Investment Program Schema Chart Six Months Roadmap Topics
Presenting our jaw dropping relocation investment program schema chart six months roadmap topics. You can alternate the color, font size, font type, and shapes of this PPT layout according to your strategic process. This PPT presentation is compatible with Google Slides and is available in both standard screen and widescreen aspect ratios. You can also download this well researched PowerPoint template design in different formats like PDF, JPG, and PNG. So utilize this visually appealing design by clicking the download button given below.

PowerPoint Template Business Process Chart Success Ppt Theme
PowerPoint Template Business Process Chart Success PPT Theme-This PowerPoint Diagram consists of Red Kite of four layers as shown. It portrays the concept of teamwork. These four layers combine to form one unique Design.-PowerPoint Template Business Process Chart Success PPT Theme
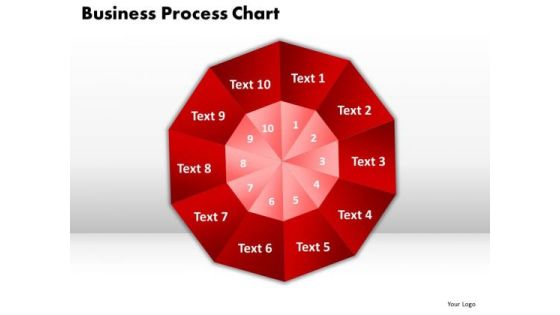
PowerPoint Themes Business Process Chart Success Ppt Slides
PowerPoint Themes Business Process Chart Success PPT Slides-This PowerPoint Diagram shows the ten Different Layers which should be followed in Business, Marketing and Finance. This Diagram is useful to represent seven different topics along with their Description.-PowerPoint Themes Business Process Chart Success PPT Slides

Project Flow Chart Ppt PowerPoint Presentation Show Backgrounds Cpb
Presenting this set of slides with name project flow chart ppt powerpoint presentation show backgrounds cpb. This is a seven stage process. The stages in this process are project flow chart. This is a completely editable PowerPoint presentation and is available for immediate download. Download now and impress your audience.

Business Profit Growth Chart Vector Icon Ppt File Brochure PDF
Persuade your audience using this business profit growth chart vector icon ppt file brochure pdf. This PPT design covers three stages, thus making it a great tool to use. It also caters to a variety of topics including business profit growth chart vector icon. Download this PPT design now to present a convincing pitch that not only emphasizes the topic but also showcases your presentation skills.
Icon Of Businessman Presenting Growth Trend Chart Designs PDF
Persuade your audience using this Icon Of Businessman Presenting Growth Trend Chart Designs PDF This PPT design covers Four stages, thus making it a great tool to use. It also caters to a variety of topics including Icon Businessman, Presenting Growth, Trend Chart Download this PPT design now to present a convincing pitch that not only emphasizes the topic but also showcases your presentation skills.
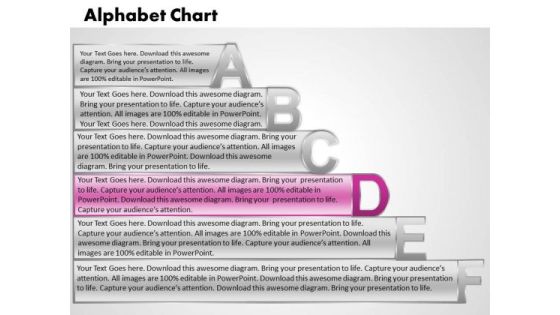
Ppt Alphabet Chart With Textboxes Business Plan PowerPoint Process Templates
PPT alpahabet chart with textboxes business plan powerpoint Process Templates-Use this Amazing PowerPoint Diagram which shows the different way to represent your text and make your Presentation more interesting and impressive to watch for Audiences.-PPT alpahabet chart with textboxes business plan powerpoint Process Templates

Project Progress Gannt Chart Report Ppt PowerPoint Presentation Outline Images
This is a project progress gannt chart report ppt powerpoint presentation outline images. This is a eight stage process. The stages in this process are activity tracker, business, marketing.
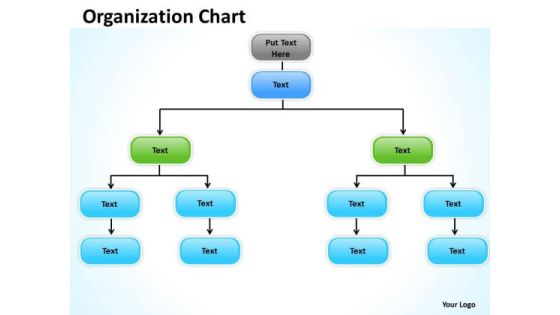
Business Finance Strategy Development Organization Chart Diagram Marketing Diagram
Double The Impact With Our Business Finance Strategy Development Organization chart diagram marketing diagram Powerpoint Templates. Your Thoughts Will Have An Imposing Effect. Knead The Dough With OurBusiness Finance Strategy Development Organization chart diagram marketing diagram Powerpoint Templates. Your Thoughts Will Come Up Well.
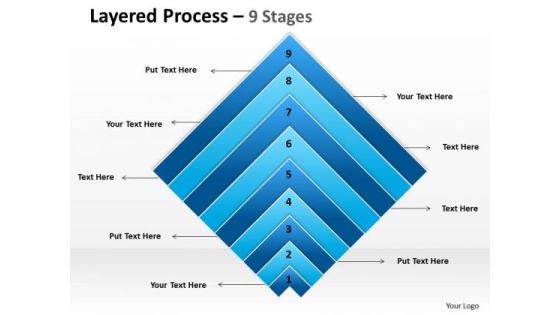
Business Finance Strategy Development Layered Chart Sales Diagram
Analyze Ailments On Our Business Finance Strategy Development Layered chart Sales Diagram Powerpoint Templates. Bring Out The Thinking Doctor In You. Dock Your Thoughts With Our Business Finance Strategy Development Layered chart Sales Diagram Powerpoint Templates. They Will Launch Them Into Orbit.
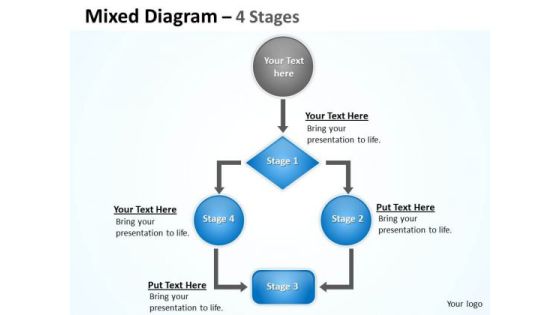
Business Finance Strategy Development Flow Chart Sales Diagram
Analyze Ailments On Our Business Finance Strategy Development Flow Chart Sales Diagram Powerpoint Templates. Bring Out The Thinking Doctor In You. Dock Your Thoughts With Our Business Finance Strategy Development Flow Chart Sales Diagram Powerpoint Templates. They Will Launch Them Into Orbit.
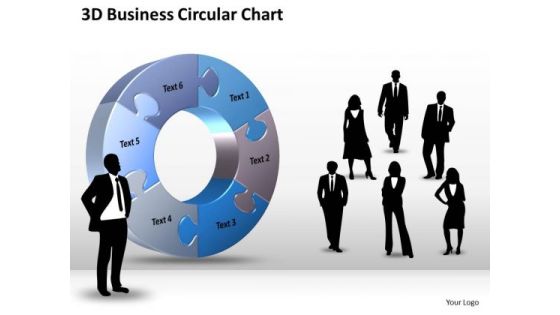
Business Finance Strategy Development 3d Business Circular Chart Sales Diagram
Analyze Ailments On Our Business Finance Strategy Development 3D Business Circular Chart Sales Diagram Powerpoint Templates. Bring Out The Thinking Doctor In You. Dock Your Thoughts With Our Business Finance Strategy Development 3D Business Circular Chart Sales Diagram Powerpoint Templates. They Will Launch Them Into Orbit.
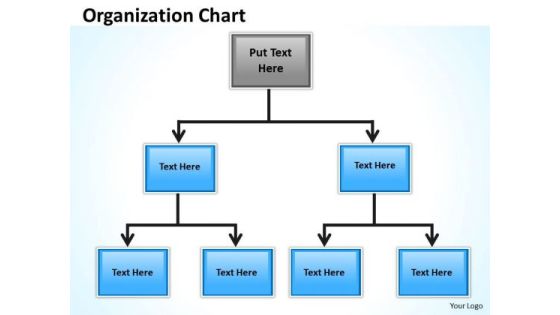
Business Cycle Diagram Origanization Chart Business Finance Strategy Development
Establish The Dominance Of Your Ideas. Our Business Cycle Diagram Origanization Chart Business Finance Strategy Development Powerpoint Templates Will Put Them On Top. Put Yourself In A Dominant Position. Our Business Cycle Diagram Origanization Chart Business Finance Strategy Development Powerpoint Templates Will Confirm Your Superiority.

Business Cycle Diagram Origanization Circular Chart Business Finance Strategy Development
Dominate Proceedings With Your Ideas. Our Business Cycle Diagram Origanization Circular Chart Business Finance Strategy Development Powerpoint Templates Will Empower Your Thoughts. Our Business Cycle Diagram Origanization Circular Chart Business Finance Strategy Development Powerpoint Templates Have A Domino Effect. Your Ideas Will Generate One After Another.
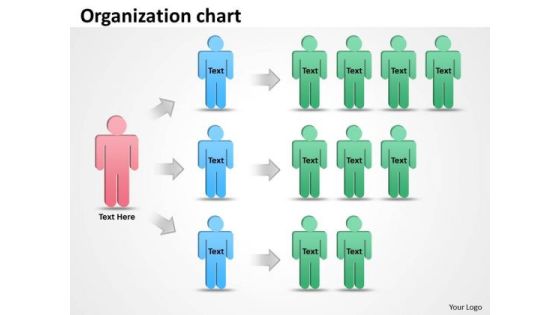
Business Finance Strategy Development Organization Staff Chart Business Cycle Diagram
Your Grasp Of Economics Is Well Known. Help Your Audience Comprehend Issues With Our Business Finance Strategy Development Organization staff chart Business Cycle Diagram Powerpoint Templates. Strike A Bargain With Our Business Finance Strategy Development Organization staff chart Business Cycle Diagram Powerpoint Templates. Your Thoughts Will Get A Winning Deal.
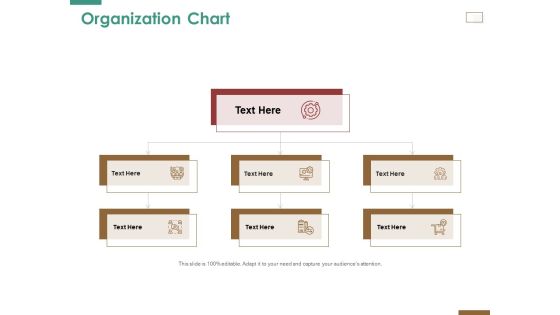
Successful Strategy Implementation Process Organization Organization Chart Microsoft PDF
Presenting this set of slides with name successful strategy implementation process organization organization chart microsoft pdf. This is a three stage process. The stages in this process are organization chart. This is a completely editable PowerPoint presentation and is available for immediate download. Download now and impress your audience.
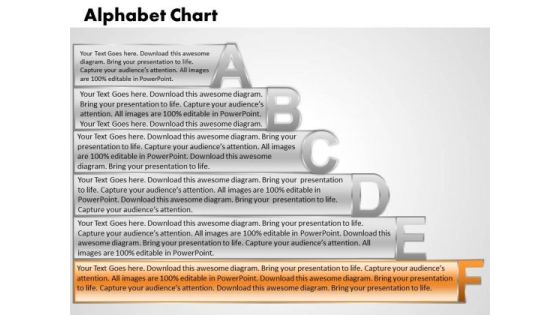
Ppt Alphabet Chart With Textboxes Time Management PowerPoint Process Templates
PPT alpahabet chart with textboxes time management powerpoint Process Templates-Use this Amazing PowerPoint Diagram which shows the different way to represent your text and make your Presentation more interesting and impressive to watch for Audiences.-PPT alpahabet chart with textboxes time management powerpoint Process Templates

Strategic Management Organization Chart Templates Business Finance Strategy Development
Draw Up Your Agenda On Our Strategic Management Organization chart templates Business Finance Strategy Development Powerpoint Templates. Coax Your Audience Into Acceptance. Draw The Debate To A Close. Arrive At Conclusions With Our Strategic Management Organization chart templates Business Finance Strategy Development Powerpoint Templates.
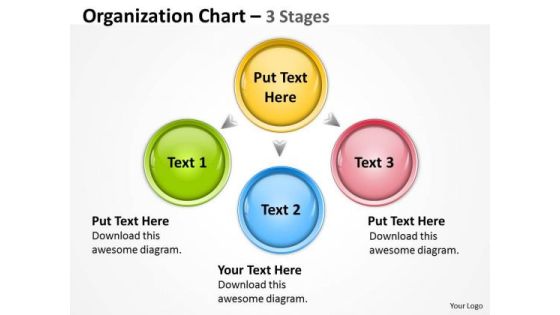
Business Finance Strategy Development Organization Chart Stages Business Framework Model
Plan For All Contingencies With OurBusiness Finance Strategy Development Organization Chart Stages Business Framework Model Powerpoint Templates. Douse The Fire Before It Catches. Generate Camaraderie With Our Business Finance Strategy Development Organization Chart Stages Business Framework Model Powerpoint Templates. Good Wishes Will Come Raining Down.
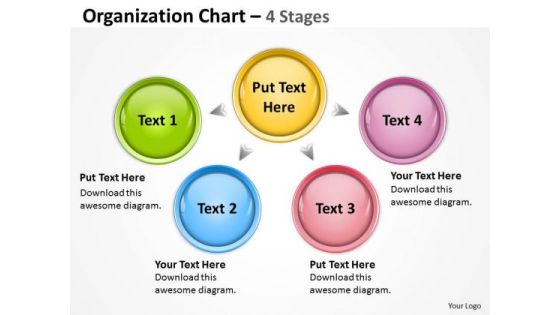
Business Finance Strategy Development Organization Chart Mba Models And Frameworks
Rake In The Dough With Your Ideas. Profits Will Rise With Our Business Finance Strategy Development Organization Chart MBA models and frameworks Powerpoint Templates. Dowse The Flames With Our Business Finance Strategy Development Organization Chart MBA models and frameworks Powerpoint Templates. Put Out The Fire Before It Starts.
 Home
Home