Financial Graphs
Selling Strategy And Operational Plan Business Overview Of The Target Company Amm Company Ppt Infographics Icon PDF
The slide provides the business overview of the target company the purchasing company.Business overview includes business introduction, mission and vision statement, financials highlights and non-performing assets for five years. Make sure to capture your audiences attention in your business displays with our gratis customizable Selling Strategy And Operational Plan Business Overview Of The Target Company Amm Company Ppt Infographics Icon PDF. These are great for business strategies, office conferences, capital raising or task suggestions. If you desire to acquire more customers for your tech business and ensure they stay satisfied, create your own sales presentation with these plain slides.

Area Chart Ppt PowerPoint Presentation Styles Graphics
This is a area chart ppt powerpoint presentation styles graphics. This is a two stage process. The stages in this process are business, charts, graphs, marketing, finance.
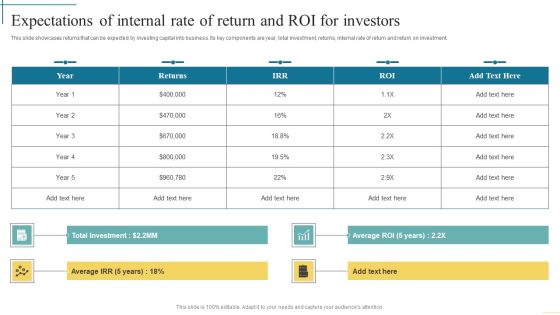
Expectations Of Internal Rate Of Return And Roi For Investors Developing Fundraising Techniques Mockup PDF
This slide showcases graphs that can help organization to evaluate the survival rate of startups that raised capital through angel investors. It showcases graph of startup survival rates and survival rate of business by industry . Want to ace your presentation in front of a live audience Our Expectations Of Internal Rate Of Return And Roi For Investors Developing Fundraising Techniques Mockup PDF can help you do that by engaging all the users towards you. Slidegeeks experts have put their efforts and expertise into creating these impeccable powerpoint presentations so that you can communicate your ideas clearly. Moreover, all the templates are customizable, and easy-to-edit and downloadable. Use these for both personal and commercial use.

Brand Revenue Comparative Analysis With Net Promoter Score Dashboard Mockup PDF
This slide illustrates graphical representation of revenue of three brands. It includes weekly revenue line graphs and net promoter score by age of customers.Pitch your topic with ease and precision using this Brand Revenue Comparative Analysis With Net Promoter Score Dashboard Mockup PDF. This layout presents information on Brand Revenue Comparative Analysis With Net Promoter Score Dashboard. It is also available for immediate download and adjustment. So, changes can be made in the color, design, graphics or any other component to create a unique layout.

Evaluating Returns Of Startups Funded By Venture Capitalist Sample PDF
This slide showcases graphs that can help organization evaluate returns generated by startups that raised capital through venture capital financing. It can help organization to calculate the estimated IRR and ROI for fundraising through venture capital financing. Deliver an awe inspiring pitch with this creative Evaluating Returns Of Startups Funded By Venture Capitalist Sample PDF bundle. Topics like Invested Capital, Evaluating Returns Of Startups, Venture Capitalist can be discussed with this completely editable template. It is available for immediate download depending on the needs and requirements of the user.

Evaluating Returns Of Startups Funded By Venture Capitalist Demonstration PDF
This slide showcases graphs that can help organization evaluate returns generated by startups that raised capital through venture capital financing. It can help organization to calculate the estimated IRR and ROI for fundraising through venture capital financing. Find a pre designed and impeccable Evaluating Returns Of Startups Funded By Venture Capitalist Demonstration PDF. The templates can ace your presentation without additional effort. You can download these easy to edit presentation templates to make your presentation stand out from others. So, what are you waiting for Download the template from Slidegeeks today and give a unique touch to your presentation.
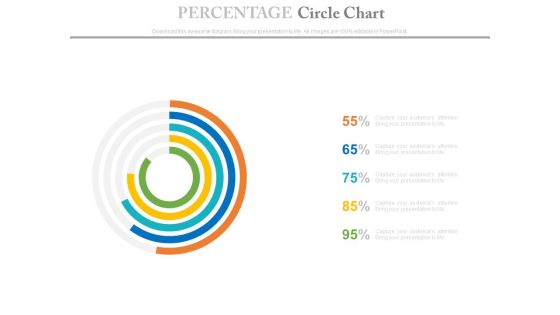
Percentage Data Circle Chart Powerpoint Slides
This PowerPoint template has been designed with circle chart. Download this PPT chart to depict financial ratio analysis. This PowerPoint slide is of great help in the business sector to make realistic presentations and provides effective way of presenting your newer thoughts.

Table Of Content Template 1 Ppt PowerPoint Presentation Infographic Template Demonstration
This is a table of content template 1 ppt powerpoint presentation infographic template demonstration. This is a six stage process. The stages in this process are business overview, financial performance, client and project updates, competitors analysis, future roadmap, csr miscellaneous activities.

Table Of Content Template 5 Ppt PowerPoint Presentation Inspiration Format Ideas
This is a table of content template 5 ppt powerpoint presentation inspiration format ideas. This is a six stage process. The stages in this process are business overview, financial performance, client and project updates, competitors analysis, future roadmap, csr miscellaneous activities.
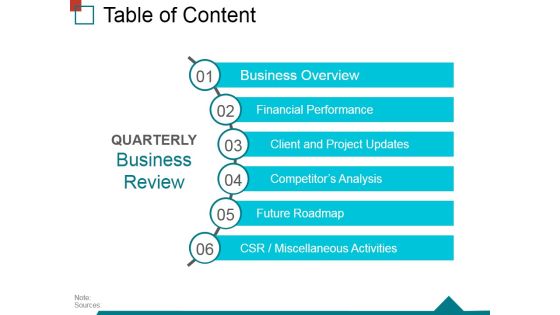
Table Of Content Template 7 Ppt PowerPoint Presentation Infographic Template Demonstration
This is a table of content template 7 ppt powerpoint presentation infographic template demonstration. This is a six stage process. The stages in this process are business overview, financial performance, client and project updates, competitors analysis, future roadmap, csr miscellaneous activities.

Scatter Bubble Chart Ppt PowerPoint Presentation Professional Skills
This is a scatter bubble chart ppt powerpoint presentation professional skills. This is a six stage process. The stages in this process are financial, marketing, management, strategy, planning.

Area Chart Ppt PowerPoint Presentation Ideas Tips
This is a area chart ppt powerpoint presentation ideas tips. This is a two stage process. The stages in this process are in percentage, financial, year, business, marketing.
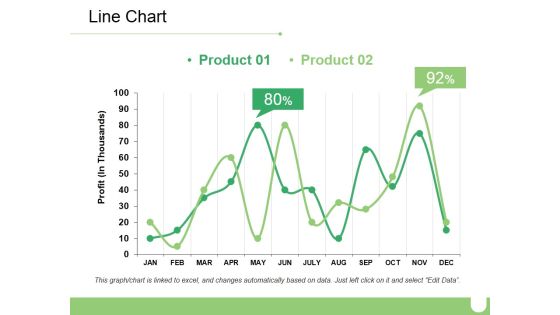
Line Chart Ppt PowerPoint Presentation Ideas Diagrams
This is a line chart ppt powerpoint presentation ideas diagrams. This is a two stage process. The stages in this process are business, marketing, percentage, financial, profit.

Scatter Chart Ppt PowerPoint Presentation Files
This is a scatter chart ppt powerpoint presentation files. This is a one stage process. The stages in this process are scatter chart, financial, strategy, business, planning.

Combo Chart Ppt PowerPoint Presentation Professional Ideas
This is a combo chart ppt powerpoint presentation professional ideas. This is a two stages process. The stages in this process are combo chart, financial, business, planning, marketing.

Area Chart Ppt PowerPoint Presentation Summary Backgrounds
This is a area chart ppt powerpoint presentation summary backgrounds. This is a two stage process. The stages in this process are percentage, financial, business, management.

Bar Chart Marketing Ppt PowerPoint Presentation Outline Deck
This is a bar chart marketing ppt powerpoint presentation outline deck. This is a two stage process. The stages in this process are business, management, marketing, financial, sales.

Executive Summary Ppt PowerPoint Presentation Slides Design Inspiration

Comparison Minimum Ppt PowerPoint Presentation File Visual Aids
This is a comparison minimum ppt powerpoint presentation file visual aids. This is a three stage process. The stages in this process are financial, maximum, medium, minimum, marketing.
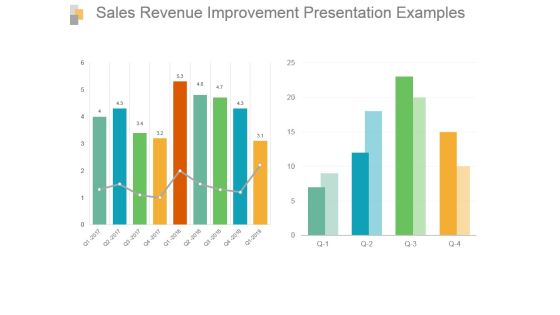
Sales Revenue Improvement Presentation Examples
This is a sales revenue improvement presentation examples. This is a two stage process. The stages in this process are bar graph, growth, sales, data, analysis.

Bar Chart Ppt PowerPoint Presentation Infographic Template Picture
This is a bar chart ppt powerpoint presentation infographic template picture. This is a two stage process. The stages in this process are financial, in percentage, business, marketing, bar chart.

Area Chart Finance Ppt PowerPoint Presentation Infographics Layouts
This is a area chart finance ppt powerpoint presentation infographics layouts. This is a one stages process. The stages in this process are area chart, financial, marketing, planning, business.

Stacked Area Clustered Column Ppt PowerPoint Presentation Portfolio Sample
This is a stacked area clustered column ppt powerpoint presentation portfolio sample. This is a three stage process. The stages in this process are stacked area, clustered column, financial, strategy, business, planning.

Area Chart Ppt PowerPoint Presentation Model Slide Portrait
This is a area chart ppt powerpoint presentation model slide portrait. This is a two stage process. The stages in this process are area chart, financial, business, marketing, planning, strategy.

Column Chart Ppt PowerPoint Presentation Background Images
This is a column chart ppt powerpoint presentation background images. This is a two stage process. The stages in this process are column chart, financial, business, marketing, planning, strategy.
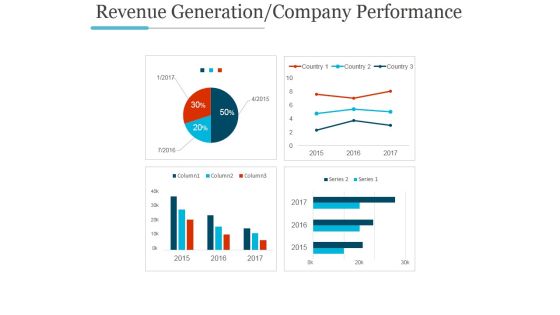
Revenue Generation Company Performance Ppt PowerPoint Presentation Inspiration
This is a revenue generation company performance ppt powerpoint presentation inspiration. This is a four stage process. The stages in this process are graph, growth, success, business, marketing.

Competitor Revenue And Profit Ppt PowerPoint Presentation Slides Objects
This is a competitor revenue and profit ppt powerpoint presentation slides objects. This is a five stage process. The stages in this process are business, marketing, graph, finance, revenue.

Revenue Split By Product Segment Ppt PowerPoint Presentation Ideas Graphics
This is a revenue split by product segment ppt powerpoint presentation ideas graphics. This is a four stage process. The stages in this process are business, marketing, bar graph, success.

Competitor Revenue And Profit Ppt PowerPoint Presentation Outline Elements
This is a competitor revenue and profit ppt powerpoint presentation outline elements. This is a five stage process. The stages in this process are bar graph, marketing, strategy, finance, planning.

Competitor Revenue And Profit Ppt PowerPoint Presentation Professional Graphics Pictures
This is a competitor revenue and profit ppt powerpoint presentation professional graphics pictures. This is a five stage process. The stages in this process are business, marketing, strategy, graph, finance.

Quarter Wise Gross Margin Improvement Chart Ppt Slide
This is a quarter wise gross margin improvement chart ppt slide. This is a two stage process. The stages in this process are graph, business, growth, marketing.
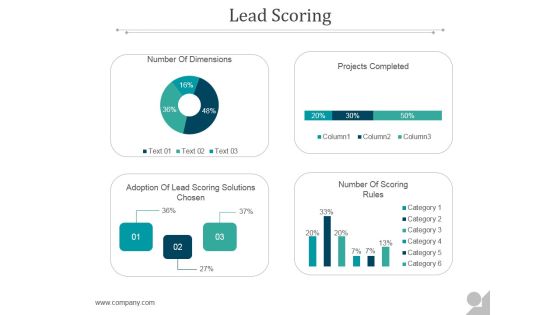
Lead Scoring Ppt PowerPoint Presentation Layouts
This is a lead scoring ppt powerpoint presentation layouts. This is a four stage process. The stages in this process are lead, business, bar graph, marketing, management.

Gross Margin Improvement Ppt PowerPoint Presentation Layout
This is a gross margin improvement ppt powerpoint presentation layout. This is a two stage process. The stages in this process are chart, bar graph, success, growth, marketing.

Column Chart Ppt PowerPoint Presentation Slide Download
This is a column chart ppt powerpoint presentation slide download. This is a two stage process. The stages in this process are business, marketing, graph, success, growth.

Clustered Bar Ppt PowerPoint Presentation Inspiration
This is a clustered bar ppt powerpoint presentation inspiration. This is a five stage process. The stages in this process are bar graph, business, marketing, finance, percentage.

Clustered Column Ppt PowerPoint Presentation Infographic Template
This is a clustered column ppt powerpoint presentation infographic template. This is a two stage process. The stages in this process are finance, percentage, bar graph, business, marketing.

Clustered Bar Ppt PowerPoint Presentation Slide Download
This is a clustered bar ppt powerpoint presentation slide download. This is a four stage process. The stages in this process are bar, graph, business, marketing, strategy.
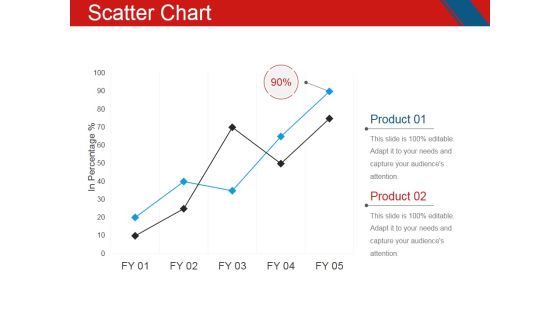
Scatter Chart Ppt PowerPoint Presentation Portfolio Ideas
This is a scatter chart ppt powerpoint presentation portfolio ideas. This is a two stage process. The stages in this process are scatter chart, business, marketing, finance, graph.

Combo Chart Ppt PowerPoint Presentation Infographics Slideshow
This is a combo chart ppt powerpoint presentation infographics slideshow. This is a three stage process. The stages in this process are business, marketing, graph, line chart, growth.

Column Chart Ppt PowerPoint Presentation Summary Introduction
This is a column chart ppt powerpoint presentation summary introduction. This is a two stage process. The stages in this process are business, marketing, bar, graph, finance.
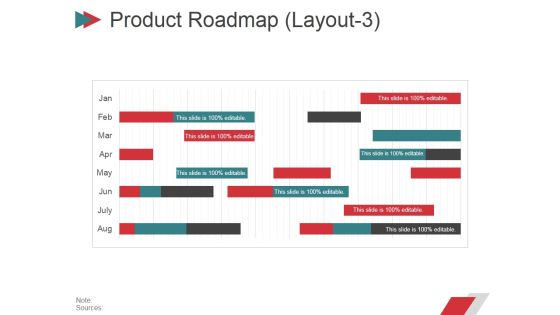
Product Roadmap Layout3 Ppt PowerPoint Presentation Portfolio Mockup
This is a product roadmap layout3 ppt powerpoint presentation portfolio mockup. This is a four stage process. The stages in this process are business, marketing, graph, finance, planning.
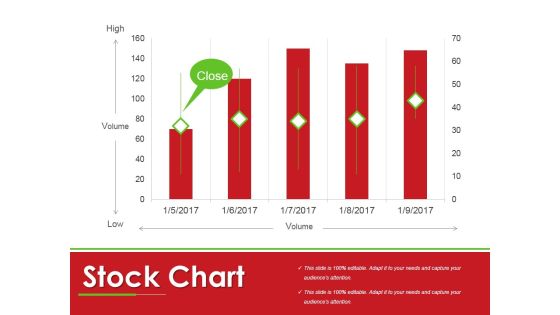
Stock Chart Ppt PowerPoint Presentation Professional Backgrounds
This is a stock chart ppt powerpoint presentation professional backgrounds. This is a five stage process. The stages in this process are business, marketing, graph, management, planning.
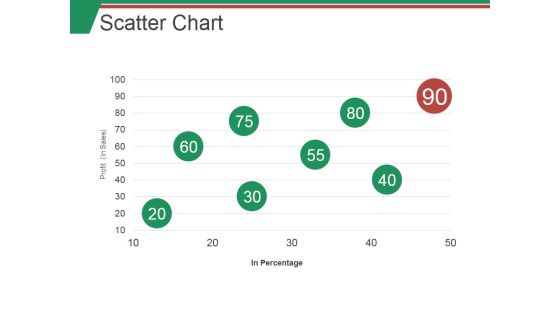
Scatter Chart Ppt PowerPoint Presentation Model Themes
This is a scatter chart ppt powerpoint presentation model themes. This is a eight stage process. The stages in this process are business, scatter, bubble, graph, marketing.
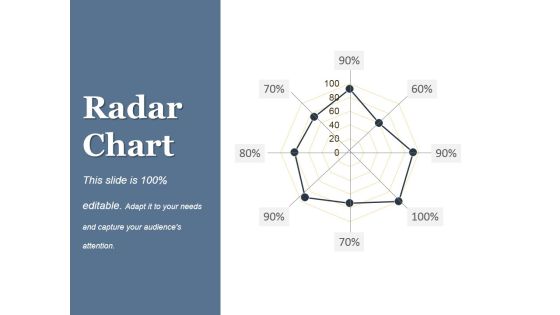
Radar Chart Ppt PowerPoint Presentation Gallery Design Ideas
This is a radar chart ppt powerpoint presentation gallery design ideas. This is a eight stage process. The stages in this process are business, marketing, strategy, planning, graph.

Bar Chart Ppt PowerPoint Presentation Visual Aids Files
This is a bar chart ppt powerpoint presentation visual aids files. This is a seven stage process. The stages in this process are bar, graph, finance, business, marketing.

Column Chart Ppt PowerPoint Presentation Gallery
This is a column chart ppt powerpoint presentation gallery. This is a six stage process. The stages in this process are business, finance, years, product, graph.

Competitor Positioning Ppt PowerPoint Presentation Styles Aids
This is a competitor positioning ppt powerpoint presentation styles aids. This is a two stage process. The stages in this process are company growth, business, percentage, finance, graph.
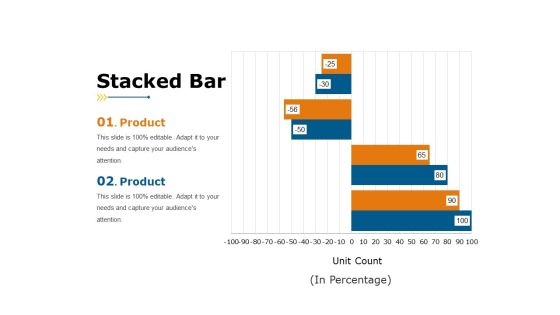
Stacked Bar Ppt PowerPoint Presentation File Sample
This is a stacked bar ppt powerpoint presentation file sample. This is a two stage process. The stages in this process are in percentage, finance, business, marketing, graph.

Clustered Bar Ppt PowerPoint Presentation Styles Elements
This is a clustered bar ppt powerpoint presentation styles elements. This is a three stage process. The stages in this process are product, business, marketing finance, graph.

Sales Forecasting Template 2 Ppt PowerPoint Presentation Diagram Ppt
This is a sales forecasting template 2 ppt powerpoint presentation diagram ppt. This is a tweleve stage process. The stages in this process are finance, marketing, graph, business.
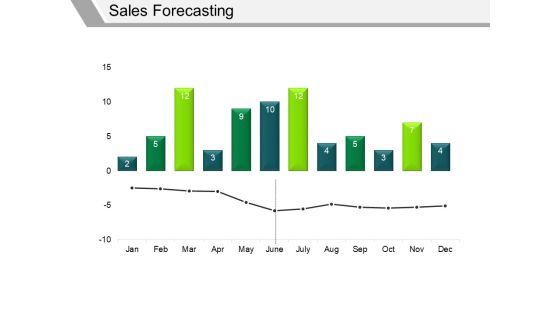
Sales Forecasting Template 2 Ppt PowerPoint Presentation File Graphics
This is a sales forecasting template 2 ppt powerpoint presentation file graphics. This is a two stage process. The stages in this process are finance, marketing, graph, business.

Bar Chart Ppt PowerPoint Presentation Pictures Inspiration
This is a bar chart ppt powerpoint presentation pictures inspiration. This is a seven stage process. The stages in this process are in percentage, business, marketing, finance, graph.

Bar Chart Ppt PowerPoint Presentation Show Example File
This is a bar chart ppt powerpoint presentation show example file. This is a two stage process. The stages in this process are product, business, marketing, graph, percentage.

Clustered Bar Ppt PowerPoint Presentation Outline Model
This is a clustered bar ppt powerpoint presentation outline model. This is a five stage process. The stages in this process are years, business, marketing, graph, finance.

Column Chart Ppt PowerPoint Presentation Inspiration Deck
This is a column chart ppt powerpoint presentation inspiration deck. This is a two stage process. The stages in this process are years, business, marketing, graph, finance, product.
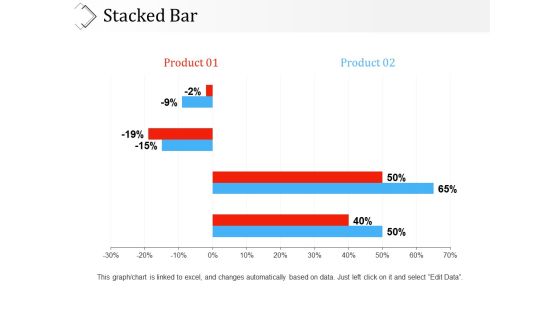
Stacked Bar Ppt PowerPoint Presentation Infographic Template Clipart
This is a stacked bar ppt powerpoint presentation infographic template clipart. This is a two stage process. The stages in this process are product, percentage, business, marketing, graph.

Radar Chart Ppt PowerPoint Presentation Styles Guide
This is a radar chart ppt powerpoint presentation styles guide. This is a two stage process. The stages in this process are product, graph, business, marketing, finance.

Stacked Bar Ppt PowerPoint Presentation Summary Infographics
This is a stacked bar ppt powerpoint presentation summary infographics. This is a four stage process. The stages in this process are product, unit count, business, marketing, graph.
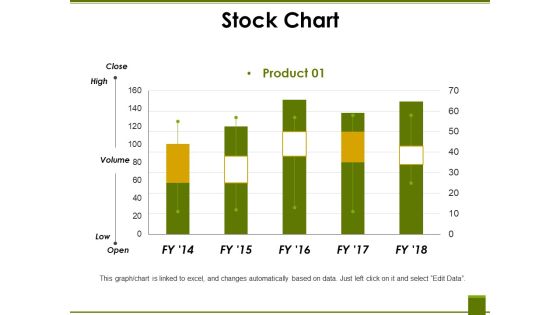
Stock Chart Ppt PowerPoint Presentation Summary Pictures
This is a stock chart ppt powerpoint presentation summary pictures. This is a five stage process. The stages in this process are high, volume, low, product, graph.

Forecast Accuracy Ppt PowerPoint Presentation Professional Graphics Template
This is a forecast accuracy ppt powerpoint presentation professional graphics template. This is a four stage process. The stages in this process are business, marketing, strategy, graph, planning.
 Home
Home