Financial Graphs
Sales KPI Tracker Ppt PowerPoint Presentation Icon Themes
This is a sales kpi tracker ppt powerpoint presentation icon themes. This is a six stage process. The stages in this process are business, marketing, opportunities won, top products in revenue, leads created.
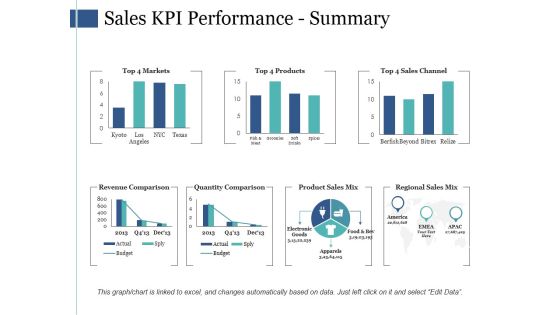
Sales Kpi Performance Summary Ppt PowerPoint Presentation Infographic Template Infographics
This is a sales kpi performance summary ppt powerpoint presentation infographic template infographics. This is a seven stage process. The stages in this process are revenue comparison, quantity comparison, product sales mix, regional sales mix.
Sales Kpi Tracker Ppt PowerPoint Presentation Visual Aids Files
This is a sales kpi tracker ppt powerpoint presentation visual aids files. This is a six stage process. The stages in this process are leads created, sales ratio, opportunities won, top products in revenue, open deals vs last yr.

Competitor Analysis Ppt PowerPoint Presentation Model Visual Aids
This is a competitor analysis ppt powerpoint presentation model visual aids. This is a four stage process. The stages in this process are competitor analysis, revenue, sales, sales development, performance indicators.

Sales Kpi Performance Summary Ppt PowerPoint Presentation Ideas Graphics Template
This is a sales kpi performance summary ppt powerpoint presentation ideas graphics template. This is a seven stage process. The stages in this process are revenue comparison, quantity comparison, product sales mix, regional sales mix.
Sales Kpi Tracker Ppt PowerPoint Presentation Pictures Designs
This is a sales kpi tracker ppt powerpoint presentation pictures designs. This is a two stage process. The stages in this process are leads created, sales ratio, opportunities won, top products in revenue, win ratio vs last yr.

Competitor Analysis Ppt PowerPoint Presentation Layouts Slides
This is a competitor analysis ppt powerpoint presentation layouts slides. This is a four stage process. The stages in this process are sales development, performance indicators, sales development of industry, revenue sales.

Competitor Analysis Ppt PowerPoint Presentation Model Show
This is a competitor analysis ppt powerpoint presentation model show. This is a four stage process. The stages in this process are performance indicators, sales development of industry, sales development, revenue, sales.
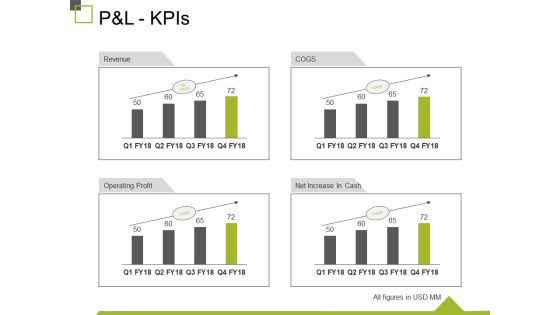
P And L Kpis Ppt PowerPoint Presentation Show Design Inspiration
This is a p and l kpis ppt powerpoint presentation show design inspiration. This is a four stage process. The stages in this process are revenue, operating profit, cogs, net increase in cash, business.
P And L Kpis Template 2 Ppt PowerPoint Presentation Summary Icon
This is a p and l kpis template 2 ppt powerpoint presentation summary icon. This is a four stage process. The stages in this process are revenue, cogs, operating profit, net profit.

Pandl Kpis Tabular Form Ppt PowerPoint Presentation Pictures Visual Aids
This is a pandl kpis tabular form ppt powerpoint presentation pictures visual aids. This is a four stage process. The stages in this process are revenue, operating profit, cogs, net profit.

Competitor Analysis Ppt PowerPoint Presentation Outline Ideas
This is a competitor analysis ppt powerpoint presentation outline ideas. This is a four stage process. The stages in this process are sales development of industry, revenue, sales, performance indicators.

Competitor Analysis Ppt PowerPoint Presentation File Mockup
This is a competitor analysis ppt powerpoint presentation file mockup. This is a four stage process. The stages in this process are sales development of industry, revenue, performance indicators, sales development.

Competitor Analysis Ppt PowerPoint Presentation Layouts Slideshow
This is a competitor analysis ppt powerpoint presentation layouts slideshow. This is a four stage process. The stages in this process are sales development of industry, performance indicators, sales development, revenue, sales.

Competitor Analysis Ppt PowerPoint Presentation Visual Aids Model
This is a competitor analysis ppt powerpoint presentation visual aids model. This is a four stage process. The stages in this process are sales development of industry, performance indicators, sales development, revenue sales, business.
Pandl Kpis Template Ppt PowerPoint Presentation Model Icon
This is a pandl kpis template ppt powerpoint presentation model icon. This is a four stage process. The stages in this process are revenue, cogs, operating profit, net profit.
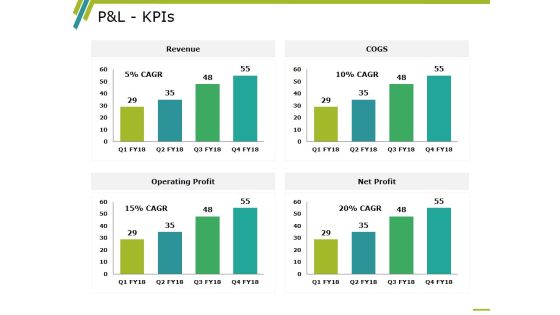
P And L Kpis Template 2 Ppt PowerPoint Presentation Professional Information
This is a p and l kpis template 2 ppt powerpoint presentation professional information. This is a four stage process. The stages in this process are revenue, operating profit, cogs, net profit, business.
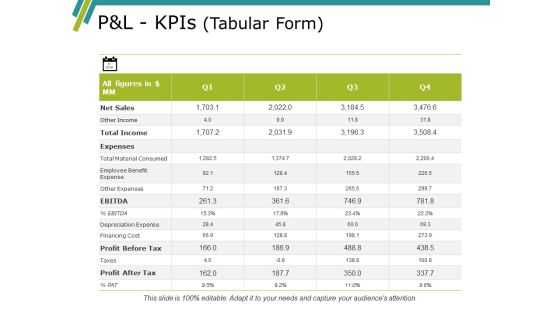
Pandl Kpis Template Ppt PowerPoint Presentation Gallery Summary
This is a pandl kpis template ppt powerpoint presentation gallery summary. This is a four stage process. The stages in this process are revenue, cogs, operating profit, net profit.
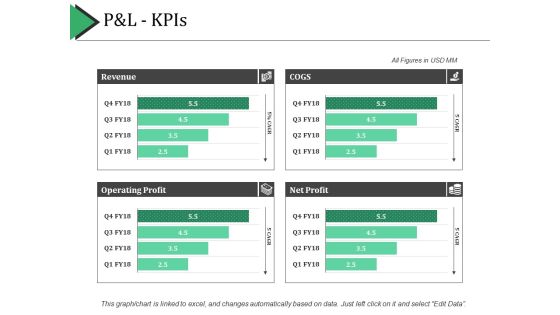
P And L Kpis Ppt PowerPoint Presentation Show Example Introduction
This is a p and l kpis ppt powerpoint presentation show example introduction. This is a four stage process. The stages in this process are revenue, cogs, net profit, operating profit.

Pandl Kpis Ppt PowerPoint Presentation Professional Backgrounds
This is a pandl kpis ppt powerpoint presentation professional backgrounds. This is a four stage process. The stages in this process are business, revenue, operating profit, cogs, net profit.
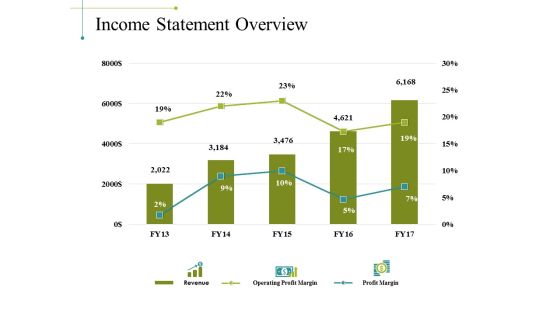
Income Statement Overview Ppt PowerPoint Presentation File Objects
This is a income statement overview ppt powerpoint presentation file objects. This is a three stage process. The stages in this process are business, market revenue, operating profit margin, profit margin.
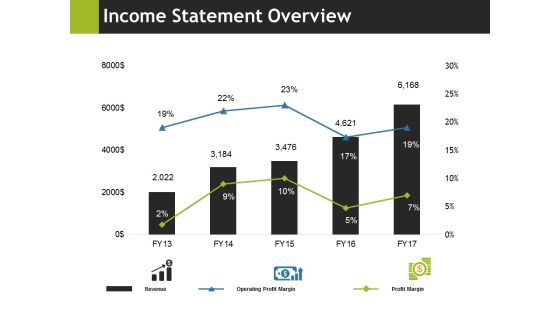
Income Statement Overview Ppt PowerPoint Presentation Professional Portfolio
This is a income statement overview ppt powerpoint presentation professional portfolio. This is a five stage process. The stages in this process are business, marketing, revenue, operating profit margin, profit margin.

Income Statement Graphical Representation Ppt PowerPoint Presentation Pictures Design Templates
This is a income statement graphical representation ppt powerpoint presentation pictures design templates. This is a four stage process. The stages in this process are revenue, operating profit, net profit, cogs, business.
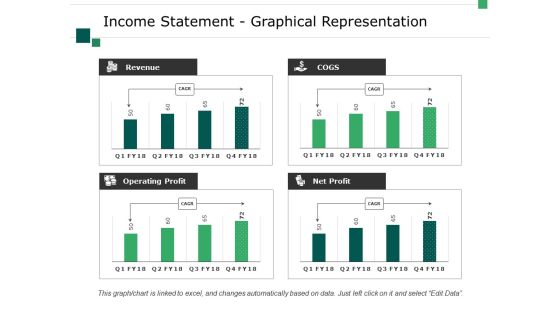
Income Statement Graphical Representation Ppt PowerPoint Presentation Visual Aids Layouts
This is a income statement graphical representation ppt powerpoint presentation visual aids layouts. This is a four stage process. The stages in this process are business, marketing, revenue, operating profit, net profit, cogs.
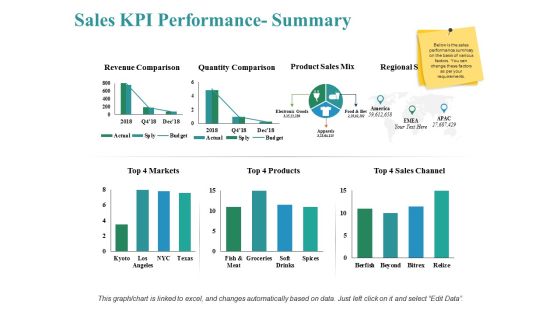
Sales Kpi Performance Summary Ppt PowerPoint Presentation Show Themes
This is a sales kpi performance summary ppt powerpoint presentation show themes. This is a three stage process. The stages in this process are revenue comparison, quantity comparison, product sales mix, markets, sales channel.
Sales Kpi Tracker Ppt PowerPoint Presentation Pictures Layout Ideas
This is a sales kpi tracker ppt powerpoint presentation pictures layout ideas. This is a four stage process. The stages in this process are opportunities won, top products in revenue, leads created, win ratio vs last yr, open deals vs.
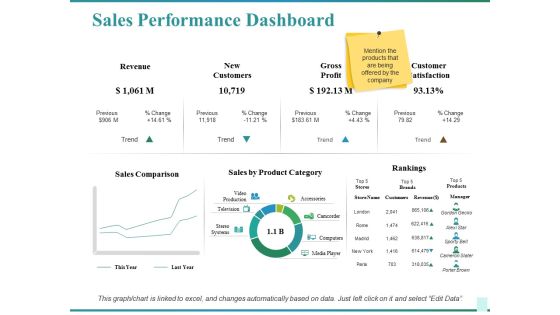
Sales Performance Dashboard Ppt PowerPoint Presentation Show Graphics Design
This is a sales performance dashboard ppt powerpoint presentation show graphics design. This is a two stage process. The stages in this process are sales comparison, sales by product category, rankings, customer satisfaction, revenue.
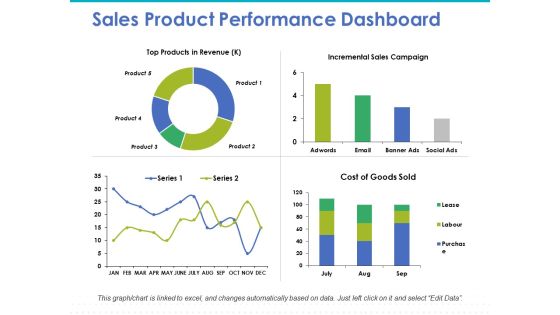
Sales Product Performance Dashboard Ppt PowerPoint Presentation Model Graphics Design
This is a sales product performance dashboard ppt powerpoint presentation model graphics design. This is a four stage process. The stages in this process are top products in revenue, incremental sales, cost of goods.

Sales Performance Dashboard Template Ppt PowerPoint Presentation Professional Elements
This is a sales performance dashboard template ppt powerpoint presentation professional elements. This is a eight stage process. The stages in this process are sales comparison, sales by product category, sales by month, brand profitability, revenue.

Cost And Benefits Of New Product Ppt PowerPoint Presentation Inspiration Diagrams
This is a cost and benefits of new product ppt powerpoint presentation inspiration diagrams. This is a three stage process. The stages in this process are recurrent costs, cost decreasing, revenue increasing, benefits, costs.

how much money we need ppt powerpoint presentation inspiration master slide
This is a how much money we need ppt powerpoint presentation inspiration master slide. This is a two stage process. The stages in this process are how will we spend the money, how much have we raised, how much are we raising, production, marketing.
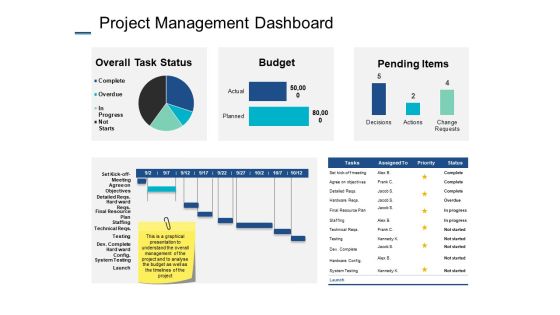
Project Management Dashboard Ppt PowerPoint Presentation Professional Images
This is a project management dashboard ppt powerpoint presentation professional images. This is a four stage process. The stages in this process are budget, finance, analysis, business, investment.

Equity Capital Markets Ppt PowerPoint Presentation Outline Picture Cpb
This is a equity capital markets ppt powerpoint presentation outline picture cpb. This is a two stage process. The stages in this process are equity capital markets.

Capital Expenditure Details Fy 18 Ppt PowerPoint Presentation Diagram Images
This is a capital expenditure details fy 18 ppt powerpoint presentation diagram images. This is a six stage process. The stages in this process are business, finance, analysis, strategy, marketing.

Project Management Dashboard Ppt PowerPoint Presentation Portfolio Portrait
This is a project management dashboard ppt powerpoint presentation portfolio portrait. This is a five stage process. The stages in this process are overall task status, assigned to, budget, pending items, business.
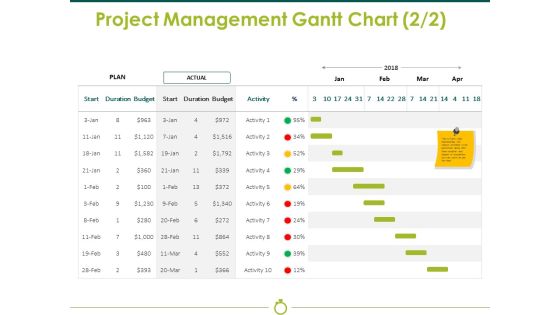
Project Management Gantt Chart Template 2 Ppt PowerPoint Presentation Show Styles
This is a project management gantt chart template 2 ppt powerpoint presentation show styles. This is a two stage process. The stages in this process are plan, actual, budget, duration, start.
Sales Activities Dashboard Ppt PowerPoint Presentation Icon Graphics
This is a sales activities dashboard ppt powerpoint presentation icon graphics. This is a two stage process. The stages in this process are business, finance, management, analysis, budget, actual.

Project Management Dashboard Ppt PowerPoint Presentation Portfolio Objects
This is a project management dashboard ppt powerpoint presentation portfolio objects. This is a three stage process. The stages in this process are complete, overdue, overall task status, budget, pending items.
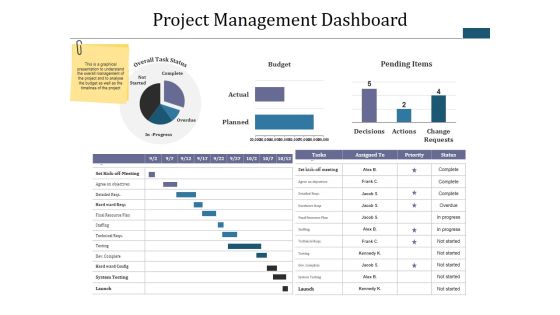
Project Management Dashboard Ppt PowerPoint Presentation Infographic Template Diagrams
This is a project management dashboard ppt powerpoint presentation infographic template diagrams. This is a three stage process. The stages in this process are budget, pending items, complete, overdue, not started.

Customer Satisfaction Template 1 Ppt PowerPoint Presentation Portfolio Graphics Example
This is a customer satisfaction template 1 ppt powerpoint presentation portfolio graphics example. This is a three stage process. The stages in this process are overall satisfaction with service, satisfaction with value for money, overall satisfaction with relationship, key performance indicators, business, percentage.
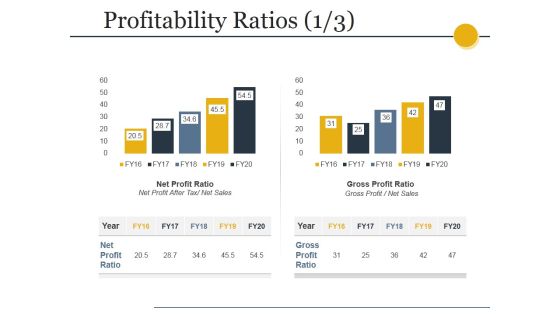
Profitability Ratios Template 1 Ppt PowerPoint Presentation Slides Inspiration
This is a profitability ratios template 1 ppt powerpoint presentation slides inspiration. This is a two stage process. The stages in this process are net profit ratio, net profit after tax net sales, gross profit ratio, gross profit net sales.

Business Percentage Ratio Circle Chart Powerpoint Slides
This PowerPoint template contains design of circle chart with team icon and percentage ratios. You may download this slide to display steps for strategic growth planning. You can easily customize this template to make it more unique as per your need.
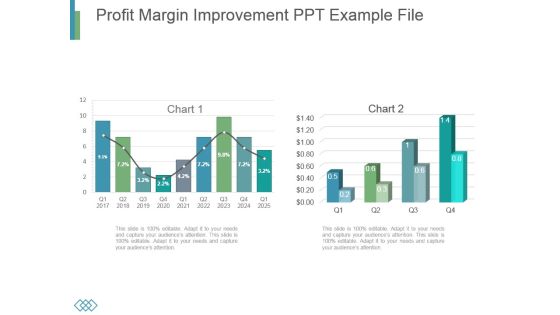
Profit Margin Improvement Ppt Example File
This is a profit margin improvement ppt example file. This is a two stage process. The stages in this process are business, marketing, growth, timeline, analysis.

Changes In Current Business Structure Ppt Example
This is a changes in current business structure ppt example. This is a four stage process. The stages in this process are engagement, monthly, weekly, brand.

Identifying Market Trends Current Number Ppt PowerPoint Presentation Slides
This is a identifying market trends current number ppt powerpoint presentation slides. This is a seven stage process. The stages in this process are latin america, canada, japan, europe, asia pacific, us.

Content Marketing Performance Evaluation Ppt PowerPoint Presentation Influencers
This is a content marketing performance evaluation ppt powerpoint presentation influencers. This is a eight stage process. The stages in this process are brand awareness, engagement, sales, lead generation, customer retention, lead nurturing.

Social Media Marketing Performance Evaluation Ppt PowerPoint Presentation Guidelines
This is a social media marketing performance evaluation ppt powerpoint presentation guidelines. This is a four stage process. The stages in this process are social event april, facebook, twitter, social media, google, you tube.

Website Performance Analytics Ppt PowerPoint Presentation Show
This is a website performance analytics ppt powerpoint presentation show. This is a three stage process. The stages in this process are conversion rate, visits, average visit value goal, return on investment ric, total visits, cost.

Agency Performance Ppt PowerPoint Presentation Model
This is a agency performance ppt powerpoint presentation model. This is a four stage process. The stages in this process are brand safety, ad fraud, tra score, view ability.

Project Heath Card Ppt PowerPoint Presentation Deck
This is a project heath card ppt powerpoint presentation deck. This is a four stage process. The stages in this process are business, finance, analysis, marketing, analysis.

Demand Forecasting Ppt PowerPoint Presentation Guidelines
This is a demand forecasting ppt powerpoint presentation guidelines. This is a one stage process. The stages in this process are dynamic demand, trend, stable demand, demand quantity.

Demand Forecasting Template 1 Ppt PowerPoint Presentation Show
This is a demand forecasting template 1 ppt powerpoint presentation show. This is a nine stage process. The stages in this process are trends, base forecast, seasonality factors, qualitative input.

Hiring Plan Ppt PowerPoint Presentation Graphics
This is a hiring plan ppt powerpoint presentation graphics. This is a five stage process. The stages in this process are finance, support, product, marketing, sales, engineering .
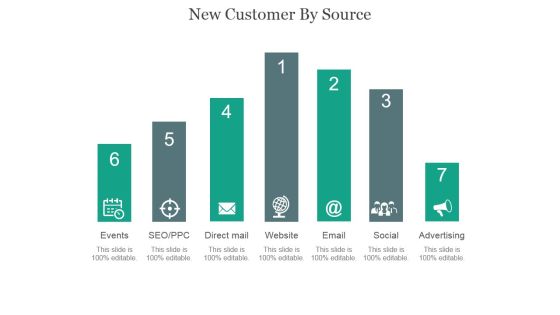
New Customer By Source Ppt PowerPoint Presentation Example 2015
This is a new customer by source ppt powerpoint presentation example 2015. This is a seven stage process. The stages in this process are events, seo ppc, direct mail, website, email, social, advertising.

Sales Performance Reporting Ppt PowerPoint Presentation Model
This is a sales performance reporting ppt powerpoint presentation model. This is a six stage process. The stages in this process are top opportunities, sales goal ytd, sales funnel, top sales reps, top selling plans, new customers.

Website Performance Review Ppt PowerPoint Presentation Background Images
This is a website performance review ppt powerpoint presentation background images. This is a three stage process. The stages in this process are online transaction, conversion rate, organic branded, traffic source, site consumption time.
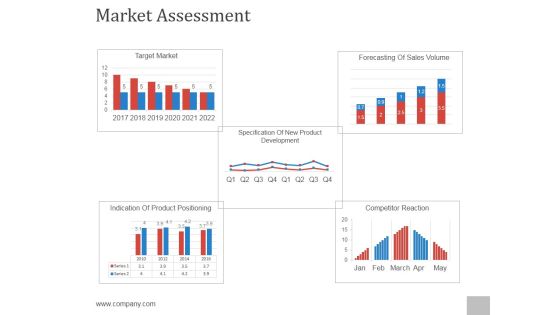
Market Assessment Ppt PowerPoint Presentation Files
This is a market assessment ppt powerpoint presentation files. This is a five stage process. The stages in this process are target market, forecasting of sales volume, indication of product positioning, competitor reaction, specification of new product development.

Operating Excellence Ppt PowerPoint Presentation Show
This is a operating excellence ppt powerpoint presentation show. This is a four stage process. The stages in this process are capacity utilization, cash flow, operating income, operating expenses.

Pie Chart Ppt PowerPoint Presentation Template
This is a pie chart ppt powerpoint presentation template. This is a three stage process. The stages in this process are business, strategy, marketing, analysis, finance.

Area Chart Ppt PowerPoint Presentation Summary
This is a area chart ppt powerpoint presentation summary. This is a two stage process. The stages in this process are business, marketing, finance, timeline, product.
 Home
Home