Financial Graphs
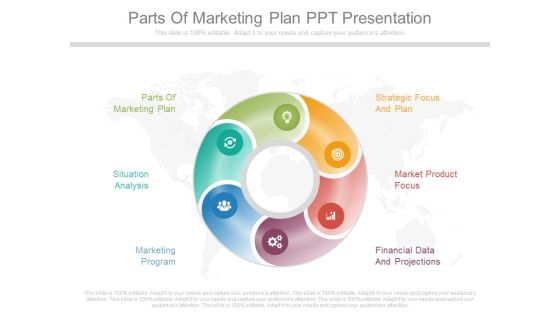
Parts Of Marketing Plan Ppt Presentation
This is a parts of marketing plan ppt presentation. This is a six stage process. The stages in this process are parts of marketing plan, strategic focus and plan, situation analysis, market product focus, marketing program, financial data and projections.
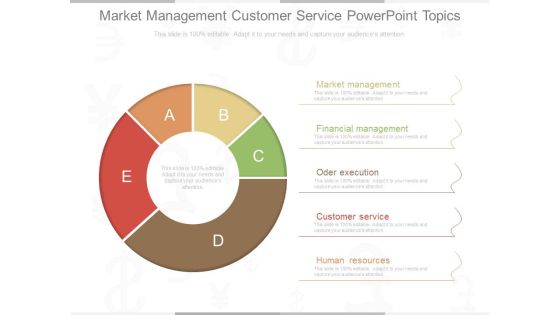
Market Management Customer Service Powerpoint Topics
This is a market management customer service powerpoint topics. This is a five stage process. The stages in this process are market management, financial management, oder execution, customer service, human resources.

Internal Business Environment Template Ppt Example
This is an internal business environment template ppt example. This is a six stage process. The stages in this process are plans and policies, human resources, financial resources, corporate image, plant and machinery, lab our management.

Corporate Structuring Diagram Presentation Backgrounds
This is a corporate structuring diagram presentation backgrounds. This is a three stage process. The stages in this process are shareholders, board of directors, chief executive officer, chairman, chief operating officer, chief financial officer.
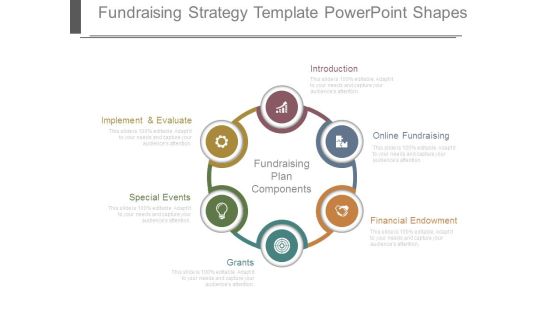
Fundraising Strategy Template Powerpoint Shapes
This is a fundraising strategy template powerpoint shapes. This is a six stage process. The stages in this process are implement and evaluate, special events, grants, introduction, online fundraising, financial endowment, fundraising plan components.

Area Chart Ppt PowerPoint Presentation Layouts Vector
This is a area chart ppt powerpoint presentation layouts vector. This is a two stage process. The stages in this process are area chart, product, sales in percentage, financial year.
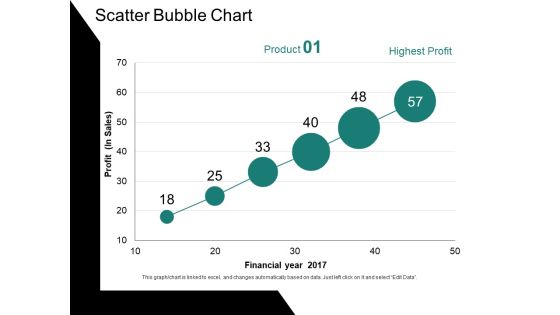
Scatter Bubble Chart Ppt PowerPoint Presentation Ideas Gallery
This is a scatter bubble chart ppt powerpoint presentation ideas gallery. This is a six stage process. The stages in this process are profit, financial year, chart, business, growth.

Column Chart Ppt PowerPoint Presentation Slides Smartart
This is a column chart ppt powerpoint presentation slides smartart. This is a two stage process. The stages in this process are sales in percentage, financial year in, business, growth, strategy.
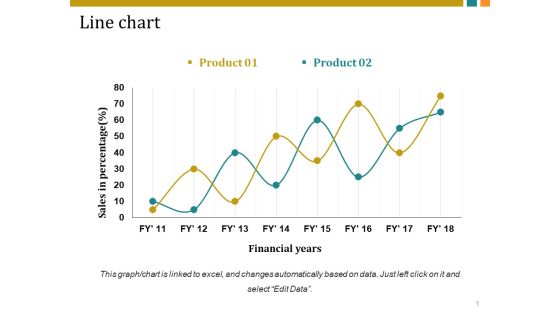
Line Chart Ppt PowerPoint Presentation Inspiration Vector
This is a line chart ppt powerpoint presentation inspiration vector. This is a two stage process. The stages in this process are sales in percentage, financial years, business, marketing, growth.

Line Chart Ppt PowerPoint Presentation Infographics Graphic Images
This is a line chart ppt powerpoint presentation infographics graphic images. This is a two stage process. The stages in this process are sales in percentage, financial years, growth, business, marketing.

Line Chart Ppt PowerPoint Presentation Professional Graphics Design
This is a line chart ppt powerpoint presentation professional graphics design. This is a two stage process. The stages in this process are financial years, sales in percentage, product, growth, success.

Line Chart Ppt PowerPoint Presentation Pictures Templates
This is a line chart ppt powerpoint presentation pictures templates. This is a two stage process. The stages in this process are sales in percentage, financial years, business, marketing, growth.

Executive Summary Ppt PowerPoint Presentation Model Show
This is a executive summary ppt powerpoint presentation model show. This is a five stage process. The stages in this process are background, capabilities, accreditation, promoters and shareholding, financial highlights.

Line Chart Ppt PowerPoint Presentation Styles Themes
This is a line chart ppt powerpoint presentation styles themes. This is a two stage process. The stages in this process are business, marketing, financial years, sales in percentage.

Column Chart Ppt PowerPoint Presentation Ideas Vector
This is a column chart ppt powerpoint presentation ideas vector. This is a two stage process. The stages in this process are column chart, product, financial years, sales in percentage, growth.
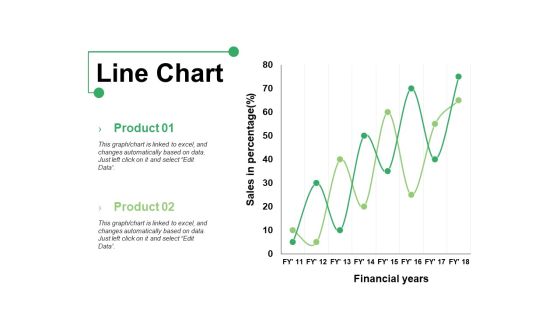
Line Chart Ppt PowerPoint Presentation Show Graphics Example
This is a line chart ppt powerpoint presentation show graphics example. This is a two stage process. The stages in this process are product, line chart, financial years, sales in percentage.

Line Chart Ppt PowerPoint Presentation Professional Grid
This is a line chart ppt powerpoint presentation professional grid. This is a two stage process. The stages in this process are sales in percentage, financial years, product, line chart.
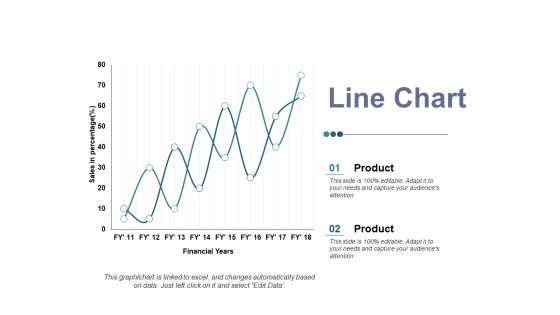
Line Chart Ppt PowerPoint Presentation Ideas Elements
This is a line chart ppt powerpoint presentation ideas elements. This is a two stage process. The stages in this process are product, sales in percentage, financial year, business, line chart.

Line Chart Ppt PowerPoint Presentation Infographic Template Master Slide
This is a line chart ppt powerpoint presentation infographic template master slide. This is a two stage process. The stages in this process are product, financial years, sales in percentage.

Area Chart Ppt PowerPoint Presentation Icon Summary
This is a area chart ppt powerpoint presentation icon summary. This is a two stage process. The stages in this process are financial year, area chart, in percentage, product.

Area Stacked Ppt PowerPoint Presentation Infographics Shapes
This is a area stacked ppt powerpoint presentation infographics shapes. This is a two stage process. The stages in this process are product, area stacked, sales in percentage, financial year.
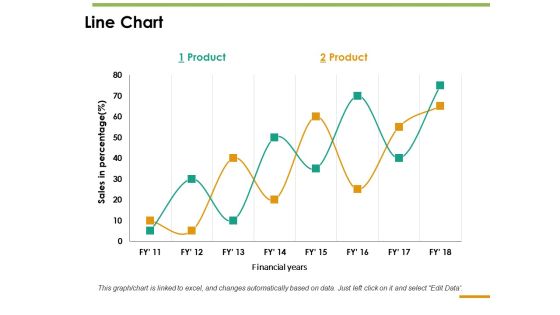
Line Chart Ppt PowerPoint Presentation Inspiration Guide
This is a line chart ppt powerpoint presentation inspiration guide. This is a two stage process. The stages in this process are line chart, sales in percentage, product, financial years.

Column Chart Ppt PowerPoint Presentation Portfolio Example Topics
This is a column chart ppt powerpoint presentation portfolio example topics. This is a two stage process. The stages in this process are product, financial year, sales in percentage, column chart.
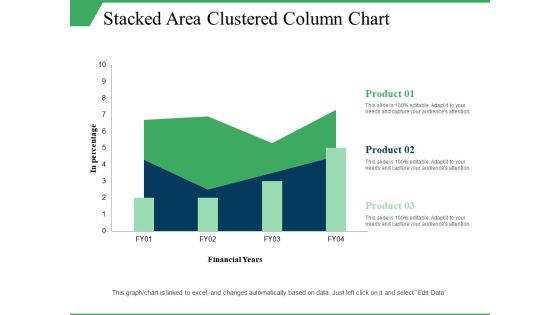
Stacked Area Clustered Column Chart Ppt PowerPoint Presentation Visual Aids Model
This is a stacked area clustered column chart ppt powerpoint presentation visual aids model. This is a three stage process. The stages in this process are in percentage, product, financial years, growth, column chart.

Combo Chart Ppt PowerPoint Presentation Slides Outline
This is a combo chart ppt powerpoint presentation slides outline. This is a three stage process. The stages in this process are combo chart, growth, product, financial year, business.

Accounting Department Organizational Chart Ppt PowerPoint Presentation Pictures Graphics
Presenting this set of slides with name accounting department organizational chart ppt powerpoint presentation pictures graphics. This is a five stage process. The stages in this process are board of directors, chief executive officer, vice presidents, chief financial officer, controller, treasurer, internal auditor, managerial accountant, financial accountant, tax accountant. This is a completely editable PowerPoint presentation and is available for immediate download. Download now and impress your audience.

Multiple Phases For Supply Chain Management Performance Measures Themes PDF
This is a multiple phases for supply chain management performance measures themes pdf template with various stages. Focus and dispense information on two stages using this creative set, that comes with editable features. It contains large content boxes to add your information on topics like non financial measures, financial measures. You can also showcase facts, figures, and other relevant content using this PPT layout. Grab it now.
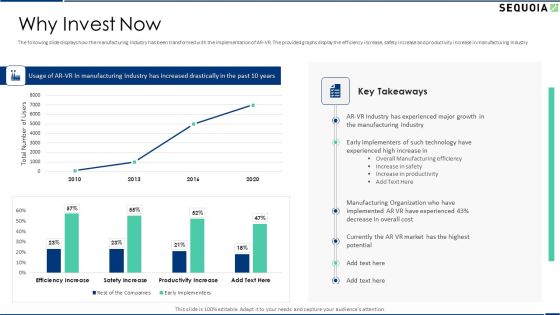
Sequoia Company Capital Raising Elevator Why Invest Now Background PDF
The following slide displays how the manufacturing Industry has been transformed with the implementation of AR VR. The provided graphs display the efficiency increase, safety increase and productivity increase in manufacturing Industry. Deliver an awe inspiring pitch with this creative sequoia company capital raising elevator why invest now background pdf bundle. Topics like implementers, manufacturing, productivity, growth can be discussed with this completely editable template. It is available for immediate download depending on the needs and requirements of the user.

Evaluating Performance Of Subscription Revenue Model Average Ppt Portfolio Elements PDF
Below slide displays key statistical graphs such as total customer, average subscribers, average subscription fee and revenue per customer etc for evaluating performance of subscription revenue model. Deliver an awe inspiring pitch with this creative evaluating performance of subscription revenue model average ppt portfolio elements pdf bundle. Topics like customer, average, revenue can be discussed with this completely editable template. It is available for immediate download depending on the needs and requirements of the user.
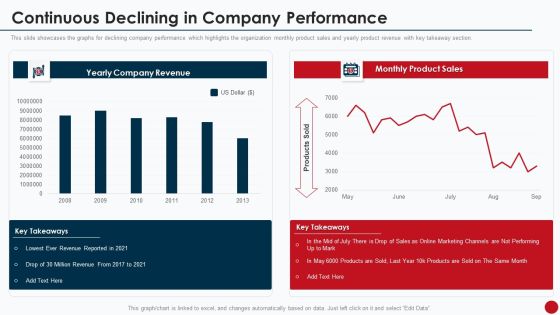
Marketing Manual For Product Promotion On Youtube Channel Continuous Declining In Company Performance Rules PDF
This slide showcases the graphs for declining company performance which highlights the organization monthly product sales and yearly product revenue with key takeaway section.Deliver and pitch your topic in the best possible manner with this Marketing Manual For Product Promotion On Youtube Channel Continuous Declining In Company Performance Rules PDF. Use them to share invaluable insights on Marketing Channels, Revenue Reported, Million Revenue and impress your audience. This template can be altered and modified as per your expectations. So, grab it now.
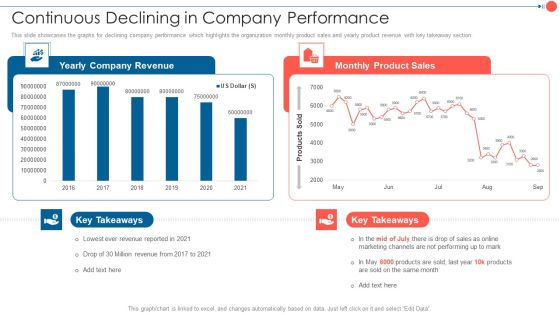
Youtube Advertising Techniques Continuous Declining In Company Performance Slides PDF
This slide showcases the graphs for declining company performance which highlights the organization monthly product sales and yearly product revenue with key takeaway section. Deliver an awe inspiring pitch with this creative Youtube Advertising Techniques Continuous Declining In Company Performance Slides PDF bundle. Topics like Yearly Company Revenue, Monthly Product Sales, 2016 To 2021 can be discussed with this completely editable template. It is available for immediate download depending on the needs and requirements of the user.

Clustered Column Ppt PowerPoint Presentation Icon Design Inspiration
This is a clustered column ppt powerpoint presentation icon design inspiration. This is a two stage process. The stages in this process are product, financial year, sales in percentage, clustered column.

Bar Chart Ppt PowerPoint Presentation Professional Files
This is a bar chart ppt powerpoint presentation professional files. This is a seven stage process. The stages in this process are bar chart, product, sales in percentage, financial years.
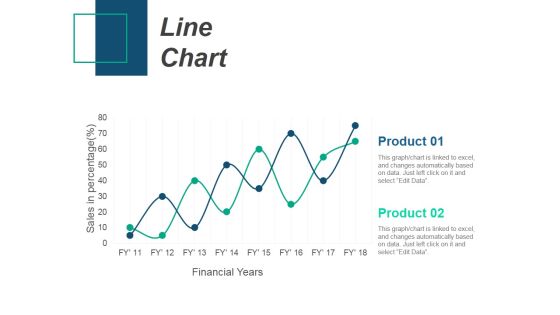
Line Chart Ppt PowerPoint Presentation Infographic Template Introduction
This is a line chart ppt powerpoint presentation infographic template introduction. This is a two stage process. The stages in this process are product, sales in percentage, financial years, line chart.
Line Chart Ppt PowerPoint Presentation Infographic Template Icons
This is a line chart ppt powerpoint presentation infographic template icons. This is a two stage process. The stages in this process are sales in percentage, financial years, product, line chart.
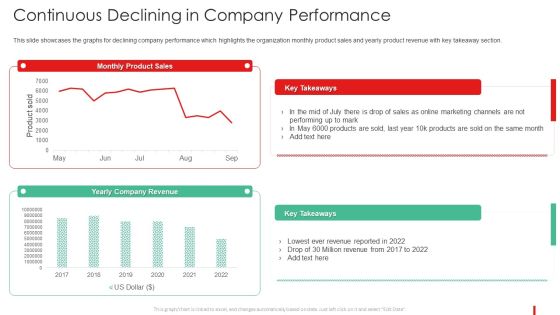
Promotion Guide To Advertise Brand On Youtube Continuous Declining In Company Rules PDF
This slide showcases the graphs for declining company performance which highlights the organization monthly product sales and yearly product revenue with key takeaway section.Deliver and pitch your topic in the best possible manner with this Promotion Guide To Advertise Brand On Youtube Continuous Declining In Company Rules PDF Use them to share invaluable insights on Continuous Declining In Company Performance and impress your audience. This template can be altered and modified as per your expectations. So, grab it now.

Impact Analysis Of Online Retail Strategies On Company Retail Business Growth Marketing Techniques Brochure PDF
The following slide highlights the current scenario of company sales and customer retention rates. It illustrates graphs of last 3 years which shows company sales and net profit margins are declining and existing customer are leaving the company Whether you have daily or monthly meetings, a brilliant presentation is necessary. Impact Analysis Of Online Retail Strategies On Company Retail Business Growth Marketing Techniques Brochure PDF can be your best option for delivering a presentation. Represent everything in detail using Impact Analysis Of Online Retail Strategies On Company Retail Business Growth Marketing Techniques Brochure PDF and make yourself stand out in meetings. The template is versatile and follows a structure that will cater to your requirements. All the templates prepared by Slidegeeks are easy to download and edit. Our research experts have taken care of the corporate themes as well. So, give it a try and see the results.

Methods And Approaches To Assess Liquidity Ratios To Evaluate Company Ability To Pay Short Template PDF
The following slide outlines different liquidity ratios through which financial managers can evaluate the company ability to meet short-term debt. Information covered in this slide is related to current and quick ratio of our company and industry leaders. Presenting this PowerPoint presentation, titled Methods And Approaches To Assess Liquidity Ratios To Evaluate Company Ability To Pay Short Template PDF, with topics curated by our researchers after extensive research. This editable presentation is available for immediate download and provides attractive features when used. Download now and captivate your audience. Presenting this Methods And Approaches To Assess Liquidity Ratios To Evaluate Company Ability To Pay Short Template PDF. Our researchers have carefully researched and created these slides with all aspects taken into consideration. This is a completely customizable Methods And Approaches To Assess Liquidity Ratios To Evaluate Company Ability To Pay Short Template PDF that is available for immediate downloading. Download now and make an impact on your audience. Highlight the attractive features available with our PPTs.

0814 Bargraph Of Dollars Bundles With Arrow Graphic Image Graphics For PowerPoint
This unique image has backdrop of bar graph of dollars bundles with growth arrow. This image displays the concept of financial growth. Define the business growth with this suitable image. Use this image to make outstanding presentations

Table Of Content Template 2 Ppt PowerPoint Presentation Ideas Rules
This is a table of content template 2 ppt powerpoint presentation ideas rules. This is a six stage process. The stages in this process are business overview, financial performance, client and project updates, competitors analysis, future roadmap, csr miscellaneous activities.

Table Of Content Template 3 Ppt PowerPoint Presentation Model Slide
This is a table of content template 3 ppt powerpoint presentation model slide. This is a six stage process. The stages in this process are business overview, financial performance, client and project updates, competitors analysis, future roadmap, csr miscellaneous activities.
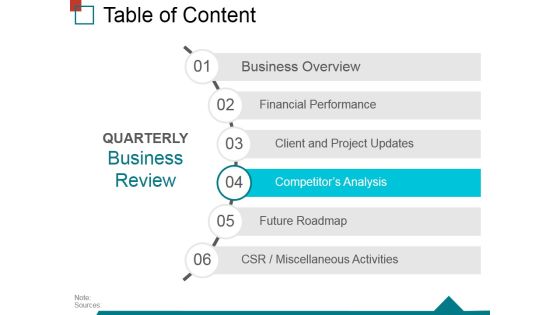
Table Of Content Template 4 Ppt PowerPoint Presentation Layouts Example
This is a table of content template 4 ppt powerpoint presentation layouts example. This is a six stage process. The stages in this process are business overview, financial performance, client and project updates, competitors analysis, future roadmap, csr miscellaneous activities.
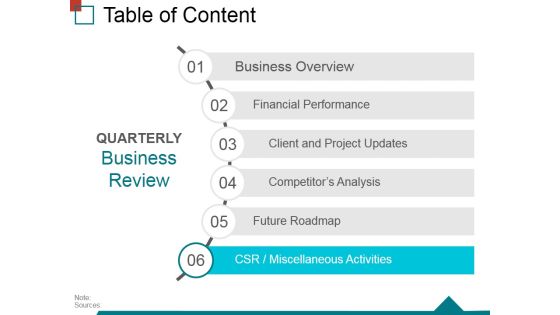
Table Of Content Template 6 Ppt PowerPoint Presentation Inspiration Grid
This is a table of content template 6 ppt powerpoint presentation inspiration grid. This is a six stage process. The stages in this process are business overview, financial performance, client and project updates, competitors analysis, future roadmap, csr miscellaneous activities.

Column Chart Ppt PowerPoint Presentation Gallery Design Inspiration
This is a column chart ppt powerpoint presentation gallery design inspiration. This is a two stage process. The stages in this process are column chart, product, sales in percentage, financial years.

Line Bubble Chart Ppt PowerPoint Presentation Portfolio Slide Portrait
This is a line bubble chart ppt powerpoint presentation portfolio slide portrait. This is a six stage process. The stages in this process are highest profit, financial year, profit in sales, growth, business.
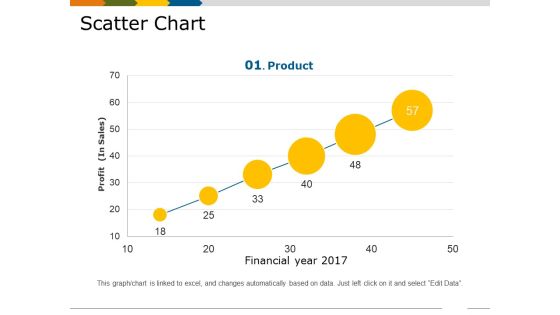
Scatter Chart Template 1 Ppt PowerPoint Presentation Show Slides
This is a scatter chart template 1 ppt powerpoint presentation show slides. This is a six stage process. The stages in this process are financial year, profit in sales, growth, business, marketing, product.

Brief Introduction About The Company Deal Pitchbook IPO Template PDF
The slide provides the brief introduction about the company introducing IPO. key points included are business overview, mission, vision, five years financials revenue, operating and net margin and revenue split by business operations. Deliver an awe inspiring pitch with this creative brief introduction about the company deal pitchbook ipo template pdf bundle. Topics like financial, revenue, insurance, management, services can be discussed with this completely editable template. It is available for immediate download depending on the needs and requirements of the user.
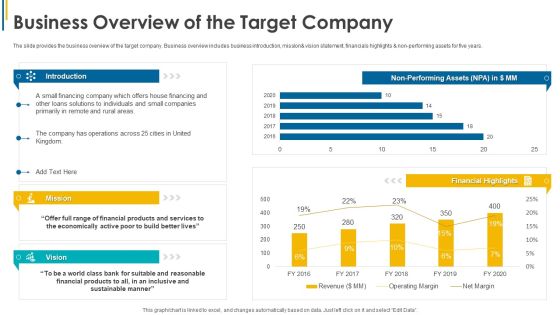
Investors Pitch General Deal Mergers Acquisitions Business Overview Of The Target Company Ideas PDF
The slide provides the business overview of the target company. Business overview includes business introduction, mission and vision statement, financials highlights and non-performing assets for five years. Deliver an awe-inspiring pitch with this creative investors pitch general deal mergers acquisitions business overview of the target company ideas pdf bundle. Topics like vision, mission, financial, non performing assets can be discussed with this completely editable template. It is available for immediate download depending on the needs and requirements of the user.

Relationship Of Forensic Accounting With Criminal Proceeds And Asset Recovery Summary PDF
This slide covers relationship of financial investigations with crime proceeds and assets recovery. It also includes elements such as confiscation, cash seizure, civil or tax recovery, money laundering, forfeiture, etc. Presenting Relationship Of Forensic Accounting With Criminal Proceeds And Asset Recovery Summary PDF to dispense important information. This template comprises six stages. It also presents valuable insights into the topics including Money Laundering, Financial Techniques, Asset Recovery. This is a completely customizable PowerPoint theme that can be put to use immediately. So, download it and address the topic impactfully.

Ppt Team Work Person Presentation Standing Orange Piece Of Chart PowerPoint Templates
PPT team work person presentation standing orange piece of chart PowerPoint Templates-Use this graphical approach to represent global business issues such as financial data, stock market Exchange, increase in sales, corporate presentations and more. Create captivating presentations to deliver comparative and weighted arguments.-PPT team work person presentation standing orange piece of chart PowerPoint Templates-arrow, bar, business, businessman, candidate, cartoon, character, chart, circle, circular, client, communication, company, concept, diagram, finance, financial, flow, growth, human, illustration, increase, information, iteration, man, market, marketing, process, processing, profit, sales, statistics, stats, success, target

Ppt Animate Text PowerPoint 2007 Circles Downward Arrow 6 Steps Business Templates
PPT animate text powerpoint 2007 circles downward arrow 6 steps Business Templates-Arrows PowerPoint Diagram is nice for financial PowerPoint Diagram presentations as well as other analysis or business PowerPoint diagram needs. Use this graphical approach to represent global business issues such as financial data, stock market Exchange, increase in sales, corporate presentations and more.-PPT animate text powerpoint 2007 circles downward arrow 6 steps Business Templates-Add, Aqua, Arrows, Badges, Bar, Blend, Blue, Bright, Bubbles, Buttons, Caution, Circle, Drop, Elements, Glossy, Glowing, Graphic, Heart, Help, Icons, Idea, Illustration, Navigation, Oblong, Plus, Round, Service, Shadow, Shiny, Sign, Speech, Squares

Portable Home Safety Systems Company Profile Security Company Organization Chart Demonstration PDF
This slide highlights the organization chart of home security company which includes president, finance vice president, chief legal officer and secretary, chief financial officer and chief administrative officer. Presenting Portable Home Safety Systems Company Profile Security Company Organization Chart Demonstration PDF to provide visual cues and insights. Share and navigate important information on four stages that need your due attention. This template can be used to pitch topics like Chief Financial, Executive Vice President, Chief Operating Officer. In addtion, this PPT design contains high resolution images, graphics, etc, that are easily editable and available for immediate download.

Food And Agro Company Outline Organization Chart Ppt Summary Example File PDF
This slide highlights the organization chart of agricultural company which includes founder, CEO, EVP of retail products, fertilizer products, chief financial officer, chief legal officer, corporate development and strategy. This is a Food And Agro Company Outline Organization Chart Ppt Summary Example File PDF template with various stages. Focus and dispense information on four stages using this creative set, that comes with editable features. It contains large content boxes to add your information on topics like Founder And CEO, Retail Products, Fertilizer Products, Chief Financial Officer. You can also showcase facts, figures, and other relevant content using this PPT layout. Grab it now.

Business Software Development Company Profile Organisation Structure Ideas PDF
The slide company hierarchy in software company which depicts chief executive officer, chief technology officer, chief financial officer, legal team, head of operations, audit team, customer support head and head of sales and marketing. Presenting Business Software Development Company Profile Organisation Structure Ideas PDF to provide visual cues and insights. Share and navigate important information on six stages that need your due attention. This template can be used to pitch topics like Chief Technology Officer, Chief Executive Officer, Chief Financial Officer. In addtion, this PPT design contains high resolution images, graphics, etc, that are easily editable and available for immediate download.

Hospital Medical Research Company Profile Our Corporate Clientele Clipart PDF
The slide depicts the company hierarchical chart to define the various management positions in organization. It depicts managing director, founder, chief financial officer, chief executive officer, director of operations, director of surgeries, IPR head, R and D head and manufacturing head. Deliver an awe inspiring pitch with this creative Hospital Medical Research Company Profile Our Corporate Clientele Clipart PDF bundle. Topics like Managing Director, Chief Financial Officer, Manufacturing Head can be discussed with this completely editable template. It is available for immediate download depending on the needs and requirements of the user.

Action Plan To Implement Exit Strategy For Investors Matrix For Developing Strategic Exit Strategy Designs PDF
The following slide helps the organization in analyzing multiple exit strategies on the basis of their probability and profitability. These strategies can be buyout, financial sponsor sale, IPO etc. Presenting Action Plan To Implement Exit Strategy For Investors Matrix For Developing Strategic Exit Strategy Designs PDF to provide visual cues and insights. Share and navigate important information on four stages that need your due attention. This template can be used to pitch topics like Financial Sponsor Sale, Strategic Acquisition, Low Probability. In addtion, this PPT design contains high resolution images, graphics, etc, that are easily editable and available for immediate download.

Our Management Team Facebook Business Outline Information PDF
This slide showcases the management team which includes chairman, chief operating officer, financial officer, product officer, diversity officer, technology officer, head of global affairs, etc. Presenting Our Management Team Facebook Business Outline Information PDF to provide visual cues and insights. Share and navigate important information on three stages that need your due attention. This template can be used to pitch topics like Chief Technology Officer, Chief Operating Officer, Chief Financial Officer. In addtion, this PPT design contains high resolution images, graphics, etc, that are easily editable and available for immediate download.

Pharmaceutical And Clinical Research Summary Organisation Structure Infographics PDF
The slide depicts the company hierarchical chart to define the various management positions in organization. It depicts managing director, founder, chief financial officer, chief executive officer, director of operations, director of surgeries, IPR head, R and D head and manufacturing head. This is a Pharmaceutical And Clinical Research Summary Organisation Structure Infographics PDF template with various stages. Focus and dispense information on four stages using this creative set, that comes with editable features. It contains large content boxes to add your information on topics like Sales And Marketing Manager, Manufacturing Head Chief, Financial Officer. You can also showcase facts, figures, and other relevant content using this PPT layout. Grab it now.

Key Levers Associated To IT Cost Optimization Framework Slides PDF
This slide provides information regarding key levers associated to IT cost optimization framework to determine better cost optimization technique by assessing it on levers such as critical financial benefit, extent of organizational and technical risk, time and investment required and business impact. Presenting Key Levers Associated To IT Cost Optimization Framework Slides PDF to provide visual cues and insights. Share and navigate important information on four stages that need your due attention. This template can be used to pitch topics like Critical Financial Benefit, Business Impact, Time Required. In addtion, this PPT design contains high resolution images, graphics, etc, that are easily editable and available for immediate download.

Total Revenue And Total Profits After Implementing The Strategies Slides PDF
This slide shows the forecasted ABC Zoos financials total revenue and total profits from the year 2020 to 2024. It shows an increase in the Zoos financials due to successful implementation of the strategies. Deliver and pitch your topic in the best possible manner with this total revenue and total profits after implementing the strategies slides pdf. Use them to share invaluable insights on revenue, profit, financials and impress your audience. This template can be altered and modified as per your expectations. So, grab it now.
 Home
Home