Financial Graphs

Bar Graph Ppt PowerPoint Presentation File Show
This is a bar graph ppt powerpoint presentation file show. This is a four stage process. The stages in this process are business, marketing, graph, growth, finance.

Bar Graph Ppt Powerpoint Presentation File Graphics
This is a bar graph ppt powerpoint presentation file graphics. This is a three stage process. The stages in this process are product, graph, management, business, marketing.

Bar Graph Ppt PowerPoint Presentation Show Inspiration
This is a bar graph ppt powerpoint presentation show inspiration. This is a six stage process. The stages in this process are business, marketing, bar, graph, success.

Bar Graph Ppt Powerpoint Presentation Outline Shapes
This is a bar graph ppt powerpoint presentation outline shapes. This is a four stage process. The stages in this process are product, graph, finance, marketing, business.

Bar Graph Ppt PowerPoint Presentation Layouts Professional
This is a bar graph ppt powerpoint presentation layouts professional. This is a five stage process. The stages in this process are product, business, marketing, finance, graph.

Bar Graph Ppt PowerPoint Presentation File Tips
This is a bar graph ppt powerpoint presentation file tips. This is a twelve stage process. The stages in this process are business, marketing, finance, graph, strategy.

Bar Graph Ppt PowerPoint Presentation Show Guidelines
This is a bar graph ppt powerpoint presentation show guidelines. This is a four stage process. The stages in this process are product, growth, business, finance, bar graph.

Bar Graph Ppt PowerPoint Presentation Styles Show
This is a bar graph ppt powerpoint presentation styles show. This is a one stage process. The stages in this process are bar graph, finance, marketing, investment, business.

Bar Graph Ppt PowerPoint Presentation Layouts Portrait
This is a bar graph ppt powerpoint presentation layouts portrait. This is a three stage process. The stages in this process are bar graph, finance, marketing, strategy, business.

Bar Graph Ppt PowerPoint Presentation File Display
This is a bar graph ppt powerpoint presentation file display. This is a four stage process. The stages in this process are bar graph, marketing, strategy, finance, analysis.

Bar Graph Ppt PowerPoint Presentation Professional Background
This is a bar graph ppt powerpoint presentation professional background. This is a two stage process. The stages in this process are bar graph, finance, marketing, strategy, business.

Bar Graph Ppt PowerPoint Presentation Layouts Backgrounds
This is a bar graph ppt powerpoint presentation layouts backgrounds. This is a one stage process. The stages in this process are business, marketing, finance, bar graph, strategy.

Bar Graph Ppt PowerPoint Presentation Portfolio Example
This is a bar graph ppt powerpoint presentation portfolio example. This is a three stage process. The stages in this process are sales in percentage, year, business, product, business, graph.

Bar Graph Ppt PowerPoint Presentation File Slides
This is a bar graph ppt powerpoint presentation file slides. This is a three stage process. The stages in this process are product, sales in percentage, bar graph, growth, success.

Bar Graph Ppt PowerPoint Presentation Summary Format
This is a bar graph ppt powerpoint presentation summary format. This is a three stage process. The stages in this process are bar graph, business, marketing, years, percentage, finance.

Bar Graph Ppt PowerPoint Presentation Layouts Influencers
This is a bar graph ppt powerpoint presentation layouts influencers. This is a two stage process. The stages in this process are business, marketing, in bar graph, sales in percentage, finance.

Bar Graph Ppt PowerPoint Presentation Styles Skills
This is a bar graph ppt powerpoint presentation styles skills. This is a two stage process. The stages in this process are bar graph, product, in year, in percentage, business.

Bar Graph Ppt PowerPoint Presentation Pictures Picture
This is a bar graph ppt powerpoint presentation pictures picture. This is a three stage process. The stages in this process are business, marketing, strategy, planning, finance.

Bar Graph Ppt PowerPoint Presentation Slides Slideshow
This is a bar graph ppt powerpoint presentation slides slideshow. This is a three stage process. The stages in this process are business, finance, marketing, strategy, planning.

Competitor Analysis Graph Ppt PowerPoint Presentation Styles
This is a competitor analysis graph ppt powerpoint presentation styles. This is a five stage process. The stages in this process are graph, business, marketing, competitor.

Bar Graph Ppt PowerPoint Presentation Sample
This is a bar graph ppt powerpoint presentation sample. This is a four stage process. The stages in this process are bar graph, finance, marketing, strategy, analysis, business.

Competitor Analysis Graph Ppt PowerPoint Presentation Outline
This is a competitor analysis graph ppt powerpoint presentation outline. This is a five stage process. The stages in this process are bar graph, marketing, strategy, analysis, business.

Bar Graph Ppt PowerPoint Presentation Gallery Good
This is a bar graph ppt powerpoint presentation gallery good. This is a seven stage process. The stages in this process are graph, finance, business, marketing.

Bar Graph Ppt PowerPoint Presentation Layouts Graphics
This is a bar graph ppt powerpoint presentation layouts graphics. This is a four stage process. The stages in this process are bar graph, finance, marketing, strategy, business.

Bar Graph Ppt PowerPoint Presentation Professional Templates
This is a bar graph ppt powerpoint presentation professional templates. This is a four stage process. The stages in this process are bar graph, finance, marketing, analysis, business.

Bar Graph Ppt PowerPoint Presentation Professional Clipart
This is a bar graph ppt powerpoint presentation professional clipart. This is a six stage process. The stages in this process are bar graph, finance, marketing, strategy, business.

Bar Graph Ppt PowerPoint Presentation Styles Influencers
This is a bar graph ppt powerpoint presentation styles influencers. This is a four stage process. The stages in this process are bar, graph, business, marketing, finance.

Bar Graph Ppt PowerPoint Presentation Summary Infographics
This is a bar graph ppt powerpoint presentation summary infographics. This is a two stage process. The stages in this process are Bar Graph, Finance, Marketing, Management, Investment.

Bar Graph Ppt PowerPoint Presentation Model Clipart
This is a bar graph ppt powerpoint presentation model clipart. This is a six stage process. The stages in this process are sales in percentage, product, bar graph, business, marketing.

Bar Graph Ppt PowerPoint Presentation Outline Layout
This is a bar graph ppt powerpoint presentation outline layout. This is a four stage process. The stages in this process are sales in percentage, product, bar graph, business, marketing.

Bar Graph Ppt PowerPoint Presentation Styles Model
This is a bar graph ppt powerpoint presentation styles model. This is a four stage process. The stages in this process are bar graph, finance, marketing, analysis, investment, business.

Bar Graph Ppt PowerPoint Presentation File Portfolio
This is a bar graph ppt powerpoint presentation file portfolio. This is a twelve stage process. The stages in this process are financial, marketing, management, business, strategy.

Bar Graph Ppt PowerPoint Presentation Inspiration
This is a bar graph ppt powerpoint presentation inspiration. This is a five stage process. The stages in this process are bar graph, finance, marketing, strategy, investment, analysis, business, success.

Bar Graph Ppt PowerPoint Presentation Show Topics
This is a bar graph ppt powerpoint presentation show topics. This is a nine stage process. The stages in this process are business, finance, marketing, strategy, bar graph, growth.

Bar Graph Ppt PowerPoint Presentation Portfolio Outline
This is a bar graph ppt powerpoint presentation portfolio outline. This is a three stage process. The stages in this process are bar graph, finance, marketing, strategy, investment, business.

Bar Graph Ppt PowerPoint Presentation Pictures Tips
This is a bar graph ppt powerpoint presentation pictures tips. This is a five stage process. The stages in this process are bar graph, finance, marketing, strategy, analysis, business.

Bar Graph Ppt PowerPoint Presentation File Picture
This is a bar graph ppt powerpoint presentation file picture. This is a six stage process. The stages in this process are management, planning, marketing, business, strategy.

Money Need Assessment Analysis Graph Ppt Examples
This is a money need assessment analysis graph ppt examples. This is a two stage process. The stages in this process are production, marketing, need, money, finance.

Portfolio Evaluation Bar Graph Ppt Slides
This is a portfolio evaluation bar graph ppt slides. This is a five stage process. The stages in this process are business, finance, marketing.

Product Development Analysis Bar Graph Powerpoint Themes
This is a product development analysis bar graph powerpoint themes. This is a five stage process. The stages in this process are business, growth, strategy, management, pretention.

Band Engagement Analysis Bar Graph Powerpoint Ideas
This is a band engagement analysis bar graph powerpoint ideas. This is a four stage process. The stages in this process are engagement, brand, monthly, weekly.

Competitor Analysis Graph Ppt PowerPoint Presentation Graphics
This is a competitor analysis graph ppt powerpoint presentation graphics. This is a five stage process. The stages in this process are competitor, business, marketing.

Bar Graph Ppt PowerPoint Presentation Layouts Gridlines
This is a bar graph ppt powerpoint presentation layouts gridlines. this is a three stage process. The stages in this process are product, percentage, business, marketing, management.

Bar Graph Ppt PowerPoint Presentation Gallery Inspiration
This is a bar graph ppt powerpoint presentation gallery inspiration. This is a three stage process. The stages in this process are product, sales in percentage, finance, success.

Bar Graph Ppt PowerPoint Presentation Outline Structure
This is a bar graph ppt powerpoint presentation outline structure. This is a three stage process. The stages in this process are product, percentage, finance, business.

Bar Graph Ppt PowerPoint Presentation Icon
This is a bar graph ppt powerpoint presentation icon. This is a three stage process. The stages in this process are business, finance, marketing, strategy, analysis.

Bar Graph Ppt PowerPoint Presentation Show Slides
This is a bar graph ppt powerpoint presentation show slides. This is a two stage process. The stages in this process are finance, marketing, management, investment, analysis.

Clustered Column Graph Ppt PowerPoint Presentation Layouts
This is a clustered column graph ppt powerpoint presentation layouts. This is a two stage process. The stages in this process are finance, marketing, management, investment, analysis.
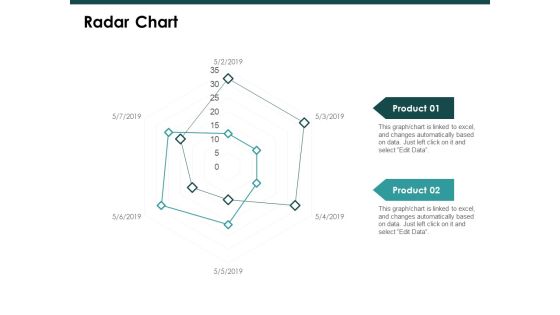
Radar Chart Graph Ppt PowerPoint Presentation Slide
This is a radar chart graph ppt powerpoint presentation slide. This is a two stage process. The stages in this process are finance, marketing, management, investment, analysis.

Clustered Bar Graph Ppt PowerPoint Presentation Templates
This is a clustered bar graph ppt powerpoint presentation templates. This is a three stage process. The stages in this process are finance, marketing, management, investment, analysis.
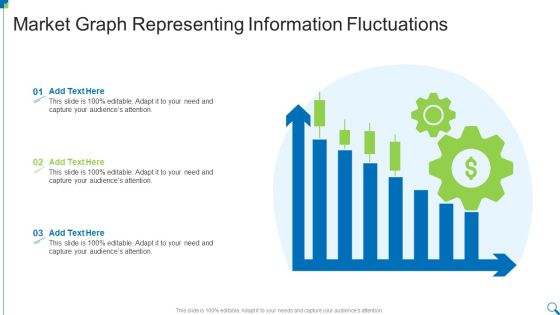
Market Graph Representing Information Fluctuations Diagrams PDF
Presenting Market Graph Representing Information Fluctuations Diagrams PDF to dispense important information. This template comprises three stages. It also presents valuable insights into the topics including Market Graph, Representing, Information Fluctuations This is a completely customizable PowerPoint theme that can be put to use immediately. So, download it and address the topic impactfully.
Investment Portfolio Advantages Graph Icon Rules PDF
Presenting Investment Portfolio Advantages Graph Icon Rules PDF to dispense important information. This template comprises three stages. It also presents valuable insights into the topics including Investment Portfolio, Advantages Graph Icon. This is a completely customizable PowerPoint theme that can be put to use immediately. So, download it and address the topic impactfully.

Bar Graph Ppt PowerPoint Presentation Gallery Grid
This is a bar graph ppt powerpoint presentation gallery grid. This is a three stage process. The stages in this process are sales in percentage, product, finance, business, marketing.
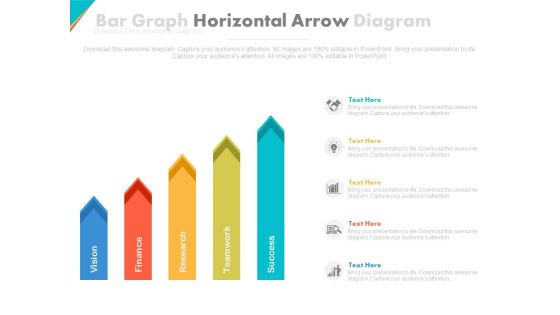
Five Horizontal Arrows Bar Graph Powerpoint Slides
This PowerPoint template contains five horizontal arrows bra graph. You may download this PPT slide design to display steps of strategic planning. You can easily customize this template to make it more unique as per your need.
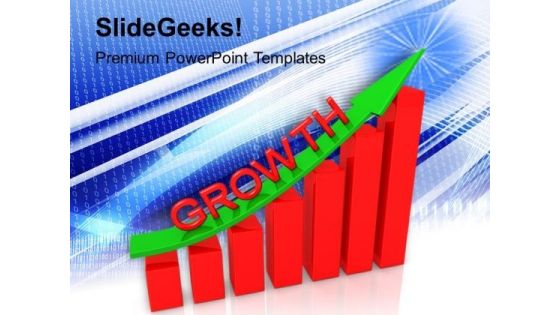
Business Graph Up PowerPoint Templates And PowerPoint Themes 1012
Business Graph Up PowerPoint Templates And PowerPoint Themes 1012-This PowerPoint Template shows the Bar Graph with increasing percentage which signifies the Financial Growth. The Template signifies the concept of Team Work, Team Leader etc. The structure of our templates allows you to effectively highlight the key issues concerning the growth of your business.-Business Graph Up PowerPoint Templates And PowerPoint Themes 1012-This PowerPoint template can be used for presentations relating to-Business graph, success, arrows, business, signs, shapes

Growth Graph Moving Up PowerPoint Templates And PowerPoint Themes 1012
Growth Graph Moving Up PowerPoint Templates And PowerPoint Themes 1012-This PowerPoint Template shows the Bar Graph with increasing percentage which signifies the Financial Growth. The Template signifies the concept of Team Work, Team Leader etc. The structure of our templates allows you to effectively highlight the key issues concerning the growth of your business.-Growth Graph Moving Up PowerPoint Templates And PowerPoint Themes 1012-This PowerPoint template can be used for presentations relating to-Business graph with rising arrow, success, business, arrows, marketing, finance

Bar Graph For Future Planning Powerpoint Template
This business diagram display bar graph for years 2015 and 2016. You may use this slide to display statistical analysis. This diagram provides an effective way of displaying information you can edit text, color, shade and style as per you need.
Arrow Graph Success PowerPoint Templates And PowerPoint Themes 1012
Arrow Graph Success PowerPoint Templates And PowerPoint Themes 1012-This PowerPoint Template shows arrow graph with increase. This image signifies the Financial or Business Growth. The Template assumes business concept. Use this template for Global Business. The structure of our templates allows you to effectively highlight the key issues concerning the growth of your business.-Arrow Graph Success PowerPoint Templates And PowerPoint Themes 1012-This PowerPoint template can be used for presentations relating to-Arrow to success, business, marketing, finance, arrows, success

Profit Growth Graph With Gears Powerpoint Template
This business slide contains profit growth graph with gears. This PowerPoint template helps to display outline of business plan. Use this diagram to impart more clarity to data and to create more sound impact on viewers.

Bar Graph Business PowerPoint Template 1110
Abstract vector background with bar graphs and dollar sign

 Home
Home