Financial Graphs

Bar Graph Template 2 Ppt PowerPoint Presentation Ideas Files
This is a bar graph template 2 ppt powerpoint presentation ideas files. This is a five stage process. The stages in this process are in percentage, business, marketing, finance, graph.

Bar Graph Ppt PowerPoint Presentation Infographics Graphics Design
This is a bar graph ppt powerpoint presentation infographics graphics design. This is a five stage process. The stages in this process are bar graph, business, years, marketing, management.

Bar Graph Template 1 Ppt PowerPoint Presentation Icon Layouts
This is a bar graph template 1 ppt powerpoint presentation icon layouts. This is a three stage process. The stages in this process are bar graph, finance, analysis, marketing, strategy.

Bar Graph Template 2 Ppt PowerPoint Presentation Inspiration Backgrounds
This is a bar graph template 2 ppt powerpoint presentation inspiration backgrounds. This is a four stage process. The stages in this process are bar graph, finance, analysis, marketing, strategy.

Bar Graph 7 QC Tools Ppt PowerPoint Presentation Styles Structure
This is a bar graph 7 qc tools ppt powerpoint presentation styles structure. This is a three stage process. The stages in this process are bar graph, finance, marketing, analysis, investment.

Stock Photo Pie And Bar Graph With 2015 PowerPoint Slide
This Power Point image template slide has been crafted with graphic of pie and bar graph and 2015 year text. This PPT slide contains the concept of business and financial analysis. Use this image slide and build quality presentation for your viewers.
Sales Growth Graph Vector Icon Ppt PowerPoint Presentation Icon Ideas
Presenting this set of slides with name sales growth graph vector icon ppt powerpoint presentation icon ideas. This is a one stage process. The stages in this process are industry trends, financial services, term business planning. This is a completely editable PowerPoint presentation and is available for immediate download. Download now and impress your audience.

Bar Graph Ppt PowerPoint Presentation Layouts Graphic Images
This is a bar graph ppt powerpoint presentation layouts graphic images. This is a four stage process. The stages in this process are product, business, marketing, growth.

Bar Graph Ppt PowerPoint Presentation Slides Graphic Images
This is a bar graph ppt powerpoint presentation slides graphic images. This is a six stage process. The stages in this process are bar, finance, business, marketing, growth.

Bar Graph Ppt PowerPoint Presentation Styles Visual Aids
This is a bar graph ppt powerpoint presentation styles visual aids. This is a three stage process. The stages in this process are bar, marketing, strategy, finance, planning.

Bar Graph Ppt PowerPoint Presentation Ideas Design Inspiration
This is a bar graph ppt powerpoint presentation ideas design inspiration. This is a five stage process. The stages in this process are bar, marketing, strategy, planning, finance.

Bar Graph Finance Ppt PowerPoint Presentation Summary Ideas
This is a bar graph finance ppt powerpoint presentation summary ideas. This is a three stage process. The stages in this process are finance, analysis, business, investment, marketing.

Bar Graph Product Ppt PowerPoint Presentation Layouts Ideas
This is a bar graph product ppt powerpoint presentation layouts ideas. This is a three stage process. The stages in this process are business, management, marketing, product, percentage.
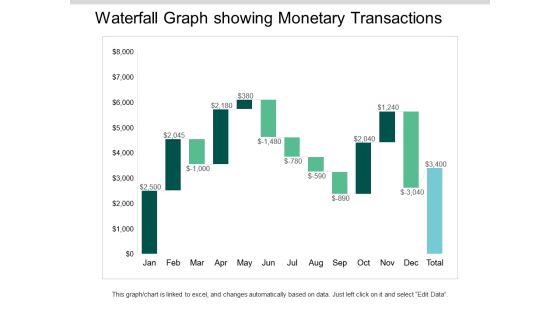
Waterfall Graph Showing Monetary Transactions Ppt PowerPoint Presentation Ideas Visuals
This is a waterfall graph showing monetary transactions ppt powerpoint presentation ideas visuals. This is a three stage process. The stages in this process are profit and loss, balance sheet, income statement, benefit and loss.
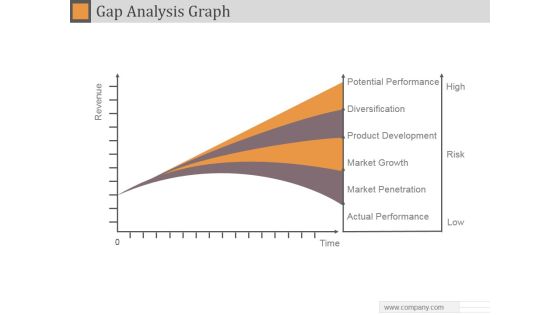
Gap Analysis Graph Ppt PowerPoint Presentation Example 2015
This is a gap analysis graph ppt powerpoint presentation example 2015. This is a four stage process. The stages in this process are potential performance, diversification, product development, market growth, market penetration, actual performance.

Bar Graph Finance Ppt PowerPoint Presentation Infographics Background Designs
This is a bar graph finance ppt powerpoint presentation infographics background designs. This is a two stage process. The stages in this process are finance, analysis, business, investment, marketing.

Bar Graph Percentage Product Ppt PowerPoint Presentation Layouts Microsoft
This is a bar graph percentage product ppt powerpoint presentation layouts microsoft. This is a three stage process. The stages in this process are business, management, marketing, percentage, product.

Waterfall Graph Showing Business Progress Ppt PowerPoint Presentation Styles Model
This is a waterfall graph showing business progress ppt powerpoint presentation styles model. This is a three stage process. The stages in this process are profit and loss, balance sheet, income statement, benefit and loss.

Bar Graph Percentage Product Ppt PowerPoint Presentation Styles Good
This is a bar graph percentage product ppt powerpoint presentation styles good. This is a three stage process. The stages in this process are area chart, finance, marketing, management, investment.

Bar Graph For Year Based Analysis Powerpoint Slides
This PowerPoint template has been designed with year based bar graph. This diagram may be used to display yearly statistical analysis. Use this PPT slide design to make impressive presentations.

Bar Graph For Yearly Statistical Analysis Powerpoint Slides
This PowerPoint template has been designed with bar graph. This PowerPoint diagram is useful to exhibit yearly statistical analysis. This diagram slide can be used to make impressive presentations.

Bar Graph For Data Distribution And Analysis Powerpoint Slides
This PowerPoint template has been designed with bar graph. This PowerPoint diagram is useful for data distribution and analysis This diagram slide can be used to make impressive presentations.

Tablet With Bar Graph And Pie Chart Powerpoint Templates
This business slide has been designed with business graphs on computer tablet. You may download this PPT slide to display statistical analysis. This slide will help you to sequence your thoughts.
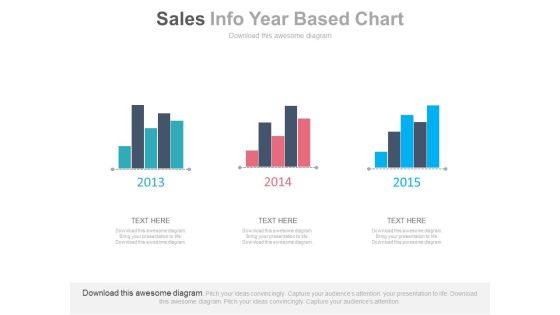
Three Years Sales Data Bar Graph Powerpoint Slides
This PowerPoint template has been designed with bar charts. This business slide may be used to display three years sales data for comparison. Present your views and ideas with this impressive design.
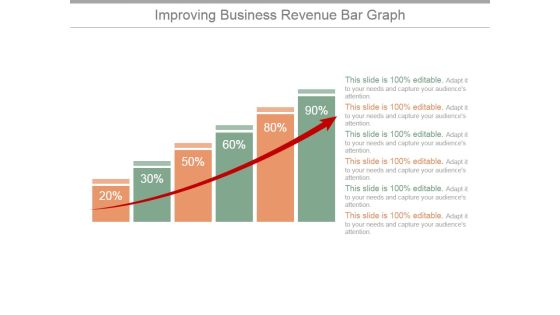
Improving Business Revenue Bar Graph Ppt PowerPoint Presentation Infographic Template
This is a improving business revenue bar graph ppt powerpoint presentation infographic template. This is a six stage process. The stages in this process are graph, arrow, finance, percentage, success.

Bar Graph Ppt PowerPoint Presentation Layouts Design Templates
This is a bar graph ppt powerpoint presentation layouts design templates. This is a four stage process. The stages in this process are bar graph, planning, business, management, strategy.

Bar Graph Ppt PowerPoint Presentation Outline Design Templates
This is a bar graph ppt powerpoint presentation outline design templates. This is a nine stage process. The stages in this process are bar graph, management, planning, strategy, marketing.

Bar Graph Ppt PowerPoint Presentation Slides Visual Aids
This is a bar graph ppt powerpoint presentation slides visual aids. This is a three stage process. The stages in this process are sales in percentage, bar graph, business, marketing, success.

Bar Graph Ppt PowerPoint Presentation File Graphic Tips
This is a bar graph ppt powerpoint presentation file graphic tips. This is a two stage process. The stages in this process are bar graph, finance, marketing, strategy, sales, business.

Bar Graph Ppt PowerPoint Presentation Slides File Formats
This is a bar graph ppt powerpoint presentation slides file formats. This is a five stage process. The stages in this process are business, marketing, bar graph, timeline, analysis, planning.

Bar Graph Ppt PowerPoint Presentation Icon Clipart Images
This is a bar graph ppt powerpoint presentation icon clipart images. This is a three stage process. The stages in this process are bar graph, finance, marketing, strategy, analysis.

Bar Graph Ppt PowerPoint Presentation Slides Background Image
This is a bar graph ppt powerpoint presentation slides background image. This is a six stage process. The stages in this process are bar graph, finance, marketing, analysis, business.

Bar Graph Ppt PowerPoint Presentation Infographics Slide Download
This is a bar graph ppt powerpoint presentation infographics slide download. This is a four stage process. The stages in this process are bar graph, finance, marketing, strategy, analysis.

Bar Graph Ppt PowerPoint Presentation Infographic Template Graphics
This is a bar graph ppt powerpoint presentation infographic template graphics. This is a five stage process. The stages in this process are bar graph, finance, marketing, strategy, analysis, business.

Competitor Analysis Graph Ppt PowerPoint Presentation Slides Elements
This is a competitor analysis graph ppt powerpoint presentation slides elements. This is a five stage process. The stages in this process are bar graph, finance, marketing, strategy, business.

Bar Graph Chart Ppt PowerPoint Presentation Portfolio Templates
This is a bar graph chart ppt powerpoint presentation portfolio templates. This is a two stage process. The stages in this process are financial, minimum, medium, maximum.

Bar Graph Ppt PowerPoint Presentation File Graphic Images
This is a bar graph ppt powerpoint presentation file graphic images. This is a three stage process. The stages in this process are business, marketing, chart, finance, product.
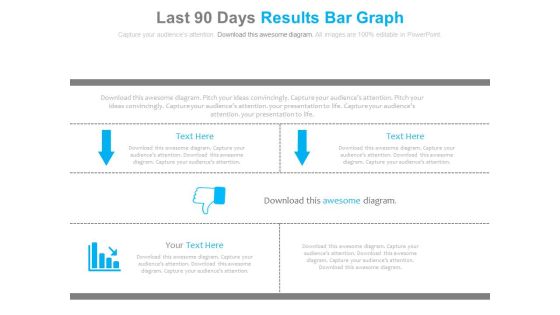
Last 90 Days Results Bar Graph Ppt Slides
This is a last 90 days results bar graph ppt slides. This is a three stage process. The stages in this process are arrows, business, marketing.

Gross Margin Improvement Bar Graph Dashboard Powerpoint Slide Download
This is a gross margin improvement bar graph dashboard powerpoint slide download. This is a two stage process. The stages in this process are chart title.

Bar Graph Ppt PowerPoint Presentation Styles File Formats
This is a bar graph ppt powerpoint presentation styles file formats. This is a four stage process. The stages in this process are percentage, business, marketing, finance, strategy.

Bar Graph Ppt PowerPoint Presentation Portfolio Example Topics
This is a bar graph ppt powerpoint presentation portfolio example topics. This is a four stage process. The stages in this process are business, marketing, management, success, planning.

Bar Graph Finance Ppt PowerPoint Presentation Icon Good
This is a bar graph finance ppt powerpoint presentation icon good. This is a two stage process. The stages in this process are analysis, finance, marketing, management, investment.

Bar Graph Finance Ppt PowerPoint Presentation Pictures Elements
This is a bar graph finance ppt powerpoint presentation pictures elements. This is a three stage process. The stages in this process are finance, marketing, management, investment, analysis.

bar graph finance ppt powerpoint presentation portfolio summary
This is a bar graph finance ppt powerpoint presentation portfolio summary. This is a three stage process. The stages in this process are finance, marketing, management, investment, analysis.

Bar Graph Finance Ppt Powerpoint Presentation Layouts Mockup
This is a bar graph finance ppt powerpoint presentation layouts mockup. This is a three stage process. The stages in this process are finance, marketing, management, investment, analysis.

Bar Graph Finance Ppt Powerpoint Presentation File Ideas
This is a bar graph finance ppt powerpoint presentation file ideas. This is a four stage process. The stages in this process are finance, marketing, management, investment, analysis.

Stock Chart Graph Ppt PowerPoint Presentation Ideas Demonstration
This is a stock chart graph ppt powerpoint presentation ideas demonstration. This is a three stage process. The stages in this process are finance, marketing, management, investment, analysis.

Clustered Column Graph Ppt PowerPoint Presentation Pictures Grid
This is a clustered column graph ppt powerpoint presentation pictures grid. This is a two stage process. The stages in this process are finance, marketing, management, investment, analysis.

Bar Graph Finance Ppt PowerPoint Presentation Styles Slide
This is a bar graph finance ppt powerpoint presentation styles slide. This is a three stage process. The stages in this process are finance, marketing, management, investment, analysis.

Combo Chart Graph Ppt PowerPoint Presentation Inspiration Template
This is a combo chart graph ppt powerpoint presentation inspiration template. This is a three stage process. The stages in this process are finance, marketing, management, investment, analysis.

Combo Chart Graph Ppt PowerPoint Presentation Infographics Guide
This is a combo chart graph ppt powerpoint presentation infographics guide. This is a two stage process. The stages in this process are marketing, business, management, planning, strategy.

Clustered Bar Graph Ppt PowerPoint Presentation Outline Layouts
This is a clustered bar graph ppt powerpoint presentation outline layouts. This is a three stage process. The stages in this process are finance, marketing, analysis, investment, million.
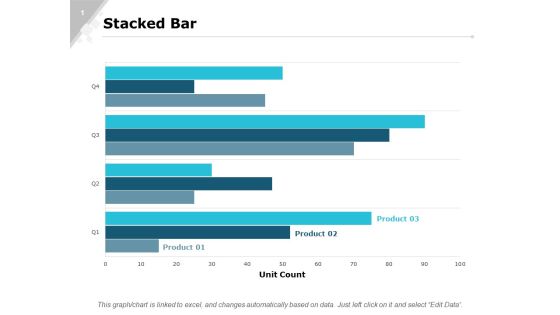
Stacked Bar Graph Ppt PowerPoint Presentation Inspiration Images
This is a stacked bar graph ppt powerpoint presentation inspiration images. This is a three stage process. The stages in this process are finance, marketing, analysis, investment, million.

Clustered Chart Graph Ppt PowerPoint Presentation Gallery Backgrounds
This is a clustered chart graph ppt powerpoint presentation gallery backgrounds. This is a three stage process. The stages in this process are finance, marketing, analysis, investment, million.

Combo Chart Graph Ppt PowerPoint Presentation Professional Guidelines
This is a combo chart graph ppt powerpoint presentation professional guidelines. This is a three stage process. The stages in this process are finance, marketing, analysis, investment, million.
Gross Revenue Margin Comparison Graph Icon Clipart PDF
Persuade your audience using this Gross Revenue Margin Comparison Graph Icon Clipart PDF. This PPT design covers three stages, thus making it a great tool to use. It also caters to a variety of topics including Gross Revenue Margin, Comparison Graph Icon. Download this PPT design now to present a convincing pitch that not only emphasizes the topic but also showcases your presentation skills.

Clustered Column Line Graph Ppt PowerPoint Presentation Ideas Demonstration
This is a clustered column line graph ppt powerpoint presentation ideas demonstration. This is a three stage process. The stages in this process are financial, minimum, maximum, marketing, strategy.

Bar Graph Finance Ppt PowerPoint Presentation Outline Background Designs
This is a bar graph finance ppt powerpoint presentation outline background designs. This is a three stage process. The stages in this process are financial, maximum, medium, minimum, marketing.
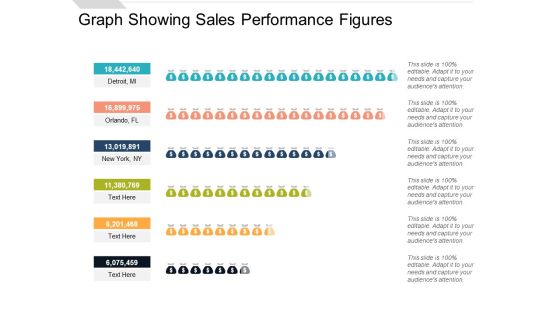
Graph Showing Sales Performance Figures Ppt PowerPoint Presentation Infographics Topics
Presenting this set of slides with name graph showing sales performance figures ppt powerpoint presentation infographics topics. This is a six stage process. The stages in this process are people graph, sales performance, population data demographics. This is a completely editable PowerPoint presentation and is available for immediate download. Download now and impress your audience.

Curved Graph Vector Icon Ppt PowerPoint Presentation Slides Themes PDF
Presenting this set of slides with name curved graph vector icon ppt powerpoint presentation slides themes pdf. This is a one stage process. The stage in this process is curved graph vector icon. This is a completely editable PowerPoint presentation and is available for immediate download. Download now and impress your audience.

 Home
Home