Financial Graphs

Bar Graph To Present Financial Information Ppt PowerPoint Presentation Show Tips
This is a bar graph to present financial information ppt powerpoint presentation show tips. This is a four stage process. The stages in this process are stock market, financial markets, bull market.
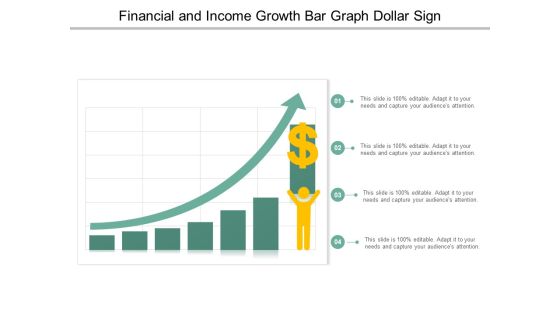
Financial And Income Growth Bar Graph Dollar Sign Ppt PowerPoint Presentation Professional Shapes
This is a financial and income growth bar graph dollar sign ppt powerpoint presentation professional shapes. This is a four stage process. The stages in this process are growth, increase sales, increase revenue.
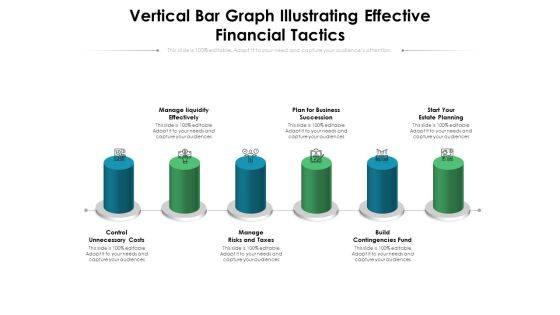
Vertical Bar Graph Illustrating Effective Financial Tactics Ppt PowerPoint Presentation File Portrait PDF
Presenting vertical bar graph illustrating effective financial tactics ppt powerpoint presentation file portrait pdf to dispense important information. This template comprises six stages. It also presents valuable insights into the topics including effectively, costs, business. This is a completely customizable PowerPoint theme that can be put to use immediately. So, download it and address the topic impactfully.
Business Graph With Globe Financial Strategy PowerPoint Templates Ppt Backgrounds For Slides 0213
We present our Business Graph With Globe Financial Strategy PowerPoint Templates PPT Backgrounds For Slides 0213.Download and present our Business PowerPoint Templates because Our PowerPoint Templates and Slides will definately Enhance the stature of your presentation. Adorn the beauty of your thoughts with their colourful backgrounds. Present our Marketing PowerPoint Templates because It will Strengthen your hand with your thoughts. They have all the aces you need to win the day. Use our Finance PowerPoint Templates because Our PowerPoint Templates and Slides are designed to help you succeed. They have all the ingredients you need. Download and present our Earth PowerPoint Templates because our PowerPoint Templates and Slides will give your ideas the shape. Download and present our Success PowerPoint Templates because You canTake a leap off the starting blocks with our PowerPoint Templates and Slides. They will put you ahead of the competition in quick time.Use these PowerPoint slides for presentations relating to Business chart and globe, business, marketing, finance, earth, success. The prominent colors used in the PowerPoint template are Orange, Yellow, White.
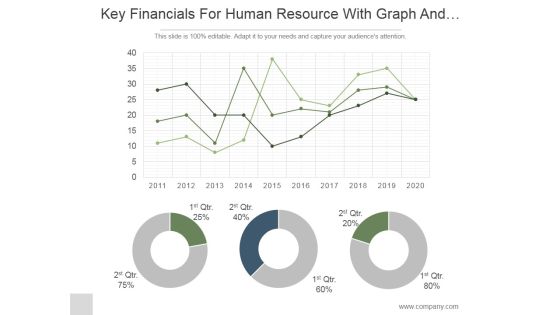
Key Financials For Human Resource With Graph And Pie Chart Ppt PowerPoint Presentation Ideas
This is a key financials for human resource with graph and pie chart ppt powerpoint presentation ideas. This is a three stage process. The stages in this process are business, strategy, marketing, analysis, donut, growth.

Strategic Management Bar Graph For Business And Financial Growth Business Diagram
Connect The Dots With Our Strategic Management Bar Graph For Business And Financial Growth Business Diagram Powerpoint Templates. Watch The Whole Picture Clearly Emerge. Dot Your Thoughts With Our Strategic Management Bar Graph For Business And Financial Growth Business Diagram Powerpoint Templates. Give Your Demeanor That Propel Look.
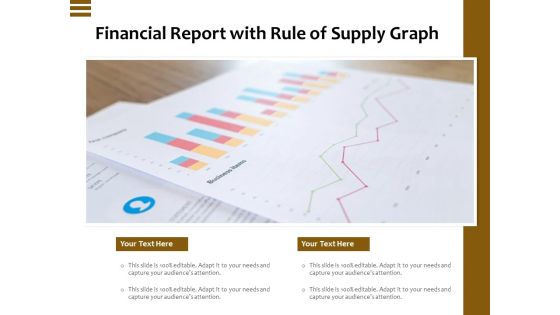
Financial Report With Rule Of Supply Graph Ppt PowerPoint Presentation File Background Designs PDF
Presenting this set of slides with name financial report with rule of supply graph ppt powerpoint presentation file background designs pdf. The topics discussed in these slide is financial report with rule of supply graph. This is a completely editable PowerPoint presentation and is available for immediate download. Download now and impress your audience.
Financial Reporting Icon Computer Screen With Graph And Dollar Ppt Powerpoint Presentation Layouts Model
This is a financial reporting icon computer screen with graph and dollar ppt powerpoint presentation layouts model. This is a four stage process. The stages in this process are financial statements icon, accounting ratio icon, balance sheet icon.

Graph With Arrow Showing Financial Downfall Ppt PowerPoint Presentation Summary Objects
Presenting this set of slides with name graph with arrow showing financial downfall ppt powerpoint presentation summary objects. This is a three stage process. The stages in this process are loss, decrease graph, stock market. This is a completely editable PowerPoint presentation and is available for immediate download. Download now and impress your audience.
Bar Graph For Business And Financial Growth PowerPoint Templates Ppt Backgrounds For Slides 0713
Establish your dominion with our Bar Graph For Business And Financial Growth PowerPoint Templates PPT Backgrounds For Slides. Rule the stage with your thoughts. Your ideas demand attention. Our Marketing PowerPoint Templates will get it done. Your listeners will never doodle. Our Arrows PowerPoint Templates PowerPoint Templates will hold their concentration.
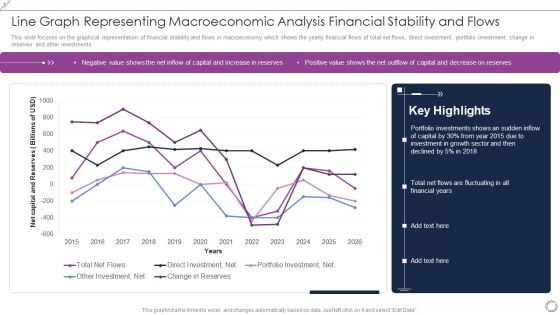
Line Graph Representing Macroeconomic Analysis Financial Stability And Flows Rules PDF
This slide focuses on the graphical representation of financial stability and flows in macroeconomy which shows the yearly financial flows of total net flows, direct investment, portfolio investment, change in reserves and other investments. Showcasing this set of slides titled Line Graph Representing Macroeconomic Analysis Financial Stability And Flows Rules PDF. The topics addressed in these templates are Total Net Flows, Direct Investment, Net, Portfolio Investment, Net. All the content presented in this PPT design is completely editable. Download it and make adjustments in color, background, font etc. as per your unique business setting.

Stock Photo Bar Graph With Cubes For Financial Data PowerPoint Slide
Graphic of bar graph and cubes are used to decorate this image template. This PPT contains the concept of financial data analysis. Use this PPT for finance and business related presentations.
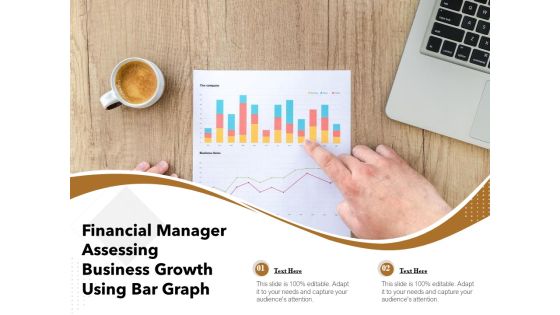
Financial Manager Assessing Business Growth Using Bar Graph Ppt PowerPoint Presentation Gallery Graphics PDF
Presenting financial manager assessing business growth using bar graph ppt powerpoint presentation gallery graphics pdf to dispense important information. This template comprises two stages. It also presents valuable insights into the topics including financial manager assessing business growth using bar graph. This is a completely customizable PowerPoint theme that can be put to use immediately. So, download it and address the topic impactfully.
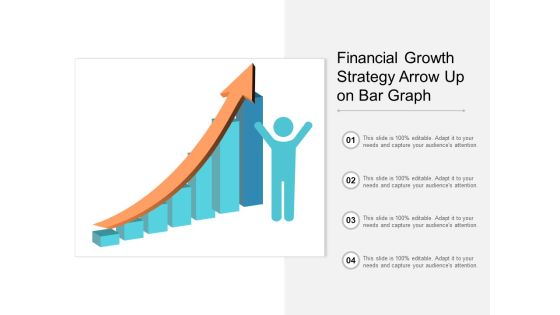
Financial Growth Strategy Arrow Up On Bar Graph Ppt PowerPoint Presentation Gallery Example
This is a financial growth strategy arrow up on bar graph ppt powerpoint presentation gallery example. This is a four stage process. The stages in this process are growth, increase sales, increase revenue.

Bar Graph With Upward Arrow For Financial Success Ppt PowerPoint Presentation Infographic Template Model
This is a bar graph with upward arrow for financial success ppt powerpoint presentation infographic template model. This is a five stage process. The stages in this process are rising arrow, growing arrow, increasing arrow.

Stock Photo Bar Graph And Us Map With Financial Growth PowerPoint Slide
This image displays American map with business graph in background. This image slide contains the concept of American economy, business growth and reports. Use this amazing slide to make professional presentations.

Circular Graph Symbol Business Ideation Employee Analysis Financial Analysis Ppt PowerPoint Presentation Complete Deck
Presenting this set of slides with name circular graph symbol business ideation employee analysis financial analysis ppt powerpoint presentation complete deck. The topics discussed in these slides are business ideation, employee analysis, financial analysis, data distribution, growth analysis. This is a completely editable PowerPoint presentation and is available for immediate download. Download now and impress your audience.

Financial Planning And Examination Plan For Small And Large Enterprises Bar Graph Elements PDF
Slidegeeks is here to make your presentations a breeze with Financial Planning And Examination Plan For Small And Large Enterprises Bar Graph Elements PDF With our easy to use and customizable templates, you can focus on delivering your ideas rather than worrying about formatting. With a variety of designs to choose from, you are sure to find one that suits your needs. And with animations and unique photos, illustrations, and fonts, you can make your presentation pop. So whether you are giving a sales pitch or presenting to the board, make sure to check out Slidegeeks first.

Bar Graphs Ppt PowerPoint Presentation Gallery Elements
This is a bar graphs ppt powerpoint presentation gallery elements. This is a two stage process. The stages in this process are Bar Graphs, Business, Strategy, Marketing, Analysis.

PowerPoint Graphs Going Up Or Down PowerPoint Slides
PowerPoint Graphs Going up or Down PowerPoint Slides-These high quality powerpoint pre-designed slides and powerpoint templates have been carefully created by our professional team to help you impress your audience. All slides have been created and are 100% editable in powerpoint. Each and every property of any graphic - color, size, orientation, shading, outline etc. can be modified to help you build an effective powerpoint presentation. Any text can be entered at any point in the powerpoint template or slide. Simply DOWNLOAD, TYPE and PRESENT!These PowerPoint designs and slide layouts can be used to in presentations relating to --Achievement, analysis, arrow, bank, banking, bar, business, capital, chart, coin, concept, credit, currency, deposit, diagram, earn, earnings, economics, finance, financial, gain, gold, golden, graph, growth, idea, interest, investment, isolated, make, marketing, monetary, money, company,computer,funding,grid,growing,green,growth,precut,statistics,succeed,tradc, savings, stack, strategy, success

Our Graphs And Charts Ppt PowerPoint Presentation Infographics Infographics
This is a our graphs and charts ppt powerpoint presentation infographics infographics. This is a one stage process. The stages in this process are business, strategy, analysis, pretention, chart and graph.

Our Charts And Graphs Ppt PowerPoint Presentation File Visuals
This is a our charts and graphs ppt powerpoint presentation file visuals. This is a one stage process. The stages in this process are business, strategy, marketing, analysis, finance.
Graphs And Currency Business PowerPoint Templates And PowerPoint Backgrounds 0211
Microsoft PowerPoint Template and Background with black graphs with currency signs

Customer Retention Business Monthly Report Summary With Graphs Guidelines PDF
The Following Slide highlights the Customer Retention Monthly Report with graphs . It showcases data and graphs with headings, metrics, current month, last month , change , customer churn , revenue churn , net retention and MRR growth. Showcasing this set of slides titled Customer Retention Business Monthly Report Summary With Graphs Guidelines PDF The topics addressed in these templates are Recurring Revenue, Customer Churn, Promoter Score All the content presented in this PPT design is completely editable. Download it and make adjustments in color, background, font etc. as per your unique business setting.
Graphs And Currency Business PowerPoint Themes And PowerPoint Slides 0211
Microsoft PowerPoint Theme and Slide with black graphs with currency signs
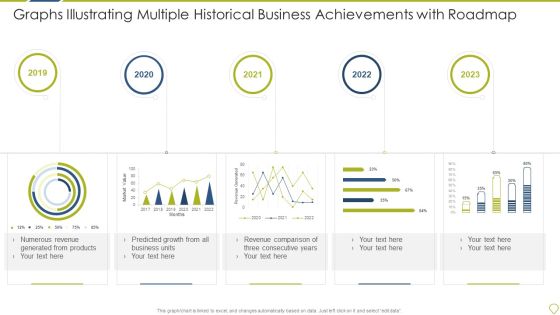
Graphs Illustrating Multiple Historical Business Achievements With Roadmap Themes PDF
Showcasing this set of slides titled graphs illustrating multiple historical business achievements with roadmap themes pdf. The topics addressed in these templates are revenue, business, growth. All the content presented in this PPT design is completely editable. Download it and make adjustments in color, background, font etc. as per your unique business setting.

Abstract Bar Graphs Business PowerPoint Templates And PowerPoint Backgrounds 0411
Microsoft PowerPoint Template and Background with background with bar graphs, dollar sign and diagram
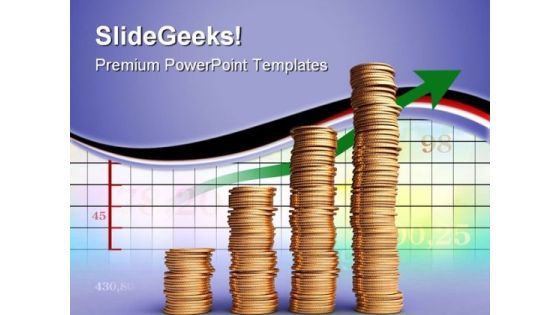
Earnings Graph Business PowerPoint Templates And PowerPoint Backgrounds 0711
Microsoft PowerPoint Template and Background with piles of coins over a financial graph
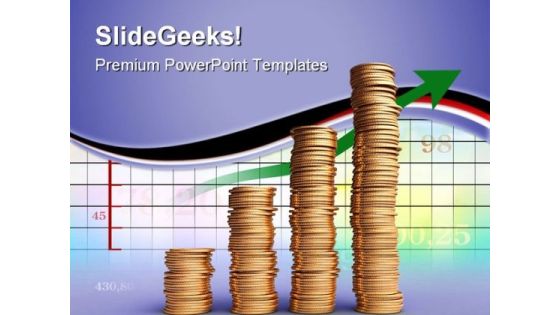
Earnings Graph Business PowerPoint Themes And PowerPoint Slides 0711
Microsoft PowerPoint Theme and Slide with piles of coins over a financial graph

Competitors Analysis Charts Graphs To Display Data Company Profiles Ppt PowerPoint Presentation Outline Visual Aids
This is a competitors analysis charts graphs to display data company profiles ppt powerpoint presentation outline visual aids. This is a five stage process. The stages in this process are finance, analysis, business, investment, marketing.
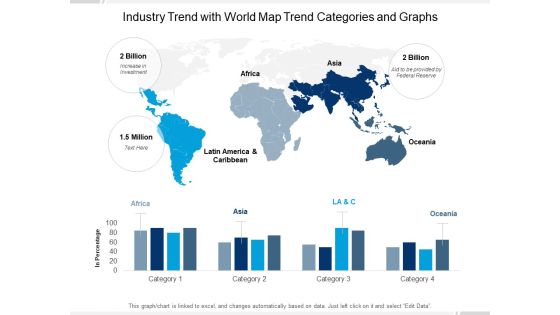
Industry Trend With World Map Trend Categories And Graphs Ppt PowerPoint Presentation Gallery Example Topics
Presenting this set of slides with name industry trend with world map trend categories and graphs ppt powerpoint presentation gallery example topics. The topics discussed in these slides are industry trends, financial services, term business planning. This is a completely editable PowerPoint presentation and is available for immediate download. Download now and impress your audience.

Semantic Web Fundamentals Knowledge Graphs The Next Reincarnation Of The Semantic Web Mockup PDF
This slide depicts the overview of knowledge graphs which are the next level of the semantic web, and they bring semantic web prototype to the workplace. It also includes that ontologies are used in business knowledge graphs for creating diverse conceptual models. Make sure to capture your audiences attention in your business displays with our gratis customizable Semantic Web Fundamentals Knowledge Graphs The Next Reincarnation Of The Semantic Web Mockup PDF. These are great for business strategies, office conferences, capital raising or task suggestions. If you desire to acquire more customers for your tech business and ensure they stay satisfied, create your own sales presentation with these plain slides.
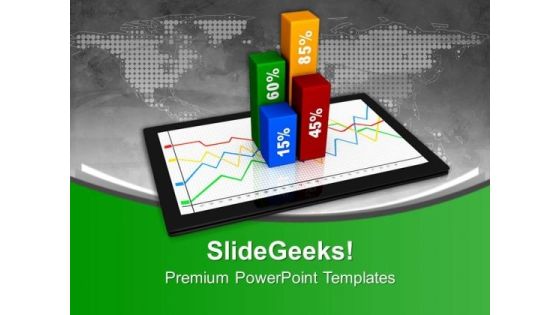
Business Chart And Graphs On Computer Tablet PowerPoint Templates Ppt Backgrounds For Slides 0113
We present our Business Chart And Graphs On Computer Tablet PowerPoint Templates PPT Backgrounds For Slides 0113.Download our Computer PowerPoint Templates because Our PowerPoint Templates and Slides are truly out of this world. Even the MIB duo has been keeping tabs on our team. Download our Pie charts PowerPoint Templates because It will get your audience in sync. Download and present our Marketing PowerPoint Templates because Our PowerPoint Templates and Slides will definately Enhance the stature of your presentation. Adorn the beauty of your thoughts with their colourful backgrounds. Download and present our Success PowerPoint Templates because It will Raise the bar of your Thoughts. They are programmed to take you to the next level. Download and present our Business PowerPoint Templates because Our PowerPoint Templates and Slides come in all colours, shades and hues. They help highlight every nuance of your views.Use these PowerPoint slides for presentations relating to computer tablet showing a spreadsheet with charts, computer, business, success, pie charts, marketing. The prominent colors used in the PowerPoint template are Green, Red, Gray. The feedback we get is that our Business Chart And Graphs On Computer Tablet PowerPoint Templates PPT Backgrounds For Slides 0113 are incredible easy to use. PowerPoint presentation experts tell us our charts PowerPoint templates and PPT Slides are readymade to fit into any presentation structure. Presenters tell us our Business Chart And Graphs On Computer Tablet PowerPoint Templates PPT Backgrounds For Slides 0113 effectively help you save your valuable time. PowerPoint presentation experts tell us our a PowerPoint templates and PPT Slides have awesome images to get your point across. The feedback we get is that our Business Chart And Graphs On Computer Tablet PowerPoint Templates PPT Backgrounds For Slides 0113 will make you look like a winner. Use our a PowerPoint templates and PPT Slides provide great value for your money. Be assured of finding the best projection to highlight your words.
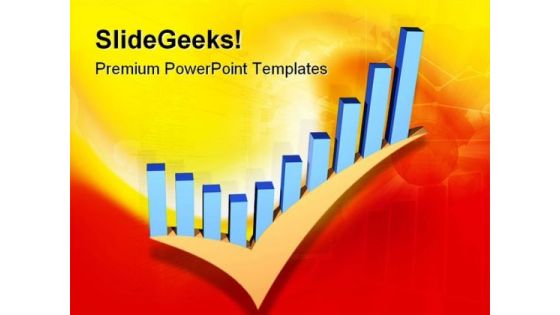
Business Graph With Check Metaphor PowerPoint Templates And PowerPoint Backgrounds 0511
Microsoft PowerPoint Template and Background with a combination of a check mark and financial graph

Business Graph With Check Metaphor PowerPoint Themes And PowerPoint Slides 0511
Microsoft PowerPoint Theme and Slide with a combination of a check mark and financial graph
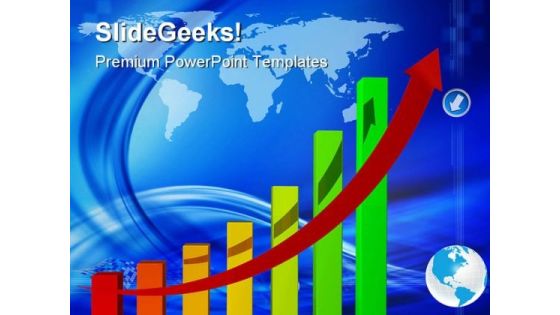
Statistique Of Business Graph Success PowerPoint Templates And PowerPoint Backgrounds 0411
Microsoft PowerPoint Template and Background with rainbow colored financial graph showing strong growth all the way up

Statistique Of Business Graph Success PowerPoint Themes And PowerPoint Slides 0411
Microsoft PowerPoint Theme and Slide with rainbow colored financial graph showing strong growth all the way up

Financial Arrows Chart Business PowerPoint Backgrounds And Templates 1210
Microsoft PowerPoint Template and Background with fine image 3d of financial business graph

Bar Graph Ppt PowerPoint Presentation Icon Inspiration
This is a bar graph ppt powerpoint presentation icon inspiration. This is a five stage process. The stages in this process are bar graph, financials, years, planning, business.

Bar Graph Ppt PowerPoint Presentation Layouts Layouts
This is a bar graph ppt powerpoint presentation layouts layouts. This is a five stage process. The stages in this process are product, financial years, business, graph, marketing.

Bar Graph Ppt PowerPoint Presentation Model Vector
This is a bar graph ppt powerpoint presentation model vector. This is a two stage process. The stages in this process are graph, financial, year, business, marketing.

Bar Graph Ppt PowerPoint Presentation Slides Designs
This is a bar graph ppt powerpoint presentation slides designs. This is a five stage process. The stages in this process are bar graph, business, marketing, plan, financial.

Organizational Financial Assets Assessment Financial Topics PDF
Deliver an awe-inspiring pitch with this creative organizational financial assets assessment financial topics pdf. bundle. Topics like minimum, medium, maximum can be discussed with this completely editable template. It is available for immediate download depending on the needs and requirements of the user.

Bar Graph Ppt PowerPoint Presentation Infographics Icon
This is a bar graph ppt powerpoint presentation infographics icon. This is a two stage process. The stages in this process are business, marketing, financial year, in percentage, graph.

Growth Graph New Business PowerPoint Templates And PowerPoint Backgrounds 0711
Microsoft PowerPoint Template and Background with graph of business and financial growth
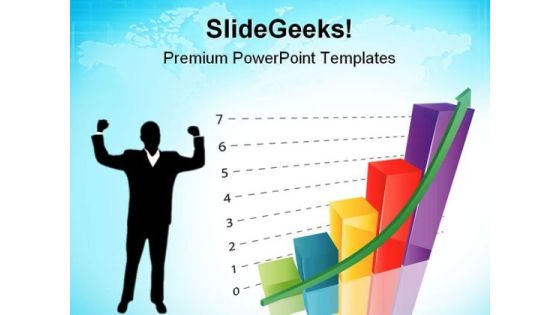
Growth Graph New Business PowerPoint Themes And PowerPoint Slides 0711
Microsoft PowerPoint Theme and Slide with graph of business and financial growth
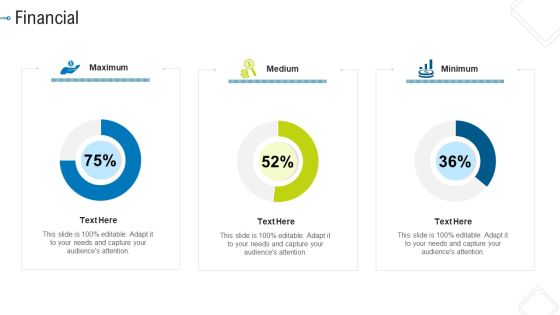
Financial Summary PDF
Deliver an awe inspiring pitch with this creative financial summary pdf bundle. Topics like maximum, medium, minimum can be discussed with this completely editable template. It is available for immediate download depending on the needs and requirements of the user.
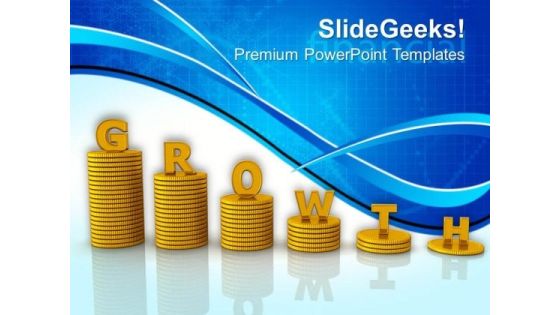
Financial Growth Business PowerPoint Templates And PowerPoint Themes 0912
Financial Growth Business PowerPoint Templates And PowerPoint Themes Presentations-Microsoft Powerpoint Templates and Background with coins business graph-Financial Growth Business PowerPoint Templates And PowerPoint Themes PresentationsThis PPT can be used for presentations relating to-Coins business graph, money, finance, business, success, marketing
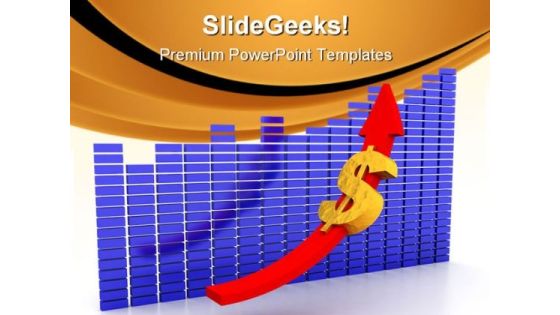
Up Arrow Dollar Finance PowerPoint Templates And PowerPoint Backgrounds 0611
Microsoft PowerPoint Template and Background with dollar on the increase against financial graphs

Illustration Of Dollar Growth Graph PowerPoint Template
This business slide contains graphics of dollar symbols on graph. This diagram helps to portray concept of financial planning. Present your views using this innovative slide and be assured of leaving a lasting impression.

Organization Reinvention Company Financial Performance Information PDF
This graph depicts the financial performance of the company wherein revenues, expenses and profit are evaluated. Deliver and pitch your topic in the best possible manner with this Organization Reinvention Company Financial Performance Information PDF. Use them to share invaluable insights on Expenses, Profit, Revenues and impress your audience. This template can be altered and modified as per your expectations. So, grab it now.

Bar Graph Ppt PowerPoint Presentation Model Graphic Tips
This is a bar graph ppt powerpoint presentation model graphic tips. This is a two stage process. The stages in this process are we are dollars in millions, financials years, bar graph, product, business.
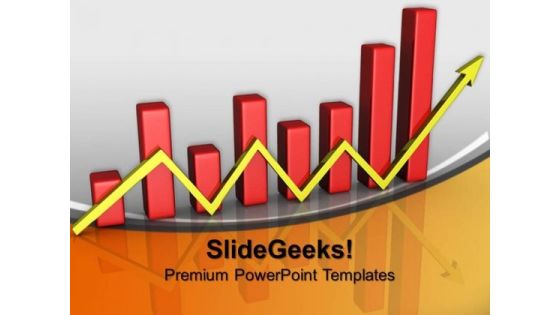
Finance Bar Graph With Arrow Business PowerPoint Templates And PowerPoint Themes 0912
Finance Bar Graph With Arrow Business PowerPoint Templates And PowerPoint Themes 0912-Microsoft Powerpoint Templates and Background with financial bar graph chart-Financial bar graph chart, business, arrows, marketing, finance, success
Economic Graph PowerPoint Icon C
economic graph blue background for business and finance
Economic Graph PowerPoint Icon S
economic graph blue background for business and finance
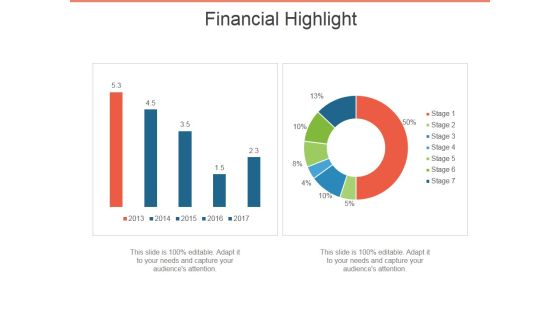
Financial Highlight Template 1 Ppt PowerPoint Presentation Ideas Themes
This is a financial highlight template 1 ppt powerpoint presentation ideas themes. This is a two stage process. The stages in this process are financial, highlight, business, bar graph, marketing.

Coverage Financial Ratios Chart For 5 Financial Years Themes PDF
This slide illustrates graph for coverage ratios that are interest coverage ratio, debt service coverage ratio and asset coverage ratio. It showcases comparison for a period of 5 years that can help company to measure ability to service its debt and meet its financial obligations Showcasing this set of slides titled coverage financial ratios chart for 5 financial years themes pdf. The topics addressed in these templates are coverage financial ratios chart for 5 financial years. All the content presented in this PPT design is completely editable. Download it and make adjustments in color, background, font etc. as per your unique business setting.

Financial PAR Key Financial Highlights Ppt Layouts Deck PDF
Deliver an awe inspiring pitch with this creative financial par key financial highlights ppt layouts deck pdf bundle. Topics like net sales in figures, operating profits in figures, dividend declared per share in figures, free cash flow in figures can be discussed with this completely editable template. It is available for immediate download depending on the needs and requirements of the user.
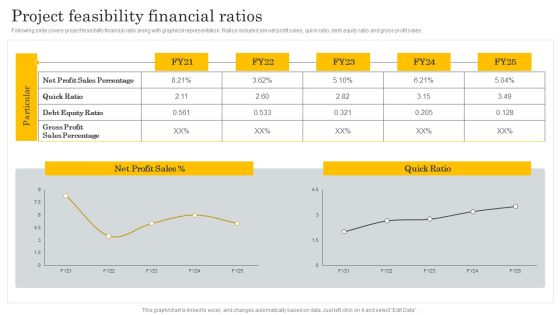
Financial Evaluation Report Project Feasibility Financial Ratios Mockup PDF
Following slide covers project feasibility financial ratio along with graphical representation. Ratios included are net profit sales, quick ratio, debt equity ratio and gross profit sales. Formulating a presentation can take up a lot of effort and time, so the content and message should always be the primary focus. The visuals of the PowerPoint can enhance the presenters message, so our Financial Evaluation Report Project Feasibility Financial Ratios Mockup PDF was created to help save time. Instead of worrying about the design, the presenter can concentrate on the message while our designers work on creating the ideal templates for whatever situation is needed. Slidegeeks has experts for everything from amazing designs to valuable content, we have put everything into Financial Evaluation Report Project Feasibility Financial Ratios Mockup PDF.

Financial Ppt Model Pictures PDF
Deliver and pitch your topic in the best possible manner with this financial ppt model pictures pdf. Use them to share invaluable insights on target, actual and impress your audience. This template can be altered and modified as per your expectations. So, grab it now.

 Home
Home