Financial Chart
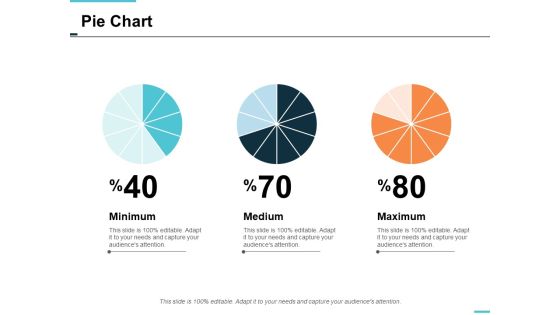
pie chart finance ppt powerpoint presentation styles skills
This is a pie chart finance ppt powerpoint presentation styles skills. This is a three stage process. The stages in this process are finance, marketing, management, investment, analysis.

Clustered Chart Finance Ppt PowerPoint Presentation Summary Guide
This is a clustered chart finance ppt powerpoint presentation summary guide. This is a three stage process. The stages in this process are finance, marketing, management, investment, analysis.

Combo Chart Finance Ppt PowerPoint Presentation Portfolio Guidelines
This is a combo chart finance ppt powerpoint presentation portfolio guidelines. This is a three stage process. The stages in this process are finance, marketing, management, investment, analysis.
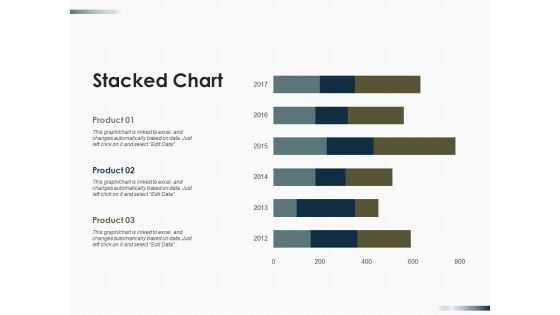
Stacked Chart Finance Ppt PowerPoint Presentation Outline Infographics
This is a stacked chart finance ppt powerpoint presentation outline infographics. This is a three stage process. The stages in this process are finance, marketing, management, investment, analysis.

Stacked Column Chart Ppt PowerPoint Presentation Slides Files
This is a stacked column chart ppt powerpoint presentation slides files. This is a three stage process. The stages in this process are percentage, product, business, marketing.

Area Chart Contribution Ppt PowerPoint Presentation Gallery Structure
This is a area chart contribution ppt powerpoint presentation gallery structure. This is a three stage process. The stages in this process are business, management, strategy, analysis, marketing.

Donut Chart Management Ppt Powerpoint Presentation Slides Aids
This is a donut chart management ppt powerpoint presentation slides aids. This is a six stage process. The stages in this process are finance, marketing, management, investment, analysis.

Column Chart Finance Ppt Powerpoint Presentation Summary Visuals
This is a column chart finance ppt powerpoint presentation summary visuals. This is a four stage process. The stages in this process are finance, marketing, management, investment, analysis.

area chart finance ppt powerpoint presentation layouts ideas
This is a area chart finance ppt powerpoint presentation layouts ideas. This is a three stage process. The stages in this process are finance, marketing, management, investment, analysis.
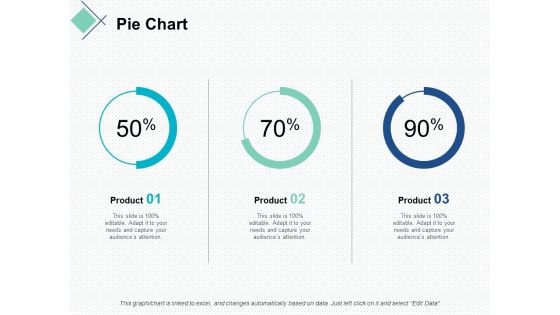
pie chart finance marketing ppt powerpoint presentation slides demonstration
This is a pie chart finance marketing ppt powerpoint presentation slides demonstration. This is a stage process. The stages in this process are finance, marketing, management, investment, analysis.

Column Chart Finance Ppt Powerpoint Presentation Gallery Maker
This is a column chart finance ppt powerpoint presentation gallery maker. This is a two stage process. The stages in this process are finance, marketing, management, investment, analysis.

Stock Chart Graph Ppt PowerPoint Presentation Ideas Demonstration
This is a stock chart graph ppt powerpoint presentation ideas demonstration. This is a three stage process. The stages in this process are finance, marketing, management, investment, analysis.
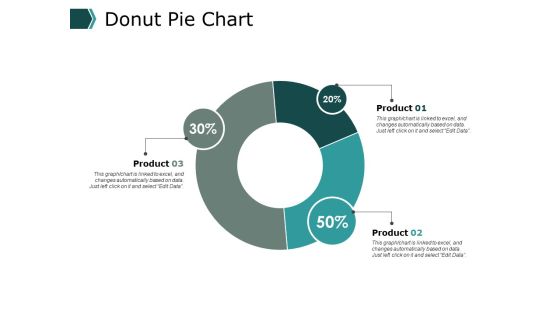
Donut Pie Chart Ppt PowerPoint Presentation Model Deck
This is a donut pie chart ppt powerpoint presentation model deck. This is a three stage process. The stages in this process are finance, marketing, management, investment, analysis.

Column Chart Finance Ppt Powerpoint Presentation Styles Examples
This is a column chart finance ppt powerpoint presentation styles examples. This is a two stage process. The stages in this process are finance, marketing, management, investment, analysis.

Column Chart Finance Ppt PowerPoint Presentation Summary Grid
This is a column chart finance ppt powerpoint presentation summary grid. This is a three stage process. The stages in this process are finance, marketing, management, investment, analysis.

Area Chart Finance Ppt PowerPoint Presentation Summary Structure
This is a area chart finance ppt powerpoint presentation summary structure. This is a two stage process. The stages in this process are finance, marketing, management, investment, analysis.

Pie Chart Finance Ppt PowerPoint Presentation Ideas Templates
This is a pie chart finance ppt powerpoint presentation ideas templates. This is a three stage process. The stages in this process are finance, marketing, management, investment, analysis.
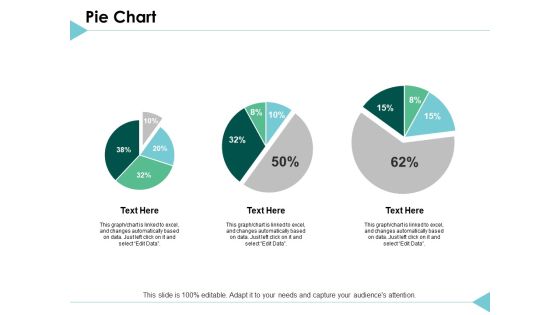
Pie Chart Finance Ppt PowerPoint Presentation Styles Templates
This is a pie chart finance ppt powerpoint presentation styles templates. This is a three stage process. The stages in this process are finance, marketing, analysis, investment, million.

Area Chart Finance Ppt PowerPoint Presentation Outline Structure
This is a area chart finance ppt powerpoint presentation outline structure. This is a three stage process. The stages in this process are finance, marketing, analysis, investment, million.

Clustered Chart Graph Ppt PowerPoint Presentation Gallery Backgrounds
This is a clustered chart graph ppt powerpoint presentation gallery backgrounds. This is a three stage process. The stages in this process are finance, marketing, analysis, investment, million.

Area Chart Finance Ppt PowerPoint Presentation Gallery Information
This is a area chart finance ppt powerpoint presentation gallery information. This is a three stage process. The stages in this process are finance, marketing, analysis, investment, million.

Combo Chart Graph Ppt PowerPoint Presentation Professional Guidelines
This is a combo chart graph ppt powerpoint presentation professional guidelines. This is a three stage process. The stages in this process are finance, marketing, analysis, investment, million.

Pie Chart Bar Ppt PowerPoint Presentation Layouts Examples
This is a pie chart bar ppt powerpoint presentation layouts examples. This is a three stage process. The stages in this process are finance, marketing, analysis, investment, million.

Pie Chart Finance Ppt Powerpoint Presentation Gallery Templates
This is a pie chart finance ppt powerpoint presentation gallery templates. This is a four stage process. The stages in this process are finance, marketing, management, investment, analysis.

Column Chart Finance Ppt Powerpoint Presentation Inspiration Images
This is a column chart finance ppt powerpoint presentation inspiration images. This is a two stage process. The stages in this process are finance, marketing, management, investment, analysis.

Combo Chart Finance Ppt Powerpoint Presentation Ideas Slides
This is a combo chart finance ppt powerpoint presentation ideas slides. This is a three stage process. The stages in this process are finance, marketing, management, investment, analysis.
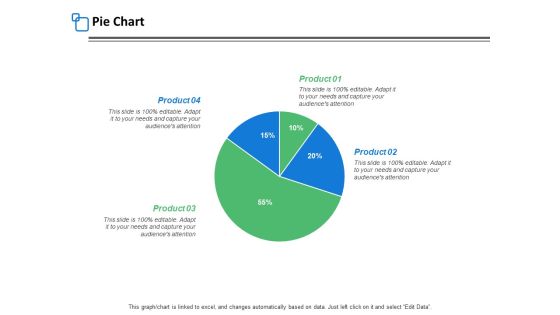
Pie Chart Finance Ppt PowerPoint Presentation Inspiration Templates
This is a pie chart finance ppt powerpoint presentation inspiration templates. This is a four stage process. The stages in this process are finance, marketing, management, investment, analysis.

Monetary Incentive Icon In Programs Chart Ideas PDF
Persuade your audience using this Monetary Incentive Icon In Programs Chart Ideas PDF. This PPT design covers three stages, thus making it a great tool to use. It also caters to a variety of topics including Monetary Incentive Icon, Programs Chart. Download this PPT design now to present a convincing pitch that not only emphasizes the topic but also showcases your presentation skills.

Product Marketing Budget Spend Pie Chart Icon Designs PDF
Presenting Product Marketing Budget Spend Pie Chart Icon Designs PDF to dispense important information. This template comprises Three stages. It also presents valuable insights into the topics including Product Marketing, Budget Spend, Pie Chart Icon. This is a completely customizable PowerPoint theme that can be put to use immediately. So, download it and address the topic impactfully.

Compensation Statement Icon In Incentive Programs Chart Brochure PDF
Presenting Compensation Statement Icon In Incentive Programs Chart Brochure PDF to dispense important information. This template comprises three stages. It also presents valuable insights into the topics including Compensation Statement Icon, Incentive Programs Chart. This is a completely customizable PowerPoint theme that can be put to use immediately. So, download it and address the topic impactfully.
Price Catalogue Chart Icon Of Product Comparison Slides PDF
Presenting price catalogue chart icon of product comparison slides pdf to dispense important information. This template comprises three stages. It also presents valuable insights into the topics including price catalogue chart icon of product comparison. This is a completely customizable PowerPoint theme that can be put to use immediately. So, download it and address the topic impactfully.
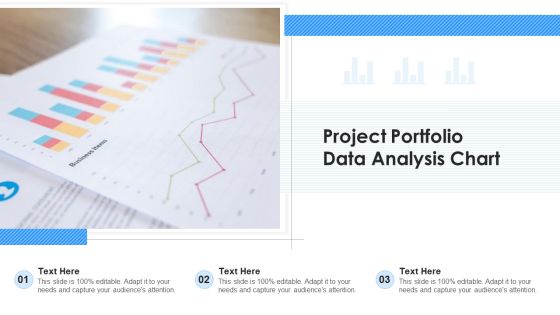
Project Portfolio Data Analysis Chart Ppt Ideas Gallery PDF
Presenting project portfolio data analysis chart ppt ideas gallery pdf to dispense important information. This template comprises three stages. It also presents valuable insights into the topics including project portfolio data analysis chart. This is a completely customizable PowerPoint theme that can be put to use immediately. So, download it and address the topic impactfully.

Reach Your Target Audience Pie Chart Ppt Show Model PDF
This is a reach your target audience pie chart ppt show model pdf template with various stages. Focus and dispense information on four stages using this creative set, that comes with editable features. It contains large content boxes to add your information on topics like pie chart. You can also showcase facts, figures, and other relevant content using this PPT layout. Grab it now.
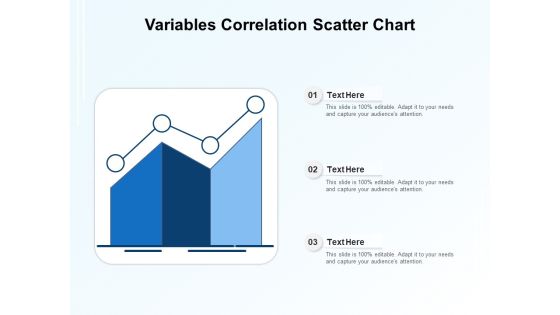
Variables Correlation Scatter Chart Ppt PowerPoint Presentation Model Smartart PDF
Presenting variables correlation scatter chart ppt powerpoint presentation model smartart pdf to dispense important information. This template comprises three stages. It also presents valuable insights into the topics including variables correlation scatter chart. This is a completely customizable PowerPoint theme that can be put to use immediately. So, download it and address the topic impactfully.

Business Objective Presentation Chart Of Provenance Data Download PDF
Presenting business objective presentation chart of provenance data download pdf to dispense important information. This template comprises five stages. It also presents valuable insights into the topics including business objective presentation chart of provenance data. This is a completely customizable PowerPoint theme that can be put to use immediately. So, download it and address the topic impactfully.

Statistical Data Analysis Chart Of Collected Data Formats PDF
Presenting statistical data analysis chart of collected data formats pdf to dispense important information. This template comprises four stages. It also presents valuable insights into the topics including statistical data analysis chart of collected data. This is a completely customizable PowerPoint theme that can be put to use immediately. So, download it and address the topic impactfully.
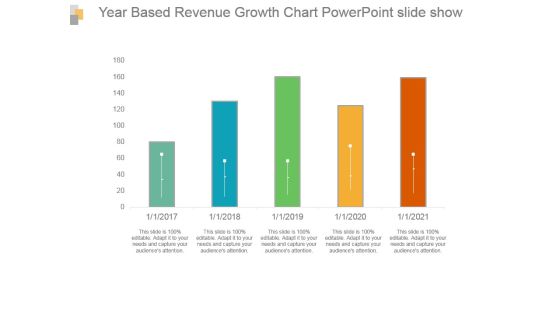
Year Based Revenue Growth Chart Powerpoint Slide Show
This is a year based revenue growth chart powerpoint slide show. This is a five stage process. The stages in this process are bar graph, growth, revenue, year, success.

Column Chart Sample Budget Ppt Ppt PowerPoint Presentation Infographics Brochure
This is a column chart sample budget ppt ppt powerpoint presentation infographics brochure. This is a two stage process. The stages in this process are business, management, strategy, analysis, marketing.

Gantt Chart For Change Management Training Calendar Diagrams PDF
This slide displays Gantt chart for change management training, planning and scheduling in organization. It includes details about target audience, workshops, training and communications. Presenting Gantt Chart For Change Management Training Calendar Diagrams PDF to dispense important information. This template comprises one stages. It also presents valuable insights into the topics including Targeted Audience, Workshops, Training, Communications. This is a completely customizable PowerPoint theme that can be put to use immediately. So, download it and address the topic impactfully.

Scatter Bubble Chart Graph Ppt PowerPoint Presentation Infographic Template Maker
This is a scatter bubble chart graph ppt powerpoint presentation infographic template maker. This is a two stage process. The stages in this process are finance, marketing, management, investment, analysis.

Combo Chart Graph Ppt PowerPoint Presentation Infographic Template Layout Ideas
This is a combo chart graph ppt powerpoint presentation infographic template layout ideas. This is a three stage process. The stages in this process are finance, marketing, analysis, investment, million.

Volume Open High Low Close Chart Ppt PowerPoint Presentation Themes
This is a volume open high low close chart ppt powerpoint presentation themes. This is a five stage process. The stages in this process are high, volume, close, low.

Stacked Line Chart Finance Ppt Powerpoint Presentation Outline Themes
This is a stacked line chart finance ppt powerpoint presentation outline themes. This is a two stage process. The stages in this process are finance, marketing, management, investment, analysis.

Quality Cost Report Trend Chart Ppt PowerPoint Presentation Pictures Themes
This is a quality cost report trend chart ppt powerpoint presentation pictures themes. This is a four stage process. The stages in this process are finance, strategy, marketing, management, business.

Circle Chart For Business Strategy Plan Powerpoint Slides
This PowerPoint template has been designed with four steps circle chart with finance icons. This PPT slide can be used to display business strategy plan. You can download finance PowerPoint template to prepare awesome presentations.

Scatter Bubble Chart Ppt PowerPoint Presentation Diagram Ppt
This is a scatter bubble chart ppt powerpoint presentation diagram ppt. This is a two stage process. The stages in this process are product, in price, highest sale, percentage, business, marketing.

Donut Pie Chart Product Finance Ppt PowerPoint Presentation Diagram Ppt
This is a donut pie chart product finance ppt powerpoint presentation diagram ppt. This is a three stage process. The stages in this process are finance, management, strategy, analysis, marketing.

Bubble Chart Employee Value Proposition Ppt PowerPoint Presentation Icon Sample
This is a bubble chart employee value proposition ppt powerpoint presentation icon sample. This is a two stage process. The stages in this process are business, management, strategy, analysis, marketing.

Combo Chart Marketing Analysis Ppt Powerpoint Presentation Pictures Icons
This is a combo chart marketing analysis ppt powerpoint presentation pictures icons. This is a three stage process. The stages in this process are finance, marketing, management, investment, analysis.

Clustered Bar Chart Finance Ppt Powerpoint Presentation Icon Graphics Template
This is a clustered bar chart finance ppt powerpoint presentation icon graphics template. This is a four stage process. The stages in this process are finance, marketing, management, investment, analysis.

Scatter Bubble Chart Ppt PowerPoint Presentation Inspiration Backgrounds
This is a scatter bubble chart ppt powerpoint presentation inspiration backgrounds. This is a five stage process. The stages in this process are highest sale, in price, business, marketing, success.

Staked Line Chart Ppt PowerPoint Presentation Model Graphics Download
This is a staked line chart ppt powerpoint presentation model graphics download. This is a two stage process. The stages in this process are business, marketing, growth, finance, management.
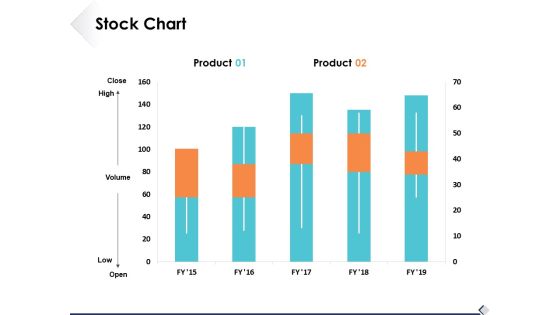
Stock Chart Finance Ppt PowerPoint Presentation Styles Background Image
This is a stock chart finance ppt powerpoint presentation styles background image. This is a two stage process. The stages in this process are analysis, marketing, icons, finance, strategy.

Scatter Bubble Chart Template Ppt PowerPoint Presentation Professional Background
This is a scatter bubble chart template ppt powerpoint presentation professional background. This is a six stage process. The stages in this process are business, marketing, strategy, planning, finance.

Basic Gap Analysis Chart Ppt PowerPoint Presentation Pictures Design Ideas
This is a basic gap analysis chart ppt powerpoint presentation pictures design ideas. This is a five stage process. The stages in this process are business, finance, marketing, analysis, investment.

High Low Close Chart Ppt PowerPoint Presentation Professional Background Images
This is a high low close chart ppt powerpoint presentation professional background images. This is a five stage process. The stages in this process are close, high, volume, low, open.

Volume High Low Close Chart Ppt PowerPoint Presentation Outline Examples
This is a volume high low close chart ppt powerpoint presentation outline examples. This is a five stage process. The stages in this process are high, low, volume, graph, business.

Scatter Bubble Chart Ppt PowerPoint Presentation Infographics Backgrounds
This is a scatter bubble chart ppt powerpoint presentation infographics backgrounds. This is a five stage process. The stages in this process are highest sale, in price, growth, success, business.
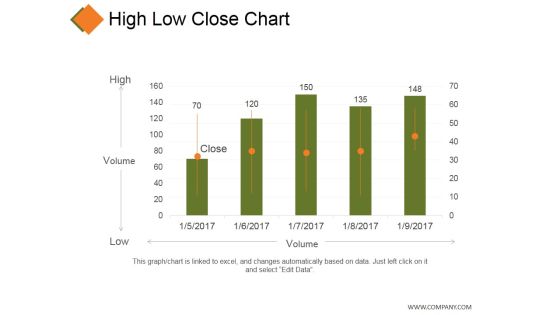
High Low Close Chart Ppt PowerPoint Presentation Model Grid
This is a high low close chart ppt powerpoint presentation model grid. This is a five stage process. The stages in this process are business, high, volume, low, marketing.

Line Bubble Chart Ppt PowerPoint Presentation Professional Infographic Template
This is a line bubble chart ppt powerpoint presentation professional infographic template. This is a five stage process. The stages in this process are product, in price, highest sale, business, finance.

High Low Close Chart Ppt PowerPoint Presentation Styles Display
This is a high low close chart ppt powerpoint presentation styles display. This is a ten stage process. The stages in this process are high, volume, low, close, finance.

Stock Chart Ppt PowerPoint Presentation Outline Graphics Example
This is a stock chart ppt powerpoint presentation outline graphics example. This is a five stage process. The stages in this process are close, volume, low, high, open, product.
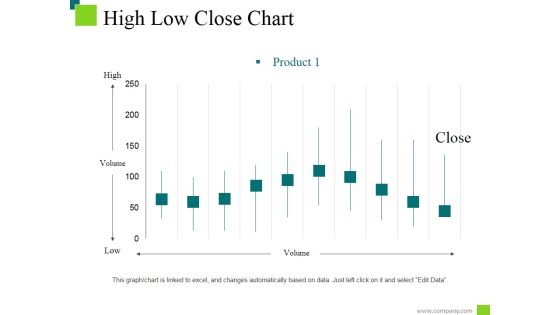
High Low Close Chart Ppt PowerPoint Presentation Styles Information
This is a high low close chart ppt powerpoint presentation styles information. This is a ten stage process. The stages in this process are low, high, product, volume, close.
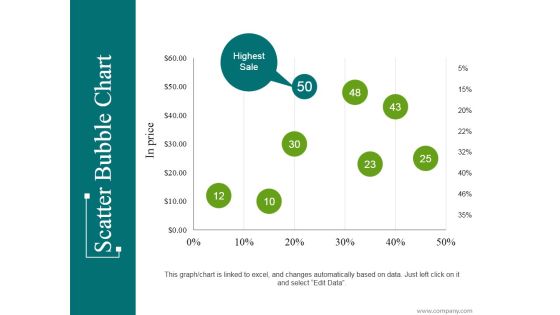
Scatter Bubble Chart Ppt PowerPoint Presentation Infographic Template Introduction
This is a scatter bubble chart ppt powerpoint presentation infographic template introduction. This is a eight stage process. The stages in this process are highest sale, business, marketing, percentage, finance.
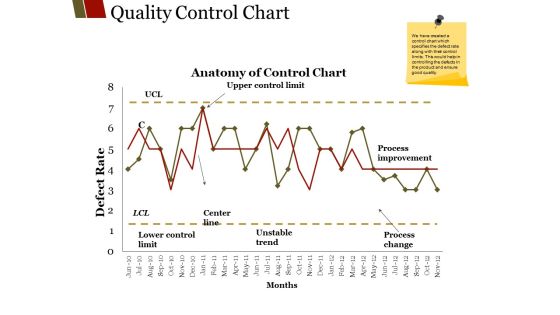
Quality Control Chart Ppt PowerPoint Presentation File Graphics Design
This is a quality control chart ppt powerpoint presentation file graphics design. This is a two stage process. The stages in this process are unstable trend, months center line, lower control limit, process improvement.
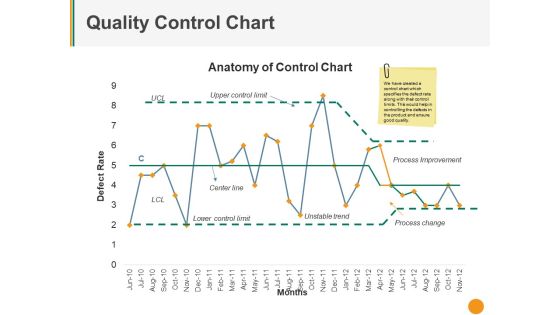
Quality Control Chart Ppt PowerPoint Presentation Pictures Deck
This is a quality control chart ppt powerpoint presentation pictures deck. This is a one stage process. The stages in this process are upper control limit, center line, unstable trend, process improvement, process change.
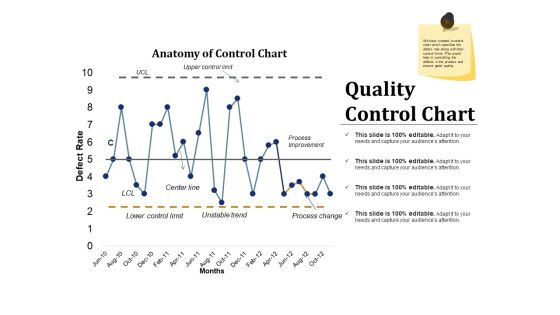
Quality Control Chart Ppt PowerPoint Presentation Inspiration Example Introduction
This is a quality control chart ppt powerpoint presentation inspiration example introduction. This is a two stage process. The stages in this process are process improvement, process change, unstable trend, lower control limit, center line.
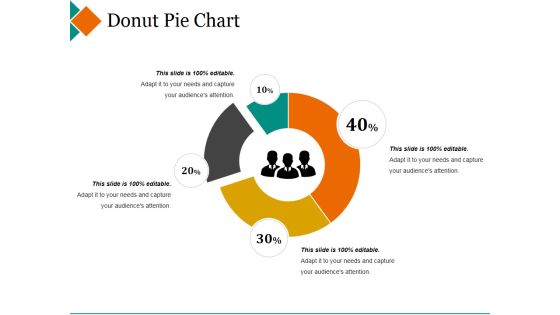
Donut Pie Chart Ppt PowerPoint Presentation Pictures Design Inspiration
This is a donut pie chart ppt powerpoint presentation pictures design inspiration. This is a four stage process. The stages in this process are maximum, donut, minimum, percentage, finance.

Column Chart Ppt PowerPoint Presentation Infographic Template Example File
This is a column chart ppt powerpoint presentation infographic template example file. This is a two stage process. The stages in this process are growth, finance, business, marketing, analysis.

Donut Pie Chart Ppt PowerPoint Presentation Professional Graphic Images
This is a donut pie chart ppt powerpoint presentation professional graphic images. This is a three stage process. The stages in this process are percentage, finance, donut, business, marketing.

Scatter Bubble Chart Ppt PowerPoint Presentation Inspiration Graphics Tutorials
This is a scatter bubble chart ppt powerpoint presentation inspiration graphics tutorials. This is a two stage process. The stages in this process are finance, marketing, management, investment, analysis.

Area Chart Ppt PowerPoint Presentation Infographic Template Clipart Images
This is a area chart ppt powerpoint presentation infographic template clipart images. This is a two stage process. The stages in this process are finance, marketing, management, investment, analysis.
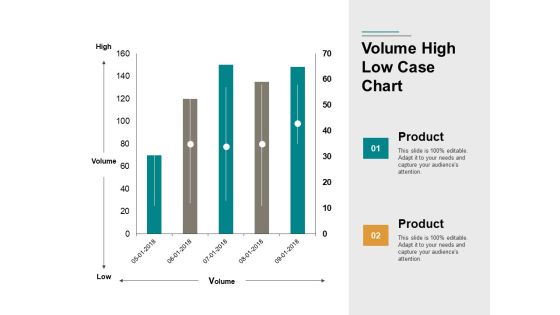
Volume High Low Case Chart Ppt PowerPoint Presentation Portfolio Images
This is a volume high low case chart ppt powerpoint presentation portfolio images. This is a two stage process. The stages in this process are finance, business, marketing, management.

Bar Chart Ppt PowerPoint Presentation Infographic Template Graphics Design
This is a bar chart ppt powerpoint presentation infographic template graphics design. This is a five stage process. The stages in this process are management, marketing, business, percentage, product.
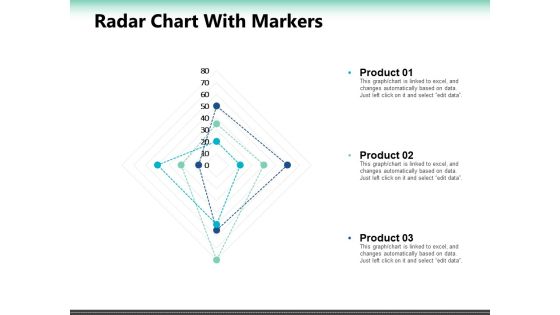
Radar Chart With Markers Ppt PowerPoint Presentation Summary Slide Portrait
This is a radar chart with markers ppt powerpoint presentation summary slide portrait. This is a seven stage process. The stages in this process are percentage, product, business, marketing.

Bubble Chart Finance Ppt PowerPoint Presentation File Master Slide
This is a bubble chart finance ppt powerpoint presentation file master slide. This is a three stage process. The stages in this process are finance, marketing, management, investment, analysis.

Area Chart Talent Mapping Ppt PowerPoint Presentation Ideas Vector
This is a area chart talent mapping ppt powerpoint presentation ideas vector. This is a three stage process. The stages in this process are business, management, strategy, analysis, marketing.

Combo Chart Talent Mapping Ppt PowerPoint Presentation Inspiration Display
This is a combo chart talent mapping ppt powerpoint presentation inspiration display. This is a three stage process. The stages in this process are business, management, strategy, analysis, marketing.

Area Chart Product Marketing Ppt PowerPoint Presentation Layouts Portfolio
This is a area chart product marketing ppt powerpoint presentation layouts portfolio. This is a three stage process. The stages in this process are business, management, strategy, analysis, marketing.

Combo Chart Strategy Approaches Ppt PowerPoint Presentation Inspiration Layout Ideas
This is a combo chart strategy approaches ppt powerpoint presentation inspiration layout ideas. This is a three stage process. The stages in this process are business, management, strategy, analysis, marketing.

Volume High Low Close Chart Ppt PowerPoint Presentation Pictures Objects
This is a volume high low close chart ppt powerpoint presentation pictures objects. This is a one stage process. The stages in this process are finance, marketing, management, investment, analysis.

Project Status Bar Chart Ppt PowerPoint Presentation Ideas Objects
This is a project status bar chart ppt powerpoint presentation ideas objects. This is a four stage process. The stages in this process are project management, project progress, project growth.
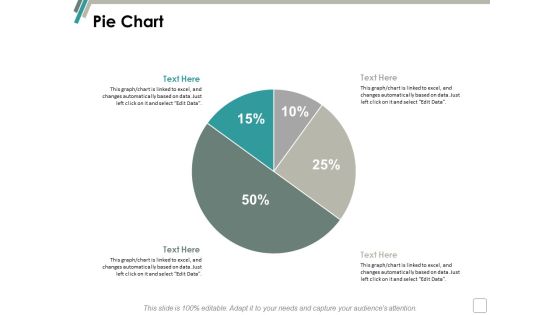
Pie Chart Finance Marketing Ppt Powerpoint Presentation Infographics Background
This is a pie chart finance marketing ppt powerpoint presentation infographics background. This is a two stage process. The stages in this process are finance, marketing, management, investment, analysis.

Volume High Low Close Chart Ppt Powerpoint Presentation Slides Images
This is a volume high low close chart ppt powerpoint presentation slides images. This is a five stage process. The stages in this process are finance, marketing, management, investment, analysis.

Area Chart Finance Marketing Ppt Powerpoint Presentation Gallery Slides
This is a area chart finance marketing ppt powerpoint presentation gallery slides. This is a three stage process. The stages in this process are finance, marketing, management, investment, analysis.
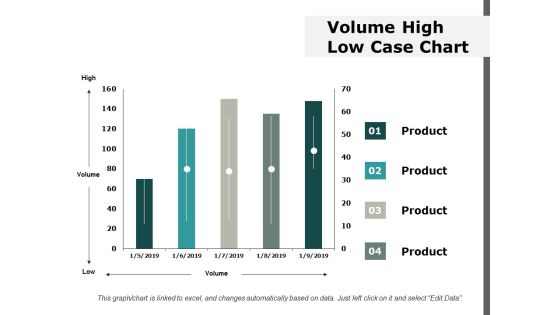
Volume High Low Case Chart Ppt Powerpoint Presentation Ideas Information
This is a volume high low case chart ppt powerpoint presentation ideas information. This is a four stage process. The stages in this process are finance, marketing, management, investment, analysis.

Scatter Chart Analysis Marketing Ppt Powerpoint Presentation Summary Infographic Template
This is a scatter chart analysis marketing ppt powerpoint presentation summary infographic template. This is a two stage process. The stages in this process are finance, marketing, management, investment, analysis.

Stacked Column Chart Analysis Ppt PowerPoint Presentation Slides Graphics Design
This is a stacked column chart analysis ppt powerpoint presentation slides graphics design. This is a three stage process. The stages in this process are finance, marketing, management, investment, analysis.

Bar Chart Finance Marketing Ppt Powerpoint Presentation Gallery Grid
This is a bar chart finance marketing ppt powerpoint presentation gallery grid. This is a three stage process. The stages in this process are finance, marketing, management, investment, analysis.

Donut Pie Chart Finance Ppt Powerpoint Presentation Outline Vector
This is a donut pie chart finance ppt powerpoint presentation outline vector. This is a four stage process. The stages in this process are finance, marketing, management, investment, analysis.

area chart finance ppt powerpoint presentation portfolio graphics download
This is a area chart finance ppt powerpoint presentation portfolio graphics download. This is a two stage process. The stages in this process are finance, marketing, management, investment, analysis.

Pie Chart Finance Ppt Powerpoint Presentation Layouts Design Ideas
This is a pie chart finance ppt powerpoint presentation layouts design ideas. This is a four stage process. The stages in this process are finance, marketing, management, investment, analysis.

Bubble Chart Marketing Business Ppt PowerPoint Presentation Model Sample
This is a bubble chart marketing business ppt powerpoint presentation model sample. This is a two stage process. The stages in this process are finance, business, management, strategy, analysis.
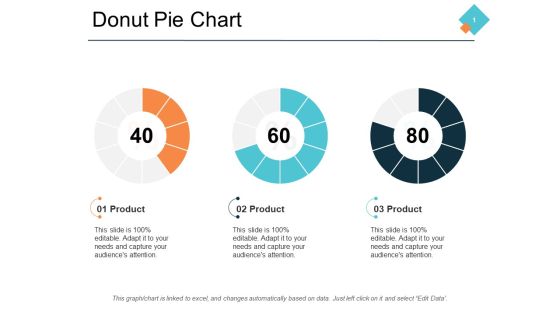
Donut Pie Chart Finance Ppt PowerPoint Presentation Portfolio Model
This is a donut pie chart finance ppt powerpoint presentation portfolio model. This is a three stage process. The stages in this process are finance, management, strategy, analysis, marketing.

Area Chart Finance Ppt PowerPoint Presentation Infographic Template Model
This is a area chart finance ppt powerpoint presentation infographic template model. This is a two stage process. The stages in this process are finance, marketing, management, investment, analysis.

Bar Chart Business Management Ppt PowerPoint Presentation Ideas Example Introduction
This is a bar chart business management ppt powerpoint presentation ideas example introduction. This is a three stage process. The stages in this process are finance, marketing, management, investment, analysis.

Column Chart And Graph Ppt PowerPoint Presentation File Introduction
This is a column chart and graph ppt powerpoint presentation file introduction. This is a three stage process. The stages in this process are finance, marketing, management, investment, analysis.

Area Chart Finance Marketing Ppt Powerpoint Presentation Show Grid
This is a area chart finance marketing ppt powerpoint presentation show grid. This is a three stage process. The stages in this process are finance, marketing, management, investment, analysis.

Area Chart Finance Ppt PowerPoint Presentation Infographic Template Graphics Template
This is a area chart finance ppt powerpoint presentation infographic template graphics template. This is a two stage process. The stages in this process are finance, marketing, management, investment, analysis.

Combo Chart Finance Ppt PowerPoint Presentation Summary Design Ideas
This is a combo chart finance ppt powerpoint presentation summary design ideas. This is a three stage process. The stages in this process are finance, marketing, management, investment, analysis.

Donut Pie Chart Graph Ppt PowerPoint Presentation File Styles
This is a donut pie chart graph ppt powerpoint presentation file styles. This is a three stage process. The stages in this process are finance, marketing, management, investment, analysis.

Donut Pie Chart Graph Ppt PowerPoint Presentation Ideas Guidelines
This is a donut pie chart graph ppt powerpoint presentation ideas guidelines. This is a three stage process. The stages in this process are finance, marketing, management, investment, analysis.
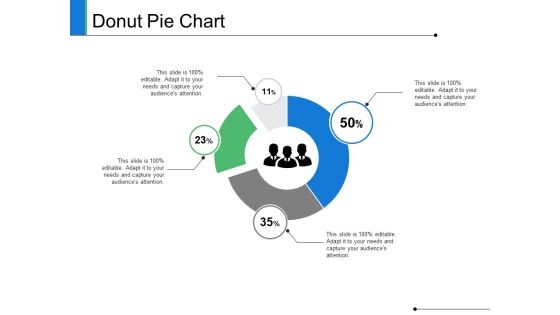
Donut Pie Chart Finance Ppt PowerPoint Presentation Styles Deck
This is a donut pie chart finance ppt powerpoint presentation styles deck. This is a four stage process. The stages in this process are finance, marketing, management, investment, analysis.
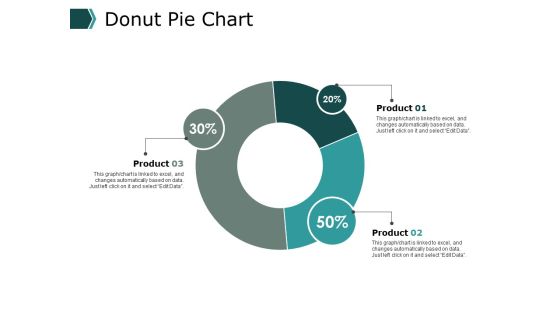
Donut Pie Chart Finance Ppt PowerPoint Presentation File Slide Download
This is a donut pie chart finance ppt powerpoint presentation file slide download. This is a three stage process. The stages in this process are finance, marketing, management, investment, analysis.

Combo Chart Graph Ppt PowerPoint Presentation Gallery Designs Download
This is a combo chart graph ppt powerpoint presentation gallery designs download. This is a three stage process. The stages in this process are finance, marketing, analysis, investment, million.
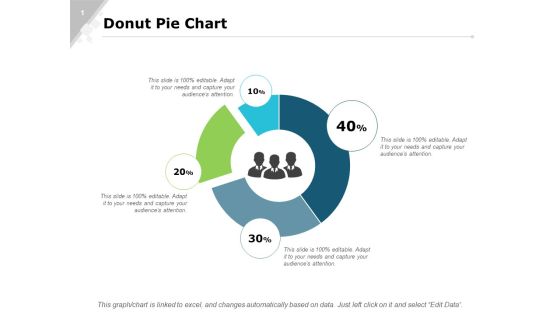
Donut Pie Chart Bar Ppt PowerPoint Presentation Infographics Slide Portrait
This is a donut pie chart bar ppt powerpoint presentation infographics slide portrait. This is a four stage process. The stages in this process are finance, marketing, analysis, investment, million.

Area Chart Graph Ppt PowerPoint Presentation Professional Format Ideas
This is a column chart graph ppt powerpoint presentation slides file formats. This is a stage three process. The stages in this process are finance, marketing, analysis, investment, million.

Combo Chart Marketing Ppt Powerpoint Presentation Ideas Format Ideas Cpb
This is a combo chart marketing ppt powerpoint presentation ideas format ideas cpb. This is a three stage process. The stages in this process are finance, marketing, management, investment, analysis.

Donut Pie Chart Finance Ppt PowerPoint Presentation Styles Summary
This is a donut pie chart finance ppt powerpoint presentation styles summary. This is a three stage process. The stages in this process are finance, marketing, management, investment, analysis.
Pie Chart Icon For Yearly Earning Breakup Portrait PDF
Persuade your audience using this Pie Chart Icon For Yearly Earning Breakup Portrait PDF. This PPT design covers Three stages, thus making it a great tool to use. It also caters to a variety of topics including Pie Chart Icon, Yearly Earning Breakup. Download this PPT design now to present a convincing pitch that not only emphasizes the topic but also showcases your presentation skills.
Price Catalogue Chart Icon Of Automobile Company Demonstration PDF
Persuade your audience using this price catalogue chart icon of automobile company demonstration pdf. This PPT design covers three stages, thus making it a great tool to use. It also caters to a variety of topics including price catalogue chart icon of automobile company. Download this PPT design now to present a convincing pitch that not only emphasizes the topic but also showcases your presentation skills.
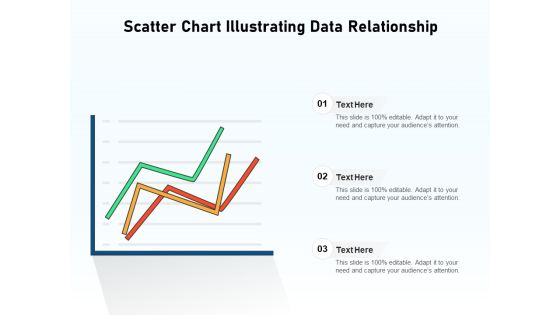
Scatter Chart Illustrating Data Relationship Ppt PowerPoint Presentation Microsoft PDF
Persuade your audience using this scatter chart illustrating data relationship ppt powerpoint presentation microsoft pdf. This PPT design covers three stages, thus making it a great tool to use. It also caters to a variety of topics including scatter chart illustrating data relationship. Download this PPT design now to present a convincing pitch that not only emphasizes the topic but also showcases your presentation skills.
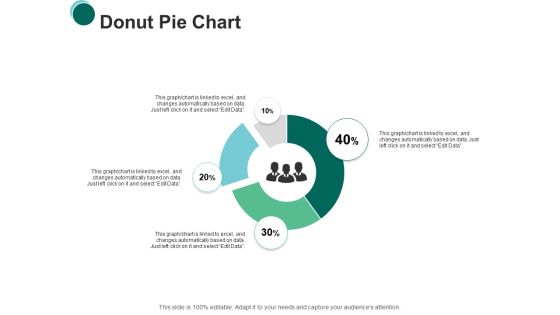
Donut Pie Chart Finance Ppt PowerPoint Presentation Infographics Slides
Presenting this set of slides with name donut pie chart finance ppt powerpoint presentation infographics slides. This is a four stage process. The stages in this process are finance, marketing, management, investment, analysis. This is a completely editable PowerPoint presentation and is available for immediate download. Download now and impress your audience.

Quantitative Bar Chart For Data Analysis Ppt PowerPoint Presentation Model Graphic Tips
This is a quantitative bar chart for data analysis ppt powerpoint presentation model graphic tips. This is a two stage process. The stages in this process are financial analysis, quantitative, statistical modelling.

Area Chart Ppt PowerPoint Presentation Pictures Graphics Design
This is a area chart ppt powerpoint presentation pictures graphics design. This is a two stage process. The stages in this process are charts, success, finance, percentage, growth.
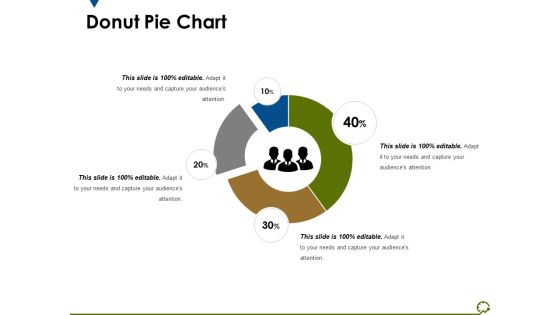
Donut Pie Chart Ppt PowerPoint Presentation Show Styles
This is a donut pie chart ppt powerpoint presentation show styles. This is a four stage process. The stages in this process are chart, business, process, management, percentage.

Data Analysis Chart For Funds Management Ppt PowerPoint Presentation Infographic Template Files
This is a data analysis chart for funds management ppt powerpoint presentation infographic template files. This is a five stage process. The stages in this process are financial analysis, quantitative, statistical modelling.

Data Chart For Distribution Of Vehicles By Origin And Type Ppt PowerPoint Presentation Infographics Topics
This is a data chart for distribution of vehicles by origin and type ppt powerpoint presentation infographics topics. This is a four stage process. The stages in this process are financial analysis, quantitative, statistical modelling.

Data Chart For Individual Income Analysis Ppt PowerPoint Presentation Layouts Visual Aids
This is a data chart for individual income analysis ppt powerpoint presentation layouts visual aids. This is a five stage process. The stages in this process are financial analysis, quantitative, statistical modelling.
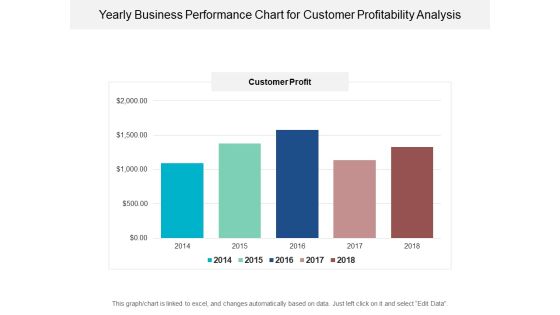
Yearly Business Performance Chart For Customer Profitability Analysis Ppt PowerPoint Presentation Ideas Picture
This is a yearly business performance chart for customer profitability analysis ppt powerpoint presentation ideas picture. This is a five stage process. The stages in this process are financial analysis, quantitative, statistical modelling.
Agricultural Business Company Profile Organization Chart Icons PDF
This slide highlights the organization chart of agricultural company which includes founder, CEO, EVP of retail products, fertilizer products, chief financial officer, chief legal officer, corporate development and strategy.This is a Agricultural Business Company Profile Organization Chart Icons PDF template with various stages. Focus and dispense information on four stages using this creative set, that comes with editable features. It contains large content boxes to add your information on topics like Development And Strategy, Fertilizer Products, Administrative You can also showcase facts, figures, and other relevant content using this PPT layout. Grab it now.
Farming Business Company Profile Organization Chart Icons PDF
This slide highlights the organization chart of agricultural company which includes founder, CEO, EVP of retail products, fertilizer products, chief financial officer, chief legal officer, corporate development and strategy.This is a Farming Business Company Profile Organization Chart Icons PDF template with various stages. Focus and dispense information on four stages using this creative set, that comes with editable features. It contains large content boxes to add your information on topics like Administrative Officer, Fertilizer Products, Development Strategy. You can also showcase facts, figures, and other relevant content using this PPT layout. Grab it now.

Organization Chart Global Food Products Company Profile Brochure PDF
This slide highlights the organization chart of agricultural company which includes founder, CEO, EVP of retail products, fertilizer products, chief financial officer, chief legal officer, corporate development and strategy. Slidegeeks is one of the best resources for PowerPoint templates. You can download easily and regulate Organization Chart Global Food Products Company Profile Brochure PDF for your personal presentations from our wonderful collection. A few clicks is all it takes to discover and get the most relevant and appropriate templates. Use our Templates to add a unique zing and appeal to your presentation and meetings. All the slides are easy to edit and you can use them even for advertisement purposes.

Organisation Chart IT Software Development Company Profile Structure PDF
The slide highlights the organizational chart for IT company. It depicts chief executing officer, chief operating officer, legal team, HR head,, chief of operations, chief of finance, chief of corporate compliance and chief of human resource. This is a Organisation Chart IT Software Development Company Profile Structure PDF template with various stages. Focus and dispense information on one stage using this creative set, that comes with editable features. It contains large content boxes to add your information on topics like Financial Officer, Operations Leader, Information Officer. You can also showcase facts, figures, and other relevant content using this PPT layout. Grab it now.

Bar Chart Ppt PowerPoint Presentation Slides Design Ideas
This is a bar chart ppt powerpoint presentation slides design ideas. This is a six stage process. The stages in this process are product, bar chart, sales in percentage.

Combo Chart Ppt PowerPoint Presentation Infographic Template Themes
This is a combo chart ppt powerpoint presentation infographic template themes. This is a eight stage process. The stages in this process are combo chart, finance, marketing, strategy, analysis, business.
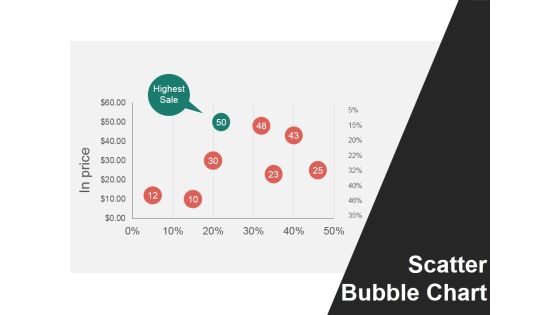
Scatter Bubble Chart Ppt PowerPoint Presentation Show Infographic Template
This is a scatter bubble chart ppt powerpoint presentation show infographic template. This is a six stage process. The stages in this process are in price, scatter bubble chart, highest sale.
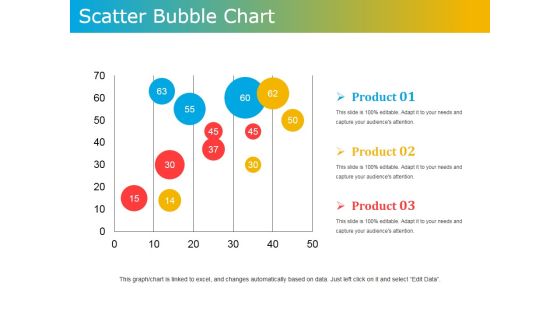
Scatter Bubble Chart Ppt PowerPoint Presentation Ideas Design Templates
This is a scatter bubble chart ppt powerpoint presentation ideas design templates. This is a three stage process. The stages in this process are product, scatter, bubble chart, business, marketing.

Column Chart Ppt PowerPoint Presentation Infographic Template Graphics Tutorials
This is a column chart ppt powerpoint presentation infographic template graphics tutorials. This is a twelve stage process. The stages in this process are column chart, finance, marketing, strategy, investment, business.

Pie Chart Ppt PowerPoint Presentation Infographic Template Graphics Example
This is a pie chart ppt powerpoint presentation infographic template graphics example. This is a four stage process. The stages in this process are pie chart, finance, marketing, strategy, business.
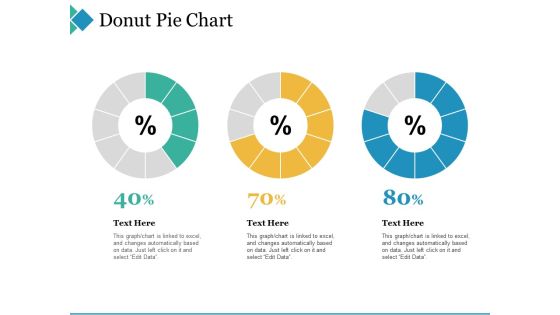
Donut Pie Chart Ppt PowerPoint Presentation Infographic Template Example 2015
This is a donut pie chart ppt powerpoint presentation infographic template example 2015. This is a three stage process. The stages in this process are donut pie chart, finance, marketing, strategy, business.
Donut Pie Chart Ppt PowerPoint Presentation Icon File Formats
This is a Donut Pie Chart Ppt PowerPoint Presentation Icon File Formats. This is a six stage process. The stages in this process are donut pie chart, finance, marketing, strategy, business.

Area Chart Ppt PowerPoint Presentation Infographics Graphics Tutorials
This is a area chart ppt powerpoint presentation infographics graphics tutorials. This is a two stage process. The stages in this process are product, area chart, sales in percentage.
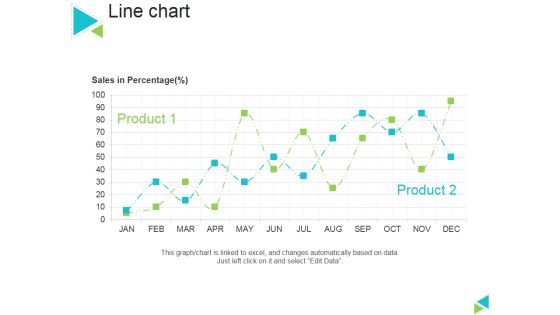
Line Chart Ppt PowerPoint Presentation Gallery Master Slide
This is a line chart ppt powerpoint presentation gallery master slide. This is a two stage process. The stages in this process are sales in percentage, product, line chart.

Line Chart Ppt PowerPoint Presentation Visual Aids Pictures
This is a line chart ppt powerpoint presentation visual aids pictures. This is a three stage process. The stages in this process are business, marketing, line chart, analysis, growth.

Area Chart Ppt PowerPoint Presentation Inspiration Clipart Images
This is a area chart ppt powerpoint presentation inspiration clipart images. This is a two stage process. The stages in this process are area chart, growth, finance, business, strategy.
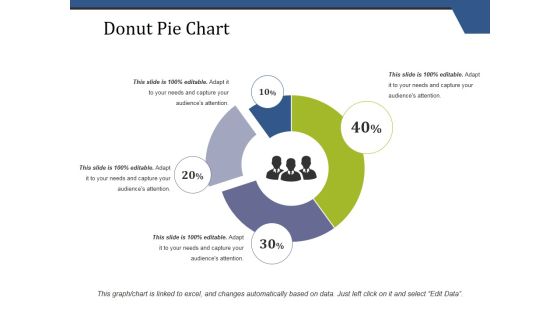
Donut Pie Chart Ppt PowerPoint Presentation Portfolio Clipart Images
This is a donut pie chart ppt powerpoint presentation portfolio clipart images. This is a four stage process. The stages in this process are donut pie chart, finance, marketing, strategy, business.
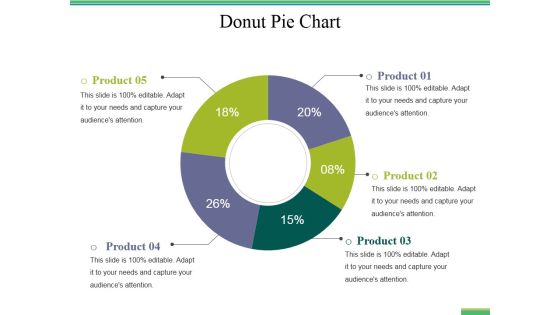
Donut Pie Chart Ppt PowerPoint Presentation Professional Files
This is a donut pie chart ppt powerpoint presentation professional files. This is a five stage process. The stages in this process are donut pie chart, finance, marketing, investment, analysis, business.

Donut Pie Chart Ppt PowerPoint Presentation Professional Format Ideas
This is a donut pie chart ppt powerpoint presentation professional format ideas. This is a three stage process. The stages in this process are donut pie chart, marketing, strategy, analysis, business.

donut pie chart ppt powerpoint presentation file skills
This is a donut pie chart ppt powerpoint presentation file skills. This is a five stage process. The stages in this process are donut pie chart, finance, marketing, strategy, business.
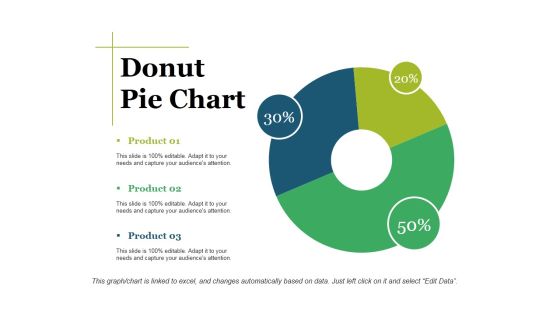
Donut Pie Chart Ppt PowerPoint Presentation Show Graphic Tips
This is a donut pie chart ppt powerpoint presentation show graphic tips. This is a three stage process. The stages in this process are donut pie chart, finance, marketing, strategy, analysis, business.

Donut Pie Chart Ppt PowerPoint Presentation Portfolio Example Topics
This is a donut pie chart ppt powerpoint presentation portfolio example topics. This is a four stage process. The stages in this process are donut pie chart, strategy, business, marketing, finance.

Stacked Line Chart Ppt PowerPoint Presentation Model Show
This is a stacked line chart ppt powerpoint presentation model show. This is a two stage process. The stages in this process are stacked line chart, product, profit, percentage, growth.

Organizational Expense Budget Allocation Pie Chart Inspiration PDF
The following slide highlights the amount of budget allocated to specific Organizational expenses for better financial decision making. It includes activities such as salaries, transportation, taxes, marketing, new hiring, others etc. Pitch your topic with ease and precision using this Organizational Expense Budget Allocation Pie Chart Inspiration PDF. This layout presents information on Transportation, Marketing, Budget. It is also available for immediate download and adjustment. So, changes can be made in the color, design, graphics or any other component to create a unique layout.
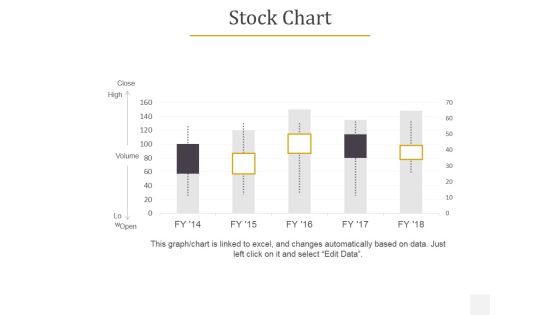
Stock Chart Ppt PowerPoint Presentation Visual Aids Summary
This is a stock chart ppt powerpoint presentation visual aids summary. This is a five stage process. The stages in this process are close, high, volume, open.

Column Chart Ppt PowerPoint Presentation Ideas Visual Aids
This is a column chart ppt powerpoint presentation ideas visual aids. This is a two stage process. The stages in this process are growth, business, finance, marketing, analysis.

Combo Chart Ppt PowerPoint Presentation Styles Example File
This is a combo chart ppt powerpoint presentation styles example file. This is a three stage process. The stages in this process are finance, growth, business, analysis, marketing.
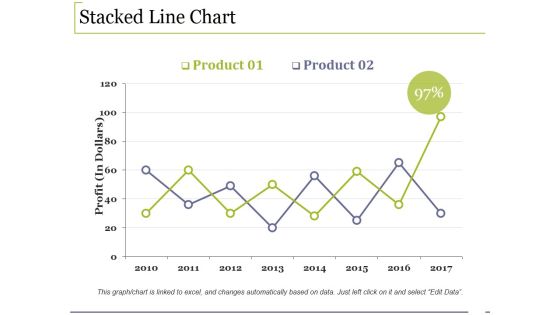
Stacked Line Chart Ppt PowerPoint Presentation Ideas Styles
This is a stacked line chart ppt powerpoint presentation ideas styles. This is a two stage process. The stages in this process are growth, finance, analysis, management, business.
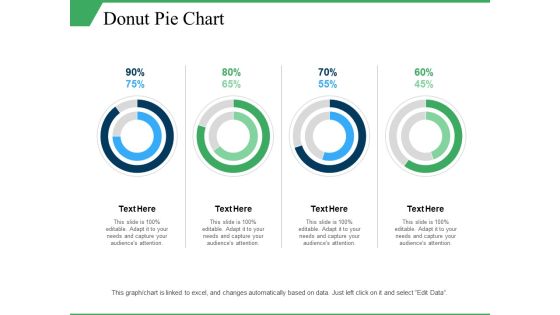
Donut Pie Chart Ppt PowerPoint Presentation Layouts Information
This is a donut pie chart ppt powerpoint presentation layouts information. This is a four stage process. The stages in this process are percentage, finance, donut, business, marketing.
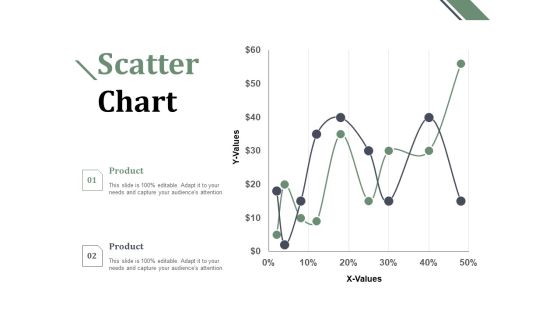
Scatter Chart Ppt PowerPoint Presentation Gallery Master Slide
This is a scatter chart ppt powerpoint presentation gallery master slide. This is a two stage process. The stages in this process are finance, marketing, management, investment, analysis.

Growth Chart Business PowerPoint Templates And PowerPoint Themes 1012
Growth Chart Business PowerPoint Templates And PowerPoint Themes 1012-The above template displays a diagram of a colorful business chart outgoing. This image has been professionally designed to emphasize business concept. It signifies chart, finance, future, growth, profit, progress, statistics and success. Adjust the above image in your PPT presentations to visually support your content in your Marketing and Financial PPT slideshows. Our PPT images are so ideally designed that it reveals the very basis of our PPT template are an effective tool to make your clients understand.-Growth Chart Business PowerPoint Templates And PowerPoint Themes 1012-This PowerPoint template can be used for presentations relating to-Business growth and success graph, finance, business, success, competition, arrows
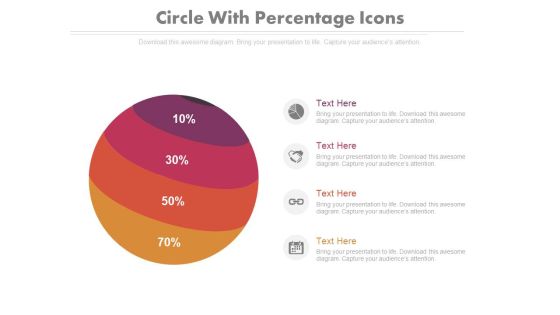
Four Parts Circle Chart With Percentage Ratio Powerpoint Slides
This PowerPoint template contains four parts circle chart with percentage ratio. You may download this PPT slide design to display your ideas in visual manner. You can easily customize this template to make it more unique as per your need.

Bar Graph With Line Chart For Analysis Powerpoint Slides
This PowerPoint template contains design of bar graph with line chart. You may download this slide to display strategy steps for business growth. You can easily customize this template to make it more unique as per your need.
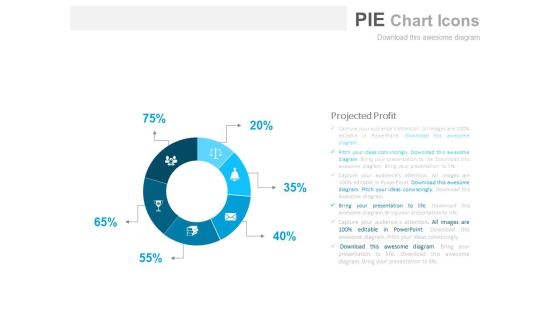
Pie Chart For Projected Profit Report Powerpoint Slides
This PowerPoint template has been designed with diagram of pie chart. This PPT slide can be used to prepare presentations for projected profit report. You can download finance PowerPoint template to prepare awesome presentations.
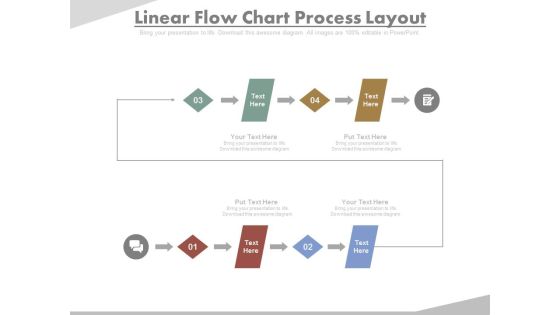
Four Steps In Linear Flow Chart Powerpoint Slides
This PowerPoint template contains design of four steps flow chart. You may download this slide to display workflow and processes. You can easily customize this template to make it more unique as per your need.

Funnel Chart For Joint Venture Marketing Powerpoint Slides
This PowerPoint template has been designed with graphics of funnel chart. This PPT slide can be used to display joint venture marketing. You can download finance PowerPoint template to prepare awesome presentations.

Six Steps Funnel Chart For Business Powerpoint Slides
This PowerPoint template has been designed with professional graphics of funnel chart. This PPT slide can be used to display steps of sales process. You can download finance PowerPoint template to prepare awesome presentations.
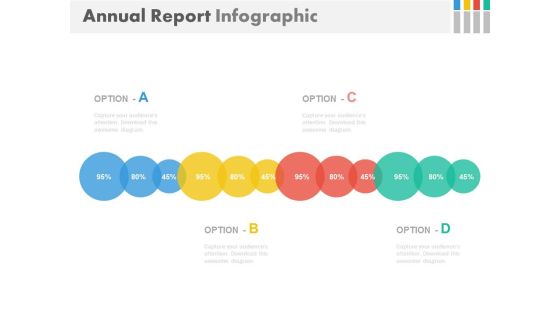
Linear Chart For Annual Business Report Powerpoint Slides
This PowerPoint template contains graphics of linear circle chart. You may download this PPT slide design to display annual business report. You can easily customize this template to make it more unique as per your need.

Yearly Price List Data Comparison Chart Structure PDF
This slide showcases price catalogue chart that can help in comparing the cost of product in different financial years and calculate the price hiked by organization. It also outlines percentage change in prices Showcasing this set of slides titled yearly price list data comparison chart structure pdf. The topics addressed in these templates are yearly price list data comparison chart. All the content presented in this PPT design is completely editable. Download it and make adjustments in color, background, font etc. as per your unique business setting.

Bar Chart Ppt PowerPoint Presentation Infographic Template Brochure
This is a bar chart ppt powerpoint presentation infographic template brochure. This is a seven stage process. The stages in this process are bar graph, finance, marketing, strategy, analysis, business.
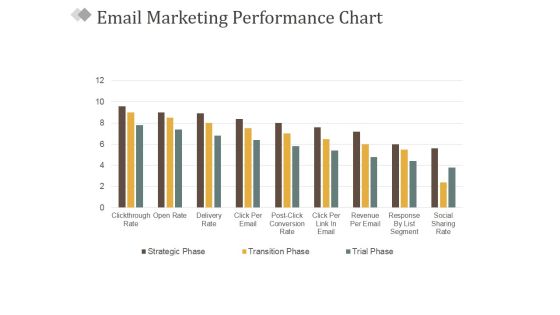
Email Marketing Performance Chart Ppt PowerPoint Presentation Gallery Elements
This is a email marketing performance chart ppt powerpoint presentation gallery elements. This is a nine stage process. The stages in this process are business, marketing, success, management, bar graph.

Email Marketing Performance Chart Ppt PowerPoint Presentation Model Topics
This is a email marketing performance chart ppt powerpoint presentation model topics. This is a three stage process. The stages in this process are strategic phase, transition phase, trial phase.
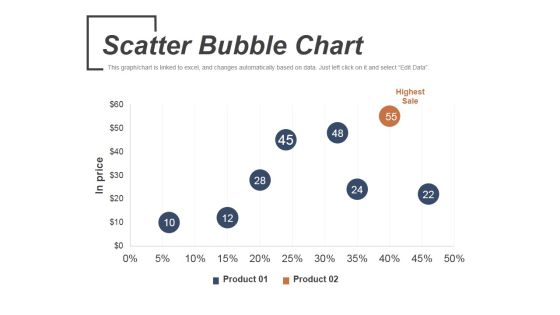
Scatter Bubble Chart Ppt PowerPoint Presentation Infographic Template Graphics
This is a scatter bubble chart ppt powerpoint presentation infographic template graphics. This is a two stage process. The stages in this process are highest sale, product, in price.

Competitive Analysis Template 7 Bubble Chart Ppt PowerPoint Presentation Deck
This is a competitive analysis template 7 bubble chart ppt powerpoint presentation deck. This is a six stage process. The stages in this process are users interface, data import, example, pricing, support, update, tutorials, easy to use, table.
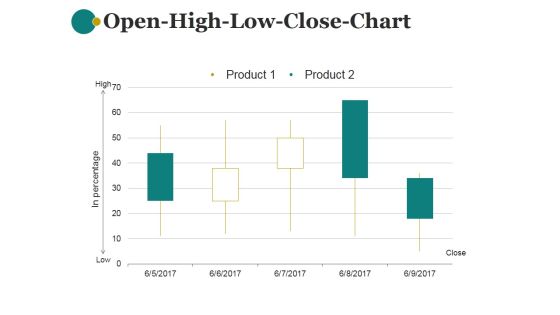
Open High Low Close Chart Ppt PowerPoint Presentation Information
This is a open high low close chart ppt powerpoint presentation information. This is a five stage process. The stages in this process are product, in percentage, close, low, high.
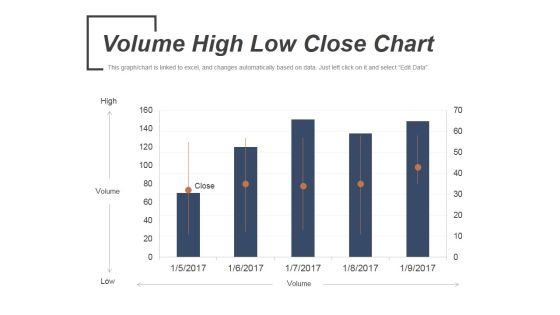
Volume High Low Close Chart Ppt PowerPoint Presentation Slides Portrait
This is a volume high low close chart ppt powerpoint presentation slides portrait. This is a five stage process. The stages in this process are volume, low, high, open, close.

High Low Close Chart Ppt PowerPoint Presentation Inspiration Professional
This is a high low close chart ppt powerpoint presentation inspiration professional. This is a ten stage process. The stages in this process are business, strategy, analysis, planning, high, volume, low.

Pie Chart With Multiple Percentage Values Ppt PowerPoint Presentation Show
This is a pie chart with multiple percentage values ppt powerpoint presentation show. This is a six stage process. The stages in this process are pie, finance, people, silhouettes, communication.
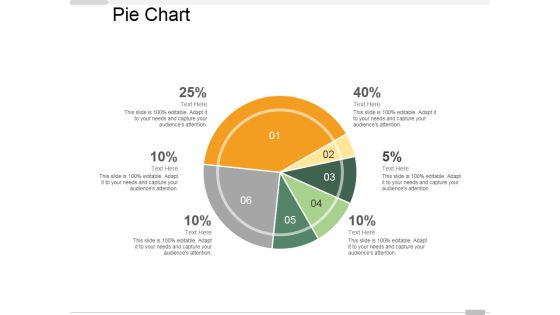
Pie Chart Ppt PowerPoint Presentation Infographic Template Master Slide
This is a pie chart ppt powerpoint presentation infographic template master slide. This is a six stage process. The stages in this process are pie chart, marketing, finance, analysis, business.

Line Chart Ppt PowerPoint Presentation Summary Graphic Tips
This is a line chart ppt powerpoint presentation summary graphic tips. This is a two stage process. The stages in this process are line chart, product, in percentage, analysis, business.
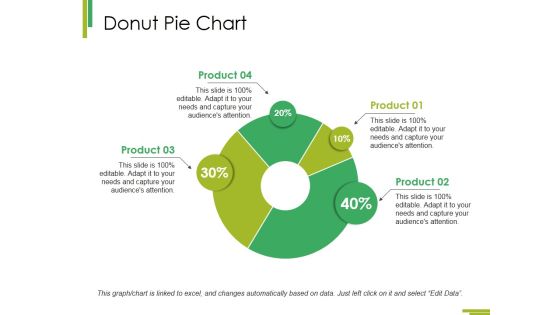
Donut Pie Chart Ppt PowerPoint Presentation Show Visual Aids
This is a donut pie chart ppt powerpoint presentation show visual aids. This is a four stage process. The stages in this process are donut pie chart, business, marketing, analysis, finance.

Water Drop Diagram With Percentage Chart Powerpoint Template
This PPT slide has been designed with graphics of water drop with percentage values. Download this PowerPoint template to depict business investments and savings. Imprint your concepts with this professional slide in your presentations.?

Combo Chart Bar Ppt PowerPoint Presentation Slides Portfolio
This is a company growth strategy ppt powerpoint presentation professional slides. This is a three stage process. The stages in this process are finance, marketing, analysis, investment, million.

Insurance Services Firm Profile Organisation Chart Diagrams PDF
The slide depicts the company hierarchical chart to define the various management positions in organization. It depicts chief executive officer, chief financial officer, executive vice president, sales and marketing director, legal advisor, actuary and IT consultant. It also shows board of directors, risk management committee and office of compliance. Deliver an awe inspiring pitch with this creative Insurance Services Firm Profile Organisation Chart Diagrams PDF bundle. Topics like Executive Of Directors, Chief Executive Officer, Board Of Directors can be discussed with this completely editable template. It is available for immediate download depending on the needs and requirements of the user.

Property And Casualties Insurance Business Profile Organisation Chart Sample PDF
The slide depicts the company hierarchical chart to define the various management positions in organization. It depicts chief executive officer, chief financial officer, executive vice president, sales and marketing director, legal advisor, actuary and IT consultant. It also shows board of directors, risk management committee and office of compliance. Deliver an awe inspiring pitch with this creative Property And Casualties Insurance Business Profile Organisation Chart Sample PDF bundle. Topics like Chief Executive Officer, Executive Of Directors, Board Of Directors can be discussed with this completely editable template. It is available for immediate download depending on the needs and requirements of the user.

Organisation Chart Health And Property Insurance Company Profile Structure PDF
The slide depicts the company hierarchical chart to define the various management positions in organization. It depicts chief executive officer, chief financial officer, executive vice president, sales and marketing director, legal advisor, actuary and IT consultant. It also shows board of directors, risk management committee and office of compliance. Deliver an awe inspiring pitch with this creative Organisation Chart Health And Property Insurance Company Profile Structure PDF bundle. Topics like Board Of Directors, Executive Of Directors, Chief Executive Officer can be discussed with this completely editable template. It is available for immediate download depending on the needs and requirements of the user.
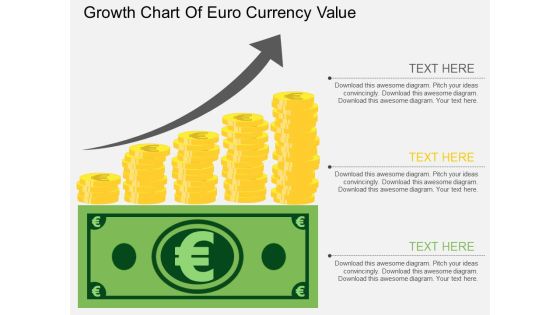
Growth Chart Of Euro Currency Value Powerpoint Template
The above PPT template displays growth chart of Euro currency. This diagram helps to exhibit Euro currency value growth. Adjust the above diagram in your business presentations to visually support your content.

Business Operations Accounting Procedure Flow Chart Clipart PDF
This slide consists of a comprehensive representation of financial accounting process followed in the business organization. Key elements include transportation, human resource training, charitable events, accounting process, tasks, documents etc. Pitch your topic with ease and precision using this Business Operations Accounting Procedure Flow Chart Clipart PDF. This layout presents information on Accounting, Process Activities, Transportation . It is also available for immediate download and adjustment. So, changes can be made in the color, design, graphics or any other component to create a unique layout.
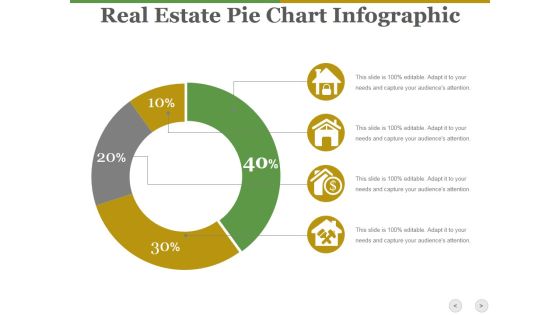
Real Estate Pie Chart Infographic Ppt PowerPoint Presentation Show Diagrams
This is a real estate pie chart infographic ppt powerpoint presentation show diagrams. This is a four stage process. The stages in this process are business, icons, marketing, strategy, process.
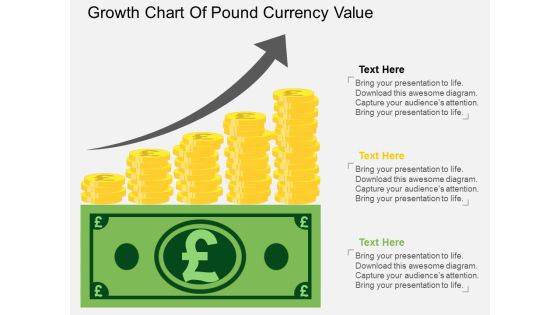
Growth Chart Of Pound Currency Value Powerpoint Template
The above PPT template displays growth chart of Pound currency. This diagram helps to exhibit Pound currency value growth. Adjust the above diagram in your business presentations to visually support your content.

 Home
Home