Financial Chart

Area Chart Ppt PowerPoint Presentation Styles Designs
This is a area chart ppt powerpoint presentation styles designs. This is a two stage process. The stages in this process are area chart, product.
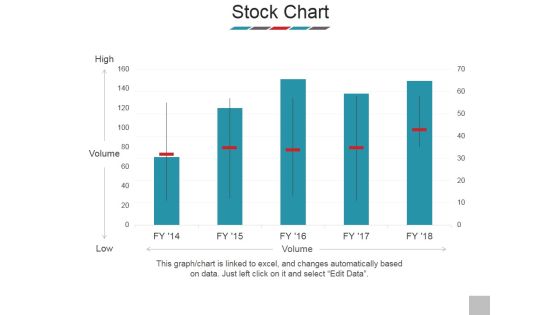
Stock Chart Ppt PowerPoint Presentation Show Templates
This is a stock chart ppt powerpoint presentation show templates. This is a five stage process. The stages in this process are high, volume, low, business, marketing.
Line Chart Ppt PowerPoint Presentation Icon Elements
This is a line chart ppt powerpoint presentation icon elements. This is a two stage process. The stages in this process are line graph, marketing, presentation, business, management.
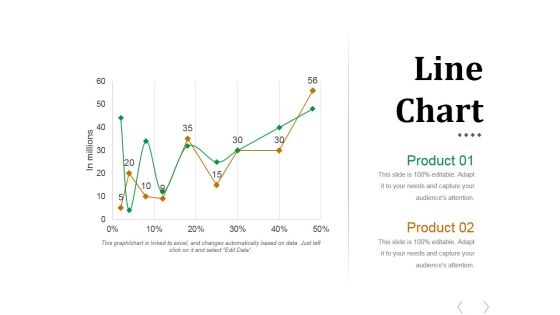
Line Chart Ppt PowerPoint Presentation Styles Outfit
This is a line chart ppt powerpoint presentation styles outfit. This is a two stage process. The stages in this process are business, finance, management, growth, planning.

Stock Chart Ppt PowerPoint Presentation Backgrounds
This is a stock chart ppt powerpoint presentation backgrounds. This is a five stage process. The stages in this process are high, volume, low, close.
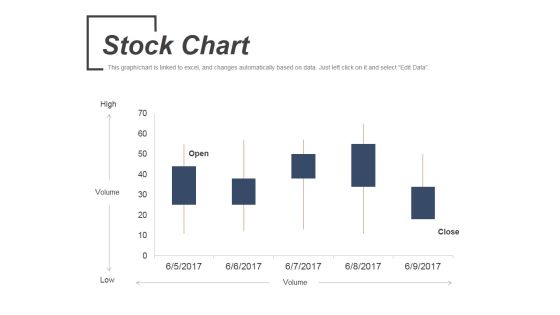
Stock Chart Ppt PowerPoint Presentation Ideas Topics
This is a stock chart ppt powerpoint presentation ideas topics. This is a five stage process. The stages in this process are volume, low, high, open, close.

Combo Chart Finance Ppt PowerPoint Presentation Clipart
This is a combo chart finance ppt powerpoint presentation pictures show. This is a two stage process. The stages in this process are finance, marketing, management, investment, analysis.
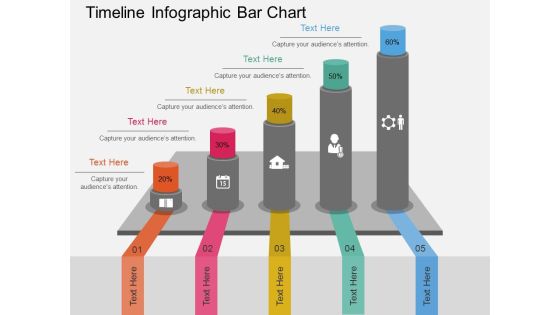
Timeline Infographic Bar Chart Powerpoint Template
This business diagram has been designed with timeline infographic bar chart. You may use this slide to display success and growth concepts. Make your mark with this unique slide and create an impression that will endure.
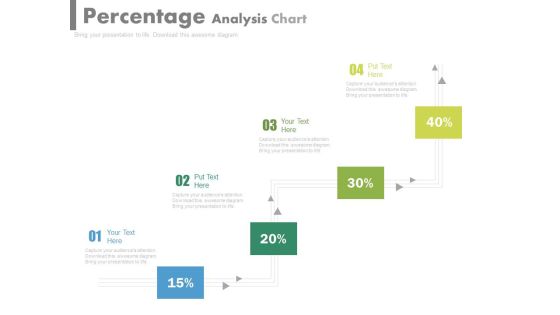
Pipeline Percentage Analysis Chart Powerpoint Slides
This PowerPoint template has been designed with pipeline percentage analysis chart. This PPT slide can be used to display business strategy plan. You can download finance PowerPoint template to prepare awesome presentations.
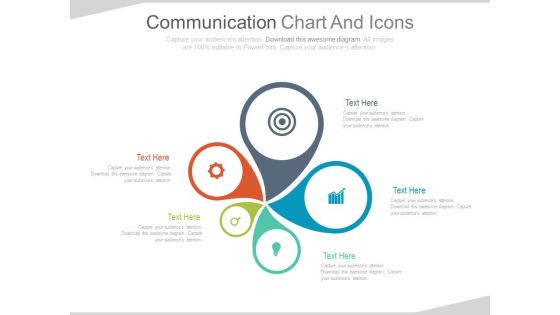
Infographic Chart For Marketing Information Powerpoint Slides
This PowerPoint template contains circular infographic chart. You may download this PPT slide to display marketing information in visual manner. You can easily customize this template to make it more unique as per your need.

Line Chart Ppt PowerPoint Presentation Professional Smartart
This is a line chart ppt powerpoint presentation professional smartart. This is a two stage process. The stages in this process are in percentage, in years, product, finance, business.
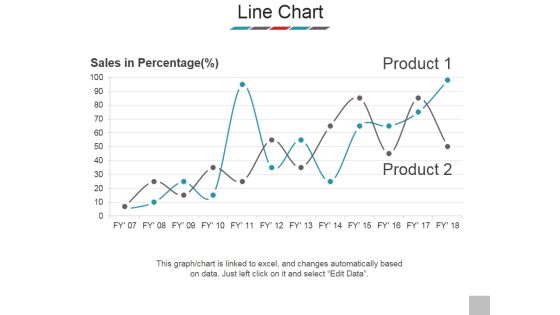
Line Chart Ppt PowerPoint Presentation Outline Samples
This is a line chart ppt powerpoint presentation outline samples. This is a two stage process. The stages in this process are sales in percentage, product, business, marketing, success.

Combo Chart Ppt PowerPoint Presentation Styles Good
This is a combo chart ppt powerpoint presentation styles good. This is a eight stage process. The stages in this process are market size, growth rate, product, growth, strategy, graph, finance.
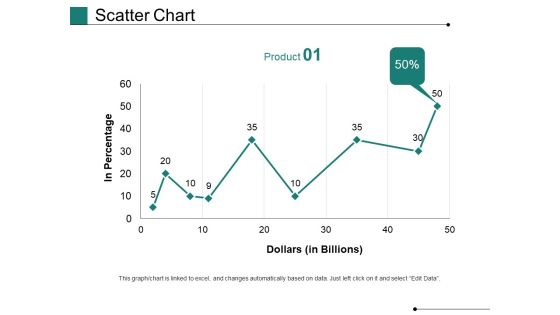
Scatter Chart Ppt PowerPoint Presentation Gallery Show
This is a scatter chart ppt powerpoint presentation gallery show. This is a one stage process. The stages in this process are in percentage, dollars, business, marketing, growth, graph.

Combo Chart Ppt PowerPoint Presentation Portfolio Themes
This is a combo chart ppt powerpoint presentation portfolio themes. This is a three stage process. The stages in this process are market size, product, management, finance, chart, marketing.
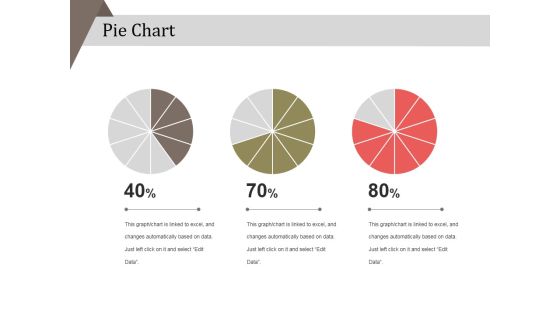
Pie Chart Ppt PowerPoint Presentation Layouts Example
This is a pie chart ppt powerpoint presentation layouts example. This is a three stage process. The stages in this process are business, strategy, analysis, pie chart, finance, marketing.

Combo Chart Ppt PowerPoint Presentation Model Gallery
This is a combo chart ppt powerpoint presentation model gallery. This is a eight stage process. The stages in this process are business, marketing, management, growth, timeline.

Alternative Assessment Chart Powerpoint Slide Designs
This is a alternative assessment chart powerpoint slide designs. This is a two stage process. The stages in this process are business, marketing, percentage, finance, success.
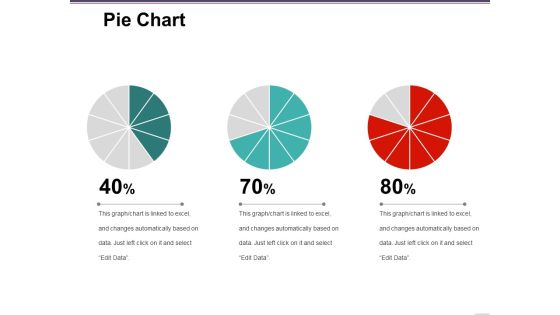
Pie Chart Ppt PowerPoint Presentation Layouts Good
This is a pie chart ppt powerpoint presentation layouts good. This is a three stage process. The stages in this process are finance, marketing, management, process, business.

Accounting Payable Procedure Flow Chart Guidelines PDF
This slide consists of a basic process of financial accounting which is followed by accounts payable department to verify invoices against orders and make payment to avoid delays. The key elements are purchase order acceptance, approval, sending purchase order email to vendor etc. Pitch your topic with ease and precision using this Accounting Payable Procedure Flow Chart Guidelines PDF. This layout presents information on Purchasing, Operations, Process. It is also available for immediate download and adjustment. So, changes can be made in the color, design, graphics or any other component to create a unique layout.
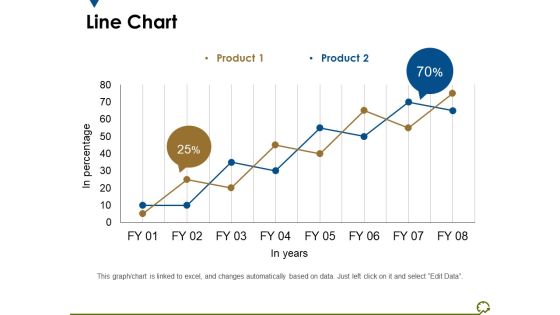
Line Chart Ppt PowerPoint Presentation Outline Diagrams
This is a line chart ppt powerpoint presentation outline diagrams. This is a two stage process. The stages in this process are in percentage, in years, percentage, business, marketing.
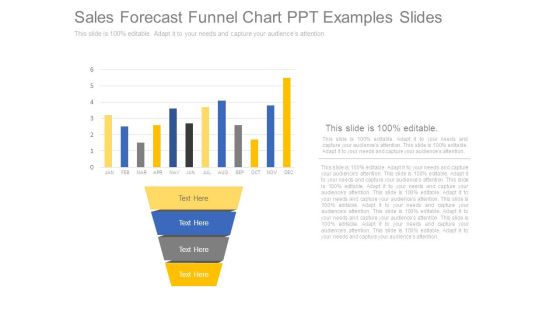
Sales Forecast Funnel Chart Ppt Examples Slides
This is a sales forecast funnel chart ppt examples slides. This is a four stage process. The stages in this process are jan, feb, mar, apr, may, jun, jul, aug, sep, oct, nov, dec.
Scatter Bubble Chart Ppt PowerPoint Presentation Icon Templates
This is a scatter bubble chart ppt powerpoint presentation icon templates. This is a eight stage process. The stages in this process are business, finance, management, scatter chart, marketing.

Stock Chart Ppt PowerPoint Presentation Slides Example File
This is a stock chart ppt powerpoint presentation slides example file. This is a five stage process. The stages in this process are business, finance, stock chart, management, planning.
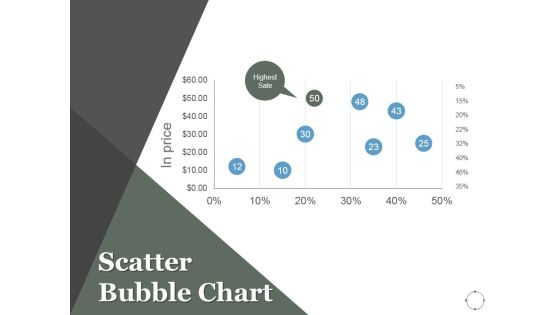
Scatter Bubble Chart Ppt PowerPoint Presentation Background Designs
This is a scatter bubble chart ppt powerpoint presentation background designs. This is a eight stage process. The stages in this process are projects, marketing, scatter chart, finance, management.

Combo Chart Ppt PowerPoint Presentation Portfolio Template
This is a combo chart ppt powerpoint presentation portfolio template. This is a three stage process. The stages in this process are product, business, marketing, combo chart, percentage.

Combo Chart Ppt PowerPoint Presentation Icon Portrait
This is a combo chart ppt powerpoint presentation icon portrait. This is a three stage process. The stages in this process are combo chart, finance, marketing, strategy, analysis.

Area Chart Ppt PowerPoint Presentation Outline Deck
This is a area chart ppt powerpoint presentation outline deck. This is a two stage process. The stages in this process are area chart, finance, marketing, analysis, business.

Arrow Steps Chart For Business Success Powerpoint Template
This PowerPoint template has been designed with graphics of arrow steps chart. Download this slide for planning of financial targets. Grab the attention of your listeners with this PPT slide.

data collection and analysis control chart ppt powerpoint presentation styles
This is a data collection and analysis control chart ppt powerpoint presentation styles. This is a one stage process. The stages in this process are upper limit, centerline, plotted points, lower limit, point labels.
Email Marketing Performance Chart Ppt PowerPoint Presentation Icon Design Inspiration
This is a email marketing performance chart ppt powerpoint presentation icon design inspiration. This is a nine stage process. The stages in this process are email marketing performance chart, business, marketing, strategy, success.
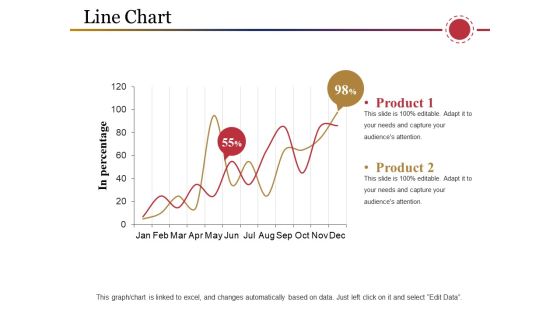
Line Chart Ppt PowerPoint Presentation Inspiration Samples
This is a line chart ppt powerpoint presentation inspiration samples. This is a two stage process. The stages in this process are product, in percentage, business, marketing, graph.

Area Chart Ppt PowerPoint Presentation Infographic Template Portrait
This is a area chart ppt powerpoint presentation infographic template portrait. This is a two stage process. The stages in this process are business, marketing, strategy, planning, finance.

Competitive Analysis Bubble Chart Ppt PowerPoint Presentation Templates
This is a competitive analysis bubble chart ppt powerpoint presentation templates. This is a six stage process. The stages in this process are product, business, management, marketing, strategy.

Stock Chart Ppt PowerPoint Presentation Summary Background Designs
This is a stock chart ppt powerpoint presentation summary background designs. This is a five stage process. The stages in this process are high, volume, low.

Doughnut Chart Ppt PowerPoint Presentation Visual Aids Files
This is a doughnut chart ppt powerpoint presentation visual aids files. This is a three stage process. The stages in this process are finance, donut, percentage, business, marketing.

Email Marketing Performance Chart Ppt Powerpoint Presentation Pictures Show
This is a email marketing performance chart ppt powerpoint presentation pictures show. This is a nine stage process. The stages in this process are finance, planning, marketing, business, management, strategy.
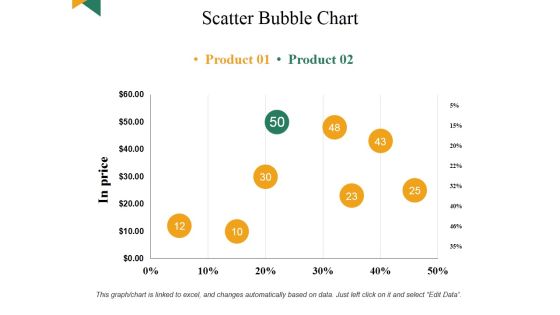
Scatter Bubble Chart Ppt PowerPoint Presentation Summary Visual Aids
This is a scatter bubble chart ppt powerpoint presentation summary visual aids. This is a eight stage process. The stages in this process are business, marketing, finance, analysis, planning.

Data Collection And Analysis Control Chart Ppt PowerPoint Presentation Visuals
This is a data collection and analysis control chart ppt powerpoint presentation visuals. This is a ten stage process. The stages in this process are upper limit, centerline, lower limit, plotted points.

Column Chart Ppt PowerPoint Presentation Styles Graphic Tips
This is a column chart ppt powerpoint presentation styles graphic tips. This is a six stage process. The stages in this process are slide bar, business, marketing, strategy, finance.

Information Systems Security And Risk Management Plan Cyber Attacks Faced By Organization In Previous Financial Year Graphics PDF
This slide showcases information security attacks faced by organization in past financial year. It can help company to assess different type of cyber attacks and formulate strategies to tackle them. If your project calls for a presentation, then Slidegeeks is your go-to partner because we have professionally designed, easy to edit templates that are perfect for any presentation. After downloading, you can easily edit Information Systems Security And Risk Management Plan Cyber Attacks Faced By Organization In Previous Financial Year Graphics PDF and make the changes accordingly. You can rearrange slides or fill them with different images. Check out all the handy templates

Lead Scoring Chart Powerpoint Slide Background
This is a lead scoring chart powerpoint slide background. This is a six stage process. The stages in this process are measurable roi on lead generation program, increased conversion rates from qualified lead to opportunity, increased sales productivity and effectiveness, shortened sales cycle, better forecast and pipeline visibility, better alignment of marketing and sales efforts.

Business Flow Chart PowerPoint Presentations Process Slides
We present our business flow chart powerpoint presentations process Slides.Use our Advertising PowerPoint Templates because this PPt slide can educate your listeners on the relevance and importance of each one as per your plan and how they all contribute as you strive to hit the Bullseye. Present our Business PowerPoint Templates because the great Bald headed Eagle embodies your personality. the eagle eye to seize upon the smallest of opportunities. Download and present our Marketing PowerPoint Templates because that was the well known Musketeers call. Use our Finance PowerPoint Templates because you envisage some areas of difficulty in the near future. The overall financial situation could be a source of worry. Download and present our Shapes PowerPoint Templates because there is a key aspect to be emphasised.Use these PowerPoint slides for presentations relating to Analysis, Business, Concept, Design, Diagram, Direction, Goals, Guide, Icon, Idea, Management, Model, Opportunity, Organization, Performance, Plan, Process, Project, Representation, Resource, Strategy, Swot. The prominent colors used in the PowerPoint template are Blue, Black, Gray. PowerPoint presentation experts tell us our business flow chart powerpoint presentations process Slides are Perfect. Professionals tell us our Diagram PowerPoint templates and PPT Slides are Striking. People tell us our business flow chart powerpoint presentations process Slides are Appealing. We assure you our Icon PowerPoint templates and PPT Slides are Endearing. PowerPoint presentation experts tell us our business flow chart powerpoint presentations process Slides are Appealing. Professionals tell us our Direction PowerPoint templates and PPT Slides effectively help you save your valuable time.
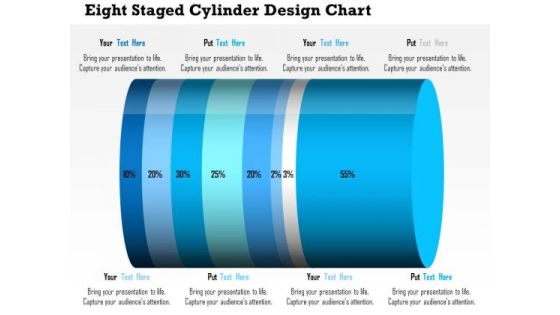
Business Daigram Eight Staged Cylinder Design Chart Presentation Templets
This business diagram contains eight staged cylinder design chart with percentage ratio. Download this diagram to display financial analysis. Use this diagram to make business and marketing related presentations.
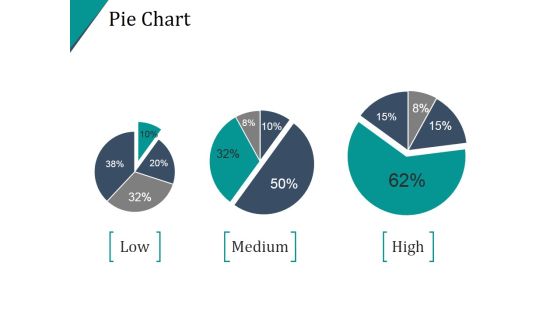
Pie Chart Template Ppt PowerPoint Presentation Example 2015
This is a pie chart template ppt powerpoint presentation example 2015. This is a four stage process. The stages in this process are pie, division, percentage, finance, analysis.
Pie Chart Ppt PowerPoint Presentation Icon Graphics Download
This is a pie chart ppt powerpoint presentation icon graphics download. This is a four stage process. The stages in this process are pie, finance, analysis, marketing, percentage.
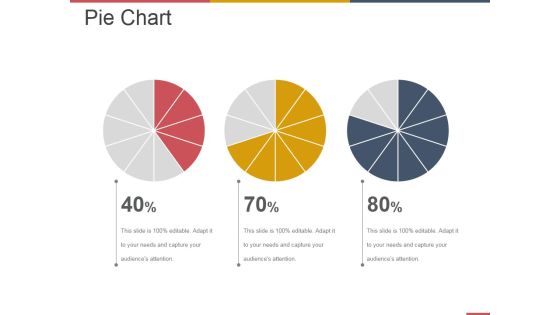
Pie Chart Ppt PowerPoint Presentation Professional Example File
This is a pie chart ppt powerpoint presentation professional example file. This is a three stage process. The stages in this process are business, strategy, marketing, analysis, finance.
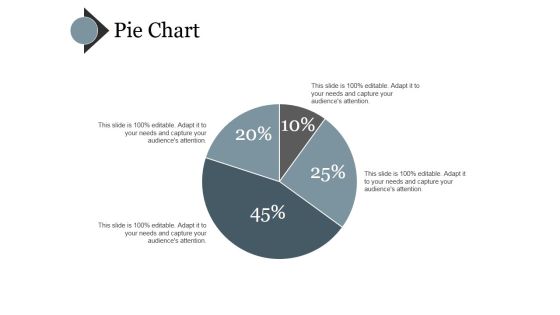
Pie Chart Ppt PowerPoint Presentation Pictures File Formats
This is a pie chart ppt powerpoint presentation pictures file formats. This is a four stage process. The stages in this process are finance, pie, business, marketing, strategy.
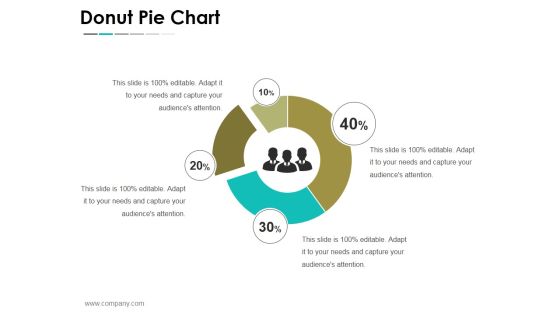
Donut Pie Chart Ppt PowerPoint Presentation File Slideshow
This is a donut pie chart ppt powerpoint presentation file slideshow. This is a four stage process. The stages in this process are business, strategy, analysis, planning, donut pie chart.

Combo Chart Ppt PowerPoint Presentation Infographics Example Topics
This is a combo chart ppt powerpoint presentation infographics example topics. This is a eight stage process. The stages in this process are business, marketing, growth, combo chart, management.

Competitive Analysis Scatter Chart Ppt PowerPoint Presentation Samples
This is a competitive analysis scatter chart ppt powerpoint presentation samples. This is a six stage process. The stages in this process are competitive, analysis, business, marketing, management.

combo chart template 1 ppt powerpoint presentation show
This is a combo chart template 1 ppt powerpoint presentation show. This is a four stage process. The stages in this process are business, marketing, finance, analysis, growth.

Combo Chart Template 2 Ppt PowerPoint Presentation Guidelines
This is a combo chart template 2 ppt powerpoint presentation guidelines. This is a four stage process. The stages in this process are business, marketing, growth, product, timeline.

Donut Pie Chart Ppt PowerPoint Presentation Professional Templates
This is a donut pie chart ppt powerpoint presentation professional templates. This is a three stage process. The stages in this process are finance, donut, business, marketing, strategy.

Pie Chart Ppt PowerPoint Presentation Slides Graphics Download
This is a pie chart ppt powerpoint presentation slides graphics download. This is a four stage process. The stages in this process are business, marketing, pie, finance, analysis.

Donut Pie Chart Ppt PowerPoint Presentation File Mockup
This is a donut pie chart ppt powerpoint presentation file mockup. This is a three stage process. The stages in this process are finance, business, percentage, marketing.

Donut Pie Chart Ppt PowerPoint Presentation Slides Outfit
This is a donut pie chart ppt powerpoint presentation slides outfit. This is a three stage process. The stages in this process are product, percentage, business, process, management.

Daunt Pie Chart Ppt PowerPoint Presentation Show Gallery
This is a daunt pie chart ppt powerpoint presentation show gallery. This is a five stage process. The stages in this process are business, marketing, teamwork, communication, strategy.
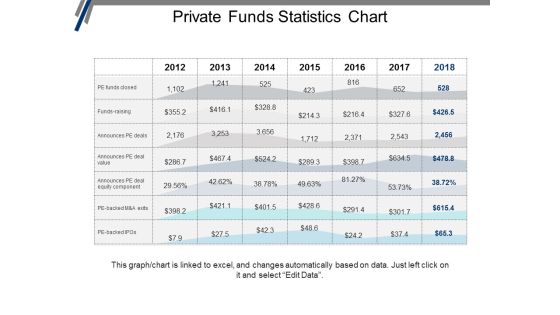
Private Funds Statistics Chart Ppt PowerPoint Presentation Portfolio Graphics Design
This is a private funds statistics chart ppt powerpoint presentation portfolio graphics design. This is a seven stage process. The stages in this process are investment, funding, private equity, venture capital.
Donut Pie Chart Ppt PowerPoint Presentation Icon Background Images
This is a donut pie chart ppt powerpoint presentation icon background images. This is a four stage process. The stages in this process are donut, process, planning, percentage, finance.
High Low Close Chart Ppt PowerPoint Presentation Icon Background Images
This is a high low close chart ppt powerpoint presentation icon background images. This is a ten stage process. The stages in this process are finance, analysis, planning, business, process.

Donut Pie Chart Ppt PowerPoint Presentation Infographic Template Diagrams
This is a donut pie chart ppt powerpoint presentation infographic template diagrams. This is a three stage process. The stages in this process are business, strategy, analysis, pretention, comparison.

Hierarchy Chart Sample Templates Ppt PowerPoint Presentation Background Designs
This is a hierarchy chart sample templates ppt powerpoint presentation background designs. This is a two stage process. The stages in this process are business, marketing, management, communication, planning.

data collection and analysis flow chart ppt powerpoint presentation microsoft
This is a data collection and analysis flow chart ppt powerpoint presentation microsoft. This is a nine stage process. The stages in this process are business, planning, marketing, strategy, management.

Line Chart Ppt PowerPoint Presentation File Graphic Images
This is a line chart ppt powerpoint presentation file graphic images. This is a two stage process. The stages in this process are business, strategy, marketing, planning, growth strategy, finance.
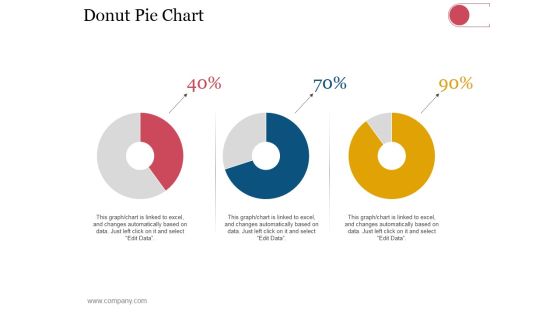
Donut Pie Chart Ppt PowerPoint Presentation Infographics Outfit
This is a donut pie chart ppt powerpoint presentation infographics outfit. This is a three stage process. The stages in this process are business, strategy, analysis, planning, dashboard, finance.
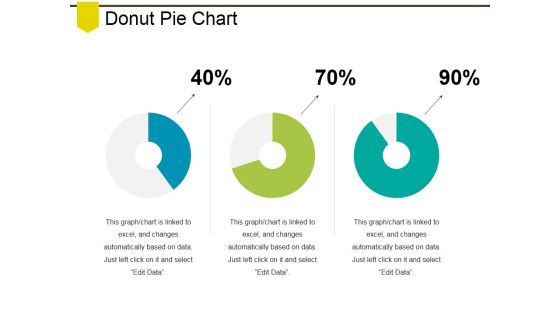
Donut Pie Chart Ppt PowerPoint Presentation File Example Introduction
This is a donut pie chart ppt powerpoint presentation file example introduction. This is a three stage process. The stages in this process are business, marketing, finance, planning, analysis.

Column Chart Ppt PowerPoint Presentation Infographic Template Graphic Images
This is a column chart ppt powerpoint presentation infographic template graphic images. This is a nine stage process. The stages in this process are business, marketing, growth, product, management.
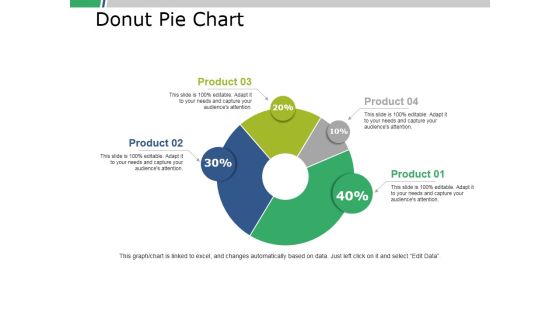
Donut Pie Chart Ppt PowerPoint Presentation Portfolio Slide Download
This is a donut pie chart ppt powerpoint presentation portfolio slide download. This is a four stage process. The stages in this process are business, marketing, finance, percent, donut.

Cash Payment Management Flow Chart Ppt PowerPoint Presentation Styles Professional
This is a cash payment management flow chart ppt powerpoint presentation styles professional. This is a seven stage process. The stages in this process are liquidity, cash assets, solvency.

Info Security Cyber Attacks Experienced By Company In Previous Financial Year Ppt PowerPoint Presentation Gallery Slideshow PDF
This slide shows the impact on the organizations financial condition due to cyber attacks in the past financial year 2022. Deliver an awe inspiring pitch with this creative info security cyber attacks experienced by company in previous financial year ppt powerpoint presentation gallery slideshow pdf bundle. Topics like comparatively low, cyber attacks experienced can be discussed with this completely editable template. It is available for immediate download depending on the needs and requirements of the user.
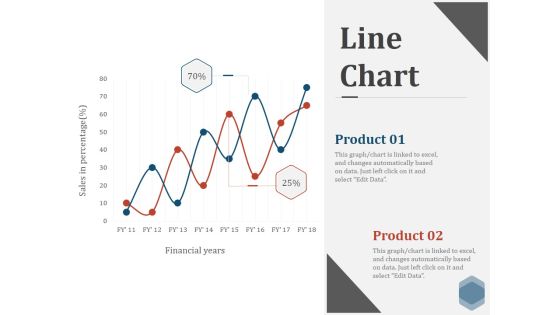
Line Chart Ppt PowerPoint Presentation Show Visuals
This is a line chart ppt powerpoint presentation show visuals. This is a two stage process. The stages in this process are financial, graph, line, marketing, success.
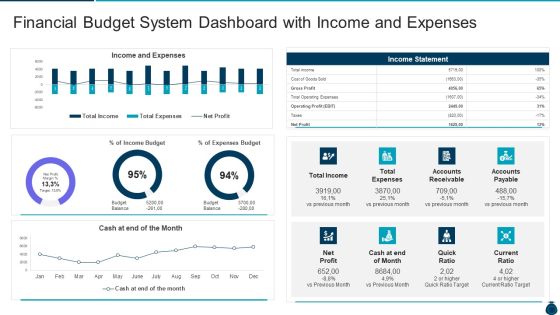
Key Elements And Techniques Of A Budgeting System Financial Budget System Dashboard With Income And Expenses Rules PDF
Deliver an awe inspiring pitch with this creative key elements and techniques of a budgeting system financial budget system dashboard with income and expenses rules pdf bundle. Topics like financial budget system dashboard with income and expenses can be discussed with this completely editable template. It is available for immediate download depending on the needs and requirements of the user.

Mitigation Strategies For Operational Threat Financial Losses In Banking Sector Due To Operational Risk Events Ppt Slides Mockup PDF
Following slide illustrates financial losses encountered in banking sector due to operational risk events. Risk events covered are natural disaster, technology and infrastructure, internal fraud and external fraud. Deliver and pitch your topic in the best possible manner with this mitigation strategies for operational threat financial losses in banking sector due to operational risk events ppt slides mockup pdf. Use them to share invaluable insights on business, financial, banking, technology, infrastructure and impress your audience. This template can be altered and modified as per your expectations. So, grab it now.
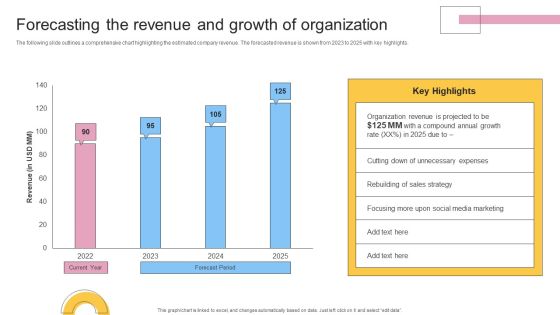
Financial Planning And Examination Plan For Small And Large Enterprises Forecasting The Revenue And Growth Of Organization Clipart PDF
The following slide outlines a comprehensive chart highlighting the estimated company revenue. The forecasted revenue is shown from 2023 to 2025 with key highlights. Do you have to make sure that everyone on your team knows about any specific topic I yes, then you should give Financial Planning And Examination Plan For Small And Large Enterprises Forecasting The Revenue And Growth Of Organization Clipart PDF a try. Our experts have put a lot of knowledge and effort into creating this impeccable Financial Planning And Examination Plan For Small And Large Enterprises Forecasting The Revenue And Growth Of Organization Clipart PDF. You can use this template for your upcoming presentations, as the slides are perfect to represent even the tiniest detail. You can download these templates from the Slidegeeks website and these are easy to edit. So grab these today.

Convertible Note Pitch Deck Funding Strategy Financial Graph Historical And Projection Ppt PowerPoint Presentation Infographics Layouts PDF
Presenting this set of slides with name convertible note pitch deck funding strategy financial graph historical and projection ppt powerpoint presentation infographics layouts pdf. The topics discussed in these slides are financials, revenue, operating income, net income, forecasted. This is a completely editable PowerPoint presentation and is available for immediate download. Download now and impress your audience.

Impact Of Risk On The Financial Performance Of Real Estate Enhancing Process Improvement By Regularly Demonstration PDF
The following slide exhibits the impact of various risks on the real estate company financial performance. The information covered in this slide is related to company profit and sales in year 2022 and 2023. Formulating a presentation can take up a lot of effort and time, so the content and message should always be the primary focus. The visuals of the PowerPoint can enhance the presenters message, so our Impact Of Risk On The Financial Performance Of Real Estate Enhancing Process Improvement By Regularly Demonstration PDF was created to help save time. Instead of worrying about the design, the presenter can concentrate on the message while our designers work on creating the ideal templates for whatever situation is needed. Slidegeeks has experts for everything from amazing designs to valuable content, we have put everything into Impact Of Risk On The Financial Performance Of Real Estate Enhancing Process Improvement By Regularly Demonstration PDF

Monetary Planning And Evaluation Guide Performance KPI Dashboard To Measure Financial Position Of Organization Ppt File Slides PDF
The following slide outlines a comprehensive key performance indicator KPI dashboard highlighting different financial metrics. The KPIs are quick and current ratio, cash balance, days sales outstanding etc. The best PPT templates are a great way to save time, energy, and resources. Slidegeeks have 100 percent editable powerpoint slides making them incredibly versatile. With these quality presentation templates, you can create a captivating and memorable presentation by combining visually appealing slides and effectively communicating your message. Download Monetary Planning And Evaluation Guide Performance KPI Dashboard To Measure Financial Position Of Organization Ppt File Slides PDF from Slidegeeks and deliver a wonderful presentation.

Strategic Fund Acquisition Plan For Business Opertions Expansion Financial KPI Dashboard To Evaluate Fundraising Impact Guidelines PDF
This slide showcases dashboard that can help organization to evaluate key changes in financial KPIs post fundraising. Its key components are net profit margin, revenue, gross profit margin, debt to equity and return on equity. There are so many reasons you need a Strategic Fund Acquisition Plan For Business Opertions Expansion Financial KPI Dashboard To Evaluate Fundraising Impact Guidelines PDF. The first reason is you can not spend time making everything from scratch, Thus, Slidegeeks has made presentation templates for you too. You can easily download these templates from our website easily.

Drug Indicator Extension In A Pharmaceuticals Company Financial Results Of SW Care Company After Implementing Strategies Designs PDF
This slide shows the Financial Results of SW Care Company after implementing Strategies in terms of increasing Net Income and Revenue over the coming years. Deliver and pitch your topic in the best possible manner with this drug indicator extension in a pharmaceuticals company financial results of sw care company after implementing strategies designs pdf. Use them to share invaluable insights on revenue, net income and impress your audience. This template can be altered and modified as per your expectations. So, grab it now.

AI Investor Financing Pitch Deck Financial Projections After Launch Of AI App Ppt Outline Graphic Tips PDF
This template depicts revenue estimation in the first 18 months after launch of the AI application. Here we have includes key takeaways of the presentation and CTA of the project. Deliver an awe inspiring pitch with this creative ai investor financing pitch deck financial projections after launch of ai app ppt outline graphic tips pdf bundle. Topics like financial projections after launch of ai app can be discussed with this completely editable template. It is available for immediate download depending on the needs and requirements of the user.
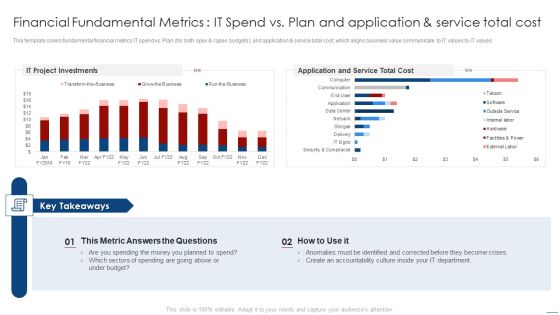
How To Evaluate And Develop The Organizational Value Of IT Service Financial Fundamental Metrics It Spend Structure PDF
This template covers fundamental financial metrics IT spend vs Plan for both opex and capex budgets, and application and service total cost, which aligns business value communicate to IT values to IT values. Deliver an awe inspiring pitch with this creative how to evaluate and develop the organizational value of it service financial fundamental metrics it spend structure pdf bundle. Topics like it project investments, application and service total cost can be discussed with this completely editable template. It is available for immediate download depending on the needs and requirements of the user.
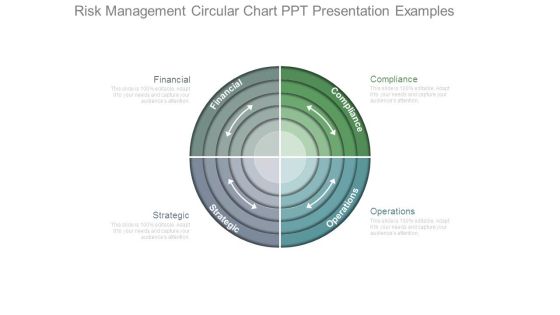
Risk Management Circular Chart Ppt Presentation Examples
This is a risk management circular chart ppt presentation examples. This is a four stage process. The stages in this process are financial, compliance, strategic, operations.

Cloud Intelligence Framework For Application Consumption Financial Losses To The Organizations Due To Security Issues Mockup PDF
The slide provides total financial losses from the year 2017 to 2021 reported by the organizations in United states along with the key reasons behind those losses. Deliver an awe inspiring pitch with this creative cloud intelligence framework for application consumption financial losses to the organizations due to security issues mockup pdf bundle. Topics like security vulnerabilities, primary reasons for the growing, physical theft of a data-carrying device, 2016 to 2020 can be discussed with this completely editable template. It is available for immediate download depending on the needs and requirements of the user.

PowerPoint Template Process Chart Download Ppt Theme
PowerPoint Template process chart Download PPT Theme-Life and Business is made up of processes comprising stages that flow from one to another. An excellent graphic to attract the attention of and understanding by your audience to improve earnings.-3d, arrow, art, business, chart, circle, concept, connection, cycle, development, diagram, direction, element, environment, finance, financial, flow, graphic, group, investment, isolated, market,, movement, organization, passive income, perspective, presentation, process chart, recycle, report, sign, step, success, symbol, teamwork-PowerPoint Template process chart Download PPT Theme
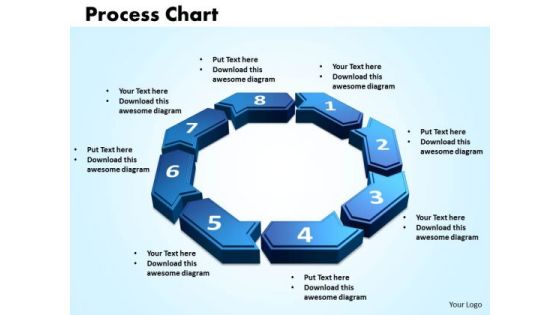
PowerPoint Themes Process Chart Graphic Ppt Template
PowerPoint Themes process chart Graphic PPT Template-Life and Business is made up of processes comprising stages that flow from one to another. An excellent graphic to attract the attention of and understanding by your audience to improve earnings.-3d, arrow, art, business, chart, circle, concept, connection, cycle, development, diagram, direction, element, environment, finance, financial, flow, graphic, group, investment, isolated, market,, movement, organization, passive income, perspective, presentation, process chart, recycle, report, sign, step, success, symbol, teamwork-PowerPoint Themes process chart Graphic PPT Template

PowerPoint Themes Process Chart Marketing Ppt Templates
PowerPoint Themes process Chart Marketing PPT Templates-Life and Business is made up of processes comprising stages that flow from one to another. An excellent graphic to attract the attention of and understanding by your audience to improve earnings.-3d, arrow, art, business, chart, circle, concept, connection, cycle, development, diagram, direction, element, environment, finance, financial, flow, graphic, group, investment, isolated, market,, movement, organization, passive income, perspective, presentation, process chart, recycle, report, sign, step, success, symbol, teamwork-PowerPoint Themes process Chart Marketing PPT Templates

PowerPoint Template Process Chart Leadership Ppt Backgrounds
PowerPoint Template process chart Leadership PPT Backgrounds-Life and Business is made up of processes comprising stages that flow from one to another. An excellent graphic to attract the attention of and understanding by your audience to improve earnings.-3d, arrow, art, business, chart, circle, concept, connection, cycle, development, diagram, direction, element, environment, finance, financial, flow, graphic, group, investment, isolated, market,, movement, organization, passive income, perspective, presentation, process chart, recycle, report, sign, step, success, symbol, teamwork-PowerPoint Template process chart Leadership PPT Backgrounds
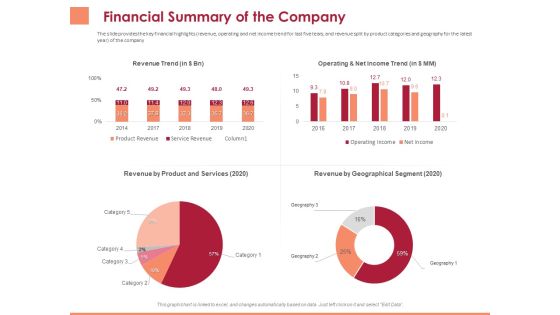
Pitch Deck To Raise Funding From Equity Crowdfunding Financial Summary Of The Company Ppt File Grid PDF
Presenting this set of slides with name pitch deck to raise funding from equity crowdfunding financial summary of the company ppt file grid pdf. The topics discussed in these slides are revenue trend, operating and net income trend, revenue product and services, revenue geographical segment. This is a completely editable PowerPoint presentation and is available for immediate download. Download now and impress your audience.

Financial Fundamental Metrics IT Spend Vs Plan And Application And Service Total Cost Ppt Inspiration Good PDF
Deliver an awe inspiring pitch with this creative financial fundamental metrics it spend vs plan and application and service total cost ppt inspiration good pdf bundle. Topics like application, service, cost, accountability, budget can be discussed with this completely editable template. It is available for immediate download depending on the needs and requirements of the user.

Global Financial Catastrophe 2008 Banks Have Paid Billions Of Dollars In Fine Ppt Visual Aids Diagrams PDF
Deliver an awe inspiring pitch with this creative global financial catastrophe 2008 banks have paid billions of dollars in fine ppt visual aids diagrams pdf bundle. Topics like banks have paid billions of dollars in fine can be discussed with this completely editable template. It is available for immediate download depending on the needs and requirements of the user.

Assessing Stocks In Financial Market Organization Performance Dashboard For Equity Research Ppt PowerPoint Presentation Styles Slide Download PDF
Presenting this set of slides with name assessing stocks in financial market organization performance dashboard for equity research ppt powerpoint presentation styles slide download pdf. The topics discussed in these slides are return equity, return assets, working capital ratio, debt equity ratio. This is a completely editable PowerPoint presentation and is available for immediate download. Download now and impress your audience.

Assessing Stocks In Financial Market Historical Share Price Performance For Equity Research Ppt PowerPoint Presentation Ideas Picture PDF
Presenting this set of slides with name assessing stocks in financial market historical share price performance for equity research ppt powerpoint presentation ideas picture pdf. The topics discussed in these slides are stock price performance, key events, service line launch, equity research, cfo appointed. This is a completely editable PowerPoint presentation and is available for immediate download. Download now and impress your audience.
How Electronic Commerce Financial Procedure Can Be Enhanced P And L Statement To Analyze Net Profits Icons PDF
The following slide depicts P and L statement to assess net profits. It provides information about cost of sales, gross margin, payroll, sales, marketing, depreciation, rent, payroll, interest, taxes, net sales, etc.Formulating a presentation can take up a lot of effort and time, so the content and message should always be the primary focus. The visuals of the PowerPoint can enhance the presenters message, so our How Electronic Commerce Financial Procedure Can Be Enhanced P And L Statement To Analyze Net Profits Icons PDF was created to help save time. Instead of worrying about the design, the presenter can concentrate on the message while our designers work on creating the ideal templates for whatever situation is needed. Slidegeeks has experts for everything from amazing designs to valuable content, we have put everything into How Electronic Commerce Financial Procedure Can Be Enhanced P And L Statement To Analyze Net Profits Icons PDF.
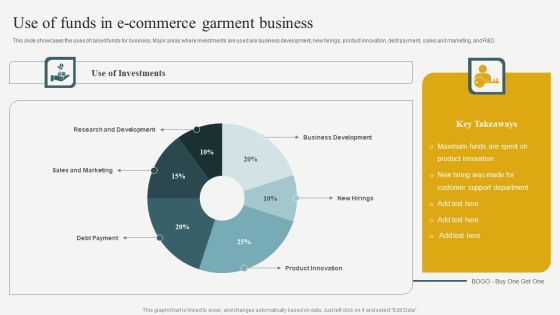
Evaluating Financial Position Of E Commerce Company Use Of Funds In E Commerce Garment Business Structure PDF
This slide showcases the uses of raised funds for business. Major areas where investments are used are business development, new hirings, product innovation, debt payment, sales and marketing, and R and D. Whether you have daily or monthly meetings, a brilliant presentation is necessary. Evaluating Financial Position Of E Commerce Company Use Of Funds In E Commerce Garment Business Structure PDF can be your best option for delivering a presentation. Represent everything in detail using Evaluating Financial Position Of E Commerce Company Use Of Funds In E Commerce Garment Business Structure PDF and make yourself stand out in meetings. The template is versatile and follows a structure that will cater to your requirements. All the templates prepared by Slidegeeks are easy to download and edit. Our research experts have taken care of the corporate themes as well. So, give it a try and see the results.

Financial Planning And Examination Plan For Small And Large Enterprises Leverage Ratios To Measure The Debt Level Background PDF
The following slide outlines top 2 leverage ratios which will assist the in determining the debt level incurred by the organization. This slide provides information about debt to equity and interest coverage ratio of the company and its competitors for the period of last 3 years. Get a simple yet stunning designed Financial Planning And Examination Plan For Small And Large Enterprises Leverage Ratios To Measure The Debt Level Background PDF. It is the best one to establish the tone in your meetings. It is an excellent way to make your presentations highly effective. So, download this PPT today from Slidegeeks and see the positive impacts. Our easy to edit Financial Planning And Examination Plan For Small And Large Enterprises Leverage Ratios To Measure The Debt Level Background PDF can be your go to option for all upcoming conferences and meetings. So, what are you waiting for Grab this template today.
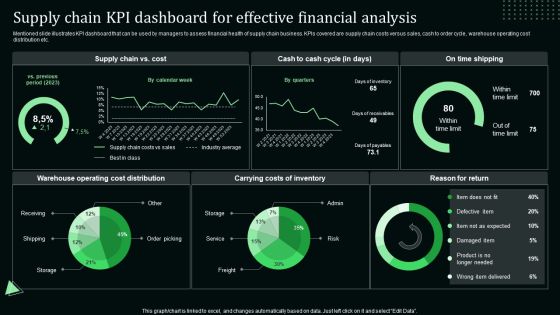
Supply Chain Kpi Dashboard For Effective Financial Analysis Stand Out Digital Supply Chain Tactics Enhancing Graphics PDF
Mentioned slide illustrates KPI dashboard that can be used by managers to assess financial health of supply chain business. KPIs covered are supply chain costs versus sales, cash to order cycle, warehouse operating cost distribution etc.Coming up with a presentation necessitates that the majority of the effort goes into the content and the message you intend to convey. The visuals of a PowerPoint presentation can only be effective if it supplements and supports the story that is being told. Keeping this in mind our experts created Supply Chain Kpi Dashboard For Effective Financial Analysis Stand Out Digital Supply Chain Tactics Enhancing Graphics PDF to reduce the time that goes into designing the presentation. This way, you can concentrate on the message while our designers take care of providing you with the right template for the situation.

Pitch Deck To Raise Capital From Commercial Financial Institution Using Bonds Companys Shareholder Structure With Details Information PDF
This slide shows companys Shareholder structure with shareholder names and their respective percentages Deliver an awe inspiring pitch with this creative pitch deck to raise capital from commercial financial institution using bonds companys shareholder structure with details information pdf bundle. Topics like consumer finance companies, add shareholder details here, banking institutions can be discussed with this completely editable template. It is available for immediate download depending on the needs and requirements of the user.
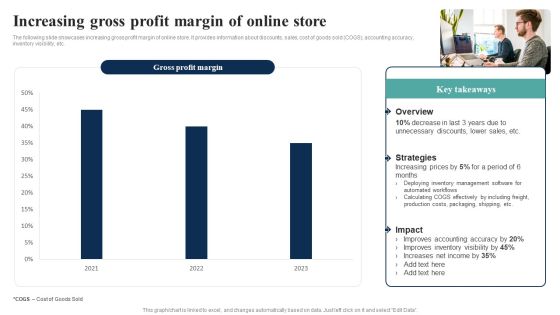
How Electronic Commerce Financial Procedure Can Be Enhanced Increasing Gross Profit Margin Of Online Store Guidelines PDF
The following slide showcases increasing gross profit margin of online store. It provides information about discounts, sales, cost of goods sold COGS, accounting accuracy, inventory visibility, etc. Do you have an important presentation coming up Are you looking for something that will make your presentation stand out from the rest Look no further than How Electronic Commerce Financial Procedure Can Be Enhanced Increasing Gross Profit Margin Of Online Store Guidelines PDF. With our professional designs, you can trust that your presentation will pop and make delivering it a smooth process. And with Slidegeeks, you can trust that your presentation will be unique and memorable. So why wait Grab How Electronic Commerce Financial Procedure Can Be Enhanced Increasing Gross Profit Margin Of Online Store Guidelines PDF today and make your presentation stand out from the rest.

Assessing Stocks In Financial Market Target Companys Shareholding Pattern For Equity Research Marketing Ppt PowerPoint Presentation Icon Show PDF
Presenting this set of slides with name assessing stocks in financial market target companys shareholding pattern for equity research marketing ppt powerpoint presentation icon show pdf. The topics discussed in these slides are general public, promoter group, private, corporate bodies, foreign, institutional investors, domestic, institutional investors. This is a completely editable PowerPoint presentation and is available for immediate download. Download now and impress your audience.
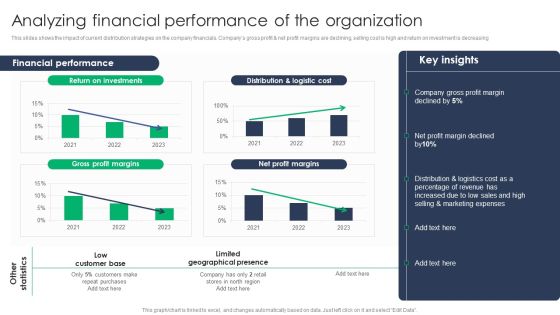
Criterion For Choosing Distribution Channel For Efficient Sales Administration Analyzing Financial Performance Of The Organization Microsoft PDF
This slides shows the impact of current distribution strategies on the company financials. Companys gross profit And net profit margins are declining, selling cost is high and return on investment is decreasing. Find a pre-designed and impeccable Criterion For Choosing Distribution Channel For Efficient Sales Administration Analyzing Financial Performance Of The Organization Microsoft PDF. The templates can ace your presentation without additional effort. You can download these easy-to-edit presentation templates to make your presentation stand out from others. So, what are you waiting for. Download the template from Slidegeeks today and give a unique touch to your presentation.
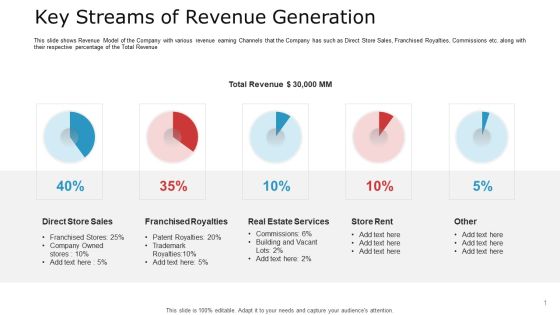
Pitch Deck To Raise Capital From Commercial Financial Institution Using Bonds Key Streams Of Revenue Generation Ideas PDF
This slide shows Revenue Model of the Company with various revenue earning Channels that the Company has such as Direct Store Sales, Franchised Royalties, Commissions etc. along with their respective percentage of the Total Revenue Deliver an awe inspiring pitch with this creative pitch deck to raise capital from commercial financial institution using bonds key streams of revenue generation ideas pdf bundle. Topics like direct store sales, franchised royalties, real estate services can be discussed with this completely editable template. It is available for immediate download depending on the needs and requirements of the user.
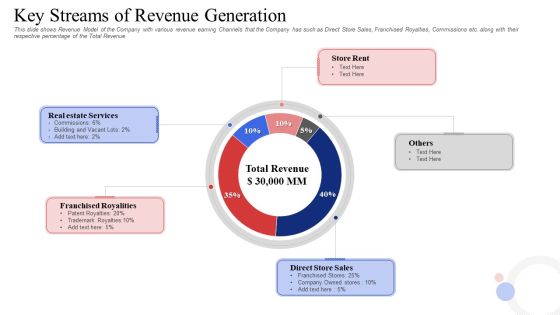
Investor Deck To Procure Receivables Funding From Business Financial Firms Key Streams Of Revenue Generation Topics PDF
This slide shows Revenue Model of the Company with various revenue earning Channels that the Company has such as Direct Store Sales, Franchised Royalties, Commissions etc. along with their respective percentage of the Total Revenue Deliver and pitch your topic in the best possible manner with this investor deck to procure receivables funding from business financial firms key streams of revenue generation topics pdf. Use them to share invaluable insights on real estate services, franchised royalities, direct store sales and impress your audience. This template can be altered and modified as per your expectations. So, grab it now.
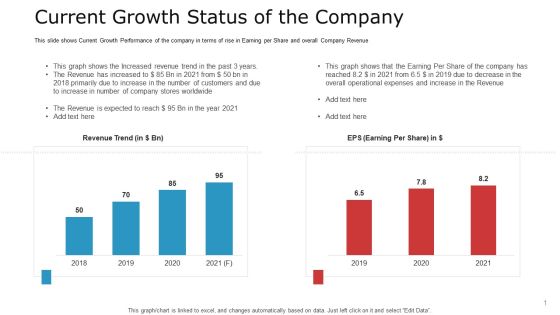
Pitch Deck To Raise Capital From Commercial Financial Institution Using Bonds Current Growth Status Of The Company Guidelines PDF
This slide shows Current Growth Performance of the company in terms of rise in Earning per Share and overall Company Revenue Deliver and pitch your topic in the best possible manner with this pitch deck to raise capital from commercial financial institution using bonds current growth status of the company guidelines pdf. Use them to share invaluable insights on the revenue is expected to reach dollar 95 bn in the year 2021, increase in the revenue, operational expenses and impress your audience. This template can be altered and modified as per your expectations. So, grab it now.
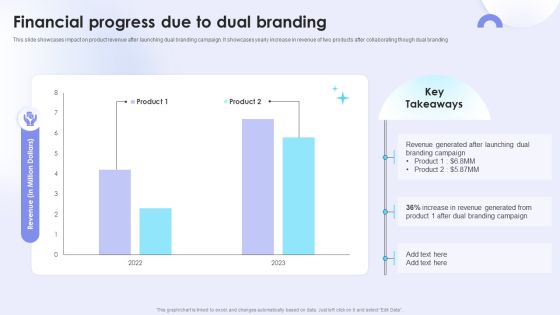
Dual Branding Campaign To Boost Sales Of Product Or Services Financial Progress Due To Dual Branding Pictures PDF
This slide showcases impact on product revenue after launching dual branding campaign. It showcases yearly increase in revenue of two products after collaborating though dual branding Take your projects to the next level with our ultimate collection of DDual Branding Campaign To Boost Sales Of Product Or Services Financial Progress Due To Dual Branding Pictures PDF. Slidegeeks has designed a range of layouts that are perfect for representing task or activity duration, keeping track of all your deadlines at a glance. Tailor these designs to your exact needs and give them a truly corporate look with your own brand colors they will make your projects stand out from the rest.

Investor Pitch Deck Collect Capital Financial Market Market Size And Market Share Of The Industry Information PDF
The slide provides the historical 2016-2020 and forecasted 2021-2025 market size of the banking industry. It also provides the key facts and 2021 market share of top companies in US banking industry. Deliver an awe-inspiring pitch with this creative investor pitch deck collect capital financial market market size and market share of the industry information pdf bundle. Topics like market size banking industry, market share in us banking industry 2021, banking industry facts can be discussed with this completely editable template. It is available for immediate download depending on the needs and requirements of the user.

Cyber Attacks Experienced By The Company In Previous Financial Year Hacking Prevention Awareness Training For IT Security Template PDF
This slide covers the security threats to the organization caused by different departments employees due to lack of cyber security awareness. Deliver an awe inspiring pitch with this creative cyber attacks experienced by the company in previous financial year hacking prevention awareness training for it security template pdf bundle. Topics like phishing, network intrusion, inadvertent disclosure, stolen or lost device or records, system misconfiguration can be discussed with this completely editable template. It is available for immediate download depending on the needs and requirements of the user.
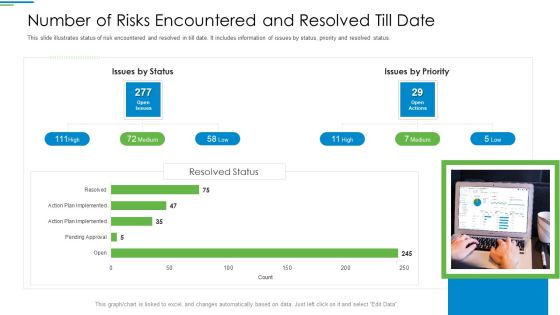
Operational Risk Management Structure In Financial Companies Number Of Risks Encountered And Resolved Till Date Portrait PDF
This slide illustrates status of risk encountered and resolved in till date. It includes information of issues by status, priority and resolved status. Deliver and pitch your topic in the best possible manner with this operational risk management structure in financial companies number of risks encountered and resolved till date portrait pdf. Use them to share invaluable insights on issues by status, issues by priority and impress your audience. This template can be altered and modified as per your expectations. So, grab it now.

Operational Risk Management Structure In Financial Companies Total Number Of Frauds Encountered And Loss Amount Involved Designs PDF
This slide explains year over year total number of frauds occurred in banking sector. It also includes the total amount of loss caused from risk events per year. Deliver and pitch your topic in the best possible manner with this operational risk management structure in financial companies total number of frauds encountered and loss amount involved designs pdf. Use them to share invaluable insights on total number of frauds encountered and loss amount involved and impress your audience. This template can be altered and modified as per your expectations. So, grab it now.
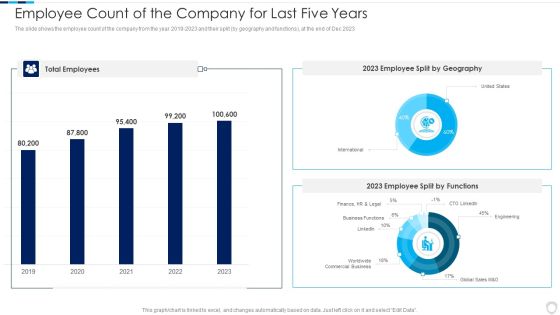
Financial Report Of An IT Firm Employee Count Of The Company For Last Five Years Topics PDF
The slide shows the employee count of the company from the year 2019 to 2023 and their split by geography and functions, at the end of Dec 2023.Deliver an awe inspiring pitch with this creative Financial Report Of An IT Firm Employee Count Of The Company For Last Five Years Topics PDF bundle. Topics like Total Employees, Split Geography, Split Functions can be discussed with this completely editable template. It is available for immediate download depending on the needs and requirements of the user.
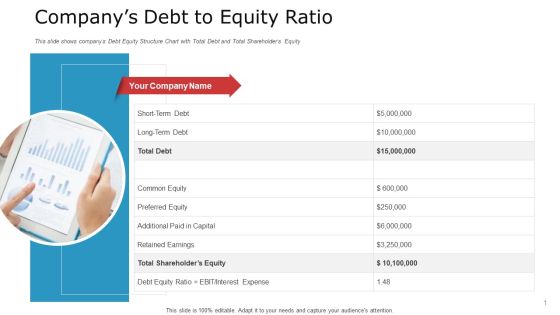
Pitch Deck To Raise Capital From Commercial Financial Institution Using Bonds Companys Debt To Equity Ratio Sample PDF
This slide shows companys Debt Equity Structure Chart with Total Debt and Total Shareholders Equity Deliver an awe-inspiring pitch with this creative pitch deck to raise capital from commercial financial institution using bonds companys debt to equity ratio sample pdf bundle. Topics like preferred equity, additional paid in capital, shareholders equity can be discussed with this completely editable template. It is available for immediate download depending on the needs and requirements of the user.

PowerPoint Templates Process Chart Business Ppt Themes
PowerPoint Templates process chart Business PPT Themes-Create attractive presentations with this pre-designed Process Chart. This will be best suited for coordinated coherences, hierarchies and processes.-3d, arrow, art, business, chart, circle, concept, connection, cycle, development, diagram, direction, element, environment, finance, financial, flow, graphic, group, investment, isolated, market,, movement, organization, passive income, perspective, presentation, process chart, recycle, report, sign, step, success, symbol, teamwork-PowerPoint Templates process chart Business PPT Themes

PowerPoint Designs Process Chart Strategy Ppt Slide
PowerPoint Designs process Chart Strategy PPT Slide-This Process Chart can be used as data flow diagram to show the flow of the data as it moves from beginning process to end result.-3d, arrow, art, business, chart, circle, concept, connection, cycle, development, diagram, direction, element, environment, finance, financial, flow, graphic, group, investment, isolated, market,, movement, organization, passive income, perspective, presentation, process chart, recycle, report, sign, step, success, symbol, teamwork-PowerPoint Designs process Chart Strategy PPT Slide

Portative Analysis Bubble Chart Ppt PowerPoint Presentation Slide
This is a portative analysis bubble chart ppt powerpoint presentation slide. This is a six stage process. The stages in this process are portative, analysis, business, graph, bubble chart.

Dollar Chart Money PowerPoint Template 0610
3d rendered pie chart on white background

Combo Chart Template 1 Ppt PowerPoint Presentation Inspiration
This is a combo chart template 1 ppt powerpoint presentation inspiration. This is a four stage process. The stages in this process are business, marketing, growth, product, finance.

Stock Chart Ppt PowerPoint Presentation Inspiration Graphics Design
This is a stock chart ppt powerpoint presentation inspiration graphics design. This is a five stage process. The stages in this process are high, volume, low.

Volume High Low Close Chart Ppt PowerPoint Presentation Show
This is a volume high low close chart ppt powerpoint presentation show. This is a five stage process. The stages in this process are high, volume, low.

Clustered Column Line Chart Ppt PowerPoint Presentation File Pictures
This is a clustered column line chart ppt powerpoint presentation file pictures. This is a four stage process. The stages in this process are clustered bar, product, planning, business, sales in percentage.

Volume Open High Low Close Chart Ppt PowerPoint Presentation Sample
This is a volume open high low close chart ppt powerpoint presentation sample. This is a five stage process. The stages in this process are close, volume, high, low, open.

X Bar And R Chart Ppt PowerPoint Presentation Background Designs
This is a x bar and r chart ppt powerpoint presentation background designs. This is a two stage process. The stages in this process are chart, business, marketing, strategy, success.
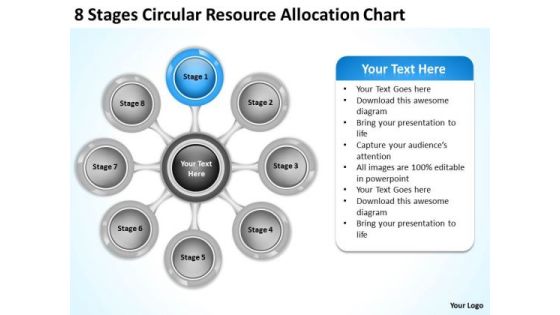
Business Strategy Implementation Resource Allocation Chart Internet
We present our business strategy implementation resource allocation chart internet.Use our Marketing PowerPoint Templates because You will get more than you ever bargained for. Use our Business PowerPoint Templates because Our PowerPoint Templates and Slides will let your words and thoughts hit bullseye everytime. Use our Circle Charts PowerPoint Templates because They will Put the wind in your sails. Skim smoothly over the choppy waters of the market. Download and present our Arrows PowerPoint Templates because Our PowerPoint Templates and Slides will bullet point your ideas. See them fall into place one by one. Present our Process and Flows PowerPoint Templates because Our PowerPoint Templates and Slides will definately Enhance the stature of your presentation. Adorn the beauty of your thoughts with their colourful backgrounds.Use these PowerPoint slides for presentations relating to 3d, Action, Analysis, Attitude, Brainstorming, Business, Chart, Classroom, Concept, Conceptual, Conference, Connection, Corporate, Design, Diagram, Direction, Element, Employee, Enhance, Financial, Formula, Future, Goal, Graphic, Guidelines, Idea, Link, Management, Market, Marketing, Mind, Mind Map, Organization, Organize, Plan, Process, Product, Relation, Render, Solutions, Strategy, Success, Successful, Tactic, Target, Text, Training, Unity. The prominent colors used in the PowerPoint template are Tan, Gray, Black.

Combo Chart Template 1 Ppt PowerPoint Presentation Themes
This is a combo chart template 1 ppt powerpoint presentation themes. This is a four stage process. The stages in this process are business, marketing, finance, timeline, management.

Combo Chart Template 2 Ppt PowerPoint Presentation Graphics
This is a combo chart template 2 ppt powerpoint presentation graphics. This is a three stage process. The stages in this process are business, marketing, finance, growth, management.
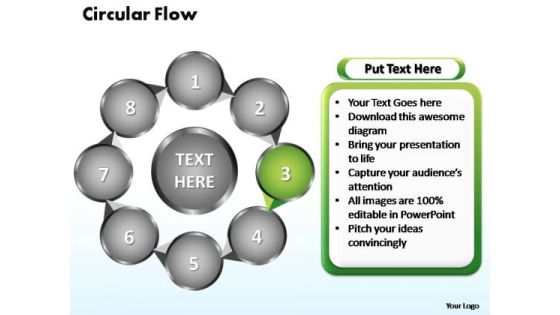
PowerPoint Slides Circular Flow Chart Ppt Theme
PowerPoint Slides Circular Flow Chart PPT Theme-Flowchart is a simple mapping tool that shows the sequence of actions within a process. Flowchart is widely used in business, education and economic presentations to help the audience visualize the content better, or to find flaws in a process.-PowerPoint Slides Circular Flow Chart PPT Theme
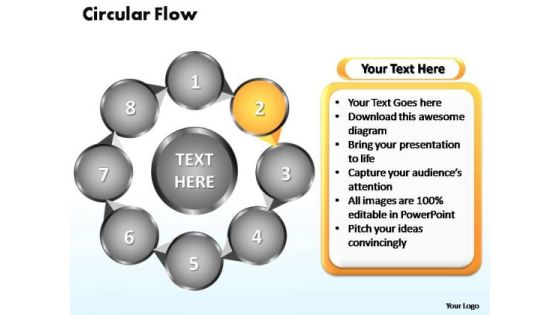
PowerPoint Slides Circular Flow Chart Ppt Themes
PowerPoint Slides Circular Flow Chart PPT Themes-Flowchart is a simple mapping tool that shows the sequence of actions within a process. Flowchart is widely used in business, education and economic presentations to help the audience visualize the content better, or to find flaws in a process.-PowerPoint Slides Circular Flow Chart PPT Themes

PowerPoint Slides Circular Flow Chart Ppt Template
PowerPoint Slides Circular Flow Chart PPT Template-Flowchart is a simple mapping tool that shows the sequence of actions within a process. Flowchart is widely used in business, education and economic presentations to help the audience visualize the content better, or to find flaws in a process.-PowerPoint Slides Circular Flow Chart PPT Template
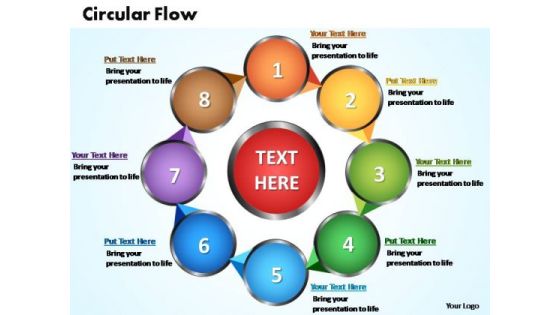
PowerPoint Slides Circular Flow Chart Ppt Templates
PowerPoint Slides Circular Flow Chart PPT Templates-Flowchart is a simple mapping tool that shows the sequence of actions within a process. Flowchart is widely used in business, education and economic presentations to help the audience visualize the content better, or to find flaws in a process.-PowerPoint Slides Circular Flow Chart PPT Templates
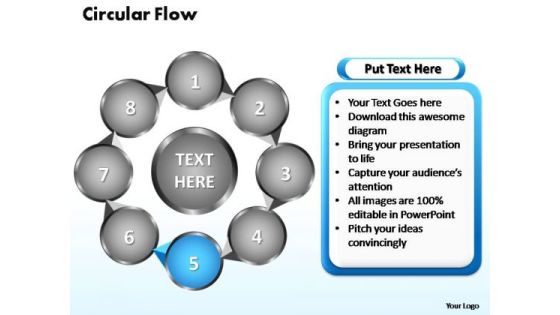
PowerPoint Slides Circular Flow Chart Ppt Design
PowerPoint Slides Circular Flow Chart PPT Design-Flowchart is a simple mapping tool that shows the sequence of actions within a process. Flowchart is widely used in business, education and economic presentations to help the audience visualize the content better, or to find flaws in a process.-PowerPoint Slides Circular Flow Chart PPT Design
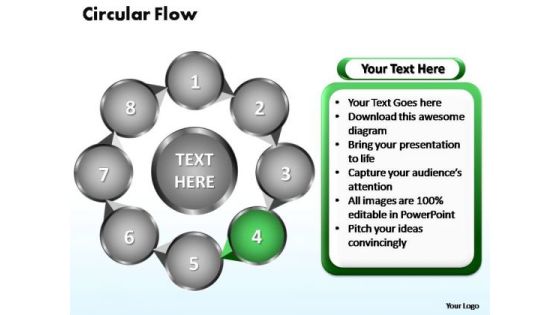
PowerPoint Slides Circular Flow Chart Ppt Designs
PowerPoint Slides Circular Flow Chart PPT Designs-Flowchart is a simple mapping tool that shows the sequence of actions within a process. Flowchart is widely used in business, education and economic presentations to help the audience visualize the content better, or to find flaws in a process.-PowerPoint Slides Circular Flow Chart PPT Designs
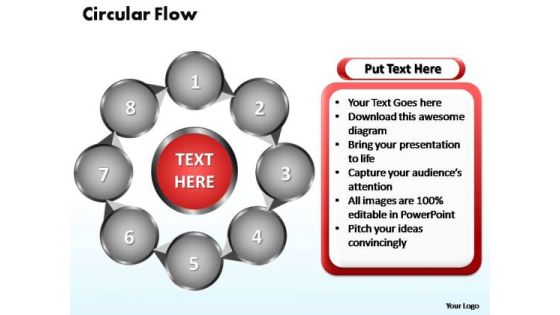
PowerPoint Slides Circular Flow Chart Ppt Layout
PowerPoint Slides Circular Flow Chart PPT Layout-Flowchart is a simple mapping tool that shows the sequence of actions within a process. Flowchart is widely used in business, education and economic presentations to help the audience visualize the content better, or to find flaws in a process.-PowerPoint Slides Circular Flow Chart PPT Layout

PowerPoint Slides Circular Flow Chart Ppt Layouts
PowerPoint Slides Circular Flow Chart PPT Layouts-Flowchart is a simple mapping tool that shows the sequence of actions within a process. Flowchart is widely used in business, education and economic presentations to help the audience visualize the content better, or to find flaws in a process.-PowerPoint Slides Circular Flow Chart PPT Layouts

PowerPoint Slides Circular Flow Chart Ppt Slide
PowerPoint Slides Circular Flow Chart PPT Slide-Flowchart is a simple mapping tool that shows the sequence of actions within a process. Flowchart is widely used in business, education and economic presentations to help the audience visualize the content better, or to find flaws in a process.-PowerPoint Slides Circular Flow Chart PPT Slide

PowerPoint Slides Circular Flow Chart Ppt Slides
PowerPoint Slides Circular Flow Chart PPT Slides-Flowchart is a simple mapping tool that shows the sequence of actions within a process. Flowchart is widely used in business, education and economic presentations to help the audience visualize the content better, or to find flaws in a process.-PowerPoint Slides Circular Flow Chart PPT Slides

PowerPoint Themes Circular Flow Chart Ppt Template
PowerPoint Themes Circular Flow Chart PPT Template-Flowchart is a simple mapping tool that shows the sequence of actions within a process. Flowchart is widely used in business, education and economic presentations to help the audience visualize the content better, or to find flaws in a process.-PowerPoint Themes Circular Flow Chart PPT Template
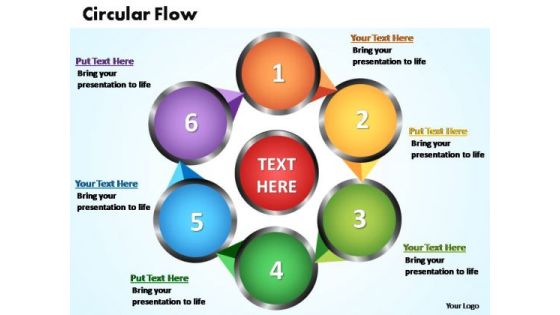
PowerPoint Themes Circular Flow Chart Ppt Templates
PowerPoint Themes Circular Flow Chart PPT Templates-Flowchart is a simple mapping tool that shows the sequence of actions within a process. Flowchart is widely used in business, education and economic presentations to help the audience visualize the content better, or to find flaws in a process.-PowerPoint Themes Circular Flow Chart PPT Templates

PowerPoint Themes Circular Flow Chart Ppt Theme
PowerPoint Themes Circular Flow Chart PPT Theme-Flowchart is a simple mapping tool that shows the sequence of actions within a process. Flowchart is widely used in business, education and economic presentations to help the audience visualize the content better, or to find flaws in a process.-PowerPoint Themes Circular Flow Chart PPT Theme

PowerPoint Themes Circular Flow Chart Ppt Design
PowerPoint Themes Circular Flow Chart PPT Design-Flowchart is a simple mapping tool that shows the sequence of actions within a process. Flowchart is widely used in business, education and economic presentations to help the audience visualize the content better, or to find flaws in a process.-PowerPoint Themes Circular Flow Chart PPT Design

PowerPoint Themes Circular Flow Chart Ppt Designs
PowerPoint Themes Circular Flow Chart PPT Designs-Flowchart is a simple mapping tool that shows the sequence of actions within a process. Flowchart is widely used in business, education and economic presentations to help the audience visualize the content better, or to find flaws in a process.-PowerPoint Themes Circular Flow Chart PPT Designs
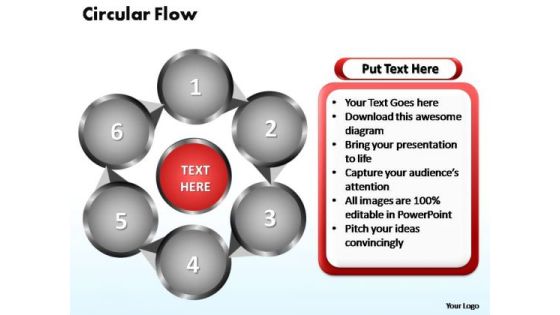
PowerPoint Themes Circular Flow Chart Ppt Layouts
PowerPoint Themes Circular Flow Chart PPT Layouts-Flowchart is a simple mapping tool that shows the sequence of actions within a process. Flowchart is widely used in business, education and economic presentations to help the audience visualize the content better, or to find flaws in a process.-PowerPoint Themes Circular Flow Chart PPT Layouts
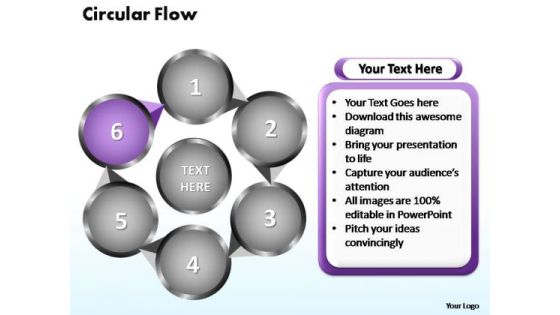
PowerPoint Themes Circular Flow Chart Ppt Slide
PowerPoint Themes Circular Flow Chart PPT Slide-Flowchart is a simple mapping tool that shows the sequence of actions within a process. Flowchart is widely used in business, education and economic presentations to help the audience visualize the content better, or to find flaws in a process.-PowerPoint Themes Circular Flow Chart PPT Slide

PowerPoint Themes Circular Flow Chart Ppt Slides
PowerPoint Themes Circular Flow Chart PPT Slides-Flowchart is a simple mapping tool that shows the sequence of actions within a process. Flowchart is widely used in business, education and economic presentations to help the audience visualize the content better, or to find flaws in a process.-PowerPoint Themes Circular Flow Chart PPT Slides

combo chart template 2 ppt powerpoint presentation background images
This is a combo chart template 2 ppt powerpoint presentation background images. This is a four stage process. The stages in this process are business, marketing, finance, timeline, product.

Retail Outlet Revenue Growth Chart Mockup PDF
This slide shows the revenue growth line chart of a retail store which includes passing footfall, customers per day, percentage of customer who purchased, revenue per day and revenue per year. Pitch your topic with ease and precision using this retail outlet revenue growth chart mockup pdf This layout presents information on Retail outlet revenue growth chart It is also available for immediate download and adjustment. So, changes can be made in the color, design, graphics or any other component to create a unique layout.

PowerPoint Theme Round Chart Marketing Ppt Slides
PowerPoint Theme Round Chart Marketing PPT Slides-This Diagram shows you the eight factors responsible for economic growth in Business .It can be used for creating Business presentations where four factors combined to result in one factor.-PowerPoint Theme Round Chart Marketing PPT Slides

Yearly Selling Forecasts Revenue Chart Summary PDF
This slide covers projections for yearly revenue generation from product sales. It includes forecasted revenue for different years and a graph depicting the projected sales revenue growth. Showcasing this set of slides titled Yearly Selling Forecasts Revenue Chart Summary PDF. The topics addressed in these templates are Project Sales Revenue, Forecasts Revenue Chart. All the content presented in this PPT design is completely editable. Download it and make adjustments in color, background, font etc. as per your unique business setting.
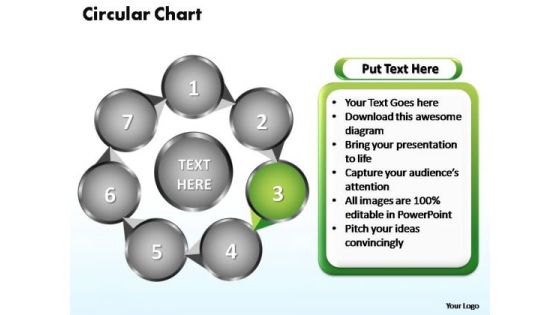
PowerPoint Designs Circular Flow Chart Ppt Theme
PowerPoint Designs Circular Flow Chart PPT Theme-Flowchart is a simple mapping tool that shows the sequence of actions within a process. Flowchart is widely used in business, education and economic presentations to help the audience visualize the content better, or to find flaws in a process.-PowerPoint Designs Circular Flow Chart PPT Theme
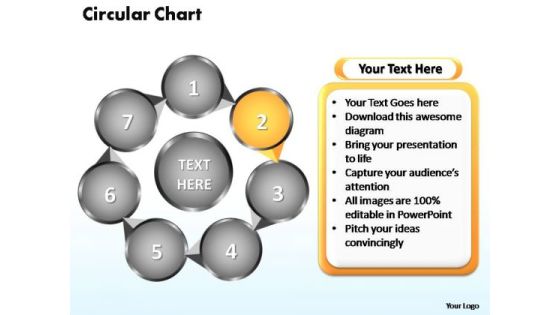
PowerPoint Designs Circular Flow Chart Ppt Themes
PowerPoint Designs Circular Flow Chart PPT Themes-Flowchart is a simple mapping tool that shows the sequence of actions within a process. Flowchart is widely used in business, education and economic presentations to help the audience visualize the content better, or to find flaws in a process.-PowerPoint Designs Circular Flow Chart PPT Themes
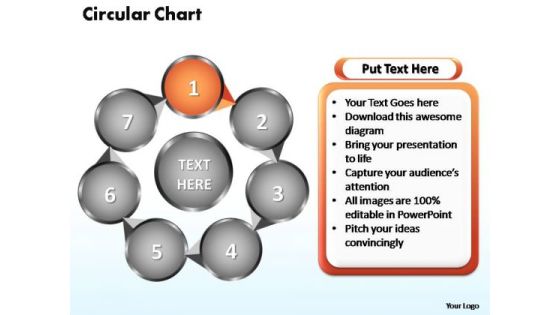
PowerPoint Designs Circular Flow Chart Ppt Template
PowerPoint Designs Circular Flow Chart PPT Template-Flowchart is a simple mapping tool that shows the sequence of actions within a process. Flowchart is widely used in business, education and economic presentations to help the audience visualize the content better, or to find flaws in a process.-PowerPoint Designs Circular Flow Chart PPT Template
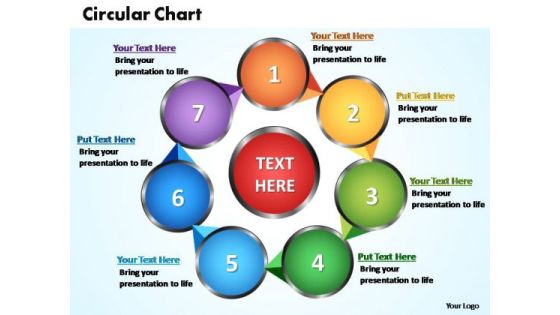
PowerPoint Designs Circular Flow Chart Ppt Templates
PowerPoint Designs Circular Flow Chart PPT Templates-Flowchart is a simple mapping tool that shows the sequence of actions within a process. Flowchart is widely used in business, education and economic presentations to help the audience visualize the content better, or to find flaws in a process.-PowerPoint Designs Circular Flow Chart PPT Templates
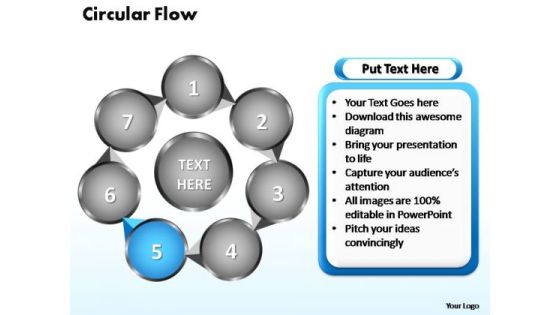
PowerPoint Designs Circular Flow Chart Ppt Design
PowerPoint Designs Circular Flow Chart PPT Design-Flowchart is a simple mapping tool that shows the sequence of actions within a process. Flowchart is widely used in business, education and economic presentations to help the audience visualize the content better, or to find flaws in a process.-PowerPoint Designs Circular Flow Chart PPT Design
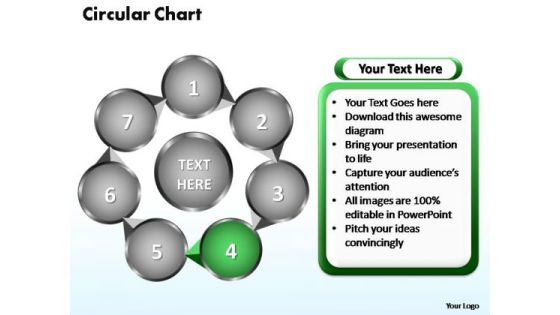
PowerPoint Designs Circular Flow Chart Ppt Designs
PowerPoint Designs Circular Flow Chart PPT Designs-Flowchart is a simple mapping tool that shows the sequence of actions within a process. Flowchart is widely used in business, education and economic presentations to help the audience visualize the content better, or to find flaws in a process.-PowerPoint Designs Circular Flow Chart PPT Designs

PowerPoint Designs Circular Flow Chart Ppt Slide
PowerPoint Designs Circular Flow Chart PPT Slide-Flowchart is a simple mapping tool that shows the sequence of actions within a process. Flowchart is widely used in business, education and economic presentations to help the audience visualize the content better, or to find flaws in a process.-PowerPoint Designs Circular Flow Chart PPT Slide
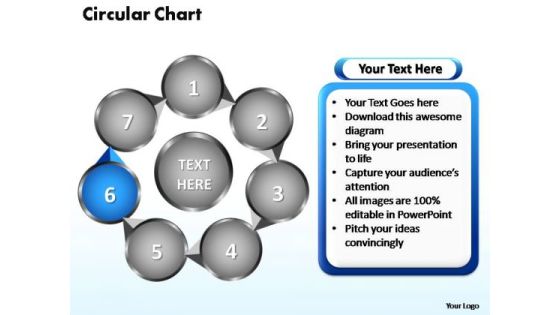
PowerPoint Designs Circular Flow Chart Ppt Slides
PowerPoint Designs Circular Flow Chart PPT Slides-Flowchart is a simple mapping tool that shows the sequence of actions within a process. Flowchart is widely used in business, education and economic presentations to help the audience visualize the content better, or to find flaws in a process.-PowerPoint Designs Circular Flow Chart PPT Slides
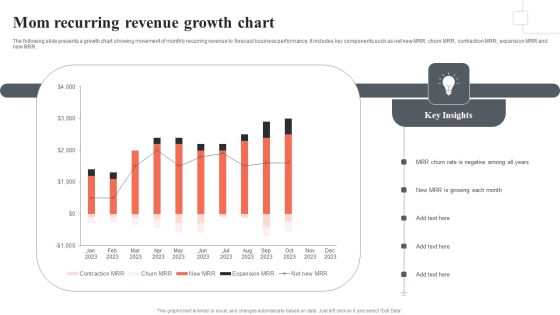
Mom Recurring Revenue Growth Chart Themes PDF
The following slide presents a growth chart showing movement of monthly recurring revenue to forecast business performance. It includes key components such as net new MRR, churn MRR, contraction MRR, expansion MRR and new MRR. Showcasing this set of slides titled Mom Recurring Revenue Growth Chart Themes PDF. The topics addressed in these templates are MRR Churn Rate, Negative, MRR Growing Each Month. All the content presented in this PPT design is completely editable. Download it and make adjustments in color, background, font etc. as per your unique business setting.

Combo Chart Finance Ppt PowerPoint Presentation Summary Images
Presenting this set of slides with name combo chart finance ppt powerpoint presentation summary images. The topics discussed in these slides are combo chart, product, growth rate, market size, financial year. This is a completely editable PowerPoint presentation and is available for immediate download. Download now and impress your audience.

Business Market Research Services Chart Slides
This is a business market research services chart slides. This is a five stage process. The stages in this process are detailed demographic and expenditure reports, competitive analysis trends and benchmarks, industry and economic profile by region, sme performance reports by sector, information on businesses in canada and north america.

Economic Order Quantity Chart Ppt Example File
This is a economic order quantity chart ppt example file. This is a four stage process. The stages in this process are inventory cost, ordering, carrying, eoq model.
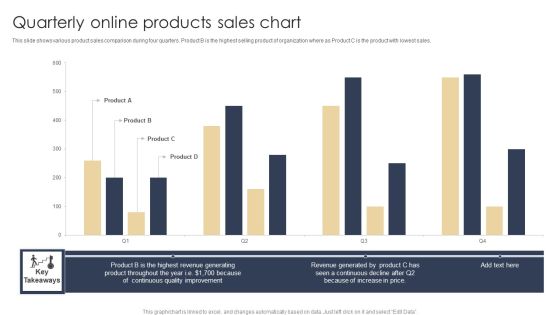
Quarterly Online Products Sales Chart Graphics PDF
This slide shows various product sales comparison during four quarters. Product B is the highest selling product of organization where as Product C is the product with lowest sales. Showcasing this set of slides titled Quarterly Online Products Sales Chart Graphics PDF. The topics addressed in these templates are Revenue Generated, Increase In Price, Quality. All the content presented in this PPT design is completely editable. Download it and make adjustments in color, background, font etc. as per your unique business setting.
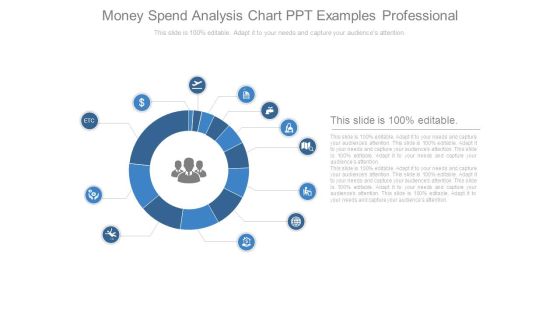
Money Spend Analysis Chart Ppt Examples Professional
This is a money spend analysis chart ppt examples professional. This is a twelve stage process. The stages in this process are marketing, business, icon, process, management.

Money Expenditure Analysis Chart Ppt Background Graphics
This is a money expenditure analysis chart ppt background graphics. This is a twelve stage process. The stages in this process are icons, strategy, business, marketing, presentation.

Human Capital Management Chart Powerpoint Topics
This is a human capital management chart powerpoint topics. This is a four stage process. The stages in this process are talent, success, career, opportunity.

Customer Onboarding Team Hierarchical Chart Designs PDF
This slide showcases structure of customer onboarding team which includes marketing, support team and sales manager. It further includes digital and affiliate marketing executive, onboarding and training specialist. Make sure to capture your audiences attention in your business displays with our gratis customizable Customer Onboarding Team Hierarchical Chart Designs PDF. These are great for business strategies, office conferences, capital raising or task suggestions. If you desire to acquire more customers for your tech business and ensure they stay satisfied, create your own sales presentation with these plain slides.

Cost Benefit Assessment Arrow Chart Presentation Outline
This is a cost benefit assessment arrow chart presentation outline. This is a two stage process. The stages in this process are compare, arrows, finance, money, strategy.

Best Business Accounting Chart Example Ppt Slides
This is a best business accounting chart example ppt slides. This is a four stage process. The stages in this process are tax, audit, balances, book keeping.
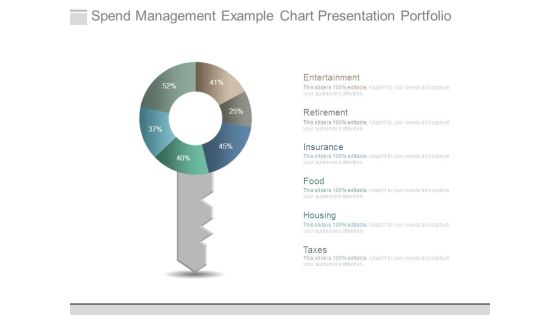
Spend Management Example Chart Presentation Portfolio
This is a spend management example chart presentation portfolio. This is a six stage process. The stages in this process are entertainment, retirement, insurance, food, housing, taxes.
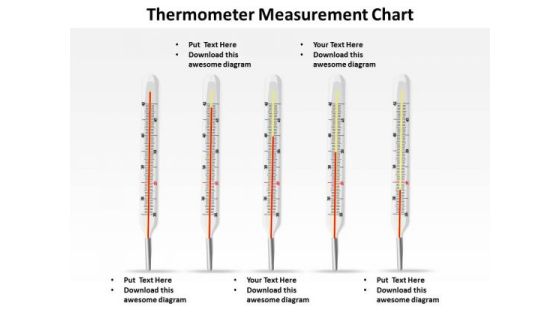
Sales Diagram Thermometer Measurement Chart Marketing Diagram
Your Grasp Of Economics Is Well Known. Help Your Audience Comprehend Issues With Our Sales Diagram Thermometer Measurement Chart Marketing Diagram Powerpoint Templates.

Business Economic Cycle Chart Ppt Templates
This is a business economic cycle chart ppt templates. This is a four stage process. The stages in this process are economic prosperity, falling prices, economic depression, rising prices.

Economic Development Administration Organization Chart Ppt Slides
This is a economic development administration organization chart ppt slides. This is a five stage process. The stages in this process are economic development, business assistance center, business development, enterprise zone, district organizing.

Value Production Flow Chart Presentation Powerpoint
This is a value production flow chart presentation powerpoint. This is a three stage process. The stages in this process are value production, cost, revenue, profit.
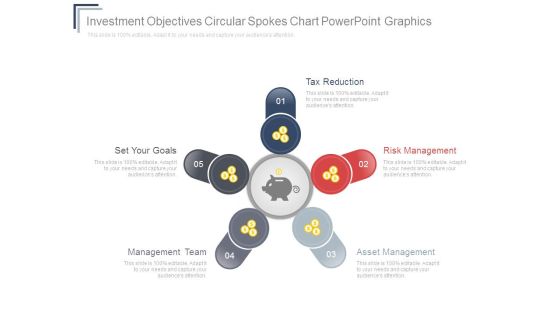
Investment Objectives Circular Spokes Chart Powerpoint Graphics
This is a investment objectives circular spokes chart powerpoint graphics. This is a five stage process. The stages in this process are tax reduction, set your goals, management team, asset management, risk management.

Revenue And Expenditures Cycle Chart Ppt Design
This is a revenue and expenditures cycle chart ppt design. This is a four stage process. The stages in this process are cash check disbursement, cash check receipt journal, bank account, bank reconciliation.

Customer Revenue Statistical Chart Powerpoint Templates Microsoft
This is a customer revenue statistical chart powerpoint templates microsoft. This is a ten stage process. The stages in this process are email, display retargeting, comparison shopping, display, affiliates, inbound free links, brand organic search, brand paid search.

Governance Growth System Chart Example Of Ppt
This is a governance growth system chart example of ppt. This is a four stage process. The stages in this process are accountable government, solid institution, political system, socio economic growth, governance.

Mutual Fund Flow Chart Ppt Presentation
This is a mutual fund flow chart ppt presentation. This is a four stage process. The stages in this process are passed back to, generates, pool their money with, invest in, returns, securities, fund manager, investors.

International Portfolio Functions Chart Ppt Examples Professional
This is a international portfolio functions chart ppt examples professional. This is a five stage process. The stages in this process are value, tools for cash, human capital, alignment, balance.

Business Model Canvas Chart Ppt Images
This is a business model canvas chart ppt images. This is a five stage process. The stages in this process are key partners, key activities, value propositions, customer relationships, customer segments, key resources, channels, cost structure, revenue streams.

Business Model Canvas Chart Example Ppt Presentation
This is a business model canvas chart example ppt presentation. This is a five stage process. The stages in this process are key partners, key activities, value propositions, customer relationships, customer segments, key resources, channels, cost structure, revenue streams.

New Business Model Chart Presentation Powerpoint Example
This is a new business model chart presentation powerpoint example. This is a five stage process. The stages in this process are key partners, key activities, value propositions, customer, relationships, customer segments, key resources, channels, cost structure, revenue streams.

Competitor Analysis Chart Ppt PowerPoint Presentation Visuals
This is a competitor analysis chart ppt powerpoint presentation visuals. This is a five stage process. The stages in this process are revenue, profit, market share, main activity, number of employee, product quality.

 Home
Home