Errc Graph
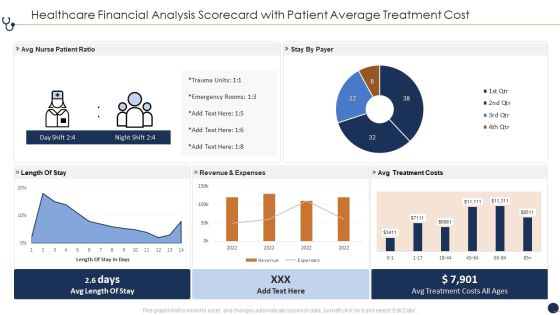
Healthcare Financial Analysis Scorecard With Patient Average Treatment Cost Ppt Infographic Template Slide Portrait PDF
This graph or chart is linked to excel, and changes automatically based on data. Just left click on it and select Edit Data. Deliver and pitch your topic in the best possible manner with this Healthcare Financial Analysis Scorecard With Patient Average Treatment Cost Ppt Infographic Template Slide Portrait PDF. Use them to share invaluable insights on Avg Nurse Patient, Revenue And Expenses, Avg Treatment Costs and impress your audience. This template can be altered and modified as per your expectations. So, grab it now.

Shipment Supplier Scorecard With Total Spend And Ontime Delivery Ppt Slides Templates PDF
This graph or chart is linked to excel, and changes automatically based on data. Just left click on it and select Edit Data. Deliver and pitch your topic in the best possible manner with this Shipment Supplier Scorecard With Total Spend And Ontime Delivery Ppt Slides Templates PDF. Use them to share invaluable insights on Shipping Vendor Avg, Time Delivery Goal, Spend Over Time, OTD Delivery Percent and impress your audience. This template can be altered and modified as per your expectations. So, grab it now.

Canned Food Company Profile Net Profit And Margin Information PDF
This slide illustrates a graph of net profit in USdollar and gross margin in percentage for food company. Additionally, it shows net profit of all business lines of the company food, beverage and dairy products Deliver and pitch your topic in the best possible manner with this Canned Food Company Profile Net Profit And Margin Information PDF Use them to share invaluable insights on Net Profit, Margin and impress your audience. This template can be altered and modified as per your expectations. So, grab it now.

Canned Food Company Profile Operating Profit And Margin Background PDF
This slide illustrates a graph of operating profit in USdollar and gross margin in percentage for food company. Additionally, it shows operating profit of all business lines of the company food, beverage and dairy products Deliver an awe inspiring pitch with this creative Canned Food Company Profile Operating Profit And Margin Background PDF bundle. Topics like Dairy Operating, Beverage Operating , Total Operating can be discussed with this completely editable template. It is available for immediate download depending on the needs and requirements of the user.

Search Engine Optimization Services Dashboard With Google Ranking Ppt Gallery Demonstration PDF
This slide covers the different SEO services and the impact of them on the business. It includes the number of website visitors, Google ranking , site audit score, audience growth graph and many more things. Pitch your topic with ease and precision using this Search Engine Optimization Services Dashboard With Google Ranking Ppt Gallery Demonstration PDF. This layout presents information on Audience Growth Paid, Adwords Conversions Score. It is also available for immediate download and adjustment. So, changes can be made in the color, design, graphics or any other component to create a unique layout.
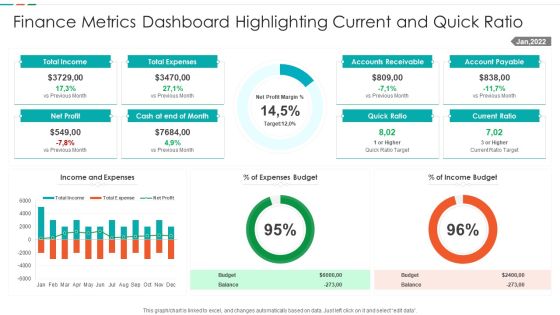
Finance Metrics Dashboard Highlighting Current And Quick Ratio Template PDF
This graph or chart is linked to excel, and changes automatically based on data. Just left click on it and select edit data. Showcasing this set of slides titled Finance Metrics Dashboard Highlighting Current And Quick Ratio Template PDF. The topics addressed in these templates are Total Income Budget, Total Expenses Balance, Net Profit Quick, Ratio Current Ratio. All the content presented in this PPT design is completely editable. Download it and make adjustments in color, background, font etc. as per your unique business setting.
Finance Metrics Dashboard Illustrating Account Payables Icons PDF
This graph or chart is linked to excel, and changes automatically based on data. Just left click on it and select edit data. Pitch your topic with ease and precision using this Total Income Budget, Total Expenses Balance, Net Profit Quick, Ratio Current Ratio. This layout presents information on Account Payable Age, Average Creditor Days, Cash On Hand. It is also available for immediate download and adjustment. So, changes can be made in the color, design, graphics or any other component to create a unique layout.

Finance Metrics Dashboard Illustrating Income And Cash Flow Template PDF
This graph or chart is linked to excel, and changes automatically based on data. Just left click on it and select edit data. Pitch your topic with ease and precision using this Finance Metrics Dashboard Illustrating Income And Cash Flow Template PDF. This layout presents information on Current Accounts Receivable, Current Account Payable, Cash End Period, Account Receivable Account. It is also available for immediate download and adjustment. So, changes can be made in the color, design, graphics or any other component to create a unique layout.

Finance Metrics Dashboard Indicating Account Receivable And Account Payable Demonstration PDF
This graph or chart is linked to excel, and changes automatically based on data. Just left click on it and select edit data. Showcasing this set of slides titled Finance Metrics Dashboard Indicating Account Receivable And Account Payable Demonstration PDF. The topics addressed in these templates are Total Accounts Receivable, Total Accounts Payable, Recommended Payment Timeline, Monthly Cash Flow. All the content presented in this PPT design is completely editable. Download it and make adjustments in color, background, font etc. as per your unique business setting.
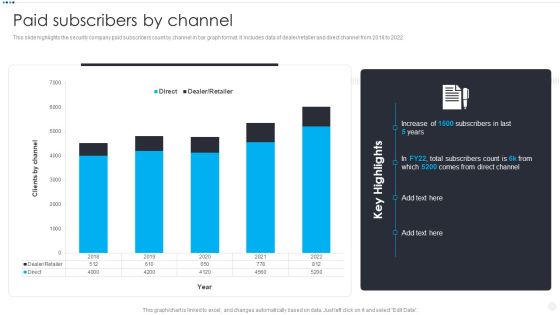
Smart Home Security Solutions Company Profile Paid Subscribers By Channel Clipart PDF
This slide highlights the security company paid subscribers count by channel in bar graph format. It includes data of dealer or retailer and direct channel from 2018 to 2022. Deliver an awe inspiring pitch with this creative Smart Home Security Solutions Company Profile Paid Subscribers By Channel Clipart PDF bundle. Topics like Direct Dealer Retailer, 2018 To 2022, Clients By Channel can be discussed with this completely editable template. It is available for immediate download depending on the needs and requirements of the user.
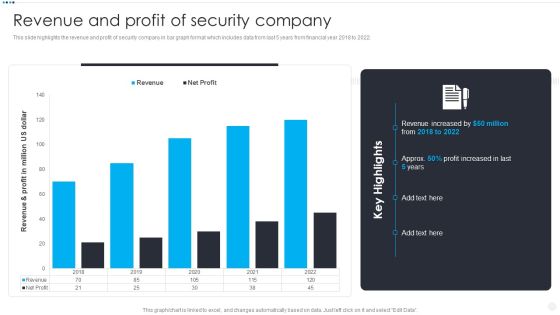
Smart Home Security Solutions Company Profile Revenue And Profit Of Security Company Elements PDF
This slide highlights the revenue and profit of security company in bar graph format which includes data from last 5 years from financial year 2018 to 2022. Deliver and pitch your topic in the best possible manner with this Smart Home Security Solutions Company Profile Revenue And Profit Of Security Company Elements PDF. Use them to share invaluable insights on Revenue And Profit, Million US Dollar, Revenue Increased Profit and impress your audience. This template can be altered and modified as per your expectations. So, grab it now.
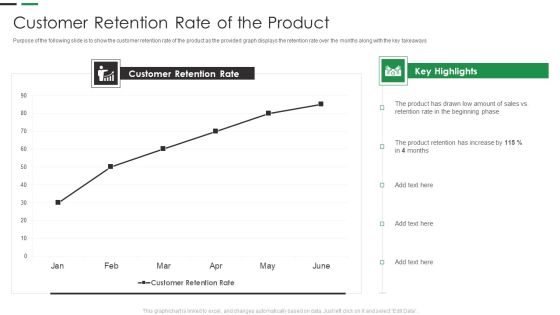
Evaluating New Commodity Impact On Market Customer Retention Rate Of The Product Rules PDF
Purpose of the following slide is to show the customer retention rate of the product as the provided graph displays the retention rate over the months along with the key takeaways Deliver and pitch your topic in the best possible manner with this Evaluating New Commodity Impact On Market Customer Retention Rate Of The Product Rules PDF Use them to share invaluable insights on Key Highlights, Product Retention, Customer Retention and impress your audience. This template can be altered and modified as per your expectations. So, grab it now.

Evaluating New Commodity Impact On Market Product Sales Vs Product Return Template PDF
Purpose of the following slide is to show the product sales vs. product return ratio of the organization, the provided graph displays the sales of the product in each month in comparison to the returns Deliver an awe inspiring pitch with this creative Evaluating New Commodity Impact On Market Product Sales Vs Product Return Template PDF bundle. Topics like Experienced Highest, Returns Comparison, Key Takeaways can be discussed with this completely editable template. It is available for immediate download depending on the needs and requirements of the user.
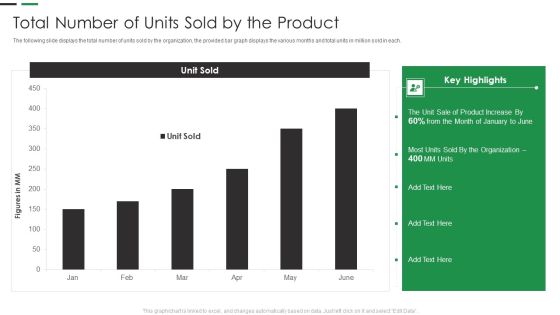
Evaluating New Commodity Impact On Market Total Number Of Units Sold By The Product Clipart PDF
The following slide displays the total number of units sold by the organization, the provided bar graph displays the various months and total units in million sold in each.Deliver and pitch your topic in the best possible manner with this Evaluating New Commodity Impact On Market Total Number Of Units Sold By The Product Clipart PDF Use them to share invaluable insights on Product Increase, Total Units, Sold Product and impress your audience. This template can be altered and modified as per your expectations. So, grab it now.
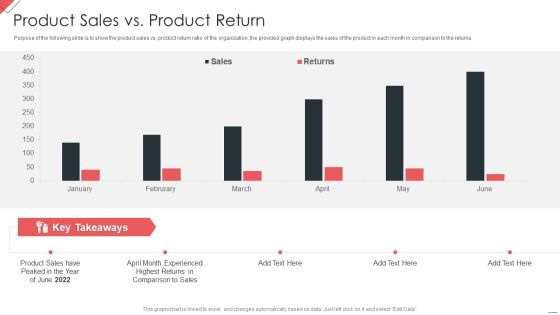
New Commodity Market Viability Review Product Sales Vs Product Return Mockup PDF
Purpose of the following slide is to show the product sales vs. product return ratio of the organization, the provided graph displays the sales of the product in each month in comparison to the returns Deliver an awe inspiring pitch with this creative New Commodity Market Viability Review Product Sales Vs Product Return Mockup PDF bundle. Topics like Product Sales, Comparison Sales, Highest Returns can be discussed with this completely editable template. It is available for immediate download depending on the needs and requirements of the user.
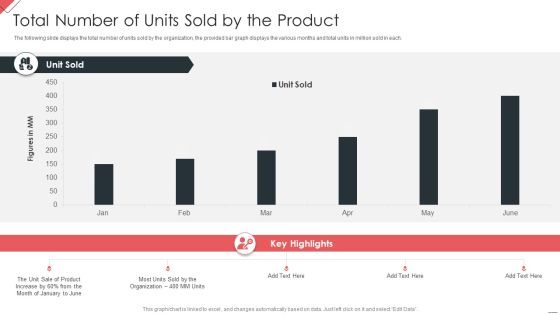
New Commodity Market Viability Review Total Number Of Units Sold By The Product Guidelines PDF
The following slide displays the total number of units sold by the organization, the provided bar graph displays the various months and total units in million sold in each.Deliver and pitch your topic in the best possible manner with this New Commodity Market Viability Review Total Number Of Units Sold By The Product Guidelines PDF Use them to share invaluable insights on Key Highlights, Total Units, Sold Product and impress your audience. This template can be altered and modified as per your expectations. So, grab it now.
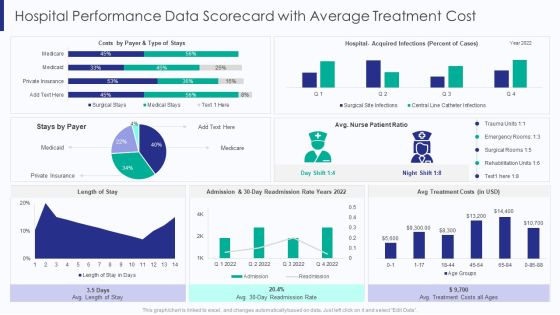
Healthcare Hospital Performance Data Scorecard With Average Treatment Cost Ppt Ideas Guide PDF
This graph or chart is linked to excel, and changes automatically based on data. Just left click on it and select Edit Data. Deliver and pitch your topic in the best possible manner with this Healthcare Hospital Performance Data Scorecard With Average Treatment Cost Ppt Ideas Guide PDF. Use them to share invaluable insights on Type Of Stays, Stays By Payer, Avg Treatment Costs, 30 Day Readmission and impress your audience. This template can be altered and modified as per your expectations. So, grab it now.
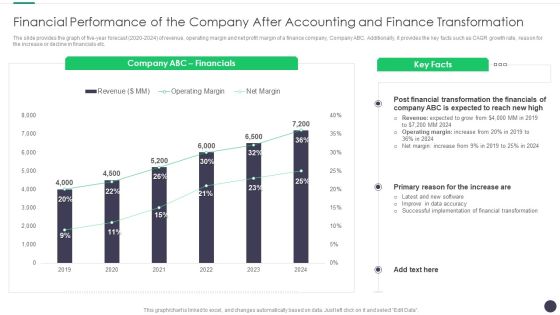
Finance And Accounting Online Conversion Plan Financial Performance Of The Company Brochure PDF
The slide provides the graph of five year forecast 2020 to 2024 of revenue, operating margin and net profit margin of a finance company, Company ABC. Additionally, it provides the key facts such as CAGR growth rate, reason for the increase or decline in financials etc. Deliver and pitch your topic in the best possible manner with this Finance And Accounting Online Conversion Plan Financial Performance Of The Company Brochure PDF. Use them to share invaluable insights on Company, Financials, Financial Transformation and impress your audience. This template can be altered and modified as per your expectations. So, grab it now.
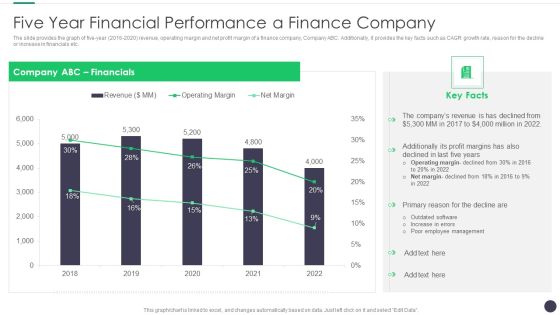
Finance And Accounting Online Conversion Plan Five Year Financial Performance A Finance Company Professional PDF
The slide provides the graph of five-year 2016 to 2020 revenue, operating margin and net profit margin of a finance company, Company ABC. Additionally, it provides the key facts such as CAGR growth rate, reason for the decline or increase in financials etc. Deliver and pitch your topic in the best possible manner with this Finance And Accounting Online Conversion Plan Five Year Financial Performance A Finance Company Professional PDF. Use them to share invaluable insights on Company, Financials, Revenue and impress your audience. This template can be altered and modified as per your expectations. So, grab it now.
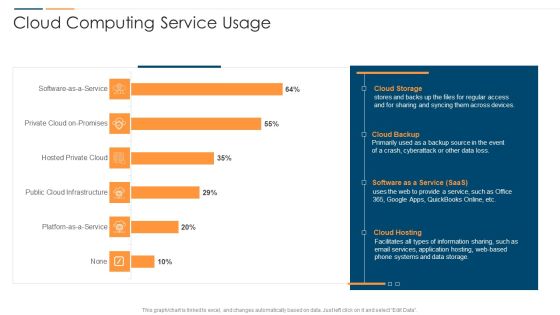
Revolution In Online Business Cloud Computing Service Usage Ppt PowerPoint Presentation File Themes PDF
This graph or chart is linked to excel, and changes automatically based on data. Just left click on it and select Edit Data. Deliver and pitch your topic in the best possible manner with this Revolution In Online Business Cloud Computing Service Usage Ppt PowerPoint Presentation File Themes PDF. Use them to share invaluable insights on Cloud Storage System, Cloud Backup Saas, Cloud Hosting Storage and impress your audience. This template can be altered and modified as per your expectations. So, grab it now.
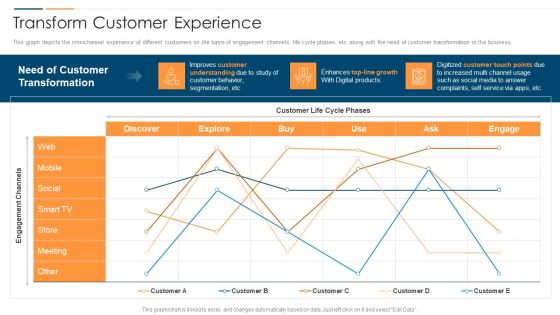
Revolution In Online Business Transform Customer Experience Ppt PowerPoint Presentation Gallery Microsoft PDF
This graph depicts the omnichannel experience of different customer on the basis of engagement channels, life cycle phases, etc. along with the need of customer transformation in the business. Deliver an awe inspiring pitch with this creative Revolution In Online Business Transform Customer Experience Ppt PowerPoint Presentation Gallery Microsoft PDF bundle. Topics like Engagement Channels Customer, Need Customer Transformation, Growth Digital Products can be discussed with this completely editable template. It is available for immediate download depending on the needs and requirements of the user.
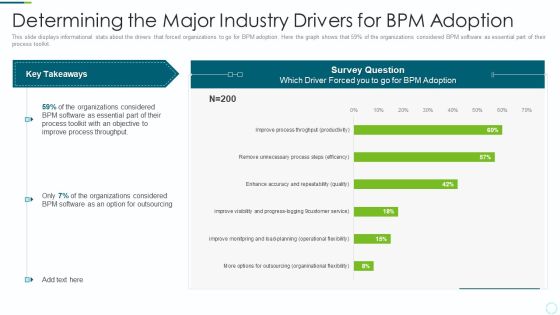
Implementing BPM Techniques Determining The Major Industry Drivers For Bpm Adoption Guidelines PDF
This slide displays informational stats about the drivers that forced organizations to go for BPM adoption. Here the graph shows that 59 parcent of the organizations considered BPM software as essential part of their process toolkit. Deliver and pitch your topic in the best possible manner with this Implementing BPM Techniques Determining The Major Industry Drivers For Bpm Adoption Guid. Use them to share invaluable insights on Productivity, Organizational Flexibility, Customer Service and impress your audience. This template can be altered and modified as per your expectations. So, grab it now.
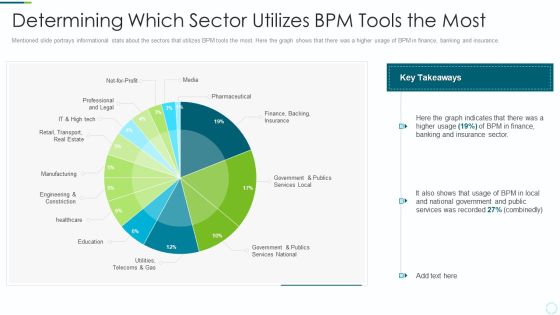
Implementing BPM Techniques Determining Which Sector Utilizes BPM Tools The Most Ideas PDF
Mentioned slide portrays informational stats about the sectors that utilizes BPM tools the most. Here the graph shows that there was a higher usage of BPM in finance, banking and insurance. Deliver and pitch your topic in the best possible manner with this Implementing BPM Techniques Determining Which Sector Utilizes BPM Tools The Most Ideas PDF. Use them to share invaluable insights on Manufacturing, Professional, Engineering Constriction and impress your audience. This template can be altered and modified as per your expectations. So, grab it now.
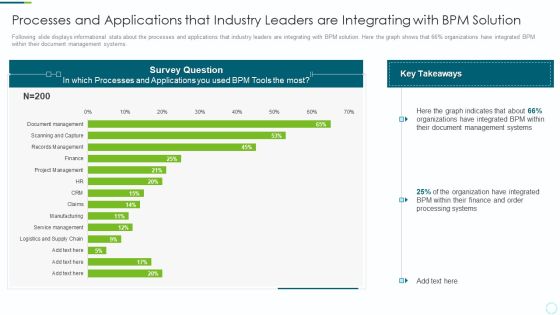
Implementing BPM Techniques Processes And Applications That Industry Leaders Are Integrating With BPM Solution Summary PDF
Following slide displays informational stats about the processes and applications that industry leaders are integrating with BPM solution. Here the graph shows that 66 pacent organizations have integrated BPM within their document management systems. Deliver and pitch your topic in the best possible manner with this Implementing BPM Techniques Processes And Applications That Industry Leaders Are Integrating With BPM Solution Summary PDF. Use them to share invaluable insights on Project Management, Service Management, Finance and impress your audience. This template can be altered and modified as per your expectations. So, grab it now.

Implementing Agile Software Development Methodology For Cost Cutting IT Determining Current Resource Introduction PDF
This slide provide informational stats about the resource cost bear by the organization while using traditional methodology. Here the graph indicates that development stage is the most costlier among requirement, design and test stages.Deliver and pitch your topic in the best possible manner with this Implementing Agile Software Development Methodology For Cost Cutting IT Determining Current Resource Introduction PDF Use them to share invaluable insights on Project Development, Development Stage, Requirement Design and impress your audience. This template can be altered and modified as per your expectations. So, grab it now.

Implementing Agile Software Development Methodology For Cost Cutting IT Identifying Why Organizations Slides PDF
Following slide provides informational statistics about the major reasons behind adopting agile methodologies. Here the graph indicates that most of the organization prefer agile methodology to accelerate software delivery.Deliver and pitch your topic in the best possible manner with this Implementing Agile Software Development Methodology For Cost Cutting IT Identifying Why Organizations Slides PDF Use them to share invaluable insights on Reduce Failure, Increase Collaboration, Increase Productivity and impress your audience. This template can be altered and modified as per your expectations. So, grab it now.
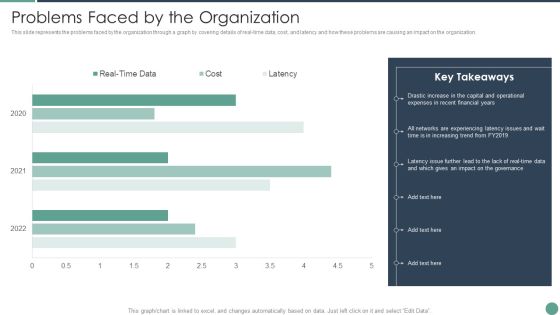
Distributed Computing Problems Faced By The Organization Professional PDF
This slide represents the problems faced by the organization through a graph by covering details of real-time data, cost, and latency and how these problems are causing an impact on the organization.Deliver and pitch your topic in the best possible manner with this Distributed Computing Problems Faced By The Organization Professional PDF Use them to share invaluable insights on Drastic Increase, Expenses Recent, Experiencing Latency and impress your audience. This template can be altered and modified as per your expectations. So, grab it now.

Industry Sizing And Market Analysis For Aerated Drinks Industry Elevator Pitch Deck Information PDF
The following slide displays the Industry sizing and the market opportunity of the organization as it highlight the key stats of the Beverage industry like CAGR, the Industry size and Industry growth per region. The provided graph displays the average spending of single US citizen on beverage consumption.Deliver an awe inspiring pitch with this creative Industry Sizing And Market Analysis For Aerated Drinks Industry Elevator Pitch Deck Information PDF bundle. Topics like Average Annual, Spending Beverage, Consumption Citizen can be discussed with this completely editable template. It is available for immediate download depending on the needs and requirements of the user.
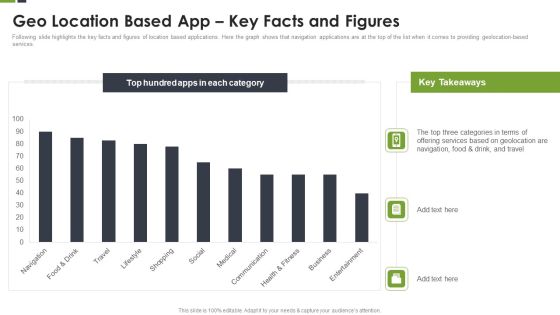
LBS Application Elevator Geo Location Based App Key Facts And Figures Ppt Infographic Template Example Topics PDF
Following slide highlights the key facts and figures of location based applications. Here the graph shows that navigation applications are at the top of the list when it comes to providing geolocation-based services. Deliver and pitch your topic in the best possible manner with this LBS Application Elevator Geo Location Based App Key Facts And Figures Ppt Infographic Template Example Topics PDF. Use them to share invaluable insights on Health Fitness, Business Entertainment, Social Medical and impress your audience. This template can be altered and modified as per your expectations. So, grab it now.
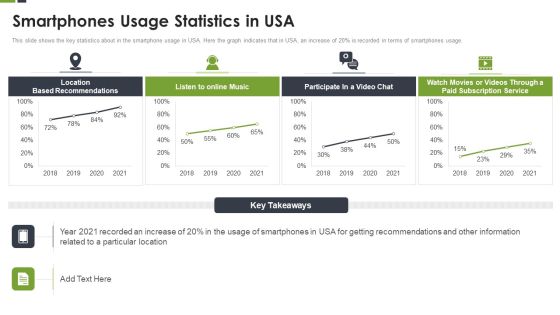
LBS Application Elevator Smartphones Usage Statistics In Usa Ppt Infographics Grid PDF
This slide shows the key statistics about in the smartphone usage in USA. Here the graph indicates that in USA, an increase of 20 percent is recorded in terms of smartphones usage. Deliver and pitch your topic in the best possible manner with this LBS Application Elevator Smartphones Usage Statistics In Usa Ppt Infographics Grid PDF. Use them to share invaluable insights on Location Based, Subscription Service, Particular Location and impress your audience. This template can be altered and modified as per your expectations. So, grab it now.

Effective Sales Plan For New Product Introduction In Market Annual Sales Highlights Template PDF
Mentioned slide displays annual sales performance highlight of the firm in US region. It also portrays sales performance stats of that firm in FY2020 recorded low sales in South and Northeast America. Deliver an awe inspiring pitch with this creative Effective Sales Plan For New Product Introduction In Market Annual Sales Highlights Template PDF bundle. Topics like Sales Performance, Graph Indicates, Key Takeaways can be discussed with this completely editable template. It is available for immediate download depending on the needs and requirements of the user.
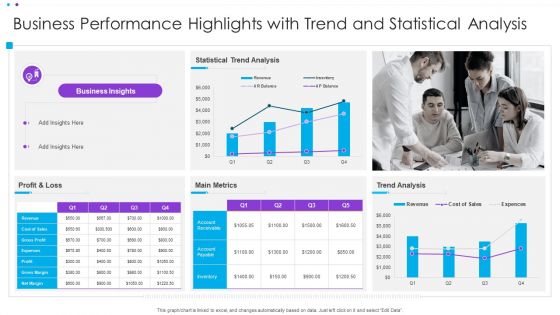
Business Performance Highlights With Trend And Statistical Analysis Ppt Infographic Template Display PDF
This graph or chart is linked to excel, and changes automatically based on data. Just left click on it and select Edit Data. Pitch your topic with ease and precision using this Business Performance Highlights With Trend And Statistical Analysis Ppt Infographic Template Display PDF. This layout presents information on Statistical Trend Analysis, Main Metrics, Profit And Loss. It is also available for immediate download and adjustment. So, changes can be made in the color, design, graphics or any other component to create a unique layout.
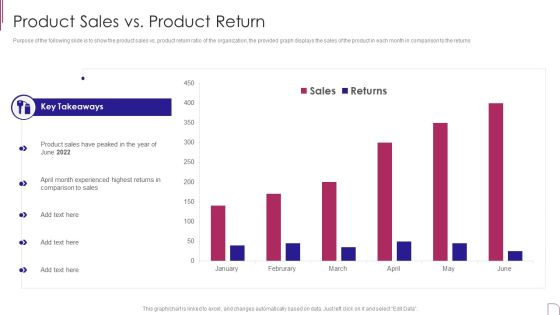
Yearly Product Performance Assessment Repor Product Sales Vs Product Return Information PDF
Purpose of the following slide is to show the product sales vs. product return ratio of the organization, the provided graph displays the sales of the product in each month in comparison to the returns.Deliver an awe inspiring pitch with this creative Yearly Product Performance Assessment Repor Product Sales Vs Product Return Information PDF bundle. Topics like Key Takeaways, Experienced Highest, Comparison Sales can be discussed with this completely editable template. It is available for immediate download depending on the needs and requirements of the user.
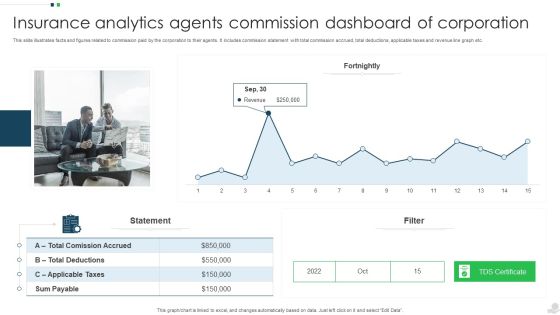
Insurance Analytics Agents Commission Dashboard Of Corporation Introduction PDF
This slide illustrates facts and figures related to commission paid by the corporation to their agents. It includes commission statement with total commission accrued, total deductions, applicable taxes and revenue line graph etc. Pitch your topic with ease and precision using this Insurance Analytics Agents Commission Dashboard Of Corporation Introduction PDF. This layout presents information on Applicable Taxes, Sum Payable, Revenue. It is also available for immediate download and adjustment. So, changes can be made in the color, design, graphics or any other component to create a unique layout.
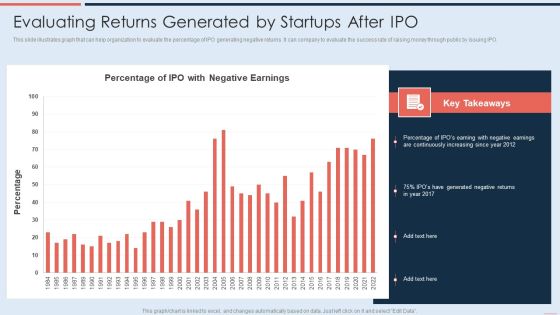
Evaluating Returns Generated By Startups After IPO Brochure PDF
This slide illustrates graph that can help organization to evaluate the percentage of IPO generating negative returns. It can company to evaluate the success rate of raising money through public by issuing IPO. Deliver and pitch your topic in the best possible manner with this Evaluating Returns Generated By Startups After IPO Brochure PDF. Use them to share invaluable insights on Percentage, Continuously Increasing, Generated Negative Returns and impress your audience. This template can be altered and modified as per your expectations. So, grab it now.

Digital Marketing Agency Business Profile Revenue And Net Profit Diagrams PDF
This slide highlights the revenue and net profit of digital marketing agency through bar graph and tabular format. It covers three years data of revenue, gross margin and net profit. Deliver and pitch your topic in the best possible manner with this Digital Marketing Agency Business Profile Revenue And Net Profit Diagrams PDF. Use them to share invaluable insights on Increase In Revenue, Growth Rate, Net Profit and impress your audience. This template can be altered and modified as per your expectations. So, grab it now.
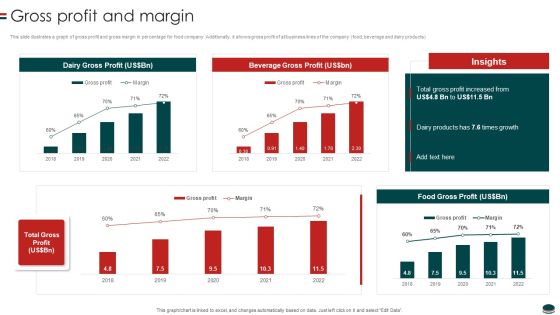
Instant Snacks And Food Firm Details Gross Profit And Margin Professional PDF
This slide illustrates a graph of gross profit and gross margin in percentage for food company. Additionally, it shows gross profit of all business lines of the company food, beverage and dairy products.Deliver an awe inspiring pitch with this creative Instant Snacks And Food Firm Details Gross Profit And Margin Professional PDF bundle. Topics like Gross Profit, Beverage Gross, Dairy Products can be discussed with this completely editable template. It is available for immediate download depending on the needs and requirements of the user.

Instant Snacks And Food Firm Details Net Profit And Margin Microsoft PDF
This slide illustrates a graph of net profit in US and gross margin in percentage for food company. Additionally, it shows net profit of all business lines of the company food, beverage and dairy products.Deliver and pitch your topic in the best possible manner with this Instant Snacks And Food Firm Details Net Profit And Margin Microsoft PDF Use them to share invaluable insights on Profit Increased, Profit Margin, Disrupted Supply and impress your audience. This template can be altered and modified as per your expectations. So, grab it now.
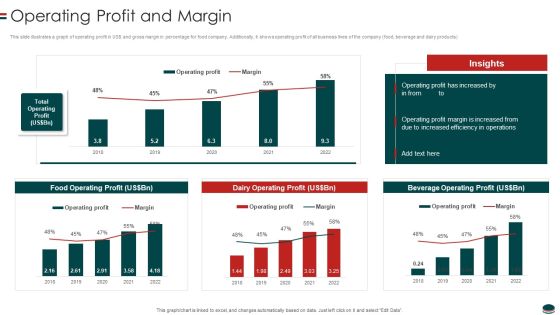
Instant Snacks And Food Firm Details Operating Profit And Margin Themes PDF
This slide illustrates a graph of operating profit in US and gross margin in percentage for food company. Additionally, it shows operating profit of all business lines of the company food, beverage and dairy products.Deliver an awe inspiring pitch with this creative Instant Snacks And Food Firm Details Operating Profit And Margin Themes PDF bundle. Topics like Operating Profit, Increased Efficiency, Beverage Operating can be discussed with this completely editable template. It is available for immediate download depending on the needs and requirements of the user.
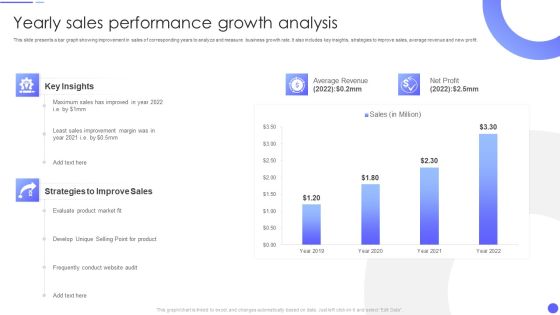
Yearly Sales Performance Growth Analysis Rules PDF
This slide presents a bar graph showing improvement in sales of corresponding years to analyze and measure business growth rate. It also includes key insights, strategies to improve sales, average revenue and new profit.Pitch your topic with ease and precision using this Yearly Sales Performance Growth Analysis Rules PDF This layout presents information on Average Revenue, Strategies To Improve, Sales Improvement It is also available for immediate download and adjustment. So, changes can be made in the color, design, graphics or any other component to create a unique layout.
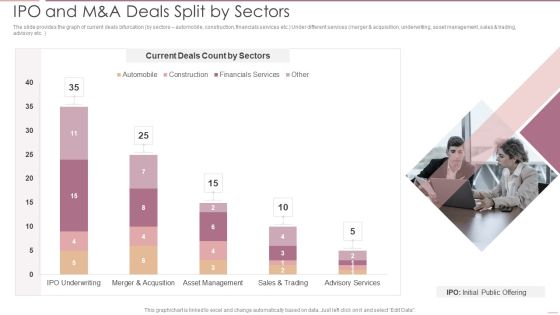
Investment Banking Security Underwriting Pitchbook IPO And M And A Deals Split By Sectors Brochure PDF
The slide provides the graph of current deals bifurcation by sectors automobile, construction, financials services etc.Under different services merger and acquisition, underwriting, asset management, sales trading, advisory etc.Deliver and pitch your topic in the best possible manner with this Investment Banking Security Underwriting Pitchbook IPO And M And A Deals Split By Sectors Brochure PDF Use them to share invaluable insights on Current Deals, Merger And Acquisition, Asset Management and impress your audience. This template can be altered and modified as per your expectations. So, grab it now.
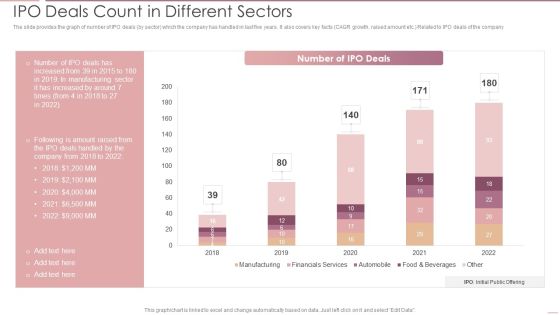
Investment Banking Security Underwriting Pitchbook IPO Deals Count In Different Sectors Mockup PDF
The slide provides the graph of number of IPO deals by sector which the company has handled in last five years. It also covers key facts CAGR growth, raised amount etc. Related to IPO deals of the company.Deliver and pitch your topic in the best possible manner with this Investment Banking Security Underwriting Pitchbook IPO Deals Count In Different Sectors Mockup PDF Use them to share invaluable insights on Manufacturing, Automobile, Financials Services and impress your audience. This template can be altered and modified as per your expectations. So, grab it now.
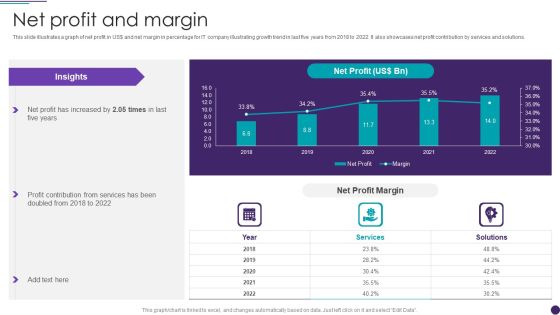
IT Services Business Profile Net Profit And Margin Sample PDF
This slide illustrates a graph of net profit in US doller and net margin in percentage for IT company illustrating growth trend in last five years from 2018 to 2022. It also showcases net profit contribution by services and solutions. Deliver and pitch your topic in the best possible manner with this IT Services Business Profile Net Profit And Margin Sample PDF. Use them to share invaluable insights on Services, Net Profit Margin and impress your audience. This template can be altered and modified as per your expectations. So, grab it now.

IT Services Business Profile Operating Profit And Margin Sample PDF
This slide illustrates a graph of operating profit in US doller and operating margin in percentage for IT company illustrating growth trend in last five years from 2018 to 2022. It also showcases operating profit contribution by services and solutions. Deliver an awe inspiring pitch with this creative IT Services Business Profile Operating Profit And Margin Sample PDF bundle. Topics like Operating Profit, Services can be discussed with this completely editable template. It is available for immediate download depending on the needs and requirements of the user.
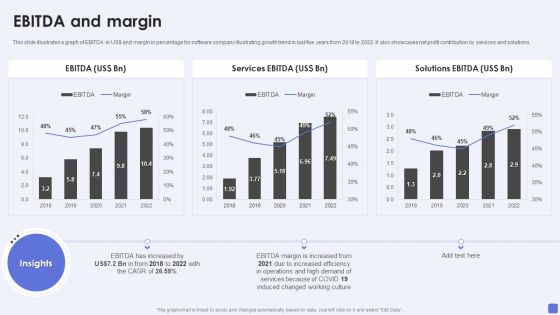
Software Services Business Profile EBITDA And Margin Ppt PowerPoint Presentation Gallery Slide Portrait PDF
This slide illustrates a graph of EBITDA in US dollar and margin in percentage for software company illustrating growth trend in last five years from 2018 to 2022. It also showcases net profit contribution by services and solutions. Deliver an awe inspiring pitch with this creative Software Services Business Profile EBITDA And Margin Ppt PowerPoint Presentation Gallery Slide Portrait PDF bundle. Topics like Services EB, Solutions EBITDA, EBITDA Margin can be discussed with this completely editable template. It is available for immediate download depending on the needs and requirements of the user.

Software Services Business Profile Gross Profit And Margin Ppt PowerPoint Presentation Gallery Templates PDF
This slide illustrates a graph of gross profit in US dollar and gross margin in percentage for software company illustrating growth trend in last five years from 2018 to 2022. It also showcases gross profit contribution by services and solutions. Deliver an awe inspiring pitch with this creative Software Services Business Profile Gross Profit And Margin Ppt PowerPoint Presentation Gallery Templates PDF bundle. Topics like Total Gross Profit, Services Gross Profit, Solutions Gross Profit can be discussed with this completely editable template. It is available for immediate download depending on the needs and requirements of the user.
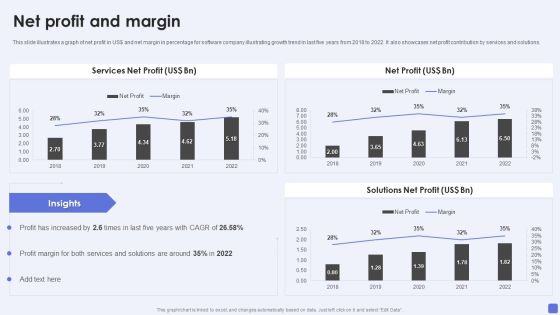
Software Services Business Profile Net Profit And Margin Ppt PowerPoint Presentation File Slides PDF
This slide illustrates a graph of net profit in US dollar and net margin in percentage for software company illustrating growth trend in last five years from 2018 to 2022. It also showcases net profit contribution by services and solutions. Deliver an awe inspiring pitch with this creative Software Services Business Profile Net Profit And Margin Ppt PowerPoint Presentation File Slides PDF bundle. Topics like Services Net Profit, Net Profit, Solutions Net Profit can be discussed with this completely editable template. It is available for immediate download depending on the needs and requirements of the user.

Software Services Business Profile Operating Profit And Margin Ppt PowerPoint Presentation Gallery Inspiration PDF
This slide illustrates a graph of operating profit in US dollar and operating margin in percentage for software company illustrating growth trend in last five years from 2018 to 2022. It also showcases operating profit contribution by services and solutions. Deliver and pitch your topic in the best possible manner with this Software Services Business Profile Operating Profit And Margin Ppt PowerPoint Presentation Gallery Inspiration PDF. Use them to share invaluable insights on Operating Profit, Services Operating Profit, Solutions Operating Profit and impress your audience. This template can be altered and modified as per your expectations. So, grab it now.
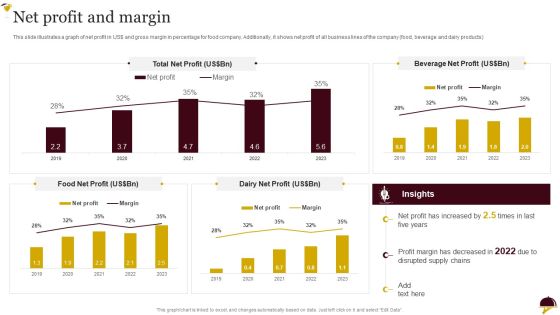
Food Company Overview Net Profit And Margin Summary PDF
This slide illustrates a graph of net profit in USdollar and gross margin in percentage for food company. Additionally, it shows net profit of all business lines of the company food, beverage and dairy products.Deliver and pitch your topic in the best possible manner with this Food Company Overview Net Profit And Margin Summary PDF Use them to share invaluable insights on Beverage Net, Margin Decreased, Disrupted Supply and impress your audience. This template can be altered and modified as per your expectations. So, grab it now.

Security And Surveillance Company Profile Revenue And Profit Of Security Company Microsoft PDF
This slide highlights the revenue and profit of security company in bar graph format which includes data from last 5 years from financial year 2018 to 2022.Deliver and pitch your topic in the best possible manner with this Security And Surveillance Company Profile Revenue And Profit Of Security Company Microsoft PDF. Use them to share invaluable insights on Revenue Increased, Increased In Last, Key Highlights and impress your audience. This template can be altered and modified as per your expectations. So, grab it now.

Yearly Saas Cloud Security Expenditure Analysis Ppt PowerPoint Presentation File Deck PDF
The following slide depicts the annual spending of organizations on SaaS security services to prevent data breaches. It constitutes of graph representing the varying expenditure based of the size of the company. Pitch your topic with ease and precision using this Yearly Saas Cloud Security Expenditure Analysis Ppt PowerPoint Presentation File Deck PDF. This layout presents information on Saas Investment, Employees. It is also available for immediate download and adjustment. So, changes can be made in the color, design, graphics or any other component to create a unique layout.
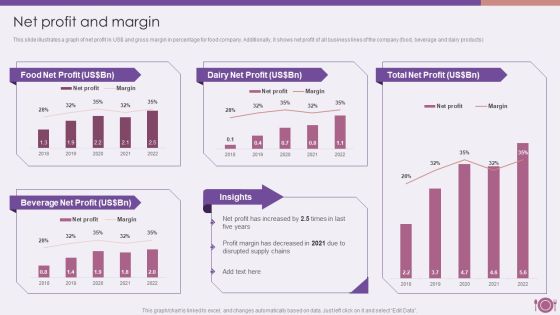
Packaged Food Firm Description Net Profit And Margin Download PDF
This slide illustrates a graph of net profit in USdollar and gross margin in percentage for food company. Additionally, it shows net profit of all business lines of the company food, beverage and dairy products.Deliver and pitch your topic in the best possible manner with this Packaged Food Firm Description Net Profit And Margin Download PDF. Use them to share invaluable insights on Dairy Net, Total Net, Beverage Net Profit and impress your audience. This template can be altered and modified as per your expectations. So, grab it now.
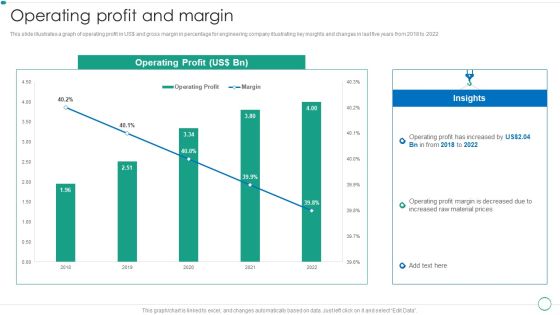
Real Estate Construction And Engineering Company Profile Operating Profit And Margin Designs PDF
This slide illustrates a graph of operating profit in US and gross margin in percentage for engineering company illustrating key insights and changes in last five years from 2018 to 2022.Deliver and pitch your topic in the best possible manner with this Real Estate Construction And Engineering Company Profile Operating Profit And Margin Designs PDF. Use them to share invaluable insights on Operating Profit, Insights, Material Prices and impress your audience. This template can be altered and modified as per your expectations. So, grab it now.

Knowledge Process Outsourcing Company Profile Revenue And Profit Of Call Centers Diagrams PDF
This slide highlights the revenue and profit of call center company through bar graph format which includes data from last 5 years from financial year 2018 to 2022.Deliver and pitch your topic in the best possible manner with this Knowledge Process Outsourcing Company Profile Revenue And Profit Of Call Centers Diagrams PDF. Use them to share invaluable insights on Revenue Increased, Profit Increased, Key Takeaways and impress your audience. This template can be altered and modified as per your expectations. So, grab it now.
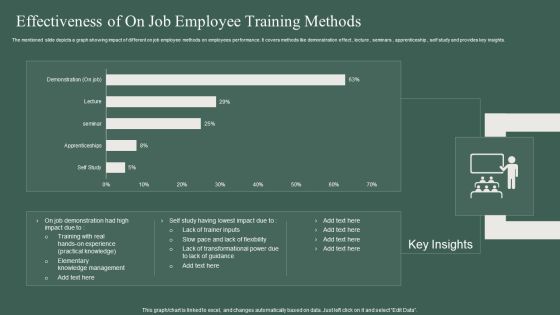
Effectiveness Of On Job Employee Training Methods Ppt PowerPoint Presentation Pictures Introduction PDF
The mentioned slide depicts a graph showing impact of different on job employee methods on employees performance. It covers methods like demonstration effect, lecture, seminars, apprenticeship, self study and provides key insights. Showcasing this set of slides titled Effectiveness Of On Job Employee Training Methods Ppt PowerPoint Presentation Pictures Introduction PDF. The topics addressed in these templates are Effectiveness, Employee Training Methods. All the content presented in this PPT design is completely editable. Download it and make adjustments in color, background, font etc. as per your unique business setting.

Security Officer Service Company Profile Revenue And Net Profit Ppt PowerPoint Presentation Gallery Graphic Images PDF
This slide highlights the revenue and net profit of security guard company through bar graph and tabular format. It covers three years data of revenue, and net profit. Deliver an awe inspiring pitch with this creative Security Officer Service Company Profile Revenue And Net Profit Ppt PowerPoint Presentation Gallery Graphic Images PDF bundle. Topics like Net Profit, Increase Revenue, 2018 To 2022 can be discussed with this completely editable template. It is available for immediate download depending on the needs and requirements of the user.

Client Helpline Dashboard At Valet Information Dsk Ppt Gallery Slide Portrait PDF
This graph or chart is linked to excel, and changes automatically based on data. Just left click on it and select Edit Data. Pitch your topic with ease and precision using this Client Helpline Dashboard At Valet Information Dsk Ppt Gallery Slide Portrait PDF. This layout presents information on Valet Damage Claims, Valet Wait Times, Information Desk. It is also available for immediate download and adjustment. So, changes can be made in the color, design, graphics or any other component to create a unique layout.

Client Helpline Dashboard With Retention Rate Ppt Gallery Ideas PDF
This graph or chart is linked to excel, and changes automatically based on data. Just left click on it and select Edit Data. Pitch your topic with ease and precision using this Client Helpline Dashboard With Retention Rate Ppt Gallery Ideas PDF. This layout presents information on Cost per Support 2022, Total Requests, Total Revenue 2022, Avg Requests Answered. It is also available for immediate download and adjustment. So, changes can be made in the color, design, graphics or any other component to create a unique layout.

Firm KPI Dashboard With Average Click Through Rate Ppt Inspiration Sample PDF
This graph or chart is linked to excel, and changes automatically based on data. Just left click on it and select Edit Data. Pitch your topic with ease and precision using this Firm KPI Dashboard With Average Click Through Rate Ppt Inspiration Sample PDF. This layout presents information on Total Clicks, Total Impressive, Average CTR, Average Position. It is also available for immediate download and adjustment. So, changes can be made in the color, design, graphics or any other component to create a unique layout.

Firm KPI Dashboard With Schedule Performance Index Ppt Visual Aids PDF
This graph or chart is linked to excel, and changes automatically based on data. Just left click on it and select Edit Data. Pitch your topic with ease and precision using this Firm KPI Dashboard With Schedule Performance Index Ppt Visual Aids PDF. This layout presents information on Project Cost Performance, Project Planning Stage, Monitor And Control. It is also available for immediate download and adjustment. So, changes can be made in the color, design, graphics or any other component to create a unique layout.

Firm Marketing Dashboard Report With Closed Sales Ppt Slides Graphics Example PDF
This graph or chart is linked to excel, and changes automatically based on data. Just left click on it and select Edit Data. Showcasing this set of slides titled Firm Marketing Dashboard Report With Closed Sales Ppt Slides Graphics Example PDF. The topics addressed in these templates are Days On Market, Homes For Sale, Median Sales Price, Closed Sales. All the content presented in this PPT design is completely editable. Download it and make adjustments in color, background, font etc. as per your unique business setting.

Portable Home Safety Systems Company Profile Revenue And Profit Of Security Company Ideas PDF
This slide highlights the revenue and profit of security company in bar graph format which includes data from last 5 years from financial year 2018 to 2022. Deliver and pitch your topic in the best possible manner with this Portable Home Safety Systems Company Profile Revenue And Profit Of Security Company Ideas PDF. Use them to share invaluable insights on Revenue Increased, 2018 To 2022, Profit Increased and impress your audience. This template can be altered and modified as per your expectations. So, grab it now.
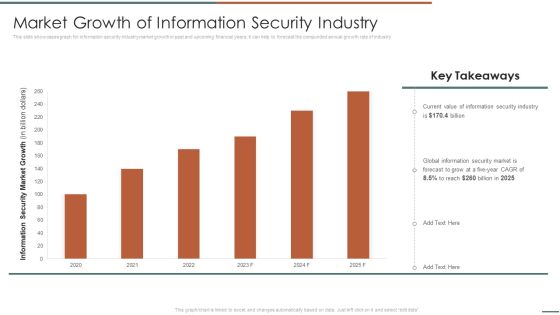
Information Security Risk Evaluation Market Growth Of Information Security Industry Infographics PDF
This slide showcases graph for information security industry market growth in past and upcoming financial years. It can help to forecast the compunded annual growth rate of industry .Deliver and pitch your topic in the best possible manner with this Information Security Risk Evaluation Market Growth Of Information Security Industry Infographics PDF. Use them to share invaluable insights on Information Security, Global Information, Security Market and impress your audience. This template can be altered and modified as per your expectations. So, grab it now.
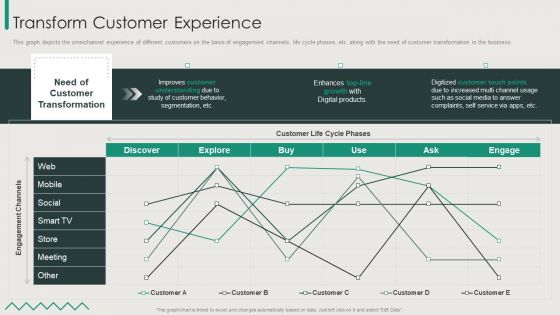
Organization Transition Transform Customer Experience Ppt PowerPoint Presentation File Pictures PDF
This graph depicts the omnichannel experience of different customers on the basis of engagement channels, life cycle phases, etc. along with the need of customer transformation in the business. Deliver and pitch your topic in the best possible manner with this Organization Transition Transform Customer Experience Ppt PowerPoint Presentation File Pictures PDF. Use them to share invaluable insights on Improves Customer, Customer Life, Digital Products and impress your audience. This template can be altered and modified as per your expectations. So, grab it now.
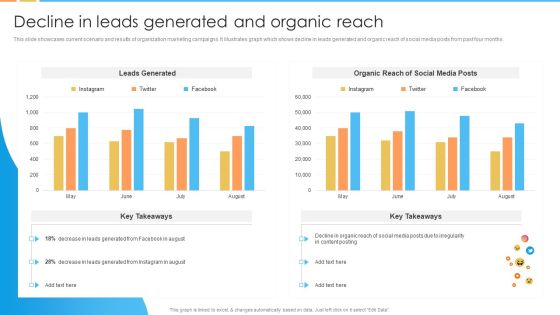
Digital Marketing Guide For B2B Firms Decline In Leads Generated And Organic Reach Pictures PDF
This slide showcases current scenario and results of organization marketing campaigns. It illustrates graph which shows decline in leads generated and organic reach of social media posts from past four months.Deliver and pitch your topic in the best possible manner with this Digital Marketing Guide For B2B Firms Decline In Leads Generated And Organic Reach Pictures PDF. Use them to share invaluable insights on Leads Generated, Organic Reach, Leads Generated and impress your audience. This template can be altered and modified as per your expectations. So, grab it now.

Conducting Monetary Inclusion With Mobile Subscribers Projection And Tele Density Growth Elements PDF
Mentioned slide shows informational stats about mobile subscribers and tele density growth for five years. The graph depicts that total mobile subscription for MFS will get increased by 84percent in 2026. Deliver and pitch your topic in the best possible manner with this Conducting Monetary Inclusion With Mobile Subscribers Projection And Tele Density Growth Elements PDF. Use them to share invaluable insights on Rural Teledensity, Urban Teledensity, Tele Density and impress your audience. This template can be altered and modified as per your expectations. So, grab it now.
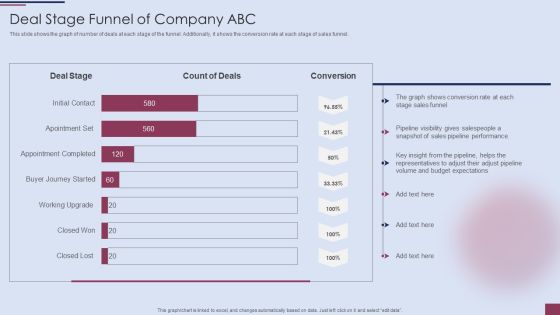
Sales Process Management To Boost Business Effectiveness Deal Stage Funnel Of Company ABC Mockup PDF
This slide shows the graph of number of deals at each stage of the funnel. Additionally, it shows the conversion rate at each stage of sales funnel.Deliver and pitch your topic in the best possible manner with this Sales Process Management To Boost Business Effectiveness Deal Stage Funnel Of Company ABC Mockup PDF. Use them to share invaluable insights on Shows Conversion, Sales Funnel, Pipeline Performance and impress your audience. This template can be altered and modified as per your expectations. So, grab it now.

Sales Process Management To Boost Business Effectiveness Decline In Total Sales Of Company ABC Template PDF
This slide shows graph of impact of sales pipeline challenges on overall sales of the company. Additionally, it provides the reasons behind the sales decline.Deliver and pitch your topic in the best possible manner with this Sales Process Management To Boost Business Effectiveness Decline In Total Sales Of Company ABC Template PDF. Use them to share invaluable insights on Pipeline Management, Opportunities In Pipeline, Decline In Pipeline and impress your audience. This template can be altered and modified as per your expectations. So, grab it now.

Stakeholder Evaluation Plan Dashboard With Acceptance Level Of New Reforms Background PDF
This slide illustrates statistical analysis of key stakeholders of the corporation. It includes pie chart of key stakeholders and bar graph of their level of acceptance of new reforms. Showcasing this set of slides titled Stakeholder Evaluation Plan Dashboard With Acceptance Level Of New Reforms Background PDF. The topics addressed in these templates are Level Acceptance, Key Stakeholders, Critical Stakeholder. All the content presented in this PPT design is completely editable. Download it and make adjustments in color, background, font etc. as per your unique business setting.

Real Estate Developers Funding Alternatives Global Real Estate Investment Volume In 2022 Brochure PDF
This slide portrays informational stats about global real estate investment volume for 2022. Here the graph shows that real estate investment volume will fall by 38 percentage. Deliver and pitch your topic in the best possible manner with this Real Estate Developers Funding Alternatives Global Real Estate Investment Volume In 2022 Brochure PDF. Use them to share invaluable insights on Real Estate Investment, Border Capital and impress your audience. This template can be altered and modified as per your expectations. So, grab it now.

Evaluating Hedge Funds For Greater ROI Best Hedge Fund Strategy For High Returns Brochure PDF
This slide showcases the graph which highlights the best hedge fund investment strategies with their performance on the basis of above target level, within range level and below target level set by investor. Deliver an awe inspiring pitch with this creative Evaluating Hedge Funds For Greater ROI Best Hedge Fund Strategy For High Returns Brochure PDF bundle. Topics like Multi Strategy, Range Return, Strategies, Targeted Return can be discussed with this completely editable template. It is available for immediate download depending on the needs and requirements of the user.

Evaluating Hedge Funds For Greater ROI Which Strategy Companies Prefer While Investing Clipart PDF
This slide showcases the graph of enterprise trading strategy in the hedge funds which includes long short equity, long short credit, relative value arbitrage, event driven and global macro. Deliver an awe inspiring pitch with this creative Evaluating Hedge Funds For Greater ROI Which Strategy Companies Prefer While Investing Clipart PDF bundle. Topics like Hedge Fund, Strategy Preference, Equity Driven, Multi Strategy can be discussed with this completely editable template. It is available for immediate download depending on the needs and requirements of the user.

Software Products And Solutions Firm Details EBITDA And Margin Structure PDF
This slide illustrates a graph of EBITDA in US dollar and margin in percentage for software company illustrating growth trend in last five years from 2018 to 2022. It also showcases net profit contribution by services and solutions. Deliver an awe inspiring pitch with this creative Software Products And Solutions Firm Details EBITDA And Margin Structure PDF bundle. Topics like EBITDA, Services EBITDA, Solutions EBITDA, 2018 To 2022 can be discussed with this completely editable template. It is available for immediate download depending on the needs and requirements of the user.
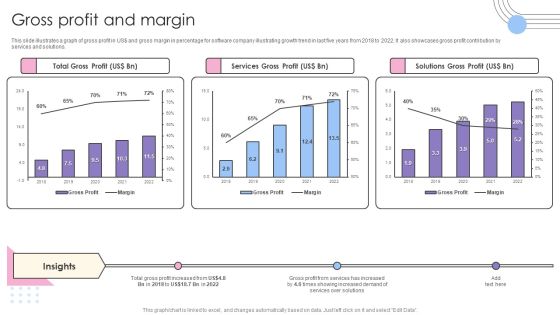
Software Products And Solutions Firm Details Gross Profit And Margin Pictures PDF
This slide illustrates a graph of gross profit in US dollar and gross margin in percentage for software company illustrating growth trend in last five years from 2018 to 2022. It also showcases gross profit contribution by services and solutions. Deliver and pitch your topic in the best possible manner with this Software Products And Solutions Firm Details Gross Profit And Margin Pictures PDF. Use them to share invaluable insights on Total Gross Profit, Services Gross Profit, Solutions Gross Profit and impress your audience. This template can be altered and modified as per your expectations. So, grab it now.

Software Products And Solutions Firm Details Net Profit And Margin Information PDF
This slide illustrates a graph of net profit in US dollar and net margin in percentage for software company illustrating growth trend in last five years from 2018 to 2022. It also showcases net profit contribution by services and solutions. Deliver and pitch your topic in the best possible manner with this Software Products And Solutions Firm Details Net Profit And Margin Information PDF. Use them to share invaluable insights on Net Profit, Services Net Profit, Solutions Net Profit and impress your audience. This template can be altered and modified as per your expectations. So, grab it now.

Software Products And Solutions Firm Details Operating Profit And Margin Mockup PDF
This slide illustrates a graph of operating profit in US dollar and operating margin in percentage for software company illustrating growth trend in last five years from 2018 to 2022. It also showcases operating profit contribution by services and solutions. Deliver an awe inspiring pitch with this creative Software Products And Solutions Firm Details Operating Profit And Margin Mockup PDF bundle. Topics like Operating Profit, Services Operating Profit, Solutions Operating Profit can be discussed with this completely editable template. It is available for immediate download depending on the needs and requirements of the user.
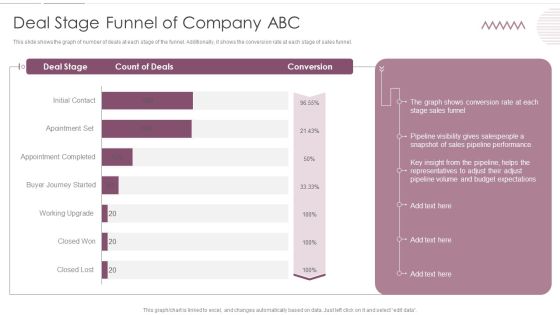
Sales Management Pipeline For Effective Lead Generation Deal Stage Funnel Of Company ABC Inspiration PDF
This slide shows the graph of number of deals at each stage of the funnel. Additionally, it shows the conversion rate at each stage of sales funnel. Deliver and pitch your topic in the best possible manner with this Sales Management Pipeline For Effective Lead Generation Deal Stage Funnel Of Company ABC Inspiration PDF. Use them to share invaluable insights on Pipeline Performance, Sales Funnel, Budget Expectations and impress your audience. This template can be altered and modified as per your expectations. So, grab it now.

Sales Management Pipeline For Effective Lead Generation Decline In Total Sales Of Company ABC Structure PDF
This slide shows graph of impact of sales pipeline challenges on overall sales of the company. Additionally, it provides the reasons behind the sales decline. Deliver and pitch your topic in the best possible manner with this Sales Management Pipeline For Effective Lead Generation Decline In Total Sales Of Company ABC Structure PDF. Use them to share invaluable insights on Sales Pipeline Management, Opportunities, Pipeline Conversion Rate and impress your audience. This template can be altered and modified as per your expectations. So, grab it now.
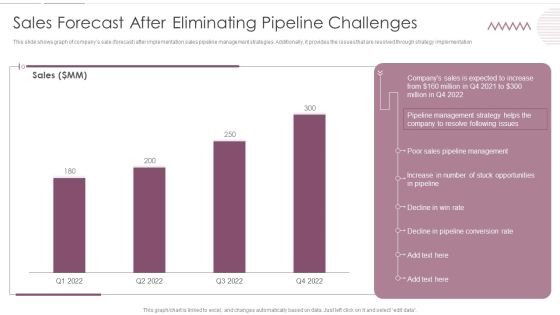
Sales Management Pipeline For Effective Lead Generation Sales Forecast After Eliminating Pipeline Challenges Inspiration PDF
This slide shows graph of companys sale forecast after implementation sales pipeline management strategies. Additionally, it provides the issues that are resolved through strategy implementation. Deliver and pitch your topic in the best possible manner with this Sales Management Pipeline For Effective Lead Generation Sales Forecast After Eliminating Pipeline Challenges Inspiration PDF. Use them to share invaluable insights on Sales Pipeline Management, Opportunities, Pipeline Conversion Rate and impress your audience. This template can be altered and modified as per your expectations. So, grab it now.

Service Level Agreement KPI Dashboard Indicating Violation Count And Overdue Requests Diagrams PDF
This graph or chart is linked to excel, and changes automatically based on data. Just left click on it and select Edit Data. Showcasing this set of slides titled Service Level Agreement KPI Dashboard Indicating Violation Count And Overdue Requests Diagrams PDF. The topics addressed in these templates are Total Requests Category, Total Requests Status, Urgent Requests. All the content presented in this PPT design is completely editable. Download it and make adjustments in color, background, font etc. as per your unique business setting.

Service Level Agreement KPI Dashboard With Current Risk Statistics Topics PDF
This graph or chart is linked to excel, and changes automatically based on data. Just left click on it and select Edit Data. Pitch your topic with ease and precision using this Service Level Agreement KPI Dashboard With Current Risk Statistics Topics PDF. This layout presents information on Current Risk SLAS, Current Breached Slas, Personal Active SLA It is also available for immediate download and adjustment. So, changes can be made in the color, design, graphics or any other component to create a unique layout.

BPO Call Center Company Profile Revenue And Profit Of Call Centers Template PDF
This slide highlights the revenue and profit of call center company through bar graph format which includes data from last 5 years from financial year 2018 to 2022.Deliver and pitch your topic in the best possible manner with this BPO Call Center Company Profile Revenue And Profit Of Call Centers Template PDF. Use them to share invaluable insights on Revenue Increased, Profit Increased, Profit Million and impress your audience. This template can be altered and modified as per your expectations. So, grab it now.
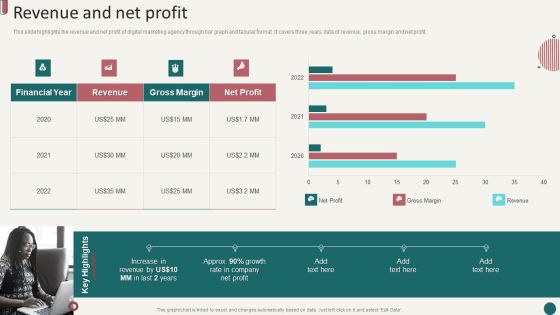
Social Media Marketing Company Profile Revenue And Net Profit Ppt Summary Gallery PDF
This slide highlights the revenue and net profit of digital marketing agency through bar graph and tabular format. It covers three years data of revenue, gross margin and net profit. Deliver and pitch your topic in the best possible manner with this Social Media Marketing Company Profile Revenue And Net Profit Ppt Summary Gallery PDF. Use them to share invaluable insights on Financial Year, Revenue, Gross Margin and impress your audience. This template can be altered and modified as per your expectations. So, grab it now.

Business Software Development Company Profile EBITDA And Margin Summary PDF
This slide illustrates a graph of EBITDA in US dollar and margin in percentage for software company illustrating growth trend in last five years from 2018 to 2022. It also showcases net profit contribution by services and solutions. Deliver an awe inspiring pitch with this creative Business Software Development Company Profile EBITDA And Margin Summary PDF bundle. Topics like EBITDA, Services EBITDA, Solutions EBITDA can be discussed with this completely editable template. It is available for immediate download depending on the needs and requirements of the user.

Return On Promotional Investments Dashboard For Marketing Campaign Pictures PDF
This slide covers dashboard showing ROI from several campaigns. It also includes revenue earned, total campaign cost, lead conversion rate, CTR, average CPC, average lead and deal acquisition cost with graph on ROI by Google ads campaign.Showcasing this set of slides titled Return On Promotional Investments Dashboard For Marketing Campaign Pictures PDF. The topics addressed in these templates are Campaign Cost, Lead Conversion, Acquisition Cost. All the content presented in this PPT design is completely editable. Download it and make adjustments in color, background, font etc. as per your unique business setting.

Business Software Development Company Profile Gross Profit And Margin Microsoft PDF
This slide illustrates a graph of gross profit in US dollar and gross margin in percentage for software company illustrating growth trend in last five years from 2018 to 2022. It also showcases gross profit contribution by services and solutions. Deliver and pitch your topic in the best possible manner with this Business Software Development Company Profile Gross Profit And Margin Microsoft PDF. Use them to share invaluable insights on Total Gross Profit, Services Gross Profit, Solutions Gross Profit and impress your audience. This template can be altered and modified as per your expectations. So, grab it now.

Business Software Development Company Profile Net Profit And Margin Mockup PDF
This slide illustrates a graph of net profit in US dollar and net margin in percentage for software company illustrating growth trend in last five years from 2018 to 2022. It also showcases net profit contribution by services and solutions. Deliver an awe inspiring pitch with this creative Business Software Development Company Profile Net Profit And Margin Mockup PDF bundle. Topics like Net Profit, Services Net Profit, Solutions Net Profit can be discussed with this completely editable template. It is available for immediate download depending on the needs and requirements of the user.

Business Software Development Company Profile Operating Profit And Margin Summary PDF
This slide illustrates a graph of operating profit in US dollar and operating margin in percentage for software company illustrating growth trend in last five years from 2018 to 2022. It also showcases operating profit contribution by services and solutions. Deliver and pitch your topic in the best possible manner with this Business Software Development Company Profile Operating Profit And Margin Summary PDF. Use them to share invaluable insights on Operating Profit, Services Operating Profit, Solutions Operating Profit and impress your audience. This template can be altered and modified as per your expectations. So, grab it now.

Project Metrics Dashboard Depicting Issue Description Rules PDF
This slide focuses on the project management dashboard which covers the name of the company, department, project manager, statuses with tally, priorities using pie graph describing not started, in progress and closed projects and describes the issues such as timing, milestones, etc. Showcasing this set of slides titled Project Metrics Dashboard Depicting Issue Description Rules PDF. The topics addressed in these templates are Project Metrics, Dashboard Depicting. All the content presented in this PPT design is completely editable. Download it and make adjustments in color, background, font etc. as per your unique business setting.
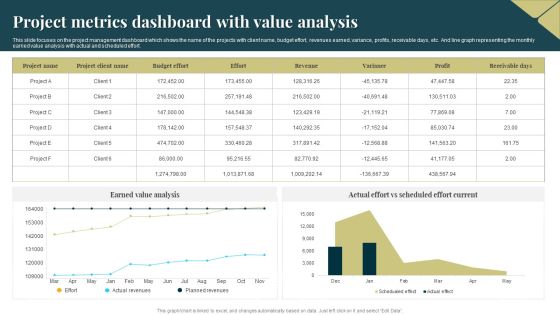
Project Metrics Dashboard With Value Analysis Introduction PDF
This slide focuses on the project management dashboard which shows the name of the projects with client name, budget effort, revenues earned, variance, profits, receivable days, etc. And line graph representing the monthly earned value analysis with actual and scheduled effort. Showcasing this set of slides titled Project Metrics Dashboard With Value Analysis Introduction PDF. The topics addressed in these templates are Budget Effort, Revenues, Earned Value Analysis. All the content presented in this PPT design is completely editable. Download it and make adjustments in color, background, font etc. as per your unique business setting.
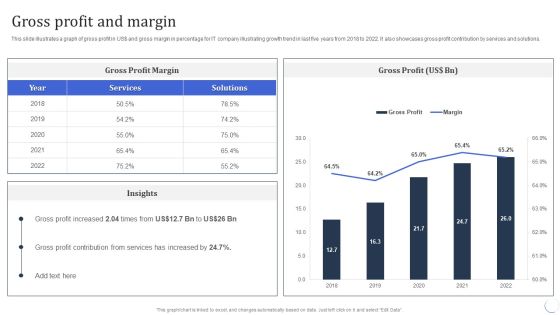
Infotech Solutions Research And Development Company Summary Gross Profit And Margin Ideas PDF
This slide illustrates a graph of gross profit in US dollar and gross margin in percentage for IT company illustrating growth trend in last five years from 2018 to 2022. It also showcases gross profit contribution by services and solutions. Deliver an awe inspiring pitch with this creative Infotech Solutions Research And Development Company Summary Gross Profit And Margin Ideas PDF bundle. Topics like Services, Gross Profit Margin can be discussed with this completely editable template. It is available for immediate download depending on the needs and requirements of the user.

Infotech Solutions Research And Development Company Summary Net Profit And Margin Information PDF
This slide illustrates a graph of net profit in US dollar and net margin in percentage for IT company illustrating growth trend in last five years from 2018 to 2022. It also showcases net profit contribution by services and solutions. Deliver and pitch your topic in the best possible manner with this Infotech Solutions Research And Development Company Summary Net Profit And Margin Information PDF. Use them to share invaluable insights on Profit Contribution, Services, Net Profit and impress your audience. This template can be altered and modified as per your expectations. So, grab it now.
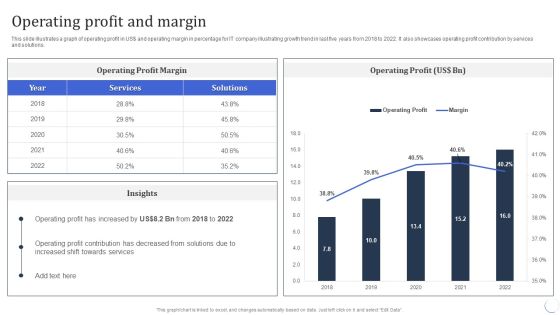
Infotech Solutions Research And Development Company Summary Operating Profit And Margin Download PDF
This slide illustrates a graph of operating profit in US dollar and operating margin in percentage for IT company illustrating growth trend in last five years from 2018 to 2022. It also showcases operating profit contribution by services and solutions. Deliver an awe inspiring pitch with this creative Infotech Solutions Research And Development Company Summary Operating Profit And Margin Download PDF bundle. Topics like Services, Operating Profit can be discussed with this completely editable template. It is available for immediate download depending on the needs and requirements of the user.

Average Transactional Value Per User In Fintech Market Download PDF
This slide portrays informational stats on average transactional value per user in FinTech market. Here the graph shows that digital payment segment will record a an average transaction of dollar 3,556 per user. Deliver and pitch your topic in the best possible manner with this Average Transactional Value Per User In Fintech Market Download PDF. Use them to share invaluable insights on Digital Payments Segments, Average Transaction Value, Finance and impress your audience. This template can be altered and modified as per your expectations. So, grab it now.
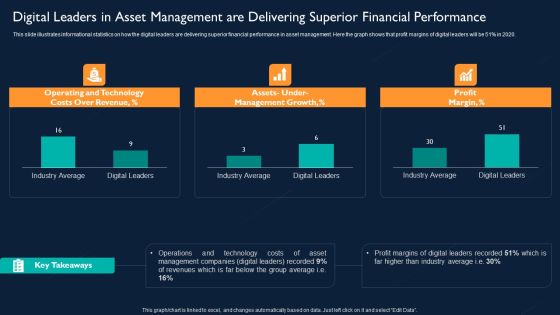
Digital Leaders In Asset Management Are Delivering Superior Financial Performance Designs PDF
This slide illustrates informational statistics on how the digital leaders are delivering superior financial performance in asset management. Here the graph shows that profit margins of digital leaders will be 51 percentage in 2020. Deliver and pitch your topic in the best possible manner with this Digital Leaders In Asset Management Are Delivering Superior Financial Performance Designs PDF. Use them to share invaluable insights on Operating And Technology Costs, Management Growth, Profit Margin and impress your audience. This template can be altered and modified as per your expectations. So, grab it now.
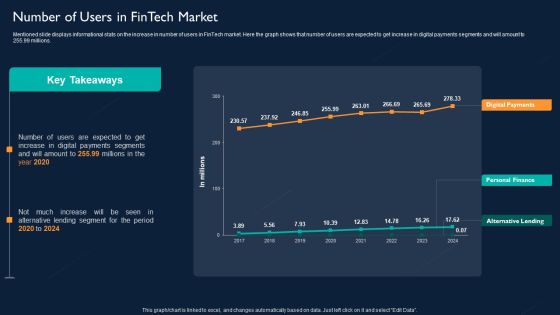
Technology Investment To Enhance Business Growth Number Of Users In Fintech Market Diagrams PDF
Mentioned slide displays informational stats on the increase in number of users in FinTech market. Here the graph shows that number of users are expected to get increase in digital payments segments and will amount to 255.99 millions. Deliver and pitch your topic in the best possible manner with this Technology Investment To Enhance Business Growth Number Of Users In Fintech Market Diagrams PDF. Use them to share invaluable insights on Alternative Lending, Personal Finance, Digital Payments and impress your audience. This template can be altered and modified as per your expectations. So, grab it now.
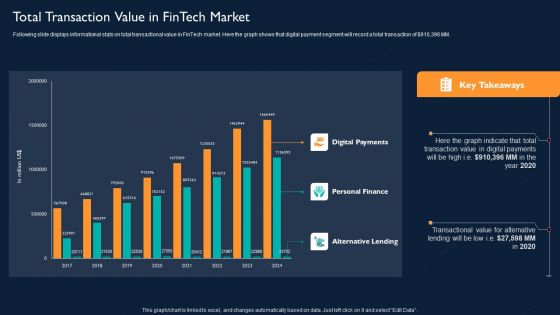
Technology Investment To Enhance Business Growth Total Transaction Value In Fintech Market Portrait PDF
Following slide displays informational stats on total transactional value in FinTech market. Here the graph shows that digital payment segment will record a total transaction of dollar 910,396 MM. Deliver an awe inspiring pitch with this creative Technology Investment To Enhance Business Growth Total Transaction Value In Fintech Market Portrait PDF bundle. Topics like Digital Payments, Transactional Value, Digital Payments, Personal Finance can be discussed with this completely editable template. It is available for immediate download depending on the needs and requirements of the user.
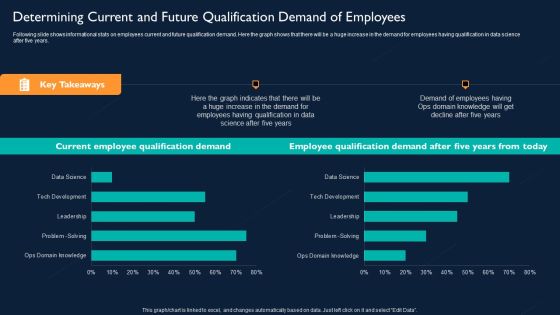
Determining Current And Future Qualification Demand Of Employees Graphics PDF
Following slide shows informational stats on employees current and future qualification demand. Here the graph shows that there will be a huge increase in the demand for employees having qualification in data science after five years. Deliver an awe inspiring pitch with this creative Determining Current And Future Qualification Demand Employees Graphics PDF bundle. Topics like Determining Current, Future Qualification Demand Of Employees can be discussed with this completely editable template. It is available for immediate download depending on the needs and requirements of the user.

Hedge Funds Trading And Investing Strategies Best Hedge Fund Strategy For High Returns Brochure PDF
This slide showcases the graph which highlights the best hedge fund investment strategies with their performance on the basis of above target level, within range level and below target level set by investor. Deliver an awe inspiring pitch with this creative Hedge Funds Trading And Investing Strategies Best Hedge Fund Strategy For High Returns Brochure PDF bundle. Topics like Strategies, Investor, Average can be discussed with this completely editable template. It is available for immediate download depending on the needs and requirements of the user.

Emerging Software Development Trends Analysis Statistical Diagrams PDF
This slide shows the statistical graph representing the data related to emerging trends in the software development. It shows the change in usage of AI native apps, mix hybrid and native and AI hybrid for different years. Deliver and pitch your topic in the best possible manner with this Emerging Software Development Trends Analysis Statistical Diagrams PDF. Use them to share invaluable insights on Emerging Software Development, Trends Analysis Statistical and impress your audience. This template can be altered and modified as per your expectations. So, grab it now.
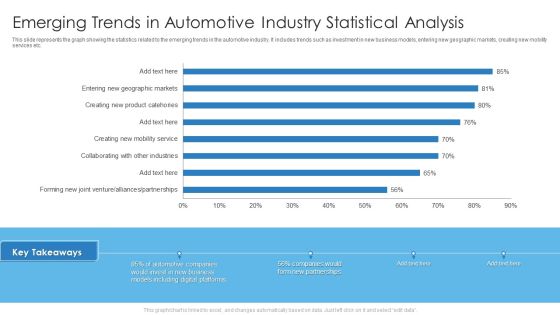
Emerging Trends In Automotive Industry Statistical Analysis Mockup PDF
This slide represents the graph showing the statistics related to the emerging trends in the automotive industry. It includes trends such as investment in new business models, entering new geographic markets, creating new mobility services etc. Deliver an awe inspiring pitch with this creative Emerging Trends In Automotive Industry Statistical Analysis Mockup PDF bundle. Topics like Emerging Trends In Automotive, Industry Statistical Analysis can be discussed with this completely editable template. It is available for immediate download depending on the needs and requirements of the user.

Latest Digital Marketing Trend Analysis Statistical Template PDF
This slide represents the graph showing the latest trends in the field of digital marketing. It includes trends such as content marketing, AI and machine learning, marketing automation, big data, CRO and improving website experiences, social media marketing etc. Deliver an awe inspiring pitch with this creative Latest Digital Marketing Trend Analysis Statistical Template PDF bundle. Topics like Business Growth, Content Marketing, Technique can be discussed with this completely editable template. It is available for immediate download depending on the needs and requirements of the user.
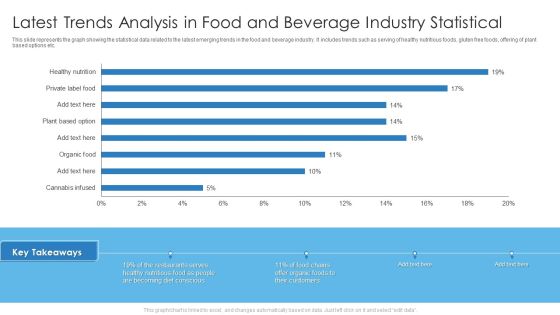
Latest Trends Analysis In Food And Beverage Industry Statistical Graphics PDF
This slide represents the graph showing the statistical data related to the latest emerging trends in the food and beverage industry. It includes trends such as serving of healthy nutritious foods, gluten free foods, offering of plant based options etc. Deliver and pitch your topic in the best possible manner with this Latest Trends Analysis In Food And Beverage Industry Statistical Graphics PDF. Use them to share invaluable insights on Latest Trends Analysis, Food And Beverage, Industry Statistical and impress your audience. This template can be altered and modified as per your expectations. So, grab it now.

Social Media Influencer Marketing Trend Analysis Statistical Themes PDF
This slide shows the graph representing the statistical data related to the emerging trends in the field of social media influencer marketing. It shows the upcoming trends in influencer marketing in the near future. Deliver an awe inspiring pitch with this creative Social Media Influencer Marketing Trend Analysis Statistical Themes PDF bundle. Topics like Social Media Influencer, Marketing Trend Analysis Statistical can be discussed with this completely editable template. It is available for immediate download depending on the needs and requirements of the user.

B2B Content Marketing Latest Trend Analysis Statistical Icons PDF
This slide shows the graph representing the statistical data related to latest trends emerging in the field of content marketing. It includes trends such as blog posts, email newsletters, case studies, videos, virtual events, infographics etc. Deliver an awe inspiring pitch with this creative B2B Content Marketing Latest Trend Analysis Statistical Icons PDF bundle. Topics like B2b Content Marketing, Latest Trend Analysis Statistical can be discussed with this completely editable template. It is available for immediate download depending on the needs and requirements of the user.

Pureprofile Business Overview EBITDA And Margin Ppt Gallery Sample PDF
This slide illustrates a graph of EBITDA in AUD and margin in percentage for Pureprofile company showing growth trend in last six years from 2016 to 2021. It also showcases key insights for EBITDA. Deliver and pitch your topic in the best possible manner with this Pureprofile Business Overview EBITDA And Margin Ppt Gallery Sample PDF. Use them to share invaluable insights on EBITDA Decreased, Business Operations, 2016 To 2021 and impress your audience. This template can be altered and modified as per your expectations. So, grab it now.
Sell Side Merger And Acquisition Major Successful Deals Count Split By Sectors Icons PDF
The slide shows the graph of current deals bifurcation by sectors automobile, construction, financials services etc. under different services merger and acquisition, underwriting, asset management, sales and trading, advisory etc. Deliver an awe inspiring pitch with this creative Sell Side Merger And Acquisition Major Successful Deals Count Split By Sectors Icons PDF bundle. Topics like Current Deals, Count Sectors, Automobile, Construction can be discussed with this completely editable template. It is available for immediate download depending on the needs and requirements of the user.
Sell Side Merger And Acquisition Sales Deals Count Split By Sectors Icons PDF
The slide provides the graph of number of sales deals by sector which the company has handled in last five years. It also covers key facts CAGR growth, deal value etc. related to sales deals of the company. Deliver and pitch your topic in the best possible manner with this Sell Side Merger And Acquisition Sales Deals Count Split By Sectors Icons PDF. Use them to share invaluable insights on Number Sales Deals, Financials Services Sector, 2017 To 2021 and impress your audience. This template can be altered and modified as per your expectations. So, grab it now.

Optimizing Ecommerce Marketing Plan To Improve Sales Increase In Potential Leads Of Company Background PDF
This slide shows the bar graph that represents the potential leads of the company in six consecutive years which depicts the increase in percentage of online leads. Deliver an awe inspiring pitch with this creative Optimizing Ecommerce Marketing Plan To Improve Sales Increase In Potential Leads Of Company Background PDF bundle. Topics like E Commerce Marketing Plan, Potential Leads Of Company can be discussed with this completely editable template. It is available for immediate download depending on the needs and requirements of the user.
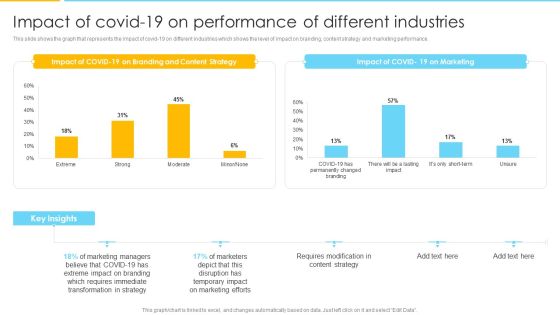
Optimizing Ecommerce Marketing Plan To Improve Sales Impact Of Covid 19 On Performance Of Different Industries Formats PDF
This slide shows the graph that represents the impact of covid 19 on different industries which shows the level of impact on branding, content strategy and marketing performance. Deliver an awe inspiring pitch with this creative Optimizing Ecommerce Marketing Plan To Improve Sales Impact Of Covid 19 On Performance Of Different Industries Formats PDF bundle. Topics like Transformation In Strategy, Marketing Managers, Content Strategy can be discussed with this completely editable template. It is available for immediate download depending on the needs and requirements of the user.

Hedge Fund Risk Management Best Hedge Fund Strategy For High Returns Inspiration PDF
This slide showcases the graph which highlights the best hedge fund investment strategies with their performance on the basis of above target level, within range level and below target level set by investor. Deliver an awe inspiring pitch with this creative Hedge Fund Risk Management Best Hedge Fund Strategy For High Returns Inspiration PDF bundle. Topics like Equity Provides, Multi Strategy, Average can be discussed with this completely editable template. It is available for immediate download depending on the needs and requirements of the user.

IT Application Services Company Outline Gross Profit And Margin Elements PDF
This slide illustrates a graph of gross profit in US dollar and gross margin in percentage for IT company illustrating growth trend in last five years from 2018 to 2022. It also showcases gross profit contribution by services and solutions. Deliver an awe inspiring pitch with this creative IT Application Services Company Outline Gross Profit And Margin Elements PDF bundle. Topics like Gross Profit Margin, Services can be discussed with this completely editable template. It is available for immediate download depending on the needs and requirements of the user.

IT Application Services Company Outline Net Profit And Margin Structure PDF
This slide illustrates a graph of net profit in US dollar and net margin in percentage for IT company illustrating growth trend in last five years from 2018 to 2022. It also showcases net profit contribution by services and solutions. Deliver and pitch your topic in the best possible manner with this IT Application Services Company Outline Net Profit And Margin Structure PDF. Use them to share invaluable insights on Net Profit Margin, Services, Margin and impress your audience. This template can be altered and modified as per your expectations. So, grab it now.
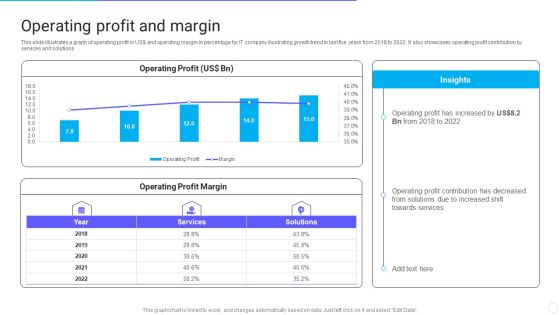
IT Application Services Company Outline Operating Profit And Margin Structure PDF
This slide illustrates a graph of operating profit in US dollar and operating margin in percentage for IT company illustrating growth trend in last five years from 2018 to 2022. It also showcases operating profit contribution by services and solutions. Deliver an awe inspiring pitch with this creative IT Application Services Company Outline Operating Profit And Margin Structure PDF bundle. Topics like Operating Profit And Margin can be discussed with this completely editable template. It is available for immediate download depending on the needs and requirements of the user.

Merger And Acquisition Buying Strategy For Business Growth Mergers And Acquisitions By Sector Designs PDF
The slide illustrates the graph of number of merger and acquisition deals by sector that the company has completed in last five years. It also covers key facts CAGR growth, deal value etc. related to merger and acquisition deals of the company. Deliver an awe inspiring pitch with this creative Merger And Acquisition Buying Strategy For Business Growth Mergers And Acquisitions By Sector Designs PDF bundle. Topics like Acquisition Value, Financials Services Sector can be discussed with this completely editable template. It is available for immediate download depending on the needs and requirements of the user.
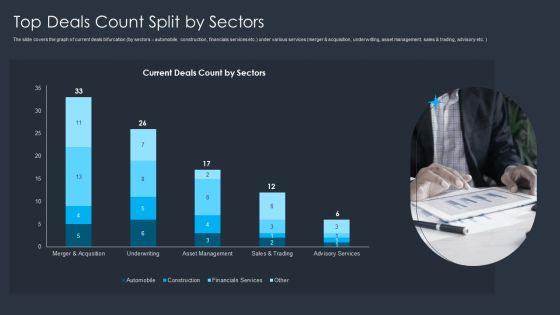
Merger And Acquisition Buying Strategy For Business Growth Top Deals Count Split By Sectors Clipart PDF
The slide covers the graph of current deals bifurcation by sectors automobile, construction, financials services etc. under various services merger and acquisition, underwriting, asset management, sales and trading, advisory etc. Deliver an awe inspiring pitch with this creative Merger And Acquisition Buying Strategy For Business Growth Top Deals Count Split By Sectors Clipart PDF bundle. Topics like Sales, Financials Service, Construction can be discussed with this completely editable template. It is available for immediate download depending on the needs and requirements of the user.

Domestic Budget Plan Expenses Category Analysis Ppt PowerPoint Presentation Layouts Inspiration PDF
The slide shows a bar graph showing minimum and maximum percentage of spending in domestic financial management. It includes categories like food and non alcoholic, clothing and footwear, housing, water, electricity, domestic furnishing, health, transport, education, etc.Showcasing this set of slides titled Domestic Budget Plan Expenses Category Analysis Ppt PowerPoint Presentation Layouts Inspiration PDF. The topics addressed in these templates are Part Earnings, Electricity Consumptions, Least Spending. All the content presented in this PPT design is completely editable. Download it and make adjustments in color, background, font etc. as per your unique business setting.

Monthly Domestic Family Budget Plan Analysis Ppt PowerPoint Presentation Portfolio Guide PDF
The slide shows a bar graph analyzing monthly family budget for effective financial planning . It shows projected and actual cash flow, total income and total expenses.Showcasing this set of slides titled Monthly Domestic Family Budget Plan Analysis Ppt PowerPoint Presentation Portfolio Guide PDF. The topics addressed in these templates are Total Income, Total Expenses, Cash Flow. All the content presented in this PPT design is completely editable. Download it and make adjustments in color, background, font etc. as per your unique business setting.

Company Financial Performance Indicators Dashboard With Liquidity And Turnover Ratios Formats PDF
This graph or chart is linked to excel, and changes automatically based on data. Just left click on it and select Edit Data. Pitch your topic with ease and precision using this Company Financial Performance Indicators Dashboard With Liquidity And Turnover Ratios Formats PDF. This layout presents information on Cash Balance, Days Inventory Outstanding, Days Payable Outstanding. It is also available for immediate download and adjustment. So, changes can be made in the color, design, graphics or any other component to create a unique layout.

Power Plant Energy Production Dashboard For Consumption Statistics Download PDF
This graph or chart is linked to excel, and changes automatically based on data. Just left click on it and select edit data. Pitch your topic with ease and precision using this Multiple Country Energy Consumption Statistics Comparison Dashboard Formats PDF. This layout presents information on August Year 2022, Return on Investments, Power Plan Detail . It is also available for immediate download and adjustment. So, changes can be made in the color, design, graphics or any other component to create a unique layout.
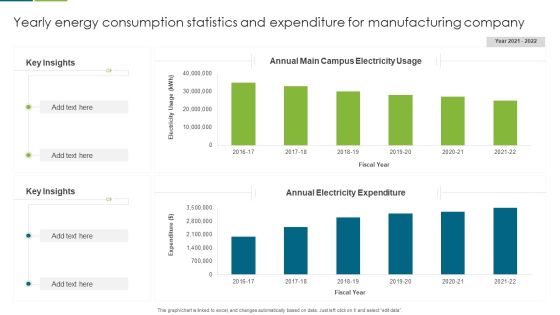
Yearly Energy Consumption Statistics And Expenditure For Manufacturing Company Guidelines PDF
This graph or chart is linked to excel, and changes automatically based on data. Just left click on it and select edit data. Pitch your topic with ease and precision using this Yearly Energy Consumption Statistics And Expenditure For Manufacturing Company Guidelines PDF. This layout presents information on Key Insights, Annual Electricity Expenditure, Annual Main Campus, Electricity Usage. It is also available for immediate download and adjustment. So, changes can be made in the color, design, graphics or any other component to create a unique layout.

Best Hedge Fund Strategy For High Returns Hedge Fund Performance Topics PDF
This slide showcases the graph which highlights the best hedge fund investment strategies with their performance on the basis of above target level, within range level and below target level set by investor. Deliver an awe inspiring pitch with this creative Best Hedge Fund Strategy For High Returns Hedge Fund Performance Topics PDF bundle. Topics like Best Hedge, Fund Strategy, Return Targeted, Different Strategies can be discussed with this completely editable template. It is available for immediate download depending on the needs and requirements of the user.
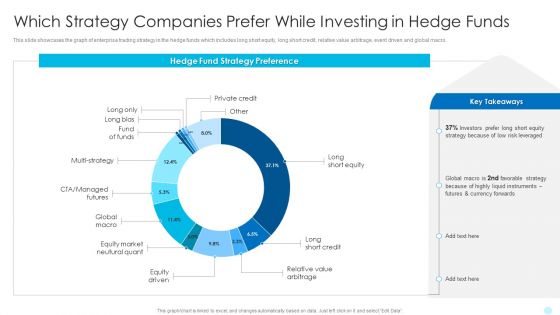
Which Strategy Companies Prefer While Investing In Hedge Funds Hedge Fund Performance Information PDF
This slide showcases the graph of enterprise trading strategy in the hedge funds which includes long short equity, long short credit, relative value arbitrage, event driven and global macro. Deliver an awe inspiring pitch with this creative Which Strategy Companies Prefer While Investing In Hedge Funds Hedge Fund Performance Information PDF bundle. Topics like Hedge Fund Strategy Preference, Relative Value Arbitrage, Private Credit can be discussed with this completely editable template. It is available for immediate download depending on the needs and requirements of the user.
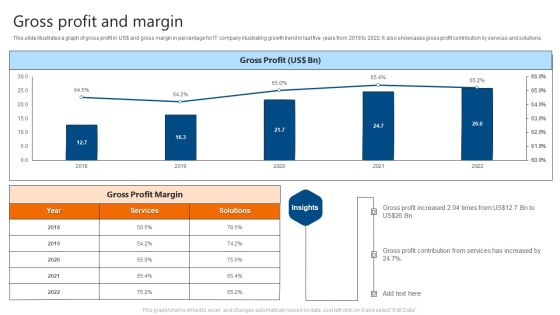
Gross Profit And Margin IT Software Development Company Profile Slides PDF
This slide illustrates a graph of gross profit in US doller and gross margin in percentage for IT company illustrating growth trend in last five years from 2018 to 2022. It also showcases gross profit contribution by services and solutions. Deliver and pitch your topic in the best possible manner with this Gross Profit And Margin IT Software Development Company Profile Slides PDF. Use them to share invaluable insights on Gross Profit, Margin and impress your audience. This template can be altered and modified as per your expectations. So, grab it now.
Net Profit And Margin IT Software Development Company Profile Icons PDF
This slide illustrates a graph of net profit in US doller and net margin in percentage for IT company illustrating growth trend in last five years from 2018 to 2022. It also showcases net profit contribution by services and solutions. Deliver an awe inspiring pitch with this creative Net Profit And Margin IT Software Development Company Profile Icons PDF bundle. Topics like Net Profit, Net Profit Margin can be discussed with this completely editable template. It is available for immediate download depending on the needs and requirements of the user.

Operating Profit And Margin IT Software Development Company Profile Guidelines PDF
This slide illustrates a graph of operating profit in US doller and operating margin in percentage for IT company illustrating growth trend in last five years from 2018 to 2022. It also showcases operating profit contribution by services and solutions. Deliver and pitch your topic in the best possible manner with this Operating Profit And Margin IT Software Development Company Profile Guidelines PDF. Use them to share invaluable insights on Operating Profit, Operating Profit Margin and impress your audience. This template can be altered and modified as per your expectations. So, grab it now.
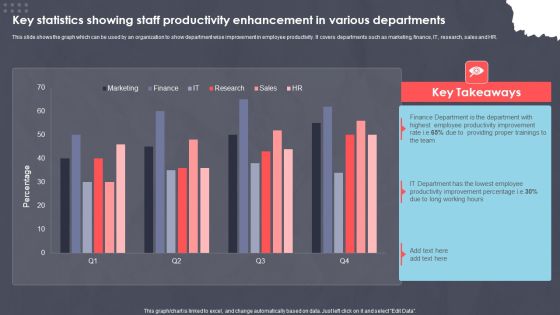
Key Statistics Showing Staff Productivity Enhancement In Various Departments Ppt PowerPoint Presentation Slides Portrait PDF
This slide shows the graph which can be used by an organization to show department wise improvement in employee productivity. It covers departments such as marketing, finance, IT, research, sales and HR. Pitch your topic with ease and precision using this Key Statistics Showing Staff Productivity Enhancement In Various Departments Ppt PowerPoint Presentation Slides Portrait PDF. This layout presents information on XXXXXXXXXXXXXXXXXXXXXXXXX. It is also available for immediate download and adjustment. So, changes can be made in the color, design, graphics or any other component to create a unique layout.
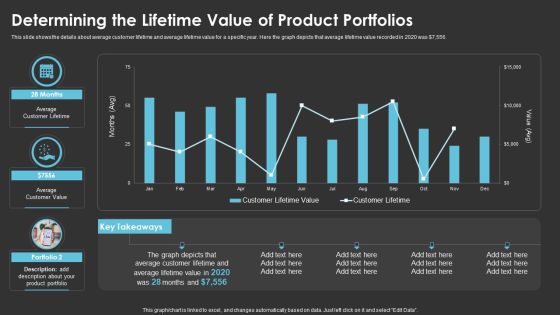
Method To Introduce New Product Offerings In The Industry Determining The Lifetime Value Of Product Portfolios Information PDF
This slide shows the details about average customer lifetime and average lifetime value for a specific year. Here the graph depicts that average lifetime value recorded in 2020 was dollar 7,556. Deliver an awe inspiring pitch with this creative Method To Introduce New Product Offerings In The Industry Determining The Lifetime Value Of Product Portfolios Information PDF bundle. Topics like Average Customer Lifetime, Product Portfolio can be discussed with this completely editable template. It is available for immediate download depending on the needs and requirements of the user.

Buy Side Merger And Acquisition Pitch Book Mergers And Acquisitions By Sector Summary PDF
The slide illustrates the graph of number of merger and acquisition deals by sector that the company has completed in last five years. It also covers key facts CAGR growth, deal value etc. related to merger and acquisition deals of the company. Deliver an awe inspiring pitch with this creative Buy Side Merger And Acquisition Pitch Book Mergers And Acquisitions By Sector Summary PDF bundle. Topics like Financials Services, Acquisition Value can be discussed with this completely editable template. It is available for immediate download depending on the needs and requirements of the user.

Buy Side Merger And Acquisition Pitch Book Top Deals Count Split By Sectors Guidelines PDF
The slide covers the graph of current deals bifurcation by sectors automobile, construction, financials services etc. under various services merger and acquisition, underwriting, asset management, sales and trading, advisory etc. Deliver an awe inspiring pitch with this creative Buy Side Merger And Acquisition Pitch Book Top Deals Count Split By Sectors Guidelines PDF bundle. Topics like Asset Management, Advisory Services, Sales can be discussed with this completely editable template. It is available for immediate download depending on the needs and requirements of the user.

IT Security Automation Tools Integration Time To Fix Security Threat With Manual Testing Template PDF
This slide highlights the time to fix the security threat and error with manual testing in bar graph format. It covers key takeaways which explains how much percent of error are fixed in 1 to 3 hour, 3 to 6 hour and working day etc. Deliver and pitch your topic in the best possible manner with this IT Security Automation Tools Integration Time To Fix Security Threat With Manual Testing Template PDF. Use them to share invaluable insights on Manual Testing, Fix Error, 3 Working Days and impress your audience. This template can be altered and modified as per your expectations. So, grab it now.

Change In Trends Of Employee Hiring And Selection Process Pre And Post Pandemic Ppt PowerPoint Presentation Images PDF
This slide shows a bar graph analyzing the change in recruitment scenario post Covid19. Comparison is made on the basis of role of artificial intelligence, virtual interview and onboarding, remote jobs and internal hiring. Showcasing this set of slides titled Change In Trends Of Employee Hiring And Selection Process Pre And Post Pandemic Ppt PowerPoint Presentation Images PDF. The topics addressed in these templates are Geographical Diversification, Internal Mobility, Virtual Onboarding. All the content presented in this PPT design is completely editable. Download it and make adjustments in color, background, font etc. as per your unique business setting.

Employee Skill Assessment After Leadership And Development Program Themes PDF
The slide shows a bar graph showing skill assessment pre and post attending leadership and management training workshop. It includes assessment of skills like program management, team building, employee management, communication skills and problem solving ability. Showcasing this set of slides titled Employee Skill Assessment After Leadership And Development Program Themes PDF. The topics addressed in these templates are Team, Employee Management. All the content presented in this PPT design is completely editable. Download it and make adjustments in color, background, font etc. as per your unique business setting.
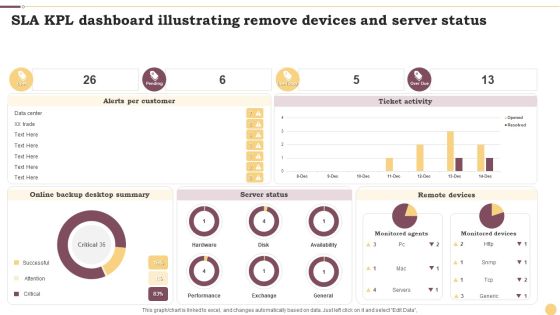
SLA KPL Dashboard Illustrating Remove Devices And Server Status Ppt Inspiration Layout Ideas PDF
This graph or chart is linked to excel, and changes automatically based on data. Just left click on it and select Edit Data. Showcasing this set of slides titled SLA KPL Dashboard Illustrating Remove Devices And Server Status Ppt Inspiration Layout Ideas PDF. The topics addressed in these templates are Alerts Per Customer, Ticket Activity, Server Status. All the content presented in this PPT design is completely editable. Download it and make adjustments in color, background, font etc. as per your unique business setting.

SLA KPL Dashboard Illustrating Risk And Active Services Ppt Portfolio Design Inspiration PDF
This graph or chart is linked to excel, and changes automatically based on data. Just left click on it and select Edit Data. Pitch your topic with ease and precision using this SLA KPL Dashboard Illustrating Risk And Active Services Ppt Portfolio Design Inspiration PDF. This layout presents information on My Active SLAs, Database Group, Priority. It is also available for immediate download and adjustment. So, changes can be made in the color, design, graphics or any other component to create a unique layout.
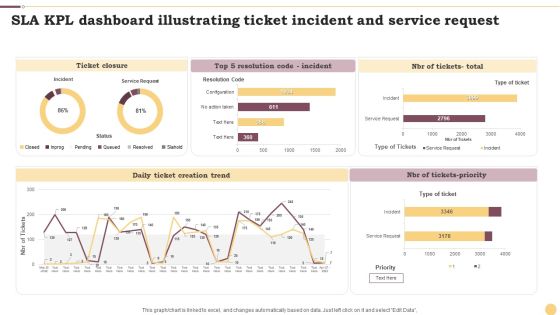
SLA KPL Dashboard Illustrating Ticket Incident And Service Request Ppt File Portrait PDF
This graph or chart is linked to excel, and changes automatically based on data. Just left click on it and select Edit Data. Showcasing this set of slides titled SLA KPL Dashboard Illustrating Ticket Incident And Service Request Ppt File Portrait PDF. The topics addressed in these templates are Ticket Closure, Daily Ticket, Creation Trend, NBR Tickets Priority. All the content presented in this PPT design is completely editable. Download it and make adjustments in color, background, font etc. as per your unique business setting.
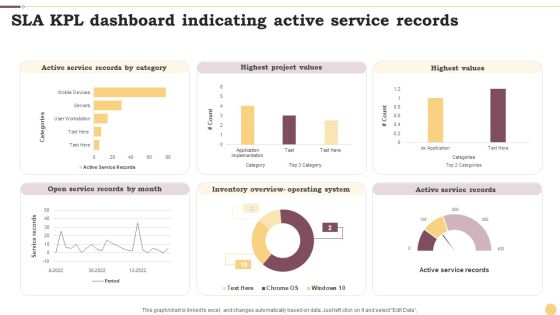
SLA KPL Dashboard Indicating Active Service Records Ppt Professional Graphics Example PDF
This graph or chart is linked to excel, and changes automatically based on data. Just left click on it and select Edit Data. Pitch your topic with ease and precision using this SLA KPL Dashboard Indicating Active Service Records Ppt Professional Graphics Example PDF. This layout presents information on Active Service Records, Highest Project Values, Highest Values. It is also available for immediate download and adjustment. So, changes can be made in the color, design, graphics or any other component to create a unique layout.

Kanban Structure To Track Proposed Active And Completed Activities Ppt Outline Slide Portrait PDF
This graph or chart is linked to excel, and changes automatically based on data. Just left click on it and select Edit Data. Pitch your topic with ease and precision using this Kanban Structure To Track Proposed Active And Completed Activities Ppt Outline Slide Portrait PDF. This layout presents information on Project Lead Time, Cycle Time, Completed. It is also available for immediate download and adjustment. So, changes can be made in the color, design, graphics or any other component to create a unique layout.

Kanban Structure With Task Count And Cycle Time Ppt Layouts Background Designs PDF
This graph or chart is linked to excel, and changes automatically based on data. Just left click on it and select Edit Data. Pitch your topic with ease and precision using this Kanban Structure With Task Count And Cycle Time Ppt Layouts Background Designs PDF. This layout presents information on Required Project Design, Project Design Approval, Construct. It is also available for immediate download and adjustment. So, changes can be made in the color, design, graphics or any other component to create a unique layout.

Comparison Of Beauty Care Products Sales With Competitor Companies Ppt Slides Samples PDF
This slide shows graph which can be used by organizations to represent the sales performance of company in comparison to other competitors. It includes quarterly sales data Showcasing this set of slides titled Comparison Of Beauty Care Products Sales With Competitor Companies Ppt Slides Samples PDF. The topics addressed in these templates are Our Product, Poor Sales Strategy, Product Improvement. All the content presented in this PPT design is completely editable. Download it and make adjustments in color, background, font etc. as per your unique business setting.

Statistics Showing Annual Comparison Of Multiple Beauty Care Products Ppt Infographics Objects PDF
This slide contains graph which can be used by cosmetic manufacturing organizations to represent difference between annual sales of various products. It includes products such as skin care, hair care, oral care and others. Showcasing this set of slides titled Statistics Showing Annual Comparison Of Multiple Beauty Care Products Ppt Infographics Objects PDF. The topics addressed in these templates are Skin Care, Hair Care, 2022 To 2023. All the content presented in this PPT design is completely editable. Download it and make adjustments in color, background, font etc. as per your unique business setting.
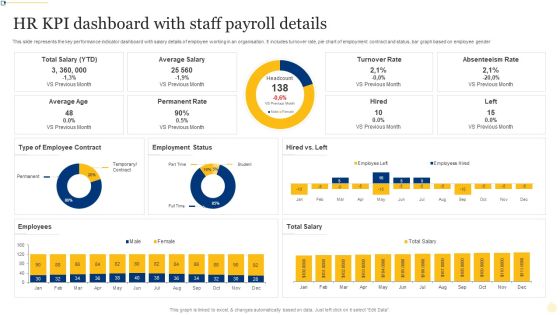
HR KPI Dashboard With Staff Payroll Details Ppt PowerPoint Presentation File Layout Ideas PDF
This slide represents the key performance indicator dashboard with salary details of employee working in an organisation. It includes turnover rate, pie chart of employment contract and status, bar graph based on employee gender. Showcasing this set of slides titled HR KPI Dashboard With Staff Payroll Details Ppt PowerPoint Presentation File Layout Ideas PDF. The topics addressed in these templates are Turnover Rate, Absenteeism Rate, Permanent Rate. All the content presented in this PPT design is completely editable. Download it and make adjustments in color, background, font etc. as per your unique business setting.
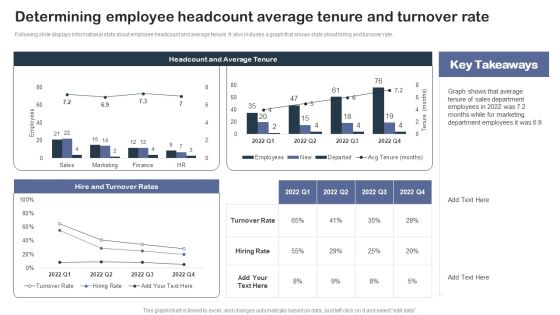
Staff Succession Planning And Development Determining Employee Headcount Average Elements PDF
Following slide displays informational stats about employee headcount and average tenure. It also includes a graph that shows stats about hiring and turnover rate.Get a simple yet stunning designed Staff Succession Planning And Development Determining Employee Headcount Average Elements PDF. It is the best one to establish the tone in your meetings. It is an excellent way to make your presentations highly effective. So, download this PPT today from Slidegeeks and see the positive impacts. Our easy-to-edit Staff Succession Planning And Development Determining Employee Headcount Average Elements PDF can be your go-to option for all upcoming conferences and meetings. So, what are you waiting for Grab this template today.

Human Capital Metrics With Employee Turnover Rate Ppt File Mockup PDF
This graph or chart is linked to excel, and changes automatically based on data. Just left click on it and select Edit Data. Showcasing this set of slides titled Human Capital Metrics With Employee Turnover Rate Ppt File Mockup PDF. The topics addressed in these templates are Employee Turnover Rate, Turnover Rate Division, Turnover Rate Year, Over Year. All the content presented in this PPT design is completely editable. Download it and make adjustments in color, background, font etc. as per your unique business setting.
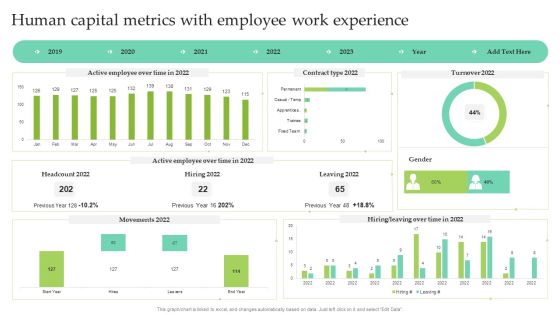
Human Capital Metrics With Employee Work Experience Ppt Show Images PDF
This graph or chart is linked to excel, and changes automatically based on data. Just left click on it and select Edit Data. Pitch your topic with ease and precision using this Human Capital Metrics With Employee Work Experience Ppt Show Images PDF. This layout presents information on Active Employee, Over Time, Contract Type 2022, Leaving 2022. It is also available for immediate download and adjustment. So, changes can be made in the color, design, graphics or any other component to create a unique layout.
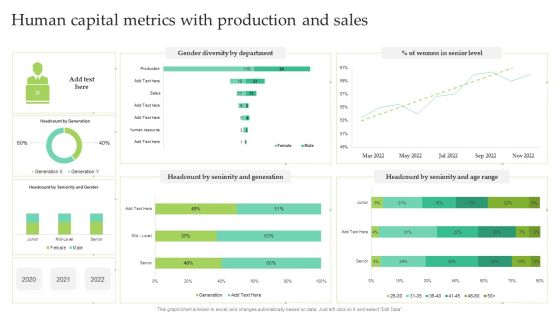
Human Capital Metrics With Production And Sales Ppt Infographic Template Summary PDF
This graph or chart is linked to excel, and changes automatically based on data. Just left click on it and select Edit Data. Showcasing this set of slides titled Human Capital Metrics With Production And Sales Ppt Infographic Template Summary PDF. The topics addressed in these templates are Women Senior Level, Gender Diversity Department, Seniority And Generation. All the content presented in this PPT design is completely editable. Download it and make adjustments in color, background, font etc. as per your unique business setting.

Buy Side Advisory Services In M And A Management Vs Consensus Revenue Forecast Ideas PDF
The graph depicts a revenue comparison between management and consensus. It shows historical 2015 to 2020 and projected revenue 2021 to 2024.Want to ace your presentation in front of a live audience Our Buy Side Advisory Services In M And A Management Vs Consensus Revenue Forecast Ideas PDF can help you do that by engaging all the users towards you. Slidegeeks experts have put their efforts and expertise into creating these impeccable powerpoint presentations so that you can communicate your ideas clearly. Moreover, all the templates are customizable, and easy-to-edit and downloadable. Use these for both personal and commercial use.

Buy Side Advisory Services In M And A Mergers And Acquisitions By Sector Introduction PDF
The slide illustrates the graph of number of merger and acquisition deals by sector that the company has completed in last five years. It also covers key facts CAGR growth, deal value etc. related to merger and acquisition deals of the company.There are so many reasons you need a Buy Side Advisory Services In M And A Mergers And Acquisitions By Sector Introduction PDF. The first reason is you can not spend time making everything from scratch, Thus, Slidegeeks has made presentation templates for you too. You can easily download these templates from our website easily.
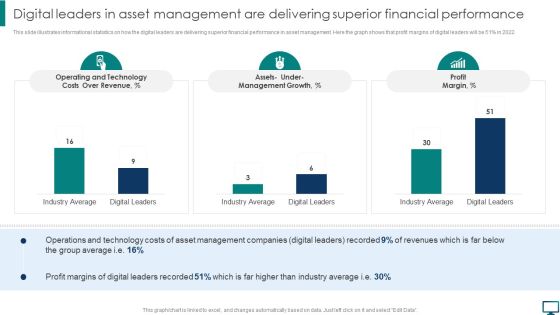
Digital Leaders In Asset Management Are Delivering Superior Financial Performance Topics PDF
This slide illustrates informational statistics on how the digital leaders are delivering superior financial performance in asset management. Here the graph shows that profit margins of digital leaders will be 51 percent in 2022. Take your projects to the next level with our ultimate collection of Digital Leaders In Asset Management Are Delivering Superior Financial Performance Topics PDF. Slidegeeks has designed a range of layouts that are perfect for representing task or activity duration, keeping track of all your deadlines at a glance. Tailor these designs to your exact needs and give them a truly corporate look with your own brand colors they will make your projects stand out from the rest.
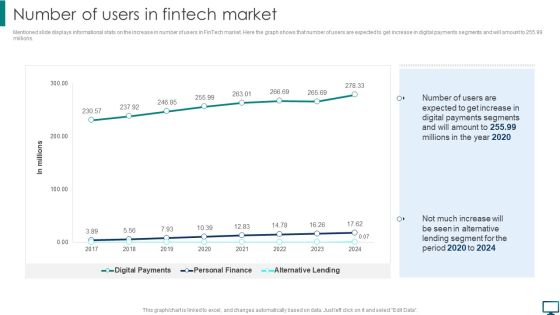
Optimizing Advanced Technology To Gain Competitive Edge Number Of Users In Fintech Market Elements PDF
Mentioned slide displays informational stats on the increase in number of users in FinTech market. Here the graph shows that number of users are expected to get increase in digital payments segments and will amount to 255.99 millions. Find a pre designed and impeccable Optimizing Advanced Technology To Gain Competitive Edge Number Of Users In Fintech Market Elements PDF. The templates can ace your presentation without additional effort. You can download these easy to edit presentation templates to make your presentation stand out from others. So, what are you waiting for Download the template from Slidegeeks today and give a unique touch to your presentation.

Optimizing Advanced Technology To Gain Competitive Edge Total Transaction Value In Fintech Market Structure PDF
Following slide displays informational stats on total transactional value in FinTech market. Here the graph shows that digital payment segment will record a total transaction of dollar 910,396 MM. Boost your pitch with our creative Optimizing Advanced Technology To Gain Competitive Edge Total Transaction Value In Fintech Market Structure PDF. Deliver an awe inspiring pitch that will mesmerize everyone. Using these presentation templates you will surely catch everyones attention. You can browse the ppts collection on our website. We have researchers who are experts at creating the right content for the templates. So you do not have to invest time in any additional work. Just grab the template now and use them.

Inbound Leads Generation And Conversion Analytics Ppt Summary Show PDF
This slide covers record of prospects visits and leads generated using different sources. It includes sources such as organic search, referrals, social media, email marketing, paid search, direct traffic, etc. along with total visits, conversion rates, contacts generated, customers count, conversion rates and graph depicting monthly visits using these sources. Showcasing this set of slides titled Inbound Leads Generation And Conversion Analytics Ppt Summary Show PDF. The topics addressed in these templates are Organic Search, Referrals, Social Media. All the content presented in this PPT design is completely editable. Download it and make adjustments in color, background, font etc. as per your unique business setting.

Determining Current And Future Qualification Demand Investment In Latest Technology To Ensure Formats PDF
Following slide shows informational stats on employees current and future qualification demand. Here the graph shows that there will be a huge increase in the demand for employees having qualification in data science after five years.Want to ace your presentation in front of a live audience Our Determining Current And Future Qualification Demand Investment In Latest Technology To Ensure Formats PDF can help you do that by engaging all the users towards you.. Slidegeeks experts have put their efforts and expertise into creating these impeccable powerpoint presentations so that you can communicate your ideas clearly. Moreover, all the templates are customizable, and easy-to-edit and downloadable. Use these for both personal and commercial use.

Usage Trend Chart Of Skincare Product Market Ppt Slides Graphics Download PDF
This slide shows market trend graph of skincare product usage in four quarters. It also indicates that product A is most preferred by the customers. Pitch your topic with ease and precision using this Usage Trend Chart Of Skincare Product Market Ppt Slides Graphics Download PDF. This layout presents information on Trend Product, Skincare Product, Quarter Due. It is also available for immediate download and adjustment. So, changes can be made in the color, design, graphics or any other component to create a unique layout.

Real Estate Business Monthly Sales Forecast Dashboard Ppt Layouts Grid PDF
This slide represents the dashboard showing the data related to sales forecasting for the real estate business. It shows details related to the set target, sales targets won, open and forecasted and also shows the graph representing the sales pipeline for the year. Showcasing this set of slides titled Real Estate Business Monthly Sales Forecast Dashboard Ppt Layouts Grid PDF. The topics addressed in these templates are Next Billing Data, Pipeline, Current Fiscal Year. All the content presented in this PPT design is completely editable. Download it and make adjustments in color, background, font etc. as per your unique business setting.
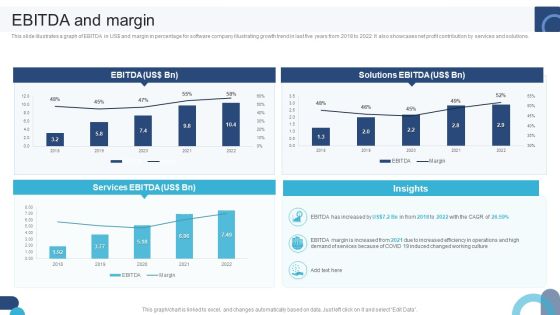
Digital Application Software Development Business Profile EBITDA And Margin Guidelines PDF
This slide illustrates a graph of EBITDA in US dollar and margin in percentage for software company illustrating growth trend in last five years from 2018 to 2022. It also showcases net profit contribution by services and solutions. If your project calls for a presentation, then Slidegeeks is your go-to partner because we have professionally designed, easy-to-edit templates that are perfect for any presentation. After downloading, you can easily edit Digital Application Software Development Business Profile EBITDA And Margin Guidelines PDF and make the changes accordingly. You can rearrange slides or fill them with different images. Check out all the handy templates
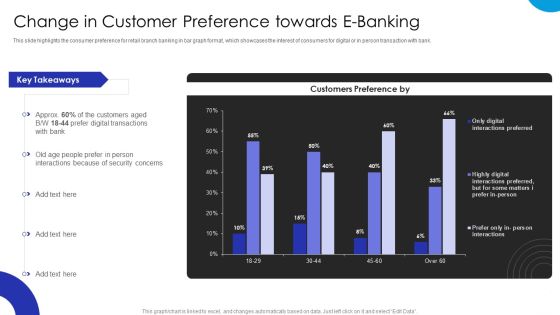
Operational Innovation In Banking Change In Customer Preference Towards E Banking Demonstration PDF
This slide highlights the consumer preference for retail branch banking in bar graph format, which showcases the interest of consumers for digital or in person transaction with bank. Want to ace your presentation in front of a live audience Our Operational Innovation In Banking Change In Customer Preference Towards E Banking Demonstration PDF can help you do that by engaging all the users towards you. Slidegeeks experts have put their efforts and expertise into creating these impeccable powerpoint presentations so that you can communicate your ideas clearly. Moreover, all the templates are customizable, and easy-to-edit and downloadable. Use these for both personal and commercial use.
Six Months Business Valuation Chart Ppt Styles Icons PDF
This slide shows the 6 months graph to measure company valuation. It is representing that highest valuation of company was calculated in the month of June due to increase in sales. Pitch your topic with ease and precision using this Six Months Business Valuation Chart Ppt Styles Icons PDF. This layout presents information on Increase Sales, Company Valuation. It is also available for immediate download and adjustment. So, changes can be made in the color, design, graphics or any other component to create a unique layout.
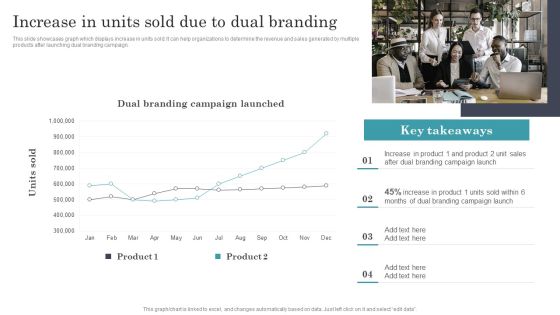
Developing Dual Branding Campaign For Brand Marketing Increase In Units Sold Due To Dual Branding Sample PDF
This slide showcases graph which displays increase in units sold. It can help organizations to determine the revenue and sales generated by multiple products after launching dual branding campaign. Want to ace your presentation in front of a live audience Our Developing Dual Branding Campaign For Brand Marketing Increase In Units Sold Due To Dual Branding Sample PDF can help you do that by engaging all the users towards you. Slidegeeks experts have put their efforts and expertise into creating these impeccable powerpoint presentations so that you can communicate your ideas clearly. Moreover, all the templates are customizable, and easy to edit and downloadable. Use these for both personal and commercial use.

Brand Awareness Plan Dashboard Showing Digital Marketing Performance Sample PDF
This graph or chart is linked to excel, and changes automatically based on data. Just left click on it and select Edit Data. The best PPT templates are a great way to save time, energy, and resources. Slidegeeks have 100 percent editable powerpoint slides making them incredibly versatile. With these quality presentation templates, you can create a captivating and memorable presentation by combining visually appealing slides and effectively communicating your message. Download Brand Awareness Plan Dashboard Showing Digital Marketing Performance Sample PDF from Slidegeeks and deliver a wonderful presentation.

Brand Awareness Plan Product Marketing Dashboard For Pay Per Click Campaign Template PDF
This graph or chart is linked to excel, and changes automatically based on data. Just left click on it and select Edit Data. Get a simple yet stunning designed Brand Awareness Plan Product Marketing Dashboard For Pay Per Click Campaign Template PDF. It is the best one to establish the tone in your meetings. It is an excellent way to make your presentations highly effective. So, download this PPT today from Slidegeeks and see the positive impacts. Our easy-to-edit Brand Awareness Plan Product Marketing Dashboard For Pay Per Click Campaign Template PDF can be your go-to option for all upcoming conferences and meetings. So, what are you waiting for Grab this template today.
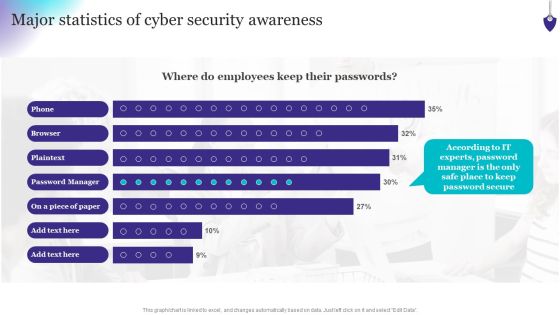
Organizing Security Awareness Major Statistics Of Cyber Security Awareness Formats PDF
This graph or chart is linked to excel, and changes automatically based on data. Just left click on it and select Edit Data. Welcome to our selection of the Organizing Security Awareness Major Statistics Of Cyber Security Awareness Formats PDF. These are designed to help you showcase your creativity and bring your sphere to life. Planning and Innovation are essential for any business that is just starting out. This collection contains the designs that you need for your everyday presentations. All of our PowerPoints are 100 percent editable, so you can customize them to suit your needs. This multi-purpose template can be used in various situations. Grab these presentation templates today.
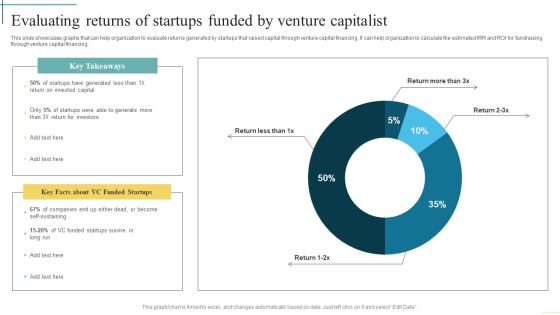
Evaluating Returns Of Startups Funded By Venture Capitalist Developing Fundraising Techniques Microsoft PDF
This slide illustrates graph that can help organization to evaluate the percentage of IPO generating negative returns. It can company to evaluate the success rate of raising money through public by issuing IPO.Boost your pitch with our creative Evaluating Returns Of Startups Funded By Venture Capitalist Developing Fundraising Techniques Microsoft PDF. Deliver an awe-inspiring pitch that will mesmerize everyone. Using these presentation templates you will surely catch everyones attention. You can browse the ppts collection on our website. We have researchers who are experts at creating the right content for the templates. So you do not have to invest time in any additional work. Just grab the template now and use them.
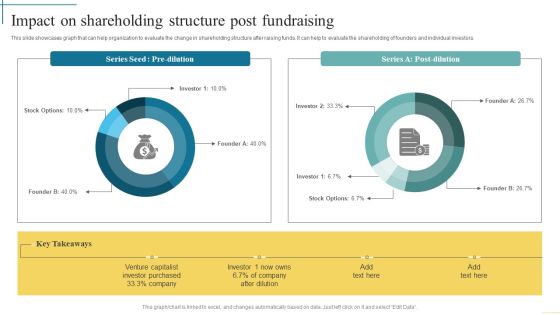
Impact On Shareholding Structure Post Fundraising Developing Fundraising Techniques Graphics PDF
This slide showcases graph that can help organization to evaluate the change in shareholding structure after raising funds. It can help to evaluate the shareholding of founders and individual investors.Present like a pro with Impact On Shareholding Structure Post Fundraising Developing Fundraising Techniques Graphics PDF Create beautiful presentations together with your team, using our easy-to-use presentation slides. Share your ideas in real-time and make changes on the fly by downloading our templates. So whether you are in the office, on the go, or in a remote location, you can stay in sync with your team and present your ideas with confidence. With Slidegeeks presentation got a whole lot easier. Grab these presentations today.

Assessing International Market Expectations After Expanding Into Global Markets Introduction PDF
This slide showcase graph that can help organization to estimate the impact on organizational sales after global expansion. It showcases sales in thousand dollars and forecast for a period of two years. Boost your pitch with our creative Assessing International Market Expectations After Expanding Into Global Markets Introduction PDF. Deliver an awe-inspiring pitch that will mesmerize everyone. Using these presentation templates you will surely catch everyones attention. You can browse the ppts collection on our website. We have researchers who are experts at creating the right content for the templates. So you dont have to invest time in any additional work. Just grab the template now and use them.

Company Brand Value Over Time AI For Brand Administration Pictures PDF
This graph shows the current situation of our company, where it lies according to other brands. This leads to implementing AI in the organization.Want to ace your presentation in front of a live audience Our Company Brand Value Over Time AI For Brand Administration Pictures PDF can help you do that by engaging all the users towards you.. Slidegeeks experts have put their efforts and expertise into creating these impeccable powerpoint presentations so that you can communicate your ideas clearly. Moreover, all the templates are customizable, and easy-to-edit and downloadable. Use these for both personal and commercial use.
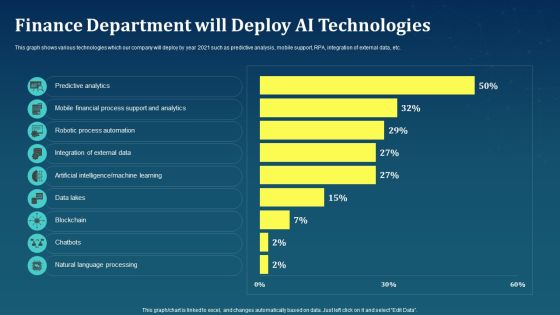
Finance Department Will Deploy AI Technologies AI For Brand Administration Graphics PDF
This graph shows various technologies which our company will deploy by year 2021 such as predictive analysis, mobile support, RPA, integration of external data, etc.Present like a pro with Finance Department Will Deploy AI Technologies AI For Brand Administration Graphics PDF Create beautiful presentations together with your team, using our easy-to-use presentation slides. Share your ideas in real-time and make changes on the fly by downloading our templates. So whether you are in the office, on the go, or in a remote location, you can stay in sync with your team and present your ideas with confidence. With Slidegeeks presentation got a whole lot easier. Grab these presentations today.

Challenges For Blockchain Technology In Supply Chain Management Demonstration PDF
This slide represents a graph showing the challenges faced by blockchain in areas of supply chain that are visibility, risk allocation, sourcing, fluctuating consumer demand, keeping pace with technology manufacturing, inventory and data management. Showcasing this set of slides titled Challenges For Blockchain Technology In Supply Chain Management Demonstration PDF. The topics addressed in these templates are Inventory Management Challenges, Supply Chain Complexity. All the content presented in this PPT design is completely editable. Download it and make adjustments in color, background, font etc. as per your unique business setting.
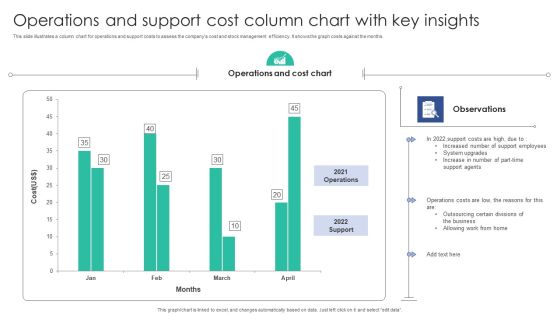
Operations And Support Cost Column Chart With Key Insights Background PDF
This slide illustrates a column chart for operations and support costs to assess the companys cost and stock management efficiency. It shows the graph costs against the months.Showcasing this set of slides titled Operations And Support Cost Column Chart With Key Insights Background PDF. The topics addressed in these templates are Operations Cost, Support Agents, Support Employees. All the content presented in this PPT design is completely editable. Download it and make adjustments in color, background, font etc. as per your unique business setting.

Implementing Succession Planning Determining Employee Headcount Average Tenure Template PDF
Following slide displays informational stats about employee headcount and average tenure. It also includes a graph that shows stats about hiring and turnover rate. Present like a pro with Implementing Succession Planning Determining Employee Headcount Average Tenure Template PDF Create beautiful presentations together with your team, using our easy-to-use presentation slides. Share your ideas in real-time and make changes on the fly by downloading our templates. So whether youre in the office, on the go, or in a remote location, you can stay in sync with your team and present your ideas with confidence. With Slidegeeks presentation got a whole lot easier. Grab these presentations today.
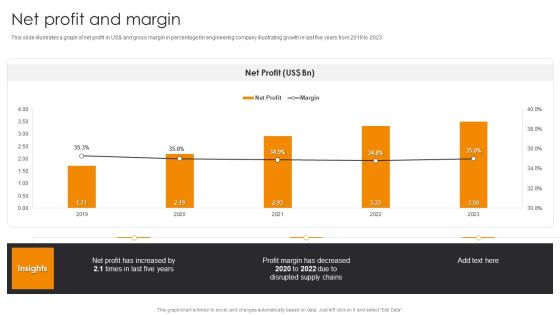
Net Profit And Margin Engineering Company Financial Analysis Report Background PDF
This slide illustrates a graph of net profit in US dollar and gross margin in percentage for engineering company illustrating growth in last five years from 2019 to 2023.Slidegeeks has constructed Net Profit And Margin Engineering Company Financial Analysis Report Background PDF after conducting extensive research and examination. These presentation templates are constantly being generated and modified based on user preferences and critiques from editors. Here, you will find the most attractive templates for a range of purposes while taking into account ratings and remarks from users regarding the content. This is an excellent jumping-off point to explore our content and will give new users an insight into our top-notch PowerPoint Templates.

Security Automation To Analyze And Mitigate Cyberthreats Time To Fix Security Threat Ideas PDF
This slide highlights the time to fix the security threat and error with manual testing in bar graph format. It covers key takeaways which explains how much of error are fixed in 1 to 3 hour, 3 to 6 hour and working day etc.The best PPT templates are a great way to save time, energy, and resources. Slidegeeks have 100 precent editable powerpoint slides making them incredibly versatile. With these quality presentation templates, you can create a captivating and memorable presentation by combining visually appealing slides and effectively communicating your message. Download Security Automation To Analyze And Mitigate Cyberthreats Time To Fix Security Threat Ideas PDF from Slidegeeks and deliver a wonderful presentation.

Effect Of Conflict Resolution On The Organization Functioning Pictures PDF
The following slide showcases graph representing the effects of conflict management on the organization. Key effects included are reduction in turnover, absenteeism, defects and increase in productivity, sales, profitability and customer satisfaction. Showcasing this set of slides titled Effect Of Conflict Resolution On The Organization Functioning Topics PDF. The topics addressed in these templates areEffect Of Conflict Resolution On The Organization Functioning Pictures PDF. All the content presented in this PPT design is completely editable. Download it and make adjustments in color, background, font etc. as per your unique business setting.

Transforming Business With AI Company Brand Value Over Time Clipart PDF
This graph shows the current situation of our company, where it lies according to other brands. This leads to implementing AI in the organization. Take your projects to the next level with our ultimate collection of Transforming Business With AI Company Brand Value Over Time Clipart PDF. Slidegeeks has designed a range of layouts that are perfect for representing task or activity duration, keeping track of all your deadlines at a glance. Tailor these designs to your exact needs and give them a truly corporate look with your own brand colors they will make your projects stand out from the rest.

Transforming Business With AI Impact Of Artificial Intelligence In Business Rules PDF
This graph focuses on the impact of AI after being implemented in the business such as enhancing companys products and performance, optimize internal business operations, better decision making, etc. From laying roadmaps to briefing everything in detail, our templates are perfect for you. You can set the stage with your presentation slides. All you have to do is download these easy to edit and customizable templates. Transforming Business With AI Impact Of Artificial Intelligence In Business Rules PDF will help you deliver an outstanding performance that everyone would remember and praise you for. Do download this presentation today.

Defining Generic Target Marketing Techniques Evaluating Growth Rate For Target Marketing Information PDF
This template showcases graph to evaluate growth rate of target market. The purpose of this slide is to identify potential and suitability of target market for launching new product or service. Find a pre designed and impeccable Defining Generic Target Marketing Techniques Evaluating Growth Rate For Target Marketing Information PDF. The templates can ace your presentation without additional effort. You can download these easy to edit presentation templates to make your presentation stand out from others. So, what are you waiting for Download the template from Slidegeeks today and give a unique touch to your presentation.

Assessing Debt And Equity Fundraising Alternatives For Assessing Debt And Returns Of Startups Icons PDF
This slide showcases graph that can help organization to evaluate returns generated by startups that raised capital through venture capital financing. It can help organization to calculate the estimated IRR and ROI for fundraising through venture capital financing. Find a pre designed and impeccable Assessing Debt And Equity Fundraising Alternatives For Assessing Debt And Returns Of Startups Icons PDF. The templates can ace your presentation without additional effort. You can download these easy to edit presentation templates to make your presentation stand out from others. So, what are you waiting for Download the template from Slidegeeks today and give a unique touch to your presentation.
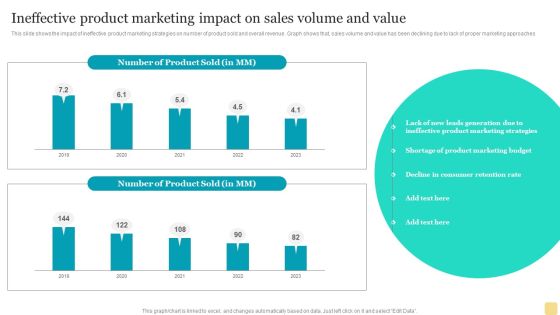
Ineffective Product Marketing Impact On Sales Volume And Value Brochure PDF
This slide shows the impact of ineffective product marketing strategies on number of product sold and overall revenue. Graph shows that, sales volume and value has been declining due to lack of proper marketing approaches. There are so many reasons you need a Ineffective Product Marketing Impact On Sales Volume And Value Brochure PDF. The first reason is you can not spend time making everything from scratch, Thus, Slidegeeks has made presentation templates for you too. You can easily download these templates from our website easily.
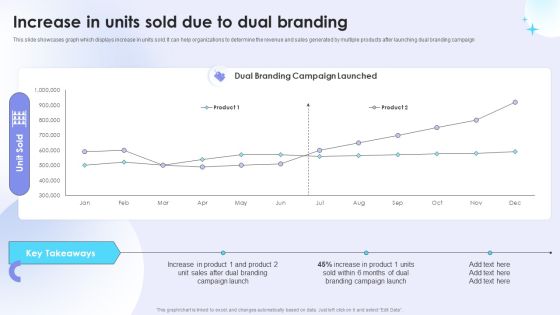
Dual Branding Campaign To Boost Sales Of Product Or Services Increase In Units Sold Due To Dual Branding Template PDF
This slide showcases graph which displays increase in units sold. It can help organizations to determine the revenue and sales generated by multiple products after launching dual branding campaign. Find a pre designed and impeccableDual Branding Campaign To Boost Sales Of Product Or Services Increase In Units Sold Due To Dual Branding Template PDF. The templates can ace your presentation without additional effort. You can download these easy to edit presentation templates to make your presentation stand out from others. So, what are you waiting for Download the template from Slidegeeks today and give a unique touch to your presentation.

Comparison Of Budgeted And Actual Expenses Client Acquisition Techniques To Boost Sales Designs PDF
The slides shows graphical comparison of companys planned and actual promotional expenses. Further, it shows the graph of budget deviation by month. Create an editable Comparison Of Budgeted And Actual Expenses Client Acquisition Techniques To Boost Sales Designs PDF that communicates your idea and engages your audience. Whether you are presenting a business or an educational presentation, pre-designed presentation templates help save time. Comparison Of Budgeted And Actual Expenses Client Acquisition Techniques To Boost Sales Designs PDF is highly customizable and very easy to edit, covering many different styles from creative to business presentations. Slidegeeks has creative team members who have crafted amazing templates. So, go and get them without any delay.
 Home
Home