Errc Graph

Lego Growth Chart Business PowerPoint Templates And PowerPoint Themes 0512
Lego Growth Chart Business PowerPoint Templates And PowerPoint Themes PPT designs-Microsoft Powerpoint Templates and Background with bar graph
Raising Money Chart Finance PowerPoint Templates And PowerPoint Themes 0512
Raising Money Chart Finance PowerPoint Templates And PowerPoint Themes PPT designs-Microsoft Powerpoint Templates and Background with business graph

Growth Business Success PowerPoint Templates And PowerPoint Themes 0612
Growth Business Success PowerPoint Templates And PowerPoint Themes Business-Microsoft Powerpoint Templates and Background with graph with arrow

Finance Business PowerPoint Templates And PowerPoint Themes 0612
Finance Business PowerPoint Templates And PowerPoint Themes PPT Slides-Microsoft Powerpoint Templates and Background with business graph with arrow

Pie Chart Marketing PowerPoint Templates And PowerPoint Themes 0612
Pie Chart Marketing PowerPoint Templates And PowerPoint Themes PPT Slides-Microsoft Powerpoint Templates and Background with pie chart graph
Pie Chart Money Business PowerPoint Templates And PowerPoint Themes 0612
Pie Chart Money Business PowerPoint Templates And PowerPoint Themes PPT Slides-Microsoft Powerpoint Templates and Background with pie chart graph
Pie Chart Money Finance PowerPoint Templates And PowerPoint Themes 0612
Pie Chart Money Finance PowerPoint Templates And PowerPoint Themes PPT Slides-Microsoft Powerpoint Templates and Background with pie chart graph
Pie Chart Success PowerPoint Templates And PowerPoint Themes 0612
Pie Chart Success PowerPoint Templates And PowerPoint Themes PPT Slides-Microsoft Powerpoint Templates and Background with pie chart graph

Profits Bar Chart Finance PowerPoint Templates And PowerPoint Themes 0612
Profits Bar Chart Finance PowerPoint Templates And PowerPoint Themes PPT Slides-Microsoft Powerpoint Templates and Background with graph with arrow

Profits Bar Chart Sales PowerPoint Templates And PowerPoint Themes 0612
Profits Bar Chart Sales PowerPoint Templates And PowerPoint Themes PPT Slides-Microsoft Powerpoint Templates and Background with graph with arrow

Profits Bar Chart Success PowerPoint Templates And PowerPoint Themes 0612
Profits Bar Chart Success PowerPoint Templates And PowerPoint Themes PPT Slides-Microsoft Powerpoint Templates and Background with graph with arrow

Pie Chart Finance Business PowerPoint Templates And PowerPoint Themes 0612
Pie Chart Finance Business PowerPoint Templates And PowerPoint Themes Business PPT-Microsoft Powerpoint Templates and Background with pie chart graph

Pie Chart Finance PowerPoint Templates And PowerPoint Themes 0612
Pie Chart Finance PowerPoint Templates And PowerPoint Themes Business PPT-Microsoft Powerpoint Templates and Background with pie chart graph

Success Pie Chart Concept Finance PowerPoint Templates And PowerPoint Themes 0612
Success Pie Chart Concept Finance PowerPoint Templates And PowerPoint Themes Business PPT-Microsoft Powerpoint Templates and Background with pie chart graph

Pie Chart Marketing Business PowerPoint Templates And PowerPoint Themes 0612
Pie Chart Marketing Business PowerPoint Templates And PowerPoint Themes Business PPT Templates-Pie graph marketing, business, finance, sales, success, marketing
Business Background Finance PowerPoint Templates And PowerPoint Themes 0612
Business Background Finance PowerPoint Templates And PowerPoint Themes 0612-Microsoft Powerpoint Templates and Background with business graph with arrow

Increase In Income Success PowerPoint Templates And PowerPoint Themes 0612
Increase In Income Success PowerPoint Templates And PowerPoint Themes 0612-Microsoft Powerpoint Templates and Background with bar graph
Pie Growth Business PowerPoint Templates And PowerPoint Themes 0612
Pie Growth Business PowerPoint Templates And PowerPoint Themes 0612-Microsoft Powerpoint Templates and Background with bar and pie graph

Growth Concept Business PowerPoint Templates And PowerPoint Themes 0712
Growth Concept Business PowerPoint Templates And PowerPoint Themes 0712-Microsoft Powerpoint Templates and Background with color bar graph with ladder

Income Business Success PowerPoint Templates And PowerPoint Themes 0712
Income Business Success PowerPoint Templates And PowerPoint Themes Business Power Points-Microsoft Powerpoint Templates and Background with bar graph

Business Growth With Green Arrow Success PowerPoint Templates And PowerPoint Themes 0712
Business Growth With Green Arrow Success PowerPoint Templates And PowerPoint Themes 0712-Microsoft Powerpoint Templates and Background with graph with arrow
Business Diagram And Dollars Finance PowerPoint Templates And PowerPoint Themes 0812
Business Diagram And Dollars Finance PowerPoint Templates And PowerPoint Themes 0812-Microsoft Powerpoint Templates and Background with graph and dollar

Growth Progress Bar Success PowerPoint Templates And PowerPoint Themes 0812
Growth Progress Bar Success PowerPoint Templates And PowerPoint Themes 0812-Microsoft Powerpoint Templates and Background with business Graph with arrow

Loss Chart Business PowerPoint Templates And PowerPoint Themes 0812
Loss Chart Business PowerPoint Templates And PowerPoint Themes 0812-Microsoft Powerpoint Templates and Background with business failure graph down arrow

Coin Submission Success Money PowerPoint Templates And PowerPoint Themes 0812
Coin Submission Success Money PowerPoint Templates And PowerPoint Themes 0812-Microsoft Powerpoint Templates and Background with coin showing bar graph

Business Framework The Long Tail PowerPoint Presentation
Our above diagram illustrates framework for long trail. It contains x-y graph of individual titles and content titles. Download this long tail diagram for business and marketing presentations.

Business Teamwork Communication PowerPoint Templates And PowerPoint Backgrounds 0611
Microsoft Powerpoint Template and Background with cartoon of business executives climbing a bar graph and using teamwork to ascend the obstacle

Business Global Marketing PowerPoint Templates And PowerPoint Backgrounds 0611
Microsoft PowerPoint Template and Background with two businessmen in silhouette shaking hands in front of a graph showing yearly increasing growth and sales
American Financial Background PowerPoint Templates And PowerPoint Backgrounds 0711
Microsoft PowerPoint Template and Background with vintage united states silver certificate under red white and blue american flag with declining graph line

Crisis Chart Business PowerPoint Templates And PowerPoint Backgrounds 0811
Microsoft PowerPoint Template and Background with graph declining over time concept financial decline or credit crisis crunch over grid and clouds with cloudy sky

Stock Market Crash Business PowerPoint Templates And PowerPoint Backgrounds 0811
Microsoft PowerPoint Template and Background with a man deeply depressed due to a drop in the graph to represent stock losses sales losses

Business Teamwork Success PowerPoint Templates And PowerPoint Backgrounds 1011
Microsoft PowerPoint Template and Background with cartoon of business executives climbing a bar graph and using teamwork to ascend the obstacle

Business Teamwork Communication PowerPoint Themes And PowerPoint Slides 0611
Microsoft Powerpoint Theme and Slide with cartoon of business executives climbing a bar graph and using teamwork to ascend the obstacle

Crisis Chart Business PowerPoint Themes And PowerPoint Slides 0811
Microsoft PowerPoint Theme and Slide with graph declining over time concept financial decline or credit crisis crunch over grid and clouds with cloudy sky

2012 Business Growth Success PowerPoint Templates And PowerPoint Themes 0612
2012 Business Growth Success PowerPoint Templates And PowerPoint Themes PPT Slides-Microsoft Powerpoint Templates and Background with graph showing success for 2012
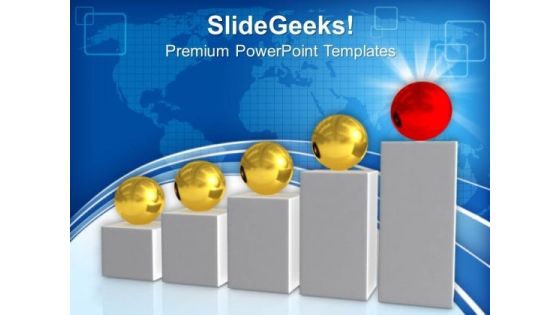
Conceptual Image Of Teamwork Leadership PowerPoint Templates And PowerPoint Themes 0812
Conceptual Image Of Teamwork Leadership PowerPoint Templates And PowerPoint Themes 0812-Microsoft Powerpoint Templates and Background with bar graph and red ball shows teamwork and leadership
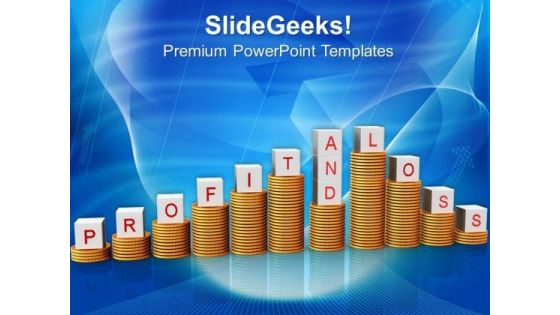
Profit And Loss Finance Business PowerPoint Templates And PowerPoint Themes 0812
Profit And Loss Finance Business PowerPoint Templates And PowerPoint Themes 0812-Microsoft Powerpoint Templates and Background with business graph with up and fall

Golden Dollar Coins Business PowerPoint Templates And PowerPoint Themes 0912
Golden Dollar Coins Business PowerPoint Templates And PowerPoint Themes 0912-Microsoft Powerpoint Templates and Background with graph made of stacks of golden coins
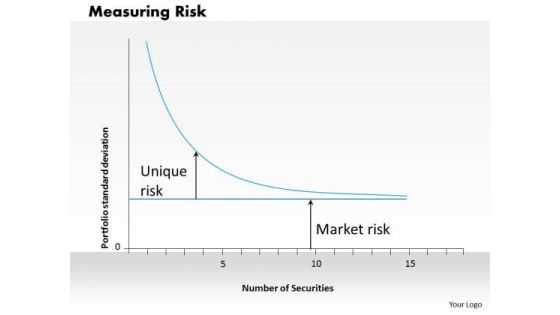
Business Framework Measuring Risk PowerPoint Presentation
This business framework has been crafted with graphic of graph with concept of measuring risk. Use this template for marketing and business related risk calculation.
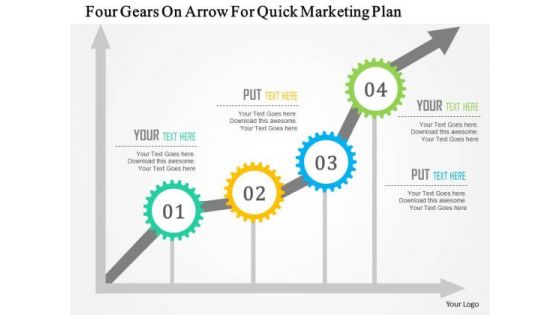
Business Diagram Four Gears On Arrow For Quick Marketing Plan Presentation Template
Our above business diagram displays graph for quick marketing plan. This slide contains four gears on an arrow. Download this diagram to build exclusive presentations for your viewers.

Business Framework Bar Chart In PowerPoint Presentation
This power point diagram slide has been designed with graphic of bar chart. In this diagram slide we have used green and blue colored vertical bar graph. Display result analysis with this bar graph diagram and use it in your result verification and analysis related presentations.

Business Framework Kano Model PowerPoint Presentation
This business diagram displays framework for Kano model. This slide contains x y graph. The X-axis represents customer satisfaction. The y-axis represents presence of characteristics. It also contains three arrows in center of graph representing delighters, satisfier and dissatisfier. Use this business diagram to earn good remarks from the target audience.
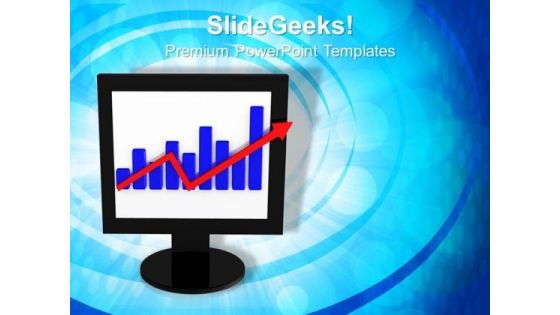
Business Progress Accounting PowerPoint Templates And PowerPoint Themes 1012
Business Progress Accounting PowerPoint Templates And PowerPoint Themes 1012-Microsoft Powerpoint Templates and Background with business graph with arrow-Business Progress Accounting PowerPoint Templates And PowerPoint Themes 1012-This PowerPoint template can be used for presentations relating to-Business graph with arrow, technology, computer, business, success, arrows

0814 Business Diagram For Planning Image Graphics For PowerPoint
Define the concepts of planning with this unique image. This image of charts and graphs depicts planning for year 2015. In this image pie chart and bar graph is displayed with year 2015. Use this image in business, marketing and sales related presentations.
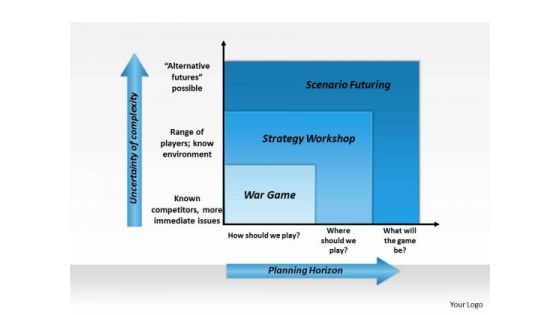
Business Framework Future Strategy Planning PowerPoint Presentation
This image slide displays planning graph. This image slide has been crafted with graph with planning horizon and uncertainty of complexity attributes. Use this image slide in your presentations to express views on future planning, strategy and various business complexities. This image slide will help your express your views in professional manner.
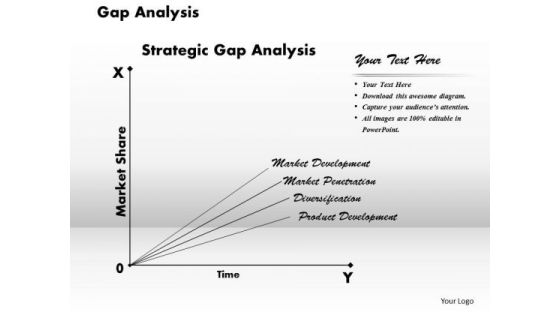
Business Framework Gap Analysis PowerPoint Presentation
This image slide displays gap analysis graph. This image slide has been designed with gap analysis graph with market share and time axis. It is the comparison of actual performance with potential or desired performance. Use this image slide to depict strategic gap analysis in your presentations. Make outstanding presentations in your presentations.

Business Framework Stakeholders Analysis PowerPoint Presentation
This Business framework Power Point template diagram has been crafted with graphic of yellow colored two axis graph. This graph can be used for displaying stakeholder analysis. Use this PPT diagram in your business and finance related presentations. Define marketing management and planning on the basis of this stakeholder analysis.
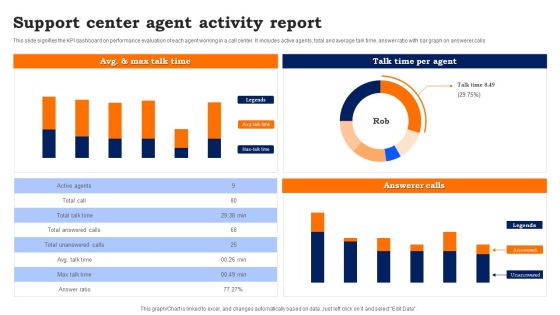
Support Center Agent Activity Report Guidelines PDF
This slide signifies the KPI dashboard on performance evaluation of each agent working in a call center. It includes active agents, total and average talk time, answer ratio with bar graph on answerer calls.
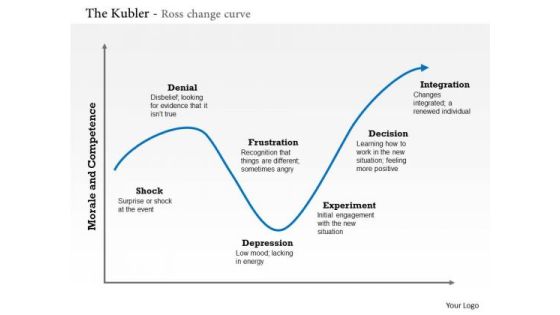
Business Framework The Kubler Ross Change Curve PowerPoint Presentation
Our above diagram displays framework for Kubler-Ross change curve. It contains curved arrow graph of morale and competence. Use this Kubler-Ross model to identify reactions to change like shock frustration and depression.

Subordinate Debt Pitch Deck For Fund Raising Funding And Valuation History Of The Company Topics PDF
The slide provides the graph of companys funding details. Graph includes he funding amount in dollar MM and the valuation of the company in dollar MM after each funding round. Deliver an awe-inspiring pitch with this creative subordinate debt pitch deck for fund raising funding and valuation history of the company topics pdf bundle. Topics like round amount, valuation can be discussed with this completely editable template. It is available for immediate download depending on the needs and requirements of the user.

Ultimate Guide To Effective Change Management Process Innovation Adoption Curve Template PDF
This slide highlights the graph to represents the technological change in the organization. The key parameters of the graph are the level of change and stages of change. Deliver an awe inspiring pitch with this creative ultimate guide to effective change management process innovation adoption curve template pdf bundle. Topics like innovators, early adopters, early majority, late majority, laggards can be discussed with this completely editable template. It is available for immediate download depending on the needs and requirements of the user.

Machine Learning Development And Operations Cycle IT Impact Of Mlops On Product Sample PDF
Following slide illustrates information about the impact of introducing MLOps on product improvement. Here the graph shows that organization will observe rapid iteration in its product improvement.Deliver an awe inspiring pitch with this creative machine learning development and operations cycle it impact of mlops on product sample pdf bundle. Topics like graph indicates, iteration in product, product improvement can be discussed with this completely editable template. It is available for immediate download depending on the needs and requirements of the user.
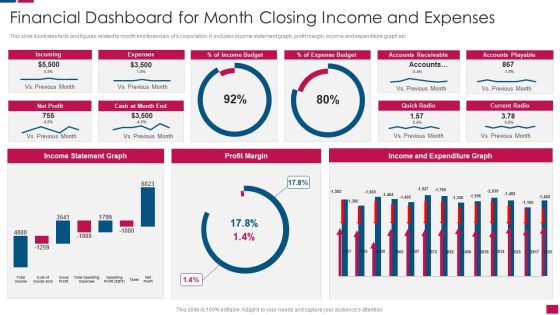
Financial Dashboard For Month Closing Income And Expenses Ideas PDF
This slide illustrates facts and figures related to month end financials of a corporation. It includes income statement graph, profit margin, income and expenditure graph etc.Showcasing this set of slides titled Financial Dashboard For Month Closing Income And Expenses Ideas PDF The topics addressed in these templates are Accounts Receivable, Income Statement, Expenditure All the content presented in this PPT design is completely editable. Download it and make adjustments in color, background, font etc. as per your unique business setting.
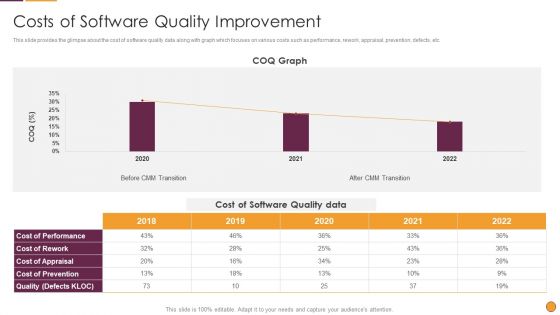
Process Enhancement Program Success Costs Of Software Quality Improvement Graphics PDF
This slide provides the glimpse about the cost of software quality data along with graph which focuses on various costs such as performance, rework, appraisal, prevention, defects, etc. Deliver an awe inspiring pitch with this creative Process Enhancement Program Success Costs Of Software Quality Improvement Graphics PDF bundle. Topics like Cost Software, Quality Data, COQ Graph can be discussed with this completely editable template. It is available for immediate download depending on the needs and requirements of the user.
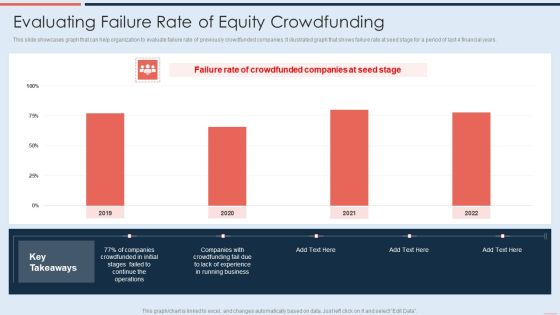
Evaluating Failure Rate Of Equity Crowdfunding Template PDF
This slide showcases graph that can help organization to evaluate failure rate of previously crowdfunded companies. It illustrated graph that shows failure rate at seed stage for a period of last 4 financial years. Deliver an awe inspiring pitch with this creative Evaluating Failure Rate Of Equity Crowdfunding Template PDF bundle. Topics like Evaluating Failure Rate, Equity Crowdfunding can be discussed with this completely editable template. It is available for immediate download depending on the needs and requirements of the user.

Adult Population That Are Actively Paying Customers Of Dating Service Formats PDF
Mentioned slide portrays worldwide informational stats of adult population that are actively paying customers of dating service. Here the graph indicates that country with the largest share is the United States.Deliver an awe inspiring pitch with this creative Adult Population That Are Actively Paying Customers Of Dating Service Formats PDF bundle. Topics like Graph Indicates, Dating Service, United States can be discussed with this completely editable template. It is available for immediate download depending on the needs and requirements of the user.

Real Estate Development Project Financing Global Real Estate Investment Volume In 2022 Sample PDF
This slide portrays informational stats about global real estate investment volume for 2022. Here the graph shows that real estate investment volume will fall by 38percent. Deliver an awe inspiring pitch with this creative Real Estate Development Project Financing Global Real Estate Investment Volume In 2022 Sample PDF bundle. Topics like Graph Indicates, Estate Investment, Key Takeaways can be discussed with this completely editable template. It is available for immediate download depending on the needs and requirements of the user.
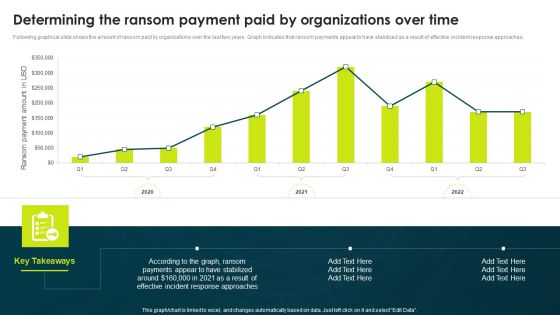
Determining The Ransom Payment Paid By Organizations Over Time Professional PDF
Following graphical slide shows the amount of ransom paid by organizations over the last two years. Graph indicates that ransom payments appear to have stabilized as a result of effective incident response approaches.Deliver an awe inspiring pitch with this creative Determining The Ransom Payment Paid By Organizations Over Time Professional PDF bundle. Topics like According Graph, Payments Appear, Response Approaches can be discussed with this completely editable template. It is available for immediate download depending on the needs and requirements of the user.

Capital Investment Options Global Real Estate Investment Volume In 2022 Slides PDF
This slide portrays informational stats about global real estate investment volume for 2022. Here the graph shows that real estate investment volume will fall by 38 percent. Deliver an awe inspiring pitch with this creative Capital Investment Options Global Real Estate Investment Volume In 2022 Slides PDF bundle. Topics like Graph Indicates, Real Estate Investment, 2008 To 2023 can be discussed with this completely editable template. It is available for immediate download depending on the needs and requirements of the user.
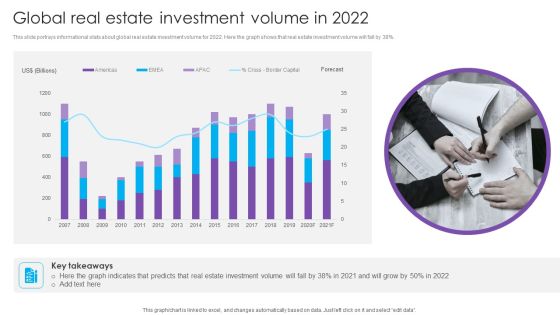
Global Real Estate Investment Volume In 2022 Real Estate Project Funding Introduction PDF
This slide portrays informational stats about global real estate investment volume for 2022. Here the graph shows that real estate investment volume will fall by 38persent. Deliver and pitch your topic in the best possible manner with this Global Real Estate Investment Volume In 2022 Real Estate Project Funding Introduction PDF. Use them to share invaluable insights on Graph Indicates, Estate Investment, Predicts Real and impress your audience. This template can be altered and modified as per your expectations. So, grab it now.

SLA KPL Dashboard Indicating Compliance Priority With KPI Ppt File Format PDF
This graph or chart is linked to excel, and changes automatically based on data. Just left click on it and select Edit Data. Showcasing this set of slides titled SLA KPL Dashboard Indicating Compliance Priority With KPI Ppt File Format PDF. The topics addressed in these templates are KPI Graph, Insights Here, SLA Compliance Priority. All the content presented in this PPT design is completely editable. Download it and make adjustments in color, background, font etc. as per your unique business setting.

Customer Relationship Management Tasks And Deals Status Dashboard Background PDF
This slide illustrates graphical representation of status report of tasks and deals related to CRM statistical data. It includes total deals graph, total tasks graph etc. Showcasing this set of slides titled Customer Relationship Management Tasks And Deals Status Dashboard Background PDF. The topics addressed in these templates are Invitation, Team Member, Customer Relationship Management. All the content presented in this PPT design is completely editable. Download it and make adjustments in color, background, font etc. as per your unique business setting.
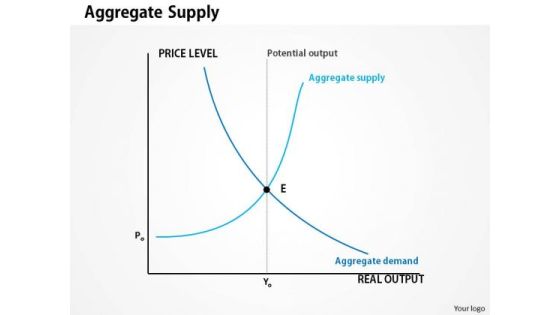
Business Framework Aggregate Supply PowerPoint Presentation
This diagram displays graph of aggregate supply. Aggregate supply is the total value of the goods and services produced. Use this diagram to present information in the visual manner.
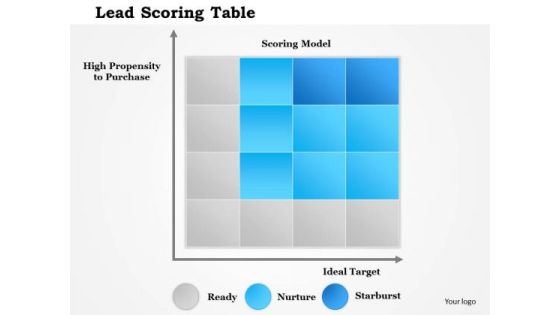
Business Framework Lead Scoring Table PowerPoint Presentation
A graph style cubical chart has been used to decorate this power point template slide. This PPT slide contains the concept of explaining score. Use this score table for displaying any data.
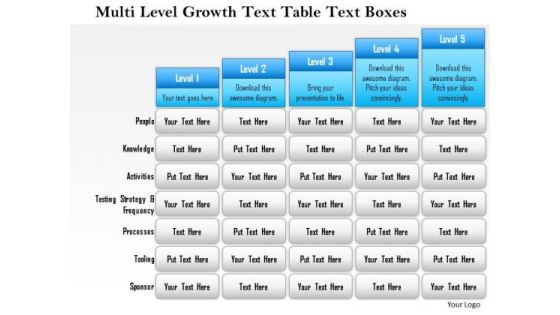
Business Framework Multi Level Growth Text Table Text Boxes 2 PowerPoint Presentation
Five staged text box style chart in bar graph design has been used to decorate this power point template slide. This diagram slide contains the multilevel growth concept. Use this PPT slide for financial growth and result analysis related topics.

Business Framework Solow Growth PowerPoint Presentation
This Power Point template slide has been designed with two level graph with multiple points. This PPT slide contains the Solow growth. Use this PPT template for business and finance related presentations.
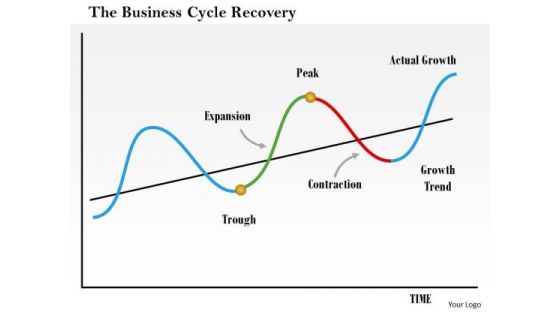
Business Framework The Business Cycle Recovery PowerPoint Presentation
A unidirectional process cycle graph has been used to crafted this Power Point template slide. This PPT slide contains the concept of recovery with high and low nodes. Use this PPT slide and build presentations for your business topics.
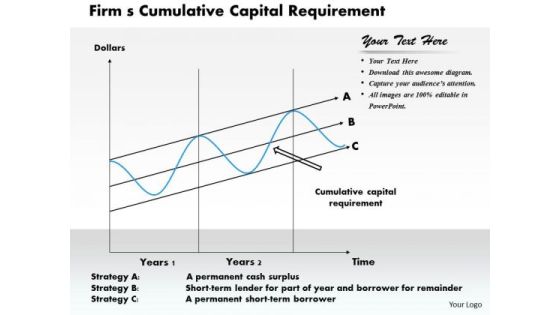
Business Framework Firm S Cumulative Capital Requirement PowerPoint Presentation
This business framework PPT has been crafted with graphic of graph with multiple stages. This PPT diagram contains the concept of firm s- cumulative capital requirements. Use this PPT diagram for your business and management related presentations.

Business Framework Battery Charge Loading Bar PowerPoint Presentation
This business diagram displays bar graph of five battery cells. This business slide contains the concept of business growth shown in multiple levels. Use this diagram to present and compare data in an impressive manner.
Green Arrows On Bars Vector Icon Ppt PowerPoint Presentation Infographic Template Templates Cpb
This is a green arrows on bars vector icon ppt powerpoint presentation infographic template templates cpb. This is a three stage process. The stages in this process are bar chart icon, bar graph icon, data chart icon.
Histogram Column Chart With Red Arrow Vector Icon Ppt PowerPoint Presentation Outline Ideas Cpb
This is a histogram column chart with red arrow vector icon ppt powerpoint presentation outline ideas cpb. This is a three stage process. The stages in this process are bar chart icon, bar graph icon, data chart icon.
Histogram Financial Analysis Vector Icon Ppt PowerPoint Presentation Layouts File Formats Cpb
This is a histogram financial analysis vector icon ppt powerpoint presentation layouts file formats cpb. This is a three stage process. The stages in this process are bar chart icon, bar graph icon, data chart icon.
Histogram Icon Showing Economic Fluctuations Ppt PowerPoint Presentation Slides Samples Cpb
This is a histogram icon showing economic fluctuations ppt powerpoint presentation slides samples cpb. This is a three stage process. The stages in this process are bar chart icon, bar graph icon, data chart icon.
Histogram Showing Business Trends Vector Icon Ppt PowerPoint Presentation Styles Portrait Cpb
This is a histogram showing business trends vector icon ppt powerpoint presentation styles portrait cpb. This is a three stage process. The stages in this process are bar chart icon, bar graph icon, data chart icon.
Histogram With Dollar For Financial Success Vector Icon Ppt PowerPoint Presentation Portfolio Example File Cpb
This is a histogram with dollar for financial success vector icon ppt powerpoint presentation portfolio example file cpb. This is a three stage process. The stages in this process are bar chart icon, bar graph icon, data chart icon.
Histogram With Gear Vector Icon Ppt PowerPoint Presentation Professional Slides Cpb
This is a histogram with gear vector icon ppt powerpoint presentation professional slides cpb. This is a three stage process. The stages in this process are bar chart icon, bar graph icon, data chart icon.
Three Bars For Financial Analysis Vector Icon Ppt PowerPoint Presentation Pictures Background Cpb
This is a three bars for financial analysis vector icon ppt powerpoint presentation pictures background cpb. This is a three stage process. The stages in this process are bar chart icon, bar graph icon, data chart icon.
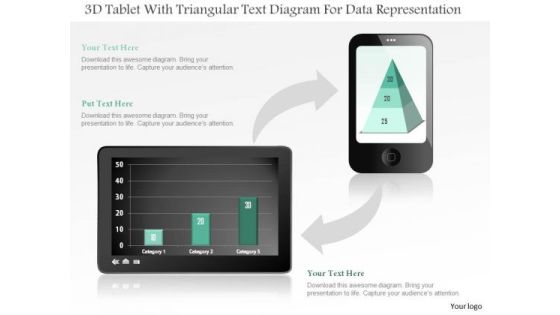
Business Diagram 3d Tablet With Triangular Text Diagram For Data Representation PowerPoint Slide
This business diagram displays bar graph on tablet and pyramid chart on mobile phone. Use this diagram, to make reports for interactive business presentations. Create professional presentations using this diagram.

Business Diagram Data Driven Pie Chart Inside The Magnifier PowerPoint Slide
This business slide displays 3d colorful pie graph with magnifier. This diagram is a data visualization tool that gives you a simple way to present statistical information. This slide helps your audience examine and interpret the data you present.
Business Diagram Human Icons With Bubbles And Different Icons Inside PowerPoint Slide
This diagram displays graph with percentage value growth. This business slide is suitable to present and compare business data. Use this diagram to build professional presentations for your viewers.

Business Diagram Four Steps With 3d Business Person Standing Over It PowerPoint Slide
This business diagram displays bar graph with business person standing on it. This Power Point template has been designed to display personal growth. You may use this diagram to impart professional appearance to your presentations.

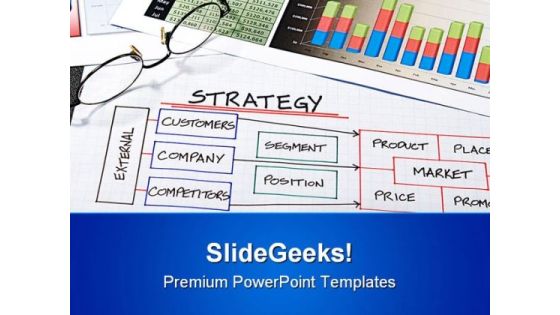
Planning Business PowerPoint Template 0910
Business charts and graphs for a successful corporation or company
Bus Chart Business PowerPoint Template 1010
Business strategy organizational charts and graphs for success
Pie Chart06 Business PowerPoint Templates And PowerPoint Backgrounds 0611
Microsoft PowerPoint Template and Background with business people and graphs

Pie Chart01 Business PowerPoint Templates And PowerPoint Backgrounds 1211
Microsoft PowerPoint Template and Background with pie graphs

Pie Chart Business PowerPoint Templates And PowerPoint Backgrounds 1211
Microsoft PowerPoint Template and Background with pie graphs
Pie Chart Growth 2012 Business PowerPoint Templates And PowerPoint Backgrounds 1211
Microsoft PowerPoint Template and Background with business pie graphs
Growth Ladder Success PowerPoint Templates And PowerPoint Themes 0512
Microsoft Powerpoint Templates and Background with color bar graph with ladder-Growth Ladder Success PowerPoint Templates And PowerPoint Themes 0512-These PowerPoint designs and slide layouts can be used for themes relating to -Growth ladder success, abstract, background, business, marketing, finance

Growth Business PowerPoint Templates And PowerPoint Themes 0512
Microsoft Powerpoint Templates and Background with color bar graph with ladder-These templates can be used for presentations relating to-Growth ladder success, abstract, ladder, business, marketing, finance-Growth Business PowerPoint Templates And PowerPoint Themes 0512
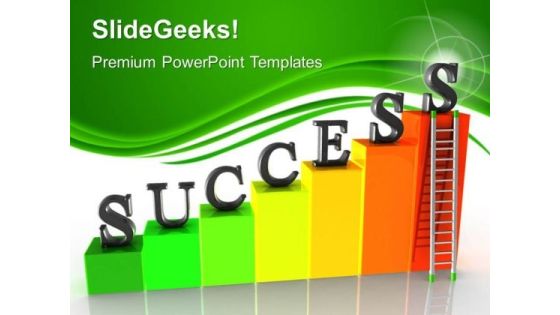
Growth Success PowerPoint Templates And PowerPoint Themes 0512
Microsoft Powerpoint Templates and Background with color bar graph with ladder-These templates can be used for presentations relating to-Growth ladder success, abstract, ladder, business, marketing, finance-Growth Success PowerPoint Templates And PowerPoint Themes 0512

0814 Bargraph Of Dollars Bundles With Arrow Graphic Image Graphics For PowerPoint
This unique image has backdrop of bar graph of dollars bundles with growth arrow. This image displays the concept of financial growth. Define the business growth with this suitable image. Use this image to make outstanding presentations
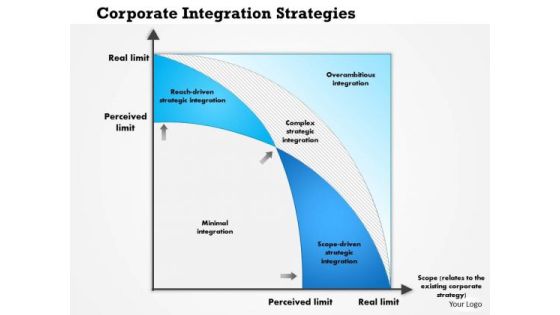
Business Framework Corporate Integration Strategies PowerPoint Presentation
This innovative image slide has been designed to display graph for corporate integration strategies. This business framework template may be used to display corporate strategy management in your presentations. This image slide will enhance the quality of your presentations.

Business Framework Portfolio Risk 01 PowerPoint Presentation
This business framework image slide displays portfolio risk graph PowerPoint template. Use this image slide, in your presentations to depict portfolio risk measures like number of stocks and returns. Make your presentations outshine using this image slide.
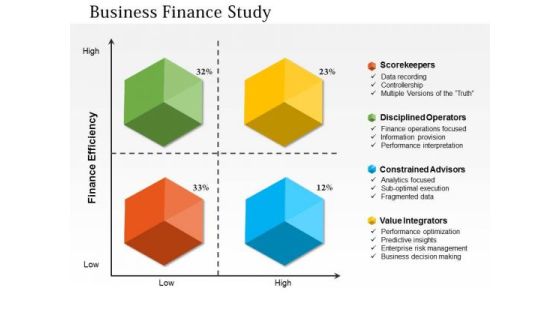
Business Diagram Business Finance Study PowerPoint Ppt Presentation
Our above slide displays business finance study diagram. It contains x-y graph of finance efficiency further divided into four sections. This diagram reflects finance efficiency depends on storekeepers, disciplined operators, constrained advisors and value integrators.
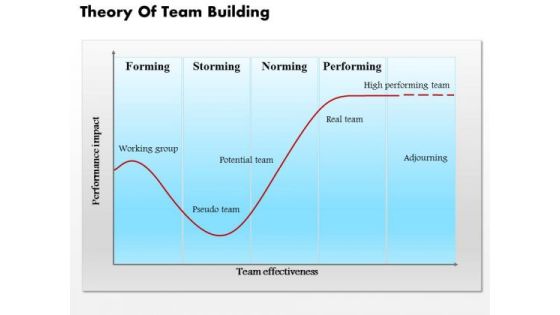
Business Diagram Theory Of Team Building PowerPoint Ppt Presentation
This slide depicts theory of tem building. It contains graph of performance impact and team effectiveness. It reflects steps of team building forming, storming, norming and performing. Download this awesome diagram to capture your audience
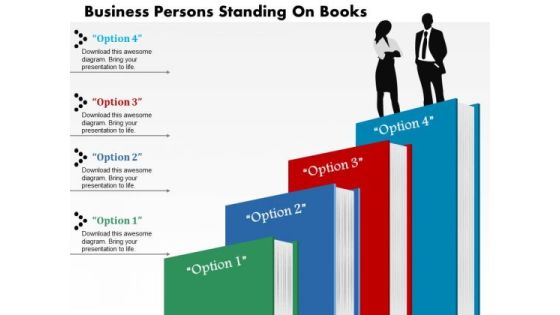
Business Diagram Persons Standing On Books Presentation Slide Template
This power point diagram template has been crafted with graphic of bar graph made with books and 3d man. This diagram template contains the concept of education and success. Use this diagram slide for your business and education presentation.
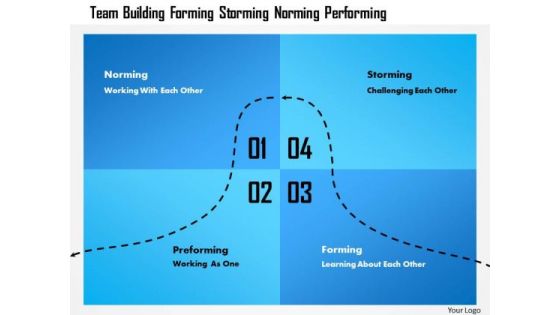
Business Framework Team Building Forming Storming Norming Performing PowerPoint Presentation
This slide depicts theory of team building. It contains graph of performance impact and team effectiveness. It reflects steps of team building forming, storming, norming and performing. Download this awesome diagram to capture your audiences attention.
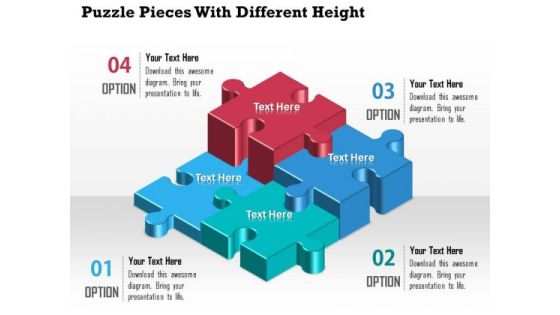
Business Diagram Puzzle Pieces With Different Height Presentation Template
A professional bar graph has been crafted with graphic of puzzles. All these puzzles are in different heights which shows the various levels of any data result representations. Use this diagram for your business result and data analysis related topics.
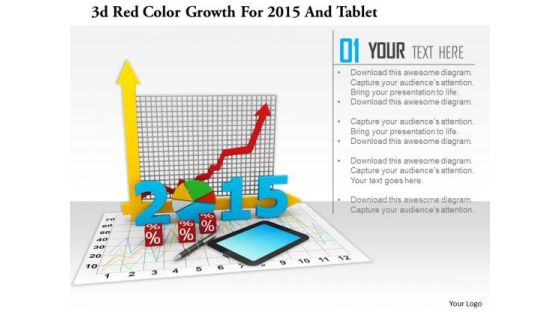
Stock Photo 3d Red Color Growth For 2015 And Tablet PowerPoint Slide
This image slide has graphics of financial charts and reports. This contains bar graph and pie chart to present business reports. Build an innovative presentation using this professional image slide.

Stock Photo 3d Us Map With Growth Arrow And Us Map PowerPoint Slide
This image displays American map with business graph in background. This image slide contains the concept of American economy, business growth and reports. Use this amazing slide to make professional presentations.
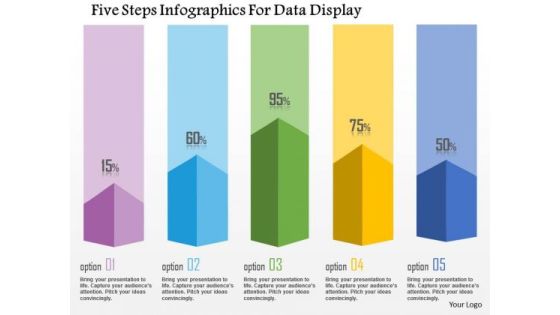
Business Diagram Five Steps Infographics For Data Display Presentation Template
This business diagram has been designed with graphic of five staged info graphics. This diagram can be used to display statistical information. Use this bar graph for your business and sales related presentations.
Globe With Bars And Business Icons Powerpoint Templates
Bar graph with globe for statistical analysis has been displayed in this business slide. This business diagram helps to exhibit global statistical analysis and research. Use this diagram to build an exclusive presentation.

About Us Companys Data Information Powerpoint Slides
Download this PowerPoint template to create an attention grabbing introductory slide. It contains slide bar graph with employee image. Use this professional slide design to build a good reputation of your company.

Bar Chart For Strategic Planning Powerpoint Slides
This PowerPoint template has been designed with bar graph with two teams. This diagram is useful to exhibit strategic planning. This diagram slide can be used to make impressive presentations.
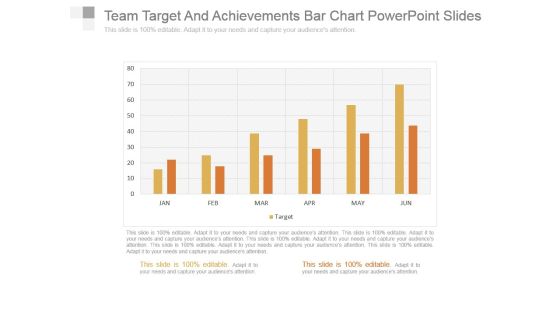
Team Target And Achievements Bar Chart Powerpoint Slides
This is a team target and achievements bar chart powerpoint slides. This is a six stage process. The stages in this process are business, success, graph chart, strategy, marketing.
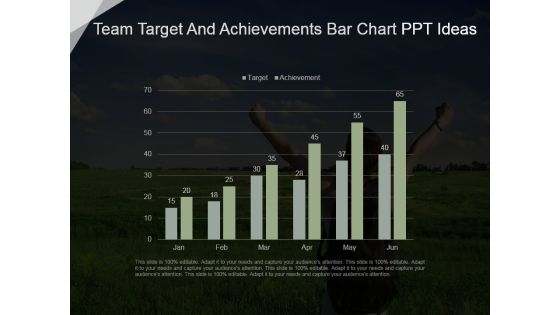
Team Target And Achievements Bar Chart Ppt Ideas
This is a team target and achievements bar chart ppt ideas. This is a six stage process. The stages in this process are business, marketing, graph chart, success, strategy.

Human Resources Planning Development Methods Ppt PowerPoint Presentation Complete Deck With Slides
This is a human resources planning development methods ppt powerpoint presentation complete deck with slides. This is a one stage process. The stages in this process are finance, data analysis, graph representation, planning, process.

Crm Planning And Implementation Procedures And Practices PPT PowerPoint Presentation Complete Deck With Slides
This is a crm planning and implementation procedures and practices ppt powerpoint presentation complete deck with slides. This is a one stage process. The stages in this process are finance, success, process, planning, graph analysis.

Data And Analytics Ppt PowerPoint Presentation Styles Outline
This is a data and analytics ppt powerpoint presentation styles outline. This is a ten stage process. The stages in this process are agile data science, graph analytics, journey sciences.

Data And Analytics Ppt PowerPoint Presentation Gallery Graphics Pictures
This is a data and analytics ppt powerpoint presentation gallery graphics pictures. This is a ten stage process. The stages in this process are graph analytics, journey sciences, augmented reality, hyper personalisation, behavioural analytics.
Data And Analytics Planning Ppt PowerPoint Presentation Model Icon
This is a data and analytics planning ppt powerpoint presentation model icon. This is a ten stage process. The stages in this process are graph analytics, journey sciences, augmented reality, hyper personalisation, behavioural analytics.

Business Marketing PowerPoint Templates Business Pyramid Stacked Column Chart Ppt Slides
Business Marketing PowerPoint Templates Business pyramid stacked column chart PPT Slides-This PowerPoint slide has a stacked pyramid chart that looks elegant because of the pyramid shape and the unique angle in which it appears. . This graph is data driven. Business Marketing PowerPoint Templates Business pyramid stacked column chart PPT Slides-This ppt can be used for concepts relating to-3d, 3d-Pie, Area, Bar, Block, Business, Chart, Color, Colour, Column, Cone, Decline, Fill, Finance, Financial, Gradient, Graph, etc.

Subordinated Loan Funding Funding And Valuation History Of The Company Ppt File Graphics Template PDF
The slide provides the graph of companys funding details. Graph includes he funding amount in dollar MM and the valuation of the company in Dollar MM after each funding round.Deliver and pitch your topic in the best possible manner with this subordinated loan funding funding and valuation history of the company ppt file graphics template pdf. Use them to share invaluable insights on funding and valuation history of the company. and impress your audience. This template can be altered and modified as per your expectations. So, grab it now.
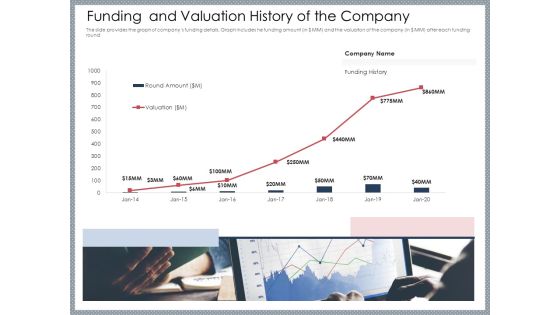
Mezzanine Venture Capital Funding Pitch Deck Funding And Valuation History Of The Company Microsoft PDF
The slide provides the graph of companys funding details. Graph includes he funding amount in MM and the valuation of the company in MM after each funding round. Deliver and pitch your topic in the best possible manner with this mezzanine venture capital funding pitch deck funding and valuation history of the company microsoft pdf. Use them to share invaluable insights on company, history, funding, valuation and impress your audience. This template can be altered and modified as per your expectations. So, grab it now.

Post COVID Recovery Strategy Oil Gas Industry Crude Oil Price Recovery After COVID Crises Guidelines PDF
This slide covers the crude oil price recovery which will takes place as a U-shaped recovery along with the graph and key insights of the graph which will showcase the WTI oil details. Deliver and pitch your topic in the best possible manner with this post covid recovery strategy oil gas industry crude oil price recovery after covid crises guidelines pdf. Use them to share invaluable insights on global, growth, price and impress your audience. This template can be altered and modified as per your expectations. So, grab it now.

Hybrid Investment Pitch Deck Funding And Valuation History Of The Company Ppt Slides Deck PDF
The slide provides the graph of companys funding details. Graph includes he funding amount in MM and the valuation of the company in MM after each funding round. Deliver an awe inspiring pitch with this creative hybrid investment pitch deck funding and valuation history of the company ppt slides deck pdf bundle. Topics like funding and valuation history of the company can be discussed with this completely editable template. It is available for immediate download depending on the needs and requirements of the user.
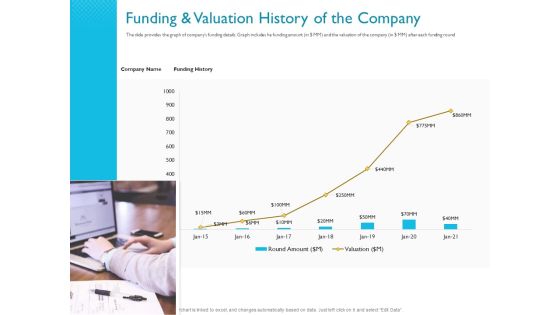
Investor Funding Deck For Hybrid Financing Funding And Valuation History Of The Company Ppt Styles Brochure PDF
The slide provides the graph of companys funding details. Graph includes he funding amount in dollar MM and the valuation of the company in dollar MM after each funding round. Deliver and pitch your topic in the best possible manner with this investor funding deck for hybrid financing funding and valuation history of the company ppt styles brochure pdf. Use them to share invaluable insights on round amount, valuation, funding history and impress your audience. This template can be altered and modified as per your expectations. So, grab it now.
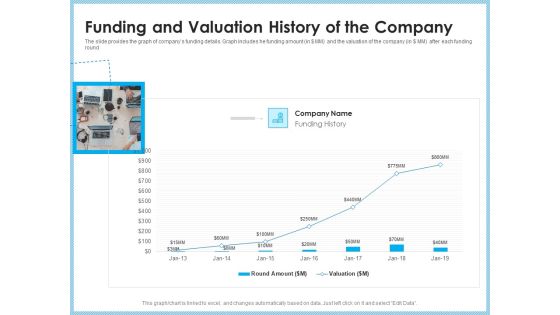
Investment Pitch To Generating Capital From Mezzanine Credit Funding And Valuation History Of The Company Rules PDF
The slide provides the graph of companys funding details. Graph includes he funding amount in dollar MM and the valuation of the company in dollar MM after each funding round. Deliver and pitch your topic in the best possible manner with this investment pitch to generating capital from mezzanine credit funding and valuation history of the company rules pdf. Use them to share invaluable insights on round amount, valuation and impress your audience. This template can be altered and modified as per your expectations. So, grab it now.

Investor Pitch Deck To Collect Capital From Subordinated Loan Funding And Valuation History Of The Company Template PDF
The slide provides the graph of companys funding details. Graph includes he funding amount in dollar MM and the valuation of the company in dollar MM after each funding round. Deliver an awe-inspiring pitch with this creative investor pitch deck to collect capital from subordinated loan funding and valuation history of the company template pdf bundle. Topics like funding history, round amount, valuation can be discussed with this completely editable template. It is available for immediate download depending on the needs and requirements of the user.
Funding And Valuation History Of The Company Ppt Icon Show PDF
The slide provides the graph of companys funding details. Graph includes he funding amount in dollar MM and the valuation of the company in dollar MM after each funding round. Deliver and pitch your topic in the best possible manner with this funding and valuation history of the company ppt icon show pdf. Use them to share invaluable insights on funding and valuation history of the company and impress your audience. This template can be altered and modified as per your expectations. So, grab it now.
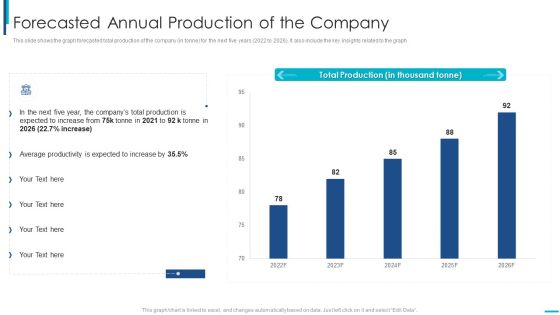
Skill Development Training To Strengthen Employee Performance Forecasted Annual Production Of The Company Brochure PDF
This slide shows the graph forecasted total production of the company in tonne for the next five years 2022 to 2026, It also include the key insights related to the graph. Deliver an awe inspiring pitch with this creative skill development training to strengthen employee performance forecasted annual production of the company brochure pdf bundle. Topics like forecasted annual production of the company can be discussed with this completely editable template. It is available for immediate download depending on the needs and requirements of the user.

Upskill Training For Employee Performance Improvement Forecasted Annual Production Of The Company Formats PDF
This slide shows the graph forecasted total production of the company in tonne for the next five years 2022 to 2026, It also include the key insights related to the graph. Deliver an awe inspiring pitch with this creative upskill training for employee performance improvement forecasted annual production of the company formats pdf bundle. Topics like forecasted annual production of the company can be discussed with this completely editable template. It is available for immediate download depending on the needs and requirements of the user.

Performance Training Action Plan And Extensive Strategies Forecasted Annual Production Of The Company Demonstration PDF
This slide shows the graph forecasted total production of the company in tonne for the next five years 2022 to 2026, It also include the key insights related to the graph Deliver and pitch your topic in the best possible manner with this performance training action plan and extensive strategies forecasted annual production of the company demonstration pdf Use them to share invaluable insights on forecasted annual production of the company and impress your audience. This template can be altered and modified as per your expectations. So, grab it now.

Inventory Turnover Financial Ratios Chart Conversion Portrait PDF
This slide illustrates graph for inventory turnover ratio that can help company to analyze efficiency of inventory management. It showcases ratio graph comparison of 4 companies for a period of last 6 years Pitch your topic with ease and precision using this inventory turnover financial ratios chart conversion portrait pdf. This layout presents information on inventory turnover financial ratios chart conversion. It is also available for immediate download and adjustment. So, changes can be made in the color, design, graphics or any other component to create a unique layout.

Professional Scrum Master Certification Percent Change In Workplace Productivity Post Adoption Infographics PDF
Following slide illustrates informational stats about percent change in workplace productivity post agile methodology adaption. Here the graph indicates that workplace productivity gets decreased by 1.6 percent. Deliver and pitch your topic in the best possible manner with this professional scrum master certification percent change in workplace productivity post adoption infographics pdf. Use them to share invaluable insights on workplace productivity, 2017 to 2022, graph indicates and impress your audience. This template can be altered and modified as per your expectations. So, grab it now.
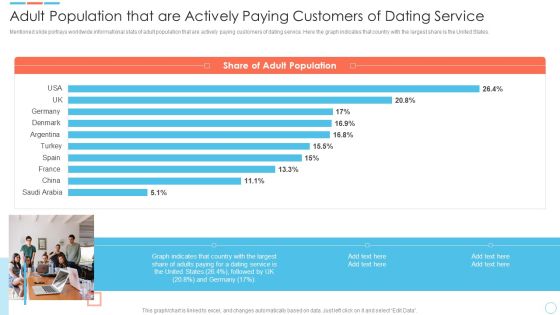
Elevator Online Dating Software Adult Population That Are Actively Paying Customers Guidelines PDF
Mentioned slide portrays worldwide informational stats of adult population that are actively paying customers of dating service. Here the graph indicates that country with the largest share is the United States. Deliver an awe inspiring pitch with this creative Elevator Online Dating Software Adult Population That Are Actively Paying Customers Guidelines PDF bundle. Topics like Share Adult Population, Graph indicates, Customers can be discussed with this completely editable template. It is available for immediate download depending on the needs and requirements of the user.
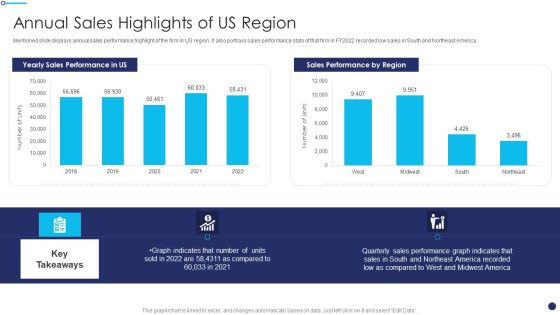
Effective Sales Technique For New Product Launch Annual Sales Highlights Of US Region Inspiration PDF
Mentioned slide displays annual sales performance highlight of the firm in US region. It also portrays sales performance stats of that firm in FY2022 recorded low sales in South and Northeast America. Deliver an awe inspiring pitch with this creative Effective Sales Technique For New Product Launch Annual Sales Highlights Of US Region Inspiration PDF bundle. Topics like Sales Performance, Graph Indicates, Performance Graph can be discussed with this completely editable template. It is available for immediate download depending on the needs and requirements of the user.

Evaluating Survival Rate Of Startups Funded By Angel Investor Mockup PDF
This slide showcases graphs that can help organization evaluate the survival rate of startups that raised capital through angel investors. It showcases graph of startup survival rates and survival rate of business by industry Deliver and pitch your topic in the best possible manner with this Evaluating Survival Rate Of Startups Funded By Angel Investor Mockup PDF. Use them to share invaluable insights on Survival Rate, Service, Angel Investors and impress your audience. This template can be altered and modified as per your expectations. So, grab it now.
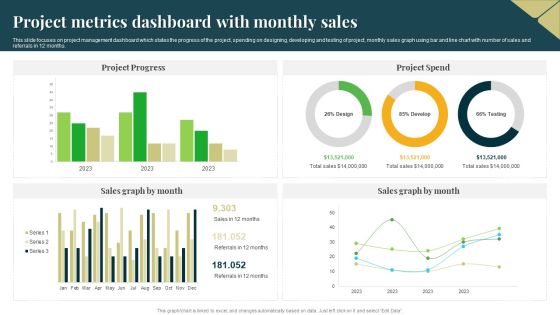
Project Metrics Dashboard With Monthly Sales Professional PDF
This slide focuses on project management dashboard which states the progress of the project, spending on designing, developing and testing of project, monthly sales graph using bar and line chart with number of sales and referrals in 12 months. Pitch your topic with ease and precision using this Project Metrics Dashboard With Monthly Sales Professional PDF. This layout presents information on Project Progress, Project Spend, Sales Graph. It is also available for immediate download and adjustment. So, changes can be made in the color, design, graphics or any other component to create a unique layout.
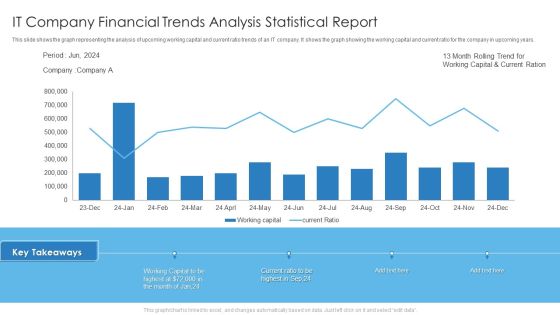
IT Company Financial Trends Analysis Statistical Report Slides PDF
This slide shows the graph representing the analysis of upcoming working capital and current ratio trends of an IT company. It shows the graph showing the working capital and current ratio for the company in upcoming years. Deliver and pitch your topic in the best possible manner with this IT Company Financial Trends Analysis Statistical Report Slides PDF. Use them to share invaluable insights on It Company Financial, Trends Analysis Statistical Report and impress your audience. This template can be altered and modified as per your expectations. So, grab it now.

Business Profitability And Growth Dashboard For Capital Fundraising Ppt Slides Guide PDF
This slide illustrates graphical representation of company growth journey for investors. It includes profitability graph of 15 years, cash usage pie-chart, and share performance line graph. Showcasing this set of slides titled Business Profitability And Growth Dashboard For Capital Fundraising Ppt Slides Guide PDF. The topics addressed in these templates are Judicious Cash Usage, Share Performance, Respect To Benchmark. All the content presented in this PPT design is completely editable. Download it and make adjustments in color, background, font etc. as per your unique business setting.
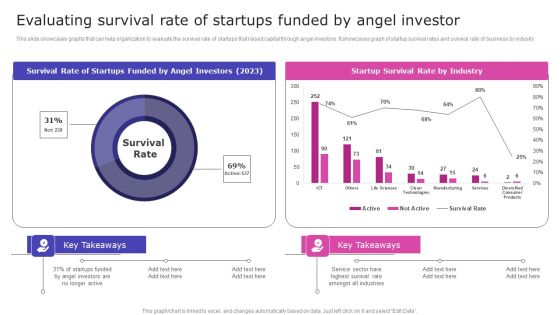
Evaluating Survival Rate Of Startups Funded By Angel Investor Microsoft PDF
This slide showcases graphs that can help organization to evaluate the survival rate of startups that raised capital through angel investors. It showcases graph of startup survival rates and survival rate of business by industry. Boost your pitch with our creative Evaluating Survival Rate Of Startups Funded By Angel Investor Microsoft PDF. Deliver an awe-inspiring pitch that will mesmerize everyone. Using these presentation templates you will surely catch everyones attention. You can browse the ppts collection on our website. We have researchers who are experts at creating the right content for the templates. So you do not have to invest time in any additional work. Just grab the template now and use them.
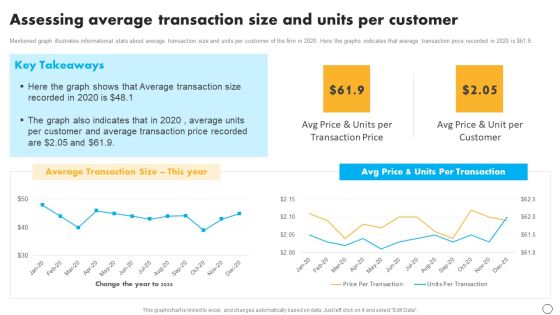
Retail Business Optimization Through Operational Excellence Strategy Assessing Average Transaction Size Microsoft PDF
Mentioned graph illustrates informational stats about average transaction size and units per customer of the firm in 2020. Here the graphs indicates that average transaction price recorded in 2020 is doller 61.9. Want to ace your presentation in front of a live audience Our Retail Business Optimization Through Operational Excellence Strategy Assessing Average Transaction Size Microsoft PDF can help you do that by engaging all the users towards you. Slidegeeks experts have put their efforts and expertise into creating these impeccable powerpoint presentations so that you can communicate your ideas clearly. Moreover, all the templates are customizable, and easy to edit and downloadable. Use these for both personal and commercial use.

Evaluating Failure Rate Of Equity Crowdfunding Mockup PDF
This slide showcases graph that can help organization to evaluate failure rate of previously crowdfunded companies. It illustrated graph that shows failure rate at seed stage for a period of last 4 financial years. Boost your pitch with our creative Evaluating Failure Rate Of Equity Crowdfunding Mockup PDF. Deliver an awe inspiring pitch that will mesmerize everyone. Using these presentation templates you will surely catch everyones attention. You can browse the ppts collection on our website. We have researchers who are experts at creating the right content for the templates. So you do not have to invest time in any additional work. Just grab the template now and use them.
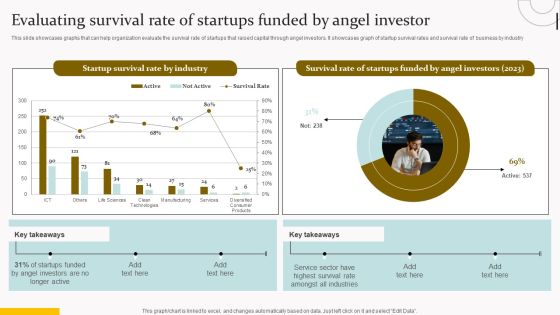
Evaluating Survival Rate Of Startups Funded By Angel Investor Topics PDF
This slide showcases graphs that can help organization evaluate the survival rate of startups that raised capital through angel investors. It showcases graph of startup survival rates and survival rate of business by industry. Want to ace your presentation in front of a live audience Our Evaluating Survival Rate Of Startups Funded By Angel Investor Topics PDF can help you do that by engaging all the users towards you. Slidegeeks experts have put their efforts and expertise into creating these impeccable powerpoint presentations so that you can communicate your ideas clearly. Moreover, all the templates are customizable, and easy to edit and downloadable. Use these for both personal and commercial use.
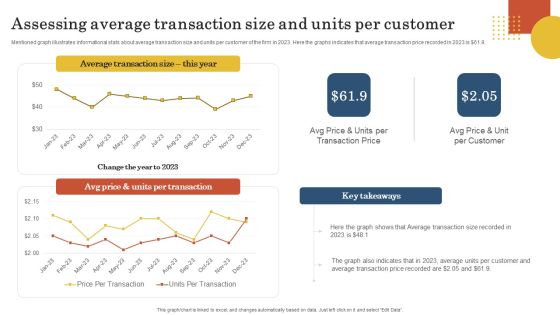
Retail Business Operation Management To Optimize Customer Experience Assessing Average Transaction Size Information PDF
Mentioned graph illustrates informational stats about average transaction size and units per customer of the firm in 2023. Here the graphs indicates that average transaction price recorded in 2023 is 61.9. There are so many reasons you need a Retail Business Operation Management To Optimize Customer Experience Assessing Average Transaction Size Information PDF. The first reason is you cannot spend time making everything from scratch, Thus, Slidegeeks has made presentation templates for you too. You can easily download these templates from our website easily.

MRR Evaluation For Cloud Based Business Model Slides PDF
The slide inculcates the evaluation of SaaS business growth rate with the help of MRR analysis. Various elements included in the slide are monthly recurring revenue stats, MRR growth rate graph and key takeaways. Showcasing this set of slides titled MRR Evaluation For Cloud Based Business Model Slides PDF. The topics addressed in these templates are Total Predictable Revenues, Saas Business Model, Growth Graph, Business Growth. All the content presented in this PPT design is completely editable. Download it and make adjustments in color, background, font etc. as per your unique business setting.

Comparing LTIP And Expenses Of Executive Employee Attrition Template PDF
This slide represents a graph comparing the cost of establishing a long-term incentive plan vs incurring the cost of losing an executive that enable organizations to analyse the benefit of implementing LTIP plan. It includes key insights, graph. Showcasing this set of slides titled Comparing LTIP And Expenses Of Executive Employee Attrition Template PDF. The topics addressed in these templates are Comparing LTIP And Expenses, Executive Employee Attrition. All the content presented in this PPT design is completely editable. Download it and make adjustments in color, background, font etc. as per your unique business setting.
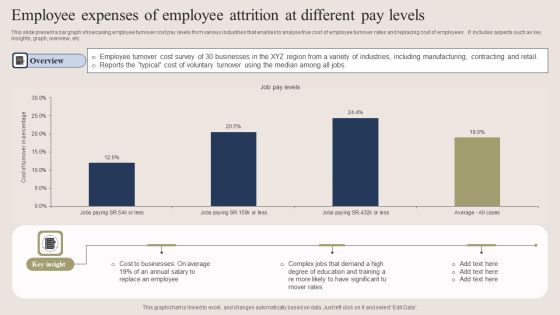
Employee Expenses Of Employee Attrition At Different Pay Levels Formats PDF
This slide present a bar graph showcasing employee turnover cost pay levels from various industries that enables to analyse true cost of employee turnover rates and replacing cost of employees . It includes aspects such as key insights, graph, overview, etc. Showcasing this set of slides titled Employee Expenses Of Employee Attrition At Different Pay Levels Formats PDF. The topics addressed in these templates are Cost To Businesses, Average, Employee. All the content presented in this PPT design is completely editable. Download it and make adjustments in color, background, font etc. as per your unique business setting.
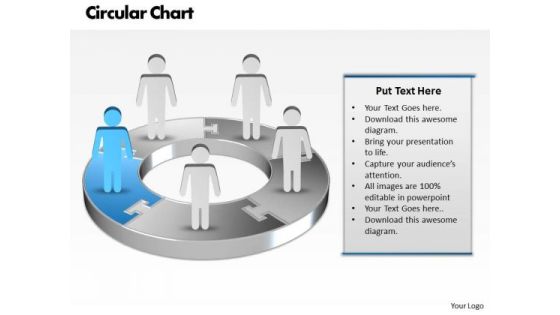
Ppt Blue Men Standing On Business Pie Organization Chart PowerPoint Template Templates
PPT blue men standing on business pie organization chart powerpoint template Templates-Use this Business based PowerPoint Diagram to represent the Business issues Graphically. It indicates arrange, block out, blueprint, cast, delineate, design, devise, draft, graph , lay out, outline, plot, project, shape, sketch etc.-PPT blue men standing on business pie organization chart powerpoint template Templates-arrow, art, basic, blank, business, capital, chart, chevron, clip, clipart, colorful, conglomerates, consumer, copy, cyclical, energy, financial, flow, goods, graph, graphic, healthcare, illustration, infographic, information, investment, isolated, market, materials, non, round, sectors, services, slide, space, stock, technology, text,

Company Sales And Performance Dashboard Ppt PowerPoint Presentation Inspiration Gallery
Presenting this set of slides with name company sales and performance dashboard ppt powerpoint presentation inspiration gallery. The topics discussed in these slides are month growth in revenue, product sales, profit margins graph . This is a completely editable PowerPoint presentation and is available for immediate download. Download now and impress your audience.

Strategic Plan For Business Expansion And Growth Training Budget Guidelines PDF
This graph provided in this slide highlights the training required and the training budget allocated to them. Deliver an awe inspiring pitch with this creative strategic plan for business expansion and growth training budget guidelines pdf bundle. Topics like development, management can be discussed with this completely editable template. It is available for immediate download depending on the needs and requirements of the user.

Historical And Forecasted Revenue Of The Company Ppt Pictures Graphics PDF
this slide shows the revenue graph of previous, current and forecasted year. Deliver an awe-inspiring pitch with this creative historical and forecasted revenue of the company ppt pictures graphics pdf bundle. Topics like historical and forecasted revenue of the company can be discussed with this completely editable template. It is available for immediate download depending on the needs and requirements of the user.

Analytical Incrementalism Monthly Financial Analysis Of Our Company Slides PDF
The graph provides a glimpse of the companys revenue, operating profit and productivity for 12 months. Deliver an awe-inspiring pitch with this creative analytical incrementalism monthly financial analysis of our company slides pdf bundle. Topics like operating profit, productivity, revenue can be discussed with this completely editable template. It is available for immediate download depending on the needs and requirements of the user.

Investor Pitch Deck To Generate Capital From Initial Currency Offering Why This Is The Right Time To Enter Market Microsoft PDF
The slide provides the graph of number of online money transactions and financials exclusion rate from the year 2000 to 2021.Deliver and pitch your topic in the best possible manner with this investor pitch deck to generate capital from initial currency offering why this is the right time
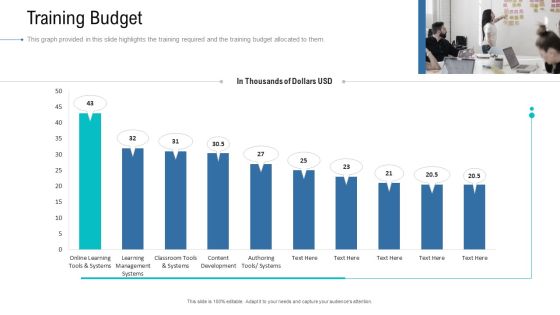
Organizational Development And Promotional Plan Training Budget Pictures PDF
This graph provided in this slide highlights the training required and the training budget allocated to them. Deliver an awe inspiring pitch with this creative organizational development and promotional plan training budget pictures pdf bundle. Topics like development, management can be discussed with this completely editable template. It is available for immediate download depending on the needs and requirements of the user.

Automate Customer Relationship Management Agile Crm Software Dashboard Information PDF
Deliver and pitch your topic in the best possible manner with this automate customer relationship management agile crm software dashboard information pdf. Use them to share invaluable insights on my deals funnel, revenue graph and impress your audience. This template can be altered and modified as per your expectations. So, grab it now.
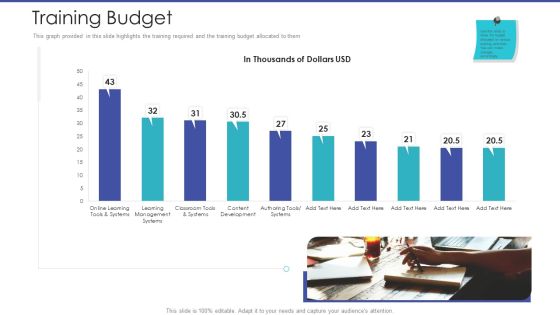
Tactical Planning For Marketing And Commercial Advancement Training Budget Elements PDF
This graph provided in this slide highlights the training required and the training budget allocated to them. Deliver an awe inspiring pitch with this creative tactical planning for marketing and commercial advancement training budget elements pdf bundle. Topics like development, management can be discussed with this completely editable template. It is available for immediate download depending on the needs and requirements of the user.

Comprehensive Business Digitization Deck Company Spending On New Technologies Mockup PDF
This graph covers the companys investments in new technologies to accelerate growth and productivity. Deliver an awe inspiring pitch with this creative comprehensive business digitization deck company spending on new technologies mockup pdf bundle. Topics like company spending on new technologies can be discussed with this completely editable template. It is available for immediate download depending on the needs and requirements of the user.
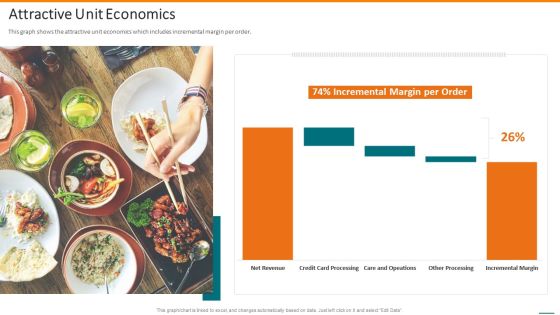
Grubhub Fund Raising Elevator Attractive Unit Economics Professional PDF
This graph shows the attractive unit economics which includes incremental margin per order. Deliver an awe inspiring pitch with this creative grubhub fund raising elevator attractive unit economics professional pdf bundle. Topics like attractive unit economics can be discussed with this completely editable template. It is available for immediate download depending on the needs and requirements of the user.

Accelerate Online Journey Now Company Spending On New Technologies Download PDF
This graph covers the companys investments in new technologies to accelerate growth and productivity. Deliver an awe inspiring pitch with this creative Accelerate Online Journey Now Company Spending On New Technologies Download PDF bundle. Topics like Company Spending, New Technologies can be discussed with this completely editable template. It is available for immediate download depending on the needs and requirements of the user.

Organization Reinvention Company Financial Performance Information PDF
This graph depicts the financial performance of the company wherein revenues, expenses and profit are evaluated. Deliver and pitch your topic in the best possible manner with this Organization Reinvention Company Financial Performance Information PDF. Use them to share invaluable insights on Expenses, Profit, Revenues and impress your audience. This template can be altered and modified as per your expectations. So, grab it now.

Organization Reinvention Company Spending On New Technologies Microsoft PDF
This graph covers the companys investments in new technologies to accelerate growth and productivity. Deliver an awe inspiring pitch with this creative Organization Reinvention Company Spending On New Technologies Microsoft PDF bundle. Topics like Social, Technologies, Cyber Security can be discussed with this completely editable template. It is available for immediate download depending on the needs and requirements of the user.

Analysis Of Cleanliness At Retail Store Retail Outlet Performance Assessment Inspiration PDF
This slide illustrates the graph to showcase visitors responses towards the cleanliness of multiple store areas such as floor, display counters, try rooms etc.Deliver an awe inspiring pitch with this creative xxxxxxxxxxxxx bundle. Topics like xxxxxxxxxxxxxxxxxxxxxxxxxxxxx can be discussed with this completely editable template. It is available for immediate download depending on the needs and requirements of the user.

E Business Finance Computer Profit PowerPoint Templates And PowerPoint Themes 1012
E Business Finance Computer Profit PowerPoint Templates And PowerPoint Themes 1012-Create visually stunning and define your PPT Presentations in a unique and inspiring manner using our above template which contains a graphic of pc with business or profits growth bar graph. This image has been professionally designed to emphasize the business concept. Present your views using our innovative slides and be assured of leaving a lasting impression. This image has been conceived to enable you to emphatically communicate your ideas in your Global Business PPT presentations.-E Business Finance Computer Profit PowerPoint Templates And PowerPoint Themes 1012-This PowerPoint template can be used for presentations relating to-Business graph with arrow, technology, computer, business, finance, arrows
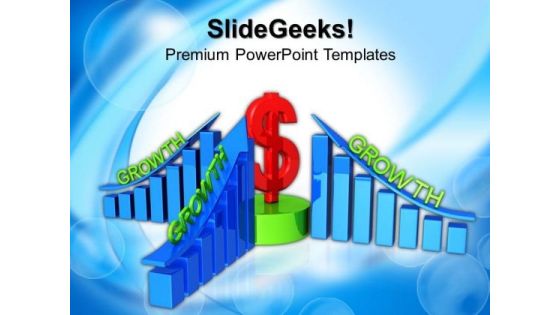
Business Profits Growth PowerPoint Templates And PowerPoint Themes 1012
Business Profits Growth PowerPoint Templates And PowerPoint Themes 1012-The above template displays a diagram of profit and growth bar graph with dollar in center. This image represents the business concept. Use this template for presentations on growth of indicators, growth of indices, rise up, business development, evaluative reports, ratings, graphs, economy, rate of exchange, market review etc. Adjust the above image in your PPT presentations to visually support your content in your Business and Marketing PPT slideshows. Deliver amazing presentations to mesmerize your audience.-Business Profits Growth PowerPoint Templates And PowerPoint Themes 1012-This PowerPoint template can be used for presentations relating to-Business profits growth, business, finance, success, money, marketing

Increase In Profit Business PowerPoint Templates And PowerPoint Themes 1012
Increase In Profit Business PowerPoint Templates And PowerPoint Themes 1012-Use this template containing a blue bar graph with years in staircase manner showing increase in profits yearly to highlight the key issues of your presentation. The development in business is due to working in team and leadership. This image has been conceived to enable you to emphatically communicate your ideas in your Business and Teamwork PPT presentations. Create captivating presentations to deliver comparative and weighted arguments.-Increase In Profit Business PowerPoint Templates And PowerPoint Themes 1012-This PowerPoint template can be used for presentations relating to-Chart graph profit increase, finance, success, marketing, business, communication

Concept Of Ontology In The Semantic Web Is The Use Of Semantic Search Growing Introduction PDF
This slide talks about the growing applications of semantic search in recent years. Semantic search is gaining popularity because of the increased graph processing and graph DBMS applications that require faster data preparation and more complicated and adaptable data science. There are so many reasons you need a Concept Of Ontology In The Semantic Web Is The Use Of Semantic Search Growing Introduction PDF. The first reason is you can not spend time making everything from scratch, Thus, Slidegeeks has made presentation templates for you too. You can easily download these templates from our website easily.

Total Job Applications Received And Processed One Pager Documents
This page covers the graphs of stats related to recruitment processes in 2020-2021. It provides the graph of total job applications received OR processed, total job positing and average number of applications etc. Presenting you a fantastic Total Job Applications Received And Processed One Pager Documents. This piece is crafted on hours of research and professional design efforts to ensure you have the best resource. It is completely editable and its design allow you to rehash its elements to suit your needs. Get this Total Job Applications Received And Processed One Pager Documents A4 One-pager now.

Software Architecture Microservices Platform Ppt PowerPoint Presentation Infographic Template Show
Presenting this set of slides with name software architecture microservices platform ppt powerpoint presentation infographic template show. The topics discussed in these slides are relational db, key, value store, graph db. This is a completely editable PowerPoint presentation and is available for immediate download. Download now and impress your audience.

Business Framework Bull Whip Effect Supply Chain PowerPoint Presentation
This power point diagram slide has been crafted with bullwhip effect. To display this effect we have used graph of each state and vertical flow chart for supply chain management. Use this PPT slide in your supply chain management related presentations.
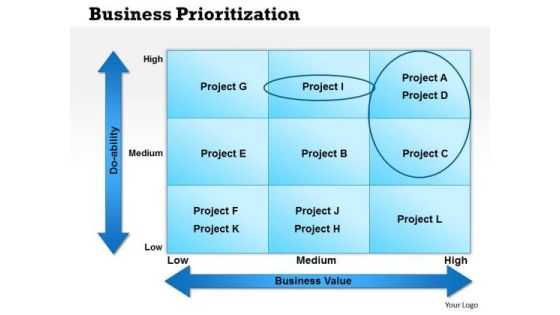
Business Framework Business Prioritization PowerPoint Presentation
This Business framework Pot has been crafted with graphic of square graph and two axial chart. This graphic diagram explains the concept of do ability with high, low and medium states in reference with business value. Use this simple business priotization diagram Pot in your business project related presentation and get noticed.
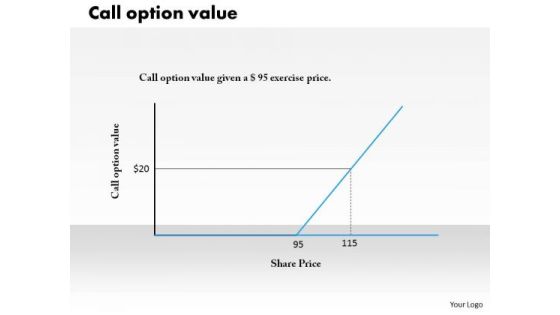
Business Framework Call Option Value PowerPoint Presentation
Explain the call option value in any business presentation with this PPT slide. This PPT slide has been crafted with graphic of call option value graph which is important calculation for growth analysis. Use this PPT and build strong presentation for growth analysis.

Business Framework Capital Structure PowerPoint Presentation
This PPT slide has been designed with graph of capital structure. Capital structure is nothing but a mix of any company's long term debt, short term debt and common equity with preferred equity. Use this structure to understand the decision management of that company. Use this PPT and give a clear picture of capital structure.

Business Framework Technology Adoption Curve PowerPoint Presentation
This business diagram displays framework of technology adoption curve. It contains curved graph of adoption gap depicting percentage ratio of innovators, early adopter, early majority, late majority and laggards. This diagram enables the users to create their own display of the required processes in an easy way.

Monthly Expenses Investment PowerPoint Template 0510
Office desk aranged in studio. A lot of numbers and graphs

Business Success Future PowerPoint Template 1110
Office desk aranged in studio. A lot of numbers and graphs

Planning Business PowerPoint Background And Template 1210
Microsoft PowerPoint Template and Background with Business charts and graphs for a successful corporation or company
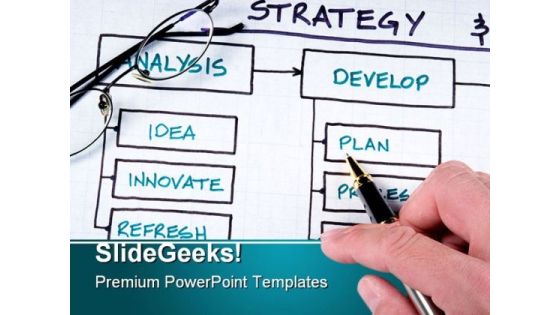
Strategy01 Business PowerPoint Background And Template 1210
Microsoft PowerPoint Template and Background with Organizational & Planning charts & business graphs
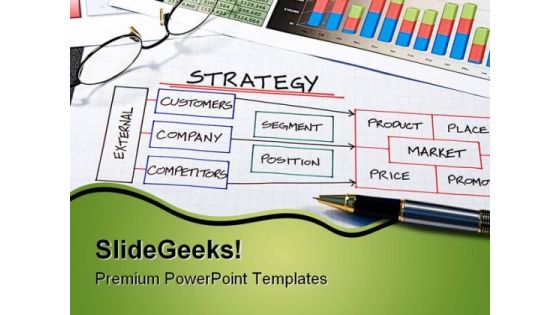
Strategy Business PowerPoint Background And Template 1210
Microsoft PowerPoint Template and Background with Business strategy organizational charts and graphs for success

Recovering From Crisis Business PowerPoint Templates And PowerPoint Backgrounds 0211
Microsoft PowerPoint Template and Background with graphs and charts showing recovering from the crisis
Business Failure And Growth Metaphor PowerPoint Templates And PowerPoint Backgrounds 0511
Microsoft PowerPoint Template and Background with business failure and growth graphs and arrows

Up Arrow Dollar Finance PowerPoint Templates And PowerPoint Backgrounds 0611
Microsoft PowerPoint Template and Background with dollar on the increase against financial graphs

Business Chart Marketing PowerPoint Templates And PowerPoint Backgrounds 1011
Microsoft PowerPoint Template and Background with business strategy organizational charts and graphs for success
Business Failure And Growth Metaphor PowerPoint Themes And PowerPoint Slides 0511
Microsoft PowerPoint Theme and Slide with business failure and growth graphs and arrows

Business Concept Background PowerPoint Templates And PowerPoint Backgrounds 1211
Microsoft PowerPoint Template and Background with abstract bar graphs with world map
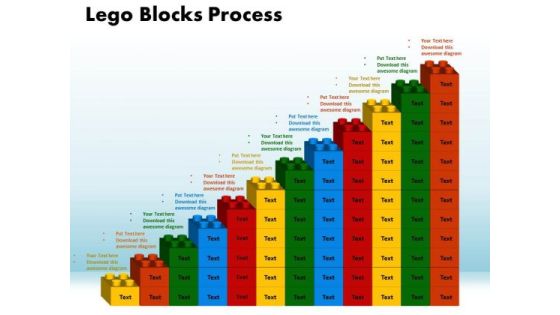
PowerPoint Process Lego Blocks Process Success Ppt Slides
PowerPoint Process Lego Blocks Process Success PPT Slides-This Business PowerPoint diagram consists of bar Graph of Lego blocks which is monotonically increasing. It refers to the Financial Growth of the Business. It Portrays the concept of Construction, Manufacturing, Design, Retail Market and Business Consultants.-PowerPoint Process Lego Blocks Process Success PPT Slides
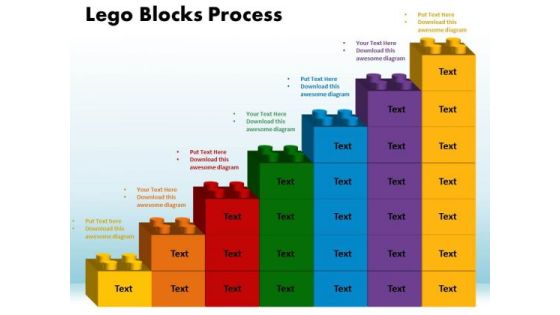
PowerPoint Template Lego Blocks Process Business Ppt Template
PowerPoint Template Lego Blocks Process Business PPT template-This PowerPoint diagram Consists of Lego Bar Graph which is Monotonically Increasing. Lego is a children's toy used for building models with small colorful plastic bricks that fit together and come apart again. It signifies action figure, balloon, beanbag, brick, building block, cap, catapult, Dinky Toy, dollhouse, doll

PowerPoint Template Lego Blocks Process Business Ppt Themes
PowerPoint Template Lego Blocks Process Business PPT Themes-Use This Lego Bar Graph which is Monotonically Increasing. This PowerPoint diagram imitates children's toy used for building models with small colorful plastic bricks that fit together and come apart again.-PowerPoint Template Lego Blocks Process Business PPT Themes
Blue And Gray Bars Business PowerPoint Templates And PowerPoint Themes 1012
This template with an image of bar graph showing success helps you chart the course of your presentation. Adjust the above image in your PPT presentations to visually support your content in your Business PPT slideshows financial reports, growth rates, global business etc. Deliver amazing presentations to mesmerize your audience.
 Home
Home