Devops Kpi
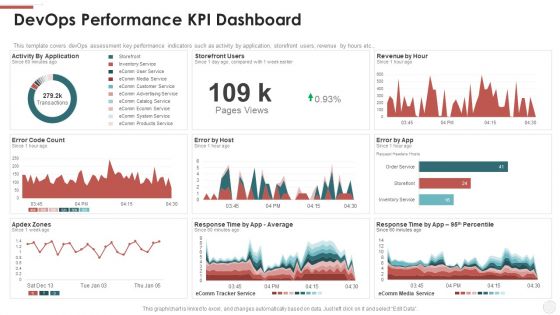
Devops Performance KPI Dashboard Ppt File Example Topics PDF
This template covers devOps assessment key performance indicators such as activity by application, storefront users, revenue by hours etc. Deliver and pitch your topic in the best possible manner with this devops performance kpi dashboard ppt file example topics pdf. Use them to share invaluable insights on revenue, application and impress your audience. This template can be altered and modified as per your expectations. So, grab it now.
Development And Operations KPI Dashboard IT Devops Performance KPI Dashboard Icons PDF
This template covers DevOps assessment key performance indicators such as activity by application, storefront users, revenue by hours etc. Deliver an awe inspiring pitch with this creative development and operations kpi dashboard it devops performance kpi dashboard icons pdf bundle. Topics like revenue, service can be discussed with this completely editable template. It is available for immediate download depending on the needs and requirements of the user.
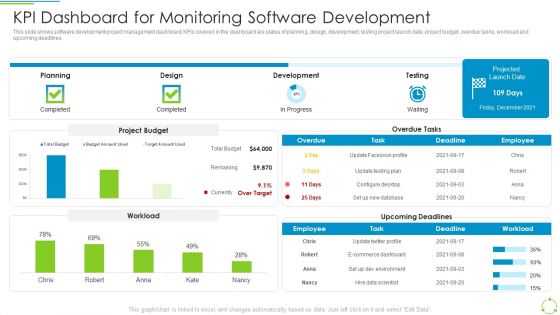
Executing Devops Framework KPI Dashboard For Monitoring Software Development Portrait PDF
This slide shows software development project management dashboard. KPIs covered in the dashboard are status of planning, design, development, testing project launch date, project budget, overdue tasks, workload and upcoming deadlines. Deliver an awe inspiring pitch with this creative Executing Devops Framework KPI Dashboard For Monitoring Software Development Portrait PDF bundle. Topics like Planning, Design, Development, Testing can be discussed with this completely editable template. It is available for immediate download depending on the needs and requirements of the user.
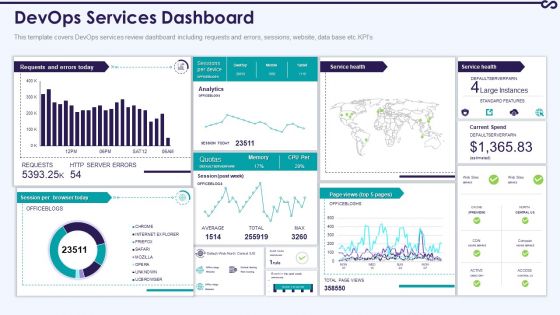
Development And Operations KPI Dashboard IT Devops Services Dashboard Infographics PDF
This template covers DevOps services review dashboard including requests and errors, sessions, website, data base etc KPIs. Deliver and pitch your topic in the best possible manner with this development and operations kpi dashboard it devops services dashboard infographics pdf. Use them to share invaluable insights on devops services dashboard and impress your audience. This template can be altered and modified as per your expectations. So, grab it now.

Development And Operations KPI Dashboard IT Devops Sprint Management Dashboard Portrait PDF
This template covers DevOps dashboard for sprint management covering planned vs completed work items, active bugs by severity etc. Deliver an awe inspiring pitch with this creative development and operations kpi dashboard it devops sprint management dashboard portrait pdf bundle. Topics like devops sprint management dashboard can be discussed with this completely editable template. It is available for immediate download depending on the needs and requirements of the user.

Development And Operations KPI Dashboard IT Devops Website Dashboard Clipart PDF
This template covers DevOps website review dashboard including app upstreaming KPIs and appendix summary etc. Deliver and pitch your topic in the best possible manner with this development and operations kpi dashboard it devops website dashboard clipart pdf. Use them to share invaluable insights on devops website dashboard and impress your audience. This template can be altered and modified as per your expectations. So, grab it now.
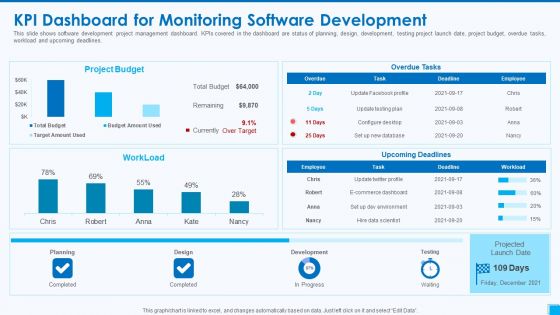
Devops Tools And Configuration IT Kpi Dashboard For Monitoring Software Development Slides PDF
This slide shows software development project management dashboard. KPIs covered in the dashboard are status of planning, design, development, testing project launch date, project budget, overdue tasks, workload and upcoming deadlines. Deliver and pitch your topic in the best possible manner with this devops tools and configuration it kpi dashboard for monitoring software development slides pdf. Use them to share invaluable insights on project budget, planning, design, development and impress your audience. This template can be altered and modified as per your expectations. So, grab it now.
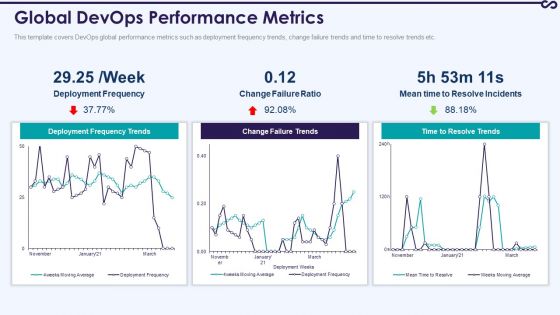
Development And Operations KPI Dashboard IT Global Devops Performance Metrics Themes PDF
This template covers DevOps global performance metrics such as deployment frequency trends, change failure trends and time to resolve trends etc. Deliver an awe inspiring pitch with this creative development and operations kpi dashboard it global devops performance metrics themes pdf bundle. Topics like global devops performance metrics can be discussed with this completely editable template. It is available for immediate download depending on the needs and requirements of the user.

Devops Performance Metrics Themes PDF
This slide provides the glimpse about the devops performance metrics which focuses on performance, speed and quality based on business objectives and customer experience.This is a devops performance metrics themes pdf template with various stages. Focus and dispense information on three stages using this creative set, that comes with editable features. It contains large content boxes to add your information on topics like resource utilization, frequency of release, success rate . You can also showcase facts, figures, and other relevant content using this PPT layout. Grab it now.
Devops Performance Assessment Metrics Icons PDF
This is a devops performance assessment metrics icons pdf template with various stages. Focus and dispense information on four stages using this creative set, that comes with editable features. It contains large content boxes to add your information on topics like devops performance assessment metrics. You can also showcase facts, figures, and other relevant content using this PPT layout. Grab it now.
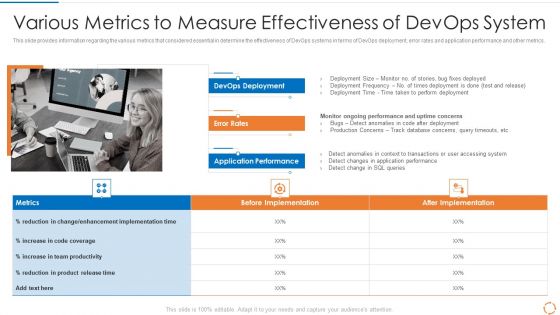
Devops Configuration Management IT Various Metrics To Measure Effectiveness Of Devops System Inspiration PDF
This slide provides information regarding the various metrics that considered essential in determine the effectiveness of DevOps systems in terms of DevOps deployment, error rates and application performance and other metrics. Presenting devops configuration management it various metrics to measure effectiveness of devops system inspiration pdf to provide visual cues and insights. Share and navigate important information on three stages that need your due attention. This template can be used to pitch topics like devops deployment, error rates, application performance. In addition, this PPT design contains high resolution images, graphics, etc, that are easily editable and available for immediate download.

Devops Advisory Management Proposal IT Backend Support Devops Metrics Diagrams PDF
This slide covers software performance metrics for devOps based on functional validation, integration testing and end to end regression testing. Deliver an awe inspiring pitch with this creative devops advisory management proposal it backend support devops metrics diagrams pdf bundle. Topics like build, functional validation, integration testing, end to end regression testing can be discussed with this completely editable template. It is available for immediate download depending on the needs and requirements of the user.
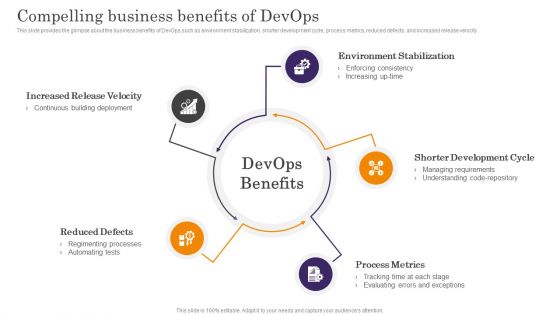
Devops App Process Administration Compelling Business Benefits Of Devops Information PDF
This slide provides the glimpse about the business benefits of DevOps such as environment stabilization, shorter development cycle, process metrics, reduced defects, and increased release velocity. Get a simple yet stunning designed Devops App Process Administration Compelling Business Benefits Of Devops Information PDF. It is the best one to establish the tone in your meetings. It is an excellent way to make your presentations highly effective. So, download this PPT today from Slidegeeks and see the positive impacts. Our easy to edit Devops App Process Administration Compelling Business Benefits Of Devops Information PDF can be your go to option for all upcoming conferences and meetings. So, what are you waiting for Grab this template today.
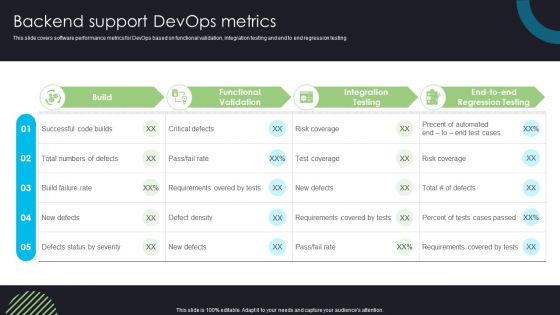
Devops Deployment And Transformation Services Advisory Backend Support Devops Metrics Ideas PDF
This slide covers software performance metrics for DevOps based on functional validation, integration testing and end to end regression testing. Elevate your presentations with our intuitive Devops Deployment And Transformation Services Advisory Backend Support Devops Metrics Ideas PDF template. Whether youre delivering a pitch, sharing data, or presenting ideas, our visually-stunning single-slide PPT template is the perfect tool to captivate your audience. With 100 percent editable features and a user-friendly interface, creating professional presentations has never been easier. Download now and leave a lasting impression.

Function Of Quality Assurance In Devops IT Implementing Quality Assurance In Devops Environment Pictures PDF
This slide provides information regarding implementing of quality assurance in DevOps environment in terms of merging of teams, performance and quality metrics, quality assurance. and development collaboration. Presenting function of quality assurance in devops it implementing quality assurance in devops environment pictures pdf to provide visual cues and insights. Share and navigate important information on three stages that need your due attention. This template can be used to pitch topics like service virtualization, network virtualization, device virtualization In addtion, this PPT design contains high resolution images, graphics, etc, that are easily editable and available for immediate download.
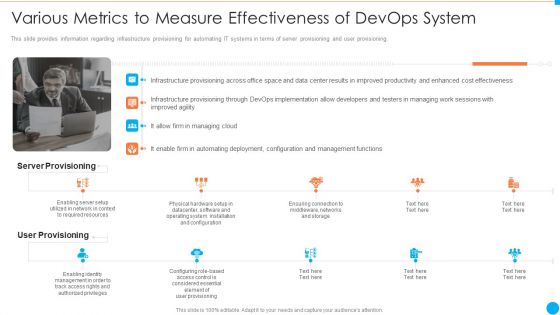
Various Metrics To Measure Effectiveness Of Devops System IT Infrastructure By Executing Devops Approach Introduction PDF
This slide provides information regarding infrastructure provisioning for automating IT systems in terms of server provisioning and user provisioning. Presenting various metrics to measure effectiveness of devops system it infrastructure by executing devops approach introduction pdf to provide visual cues and insights. Share and navigate important information on four stages that need your due attention. This template can be used to pitch topics like server provisioning, user provisioning, infrastructure, management, implementation. In addtion, this PPT design contains high resolution images, graphics, etc, that are easily editable and available for immediate download.
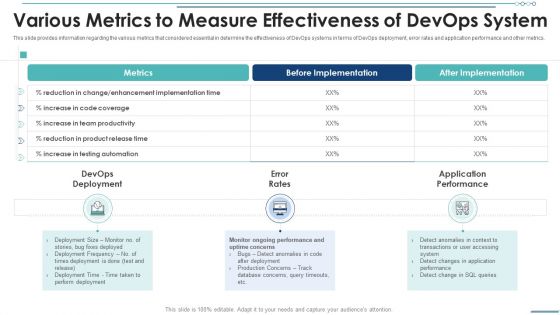
Various Metrics To Measure Effectiveness Of Devops System Rules PDF
This slide provides information regarding the various metrics that considered essential in determine the effectiveness of DevOps systems in terms of DevOps deployment, error rates and application performance and other metrics. Deliver an awe inspiring pitch with this creative various metrics to measure effectiveness of devops system rules pdf bundle. Topics like devops, deployment, performance can be discussed with this completely editable template. It is available for immediate download depending on the needs and requirements of the user.

Successful Devops Strategies Ppt Slides Background Images PDF
This template covers devOps strategies such as developing a DevOps culture, maximize metrics, understanding unique needs, adopt iteratively etc. This is a successful devops strategies ppt slides background images pdf template with various stages. Focus and dispense information on ten stages using this creative set, that comes with editable features. It contains large content boxes to add your information on topics like successful devops strategies. You can also showcase facts, figures, and other relevant content using this PPT layout. Grab it now.
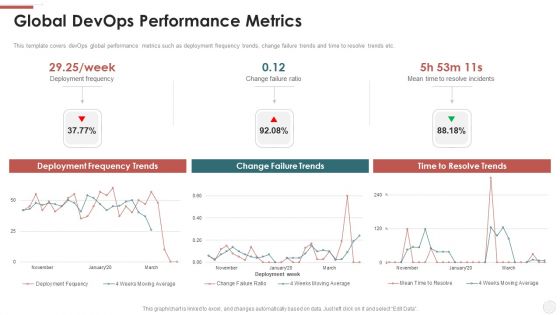
Global Devops Performance Metrics Ppt Infographic Template Example Topics PDF
This template covers devOps global performance metrics such as deployment frequency trends, change failure trends and time to resolve trends etc. Deliver an awe inspiring pitch with this creative global devops performance metrics ppt infographic template example topics pdf bundle. Topics like global devops performance metrics can be discussed with this completely editable template. It is available for immediate download depending on the needs and requirements of the user.

Various Metrics To Measure Effectiveness Of Devops System Background PDF
This slide provides information regarding the various metrics that considered essential in determine the effectiveness of DevOps systems in terms of DevOps performance, speed and quality and other metrics. Deliver an awe inspiring pitch with this creative various metrics to measure effectiveness of devops system background pdf bundle. Topics like enhancement, coverage, productivity can be discussed with this completely editable template. It is available for immediate download depending on the needs and requirements of the user.
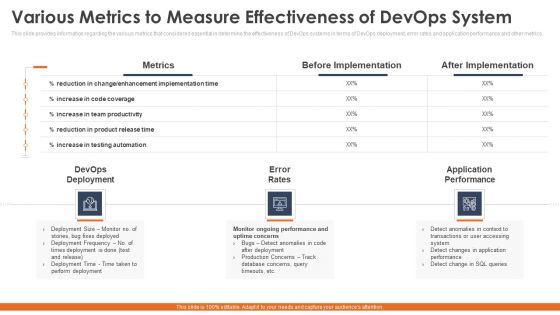
Various Metrics To Measure Effectiveness Of Devops System Slides PDF
This slide provides information regarding the various metrics that considered essential in determine the effectiveness of DevOps systems in terms of DevOps deployment, error rates and application performance and other metrics. Presenting various metrics to measure effectiveness of devops system slides pdf to provide visual cues and insights. Share and navigate important information on three stages that need your due attention. This template can be used to pitch topics like various metrics to measure effectiveness of devops system. In addtion, this PPT design contains high resolution images, graphics, etc, that are easily editable and available for immediate download.
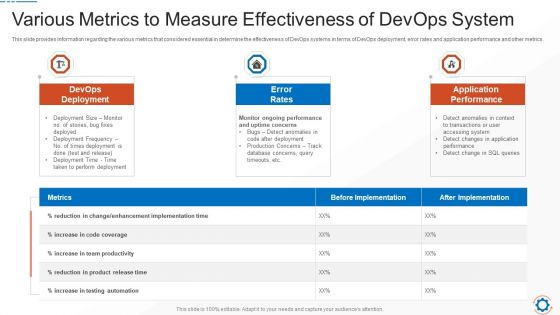
Various Metrics To Measure Effectiveness Of Devops System Portrait PDF
This slide provides information regarding the various metrics that considered essential in determine the effectiveness of DevOps systems in terms of DevOps deployment, error rates and application performance and other metrics. Presenting various metrics to measure effectiveness of devops system portrait pdf to provide visual cues and insights. Share and navigate important information on three stages that need your due attention. This template can be used to pitch topics like devops deployment, application performance, detect anomalies. In addtion, this PPT design contains high resolution images, graphics, etc, that are easily editable and available for immediate download.

Various Metrics To Measure Effectiveness Of Devops System Template PDF
This slide provides information regarding the various metrics that considered essential in determine the effectiveness of DevOps systems in terms of DevOps deployment, error rates and application performance and other metrics. Presenting various metrics to measure effectiveness of devops system template pdf to provide visual cues and insights. Share and navigate important information on three stages that need your due attention. This template can be used to pitch topics like devops deployment , application performance, detect anomalies. In addtion, this PPT design contains high resolution images, graphics, etc, that are easily editable and available for immediate download.

Devops Software Performance Metrics Ppt Inspiration Graphic Tips PDF
This template covers software performance metrics for devOps based on functional validation, integration testing and end to end regression testing. Deliver an awe inspiring pitch with this creative KEYWORDFROMSLIDESSS bundle. Topics like devops software performance metrics ppt inspiration graphic tips pdf can be discussed with this completely editable template. It is available for immediate download depending on the needs and requirements of the user.

Devops Strategic Solution Implementation Roadmap Ppt File Example File PDF
This template covers devOps strategic solution and implementation roadmap starting from devOps assessment, then deployment, automation improvements configuration etc. Presenting devops strategic solution implementation roadmap ppt file example file pdf to provide visual cues and insights. Share and navigate important information on six stages that need your due attention. This template can be used to pitch topics like roadmap, process, implementation, metrics, source. In addtion, this PPT design contains high resolution images, graphics, etc, that are easily editable and available for immediate download.

Business Metrics Pyramid To Guide Devops Initiative Summary PDF
The slide showcases a metric oriented framework to guide the companys DevOps initiatives and helps in measuring efficiency, quality, and velocity in order to accomplish a true DevOps transformation. It covers business performance, customer value, organizational effectiveness, service quality, service velocity and operational efficiency. Presenting Business Metrics Pyramid To Guide Devops Initiative Summary PDF to dispense important information. This template comprises six stages. It also presents valuable insights into the topics including Business Performance, Customer Value, Organizational Effectiveness. This is a completely customizable PowerPoint theme that can be put to use immediately. So, download it and address the topic impactfully.
Comparative Metrics For Continuous Tracking In Devops Tools Clipart PDF
This slide illustrates comparison of key performance indicators of DevOps tools. It includes metrics such as observability and visualization, observability and application, pattern analysis, etc. Showcasing this set of slides titled Comparative Metrics For Continuous Tracking In Devops Tools Clipart PDF. The topics addressed in these templates are Appdynamics, Datadog, Dynatrace. All the content presented in this PPT design is completely editable. Download it and make adjustments in color, background, font etc. as per your unique business setting.

Various Metrics To Measure Effectiveness Of Devops System Mockup PDF
This slide provides information regarding the various metrics that considered essential in determine the effectiveness of DevOps systems in terms of DevOps performance, speed and quality and other metrics. Presenting various metrics to measure effectiveness of devops system mockup pdf to provide visual cues and insights. Share and navigate important information on one stages that need your due attention. This template can be used to pitch topics like determine, application, process, productivity. In addtion, this PPT design contains high resolution images, graphics, etc, that are easily editable and available for immediate download.
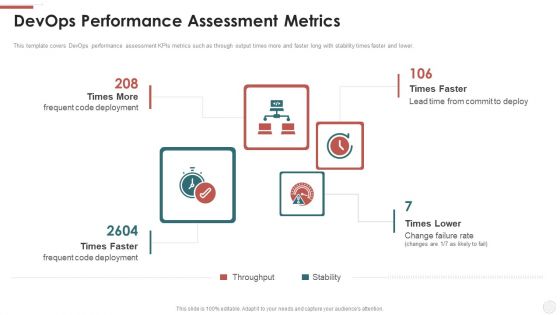
Devops Performance Assessment Metrics Ppt Summary Examples PDF
This template covers DevOps performance assessment KPIs metrics such as through output times more and faster long with stability times faster and lower. Deliver and pitch your topic in the best possible manner with this devops performance assessment metrics ppt summary examples pdf. Use them to share invaluable insights on deployment, rate and impress your audience. This template can be altered and modified as per your expectations. So, grab it now.
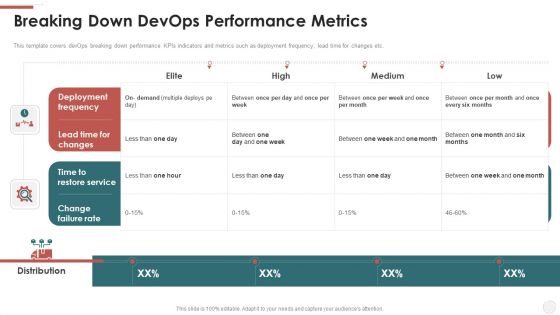
Breaking Down Devops Performance Metrics Ppt Styles Template PDF
This template covers devOps breaking down performance KPIs indicators and metrics such as deployment frequency, lead time for changes etc. Deliver and pitch your topic in the best possible manner with this breaking down devops performance metrics ppt styles template pdf. Use them to share invaluable insights on service, deployment and impress your audience. This template can be altered and modified as per your expectations. So, grab it now.
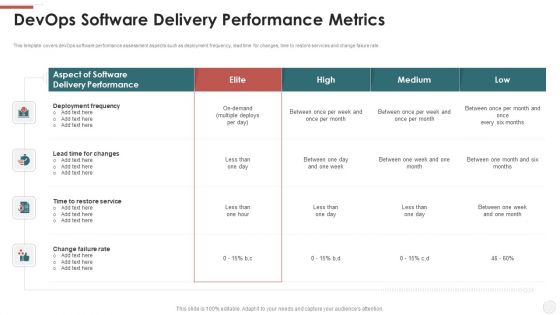
Devops Software Delivery Performance Metrics Ppt Inspiration Background PDF
This template covers devOps software performance assessment aspects such as deployment frequency, lead time for changes, time to restore services and change failure rate. Deliver and pitch your topic in the best possible manner with this devops software delivery performance metrics ppt inspiration background pdf. Use them to share invaluable insights on rate, service, deployment, software and impress your audience. This template can be altered and modified as per your expectations. So, grab it now.
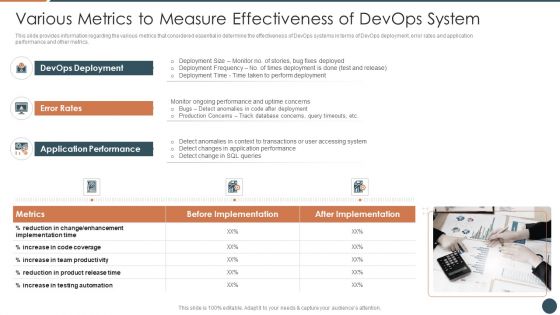
Various Metrics To Measure Effectiveness Of Devops System Introduction PDF
This is a various metrics to measure effectiveness of devops system introduction pdf template with various stages. Focus and dispense information on three stages using this creative set, that comes with editable features. It contains large content boxes to add your information on topics like devops deployment, application performance, error rates . You can also showcase facts, figures, and other relevant content using this PPT layout. Grab it now.

Devops Deployment And Frequency Performance Metrics Ppt Portfolio Files PDF
This template covers devOps deployment, change in value, lead time customer ticket software performance indicators This is a devops deployment and frequency performance metrics ppt portfolio files pdf template with various stages. Focus and dispense information on nine stages using this creative set, that comes with editable features. It contains large content boxes to add your information on topics like deployments, performance, customer. You can also showcase facts, figures, and other relevant content using this PPT layout. Grab it now.

Compelling Business Benefits Of Devops Ppt Summary Outline PDF
This slide provides the glimpse about the business benefits of DevOps such as environment stabilization, shorter development cycle, process metrics, reduced defects, and increased release velocity. There are so many reasons you need a Compelling Business Benefits Of Devops Ppt Summary Outline PDF. The first reason is you can not spend time making everything from scratch, Thus, Slidegeeks has made presentation templates for you too. You can easily download these templates from our website easily.

Devops Business Performance Metrics Ppt Slides Inspiration PDF
This template covers metrics for evaluation of devOps performance on each stage such as operational efficiency, service quality, service velocity, business performance etc. Presenting devops business performance metrics ppt slides inspiration pdf to provide visual cues and insights. Share and navigate important information on five stages that need your due attention. This template can be used to pitch topics like customer value, organizational, service, business performance. In addtion, this PPT design contains high resolution images, graphics, etc, that are easily editable and available for immediate download.

Key Parameters To Establish Overall Devops Value IT Various Metrics To Measure Effectiveness Of Devops System Portrait PDF
This slide provides information regarding the various metrics that considered essential in determine the effectiveness of DevOps systems in terms of DevOps performance, speed and quality and other metrics. This is a key parameters to establish overall devops value it various metrics to measure effectiveness of devops system portrait pdf template with various stages. Focus and dispense information on three stages using this creative set, that comes with editable features. It contains large content boxes to add your information on topics like metrics, speed, quality, pre devops optimization, post optimizing devops . You can also showcase facts, figures, and other relevant content using this PPT layout. Grab it now.
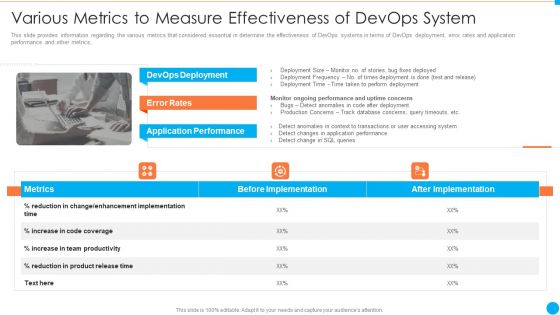
Various Metrics To Measure Effectiveness Of Devops System Rates IT Infrastructure By Executing Devops Approach Demonstration PDF
This slide provides information regarding the various metrics that considered essential in determine the effectiveness of DevOps systems in terms of DevOps deployment, error rates and application performance and other metrics. This is a various metrics to measure effectiveness of devops system rates it infrastructure by executing devops approach demonstration pdf template with various stages. Focus and dispense information on three stages using this creative set, that comes with editable features. It contains large content boxes to add your information on topics like performance, metrics, database, monitor, deployment. You can also showcase facts, figures, and other relevant content using this PPT layout. Grab it now.
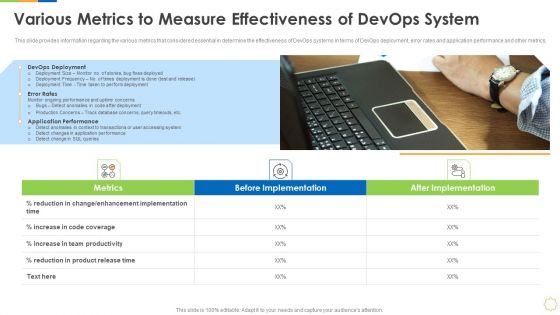
Infrastructure As Code For Devops Growth IT Various Metrics To Measure Effectiveness Of Devops System Designs PDF
This slide provides information regarding the various metrics that considered essential in determine the effectiveness of DevOps systems in terms of DevOps deployment, error rates and application performance and other metrics. This is a infrastructure as code for devops growth it various metrics to measure effectiveness of devops system designs pdf template with various stages. Focus and dispense information on three stages using this creative set, that comes with editable features. It contains large content boxes to add your information on topics like performance, metrics, database, monitor, deployment. You can also showcase facts, figures, and other relevant content using this PPT layout. Grab it now.
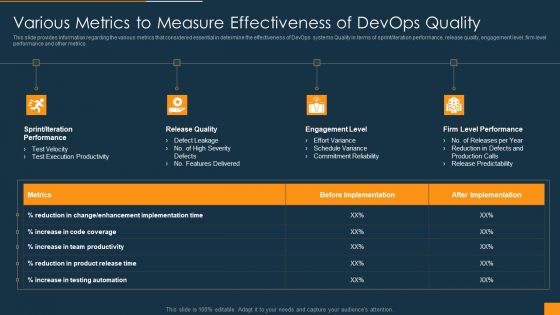
Function Of Quality Assurance In Devops IT Various Metrics To Measure Effectiveness Of Devops Quality Formats PDF
This slide provides information regarding the various metrics that considered essential in determine the effectiveness of DevOps systems Quality in terms of sprint or iteration performance, release quality, engagement level, firm level performance and other metrics. This is a function of quality assurance in devops it various metrics to measure effectiveness of devops quality formats pdf template with various stages. Focus and dispense information on four stages using this creative set, that comes with editable features. It contains large content boxes to add your information on topics like sprint or iteration, performance, release quality, engagement level You can also showcase facts, figures, and other relevant content using this PPT layout. Grab it now.

Function Of Quality Assurance In Devops IT Impact Of Effective Testing And Quality Management Of Devops System Formats PDF
This slide provides information regarding the impact of successful implementation of DevOps system by addressing various KPIs such as mean lead time to changes, change failure rate, security test pass rate, etc. This is a function of quality assurance in devops it impact of effective testing and quality management of devops system formats pdf template with various stages. Focus and dispense information on three stages using this creative set, that comes with editable features. It contains large content boxes to add your information on topics like merging of teams, performance and quality metrics, development collaboration You can also showcase facts, figures, and other relevant content using this PPT layout. Grab it now.

Development And Operations KPI Dashboard With Application Activities Information PDF
This slide covers devops KPI metrics dashboard with application activities which includes error code count, revenue by hour and average response time through application.Pitch your topic with ease and precision using this Development And Operations KPI Dashboard With Application Activities Information PDF This layout presents information on Development Operations Kpi Dashboard, Application Activities It is also available for immediate download and adjustment. So, changes can be made in the color, design, graphics or any other component to create a unique layout.
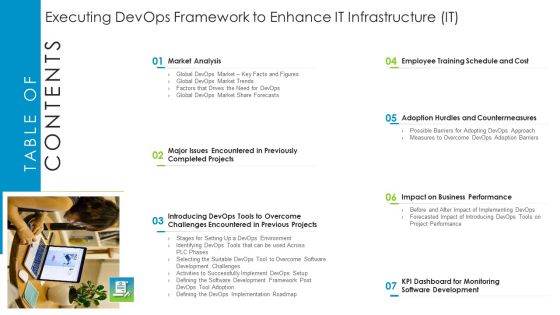
Table Of Contents Executing Devops Framework To Enhance IT Infrastructure IT Demonstration PDF
This is a Table Of Contents Executing Devops Framework To Enhance IT Infrastructure IT Demonstration PDF template with various stages. Focus and dispense information on seven stages using this creative set, that comes with editable features. It contains large content boxes to add your information on topics like Market Analysis, KPI Dashboard, Monitoring Software Development, Impact on Business Performance. You can also showcase facts, figures, and other relevant content using this PPT layout. Grab it now.
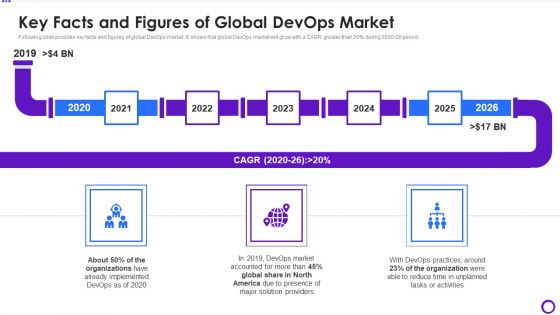
Key Facts And Figures Of Global Devops Market Ppt Ideas Tips PDF
Following slide provides key facts and figures of global DevOps market. It shows that global DevOps market will grow with a CAGR greater than 20persent during 2020-26 period.This is a key facts and figures of global devops market ppt ideas tips pdf template with various stages. Focus and dispense information on five stages using this creative set, that comes with editable features. It contains large content boxes to add your information on topics like kpi dashboard for monitoring project progress You can also showcase facts, figures, and other relevant content using this PPT layout. Grab it now.

Steps For Devops Implementation IT Various Metrics To Measure Effectiveness Structure PDF
This slide provides information regarding the various metrics that considered essential in determine the effectiveness of DevOps systems in terms of DevOps deployment, error rates and application performance and other metrics. Presenting steps for devops implementation it various metrics to measure effectiveness structure pdf to provide visual cues and insights. Share and navigate important information on three stages that need your due attention. This template can be used to pitch topics like devops deployment, error rates, application performance. In addtion, this PPT design contains high resolution images, graphics, etc, that are easily editable and available for immediate download.
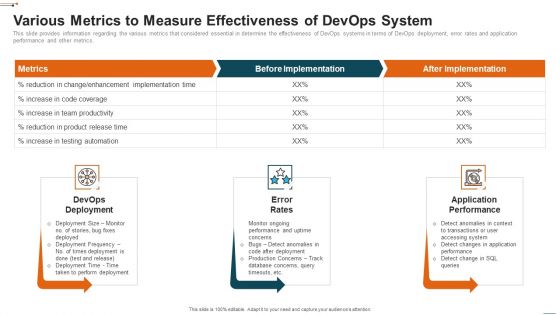
Devops Deployment Initiative IT Various Metrics To Measure Effectiveness Inspiration PDF
This slide provides information regarding the various metrics that considered essential in determine the effectiveness of DevOps systems in terms of DevOps deployment, error rates and application performance and other metrics. This is a devops deployment initiative it various metrics to measure effectiveness inspiration pdf template with various stages. Focus and dispense information on three stages using this creative set, that comes with editable features. It contains large content boxes to add your information on topics like various metrics to measure effectiveness of devops system. You can also showcase facts, figures, and other relevant content using this PPT layout. Grab it now.
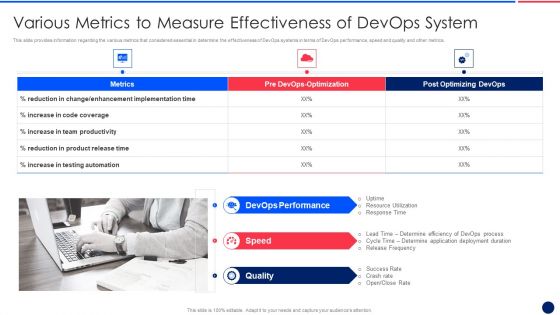
Key Components Critical To Devops Viability IT Various Metrics To Measure Effectiveness Download PDF
This slide provides information regarding the various metrics that considered essential in determine the effectiveness of DevOps systems in terms of DevOps performance, speed and quality and other metrics. This is a key components critical to devops viability it various metrics to measure effectiveness download pdf template with various stages. Focus and dispense information on three stages using this creative set, that comes with editable features. It contains large content boxes to add your information on topics like devops performance, speed, quality. You can also showcase facts, figures, and other relevant content using this PPT layout. Grab it now.

Development And Operations Procedure IT Choosing The Right Devops Tools For The Company Introduction PDF
This slide provides the glimpse about the DevOps tools which can be considered by the company along with their features and prices.Deliver and pitch your topic in the best possible manner with this development and operations procedure it choosing the right devops tools for the company introduction pdf Use them to share invaluable insights on monitors and troubleshoot, automatically fix problems, monitors business metrics and impress your audience. This template can be altered and modified as per your expectations. So, grab it now.

Development And Operations Procedure IT Compelling Business Benefits Of Devops Structure PDF
This slide provides the glimpse about the business benefits of DevOps such as environment stabilization, shorter development cycle, process metrics, reduced defects, and increased release velocity.This is a development and operations procedure it compelling business benefits of devops structure pdf template with various stages. Focus and dispense information on five stages using this creative set, that comes with editable features. It contains large content boxes to add your information on topics like increased release velocity, environment stabilization, shorter development cycle You can also showcase facts, figures, and other relevant content using this PPT layout. Grab it now.
Compelling Business Benefits Of Devops Ppt PowerPoint Presentation File Icon PDF
This slide provides the glimpse about the business benefits of DevOps such as environment stabilization, shorter development cycle, process metrics, reduced defects, and increased release velocity. Slidegeeks is one of the best resources for PowerPoint templates. You can download easily and regulate Compelling Business Benefits Of Devops Ppt PowerPoint Presentation File Icon PDF for your personal presentations from our wonderful collection. A few clicks is all it takes to discover and get the most relevant and appropriate templates. Use our Templates to add a unique zing and appeal to your presentation and meetings. All the slides are easy to edit and you can use them even for advertisement purposes.
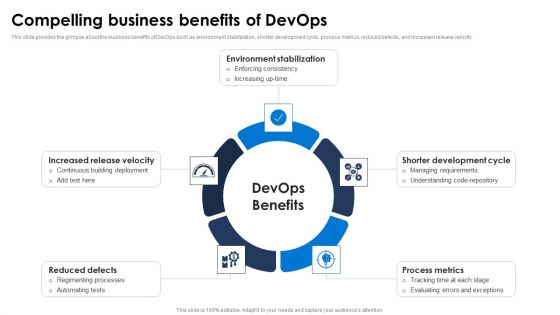
Compelling Business Benefits Of Devops Ppt PowerPoint Presentation File Gallery PDF
This slide provides the glimpse about the business benefits of DevOps such as environment stabilization, shorter development cycle, process metrics, reduced defects, and increased release velocity. Slidegeeks is one of the best resources for PowerPoint templates. You can download easily and regulate Compelling Business Benefits Of Devops Ppt PowerPoint Presentation File Gallery PDF for your personal presentations from our wonderful collection. A few clicks is all it takes to discover and get the most relevant and appropriate templates. Use our Templates to add a unique zing and appeal to your presentation and meetings. All the slides are easy to edit and you can use them even for advertisement purposes.
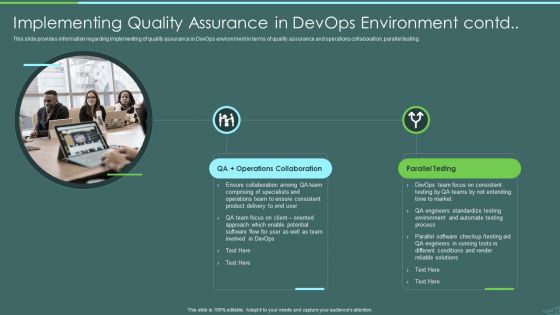
Devops Quality Assurance And Testing To Improve Speed And Quality IT Implementing Quality Assurance Download PDF
This slide provides information regarding implementing of quality assurance in DevOps environment in terms of merging of teams, performance and quality metrics, quality assurance. and development collaboration. Presenting devops quality assurance and testing to improve speed and quality it implementing quality assurance download pdf to provide visual cues and insights. Share and navigate important information on three stages that need your due attention. This template can be used to pitch topics like merging of teams, performance and quality metrics, qa development collaboration. In addtion, this PPT design contains high resolution images, graphics, etc, that are easily editable and available for immediate download.

Outline For Devops Benefits Culture Performance Indicators And Implementation Roadmap Ppt PowerPoint Presentation Complete With Slides
Pitch yourself both in house and outside by utilizing this complete deck. This outline for devops benefits culture performance indicators and implementation roadmap ppt powerpoint presentation complete with slides focuses on key fundamentals of the topic, displayed using different slides. With a total of fifty three slides, this template is the best tool you can use to persuade your audience. It will not only help you create great presentations but also induce strategic thinking because of its well researched content and graphics. You can easily personalize any of the elements to suit your unique business setting. Additionally, it can be saved in PNG, JPG, and PDF formats to save your time and resources.
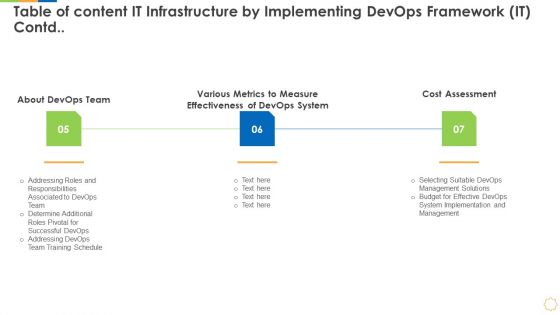
Table Of Content It Infrastructure By Implementing Devops Framework IT Contd Background PDF
Presenting table of content it infrastructure by implementing devops framework it contd background pdf to provide visual cues and insights. Share and navigate important information on three stages that need your due attention. This template can be used to pitch topics like training, effectiveness, cost, metrics, measure. In addtion, this PPT design contains high resolution images, graphics, etc, that are easily editable and available for immediate download.
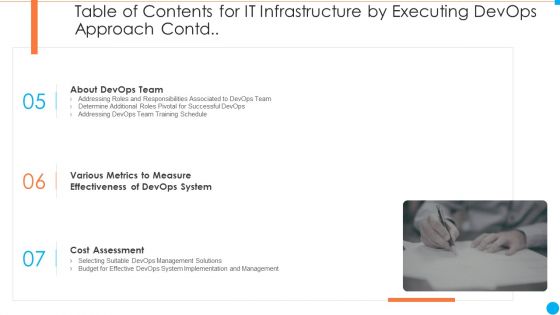
Table Of Contents For IT Infrastructure By Executing Devops Approach Contd Clipart PDF
Presenting table of contents for it infrastructure by executing devops approach contd clipart pdf to provide visual cues and insights. Share and navigate important information on three stages that need your due attention. This template can be used to pitch topics like training, effectiveness, cost, metrics, measure. In addtion, this PPT design contains high resolution images, graphics, etc, that are easily editable and available for immediate download.

Table Of Contents For Steps For Devops Implementation IT Summary PDF
This is a table of contents for steps for devops implementation it summary pdf template with various stages. Focus and dispense information on seven stages using this creative set, that comes with editable features. It contains large content boxes to add your information on topics like analysis, implementing, measure, metrics, system. You can also showcase facts, figures, and other relevant content using this PPT layout. Grab it now.

Devops Advisory Management Proposal IT Solution For System Operations As A People Problem Introduction PDF
This slide covers the solution of the problems faced by the clients such as monitoring, containers, metrics, analytics, logs, performance security etc. Presenting devops advisory management proposal it solution for system operations as a people problem introduction pdf to provide visual cues and insights. Share and navigate important information on four stages that need your due attention. This template can be used to pitch topics like monitoring, metrics, analytics, logs, security, performance, containers. In addtion, this PPT design contains high resolution images, graphics, etc, that are easily editable and available for immediate download.

Devops Deployment And Transformation Services Advisory Solution For System Operations As A People Problem Professional PDF
This slide covers the solution of the problems faced by the clients such as monitoring, containers, metrics, analytics, logs, performance security etc. Elevate your presentations with our intuitive Devops Deployment And Transformation Services Advisory Solution For System Operations As A People Problem Professional PDF template. Whether youre delivering a pitch, sharing data, or presenting ideas, our visually-stunning single-slide PPT template is the perfect tool to captivate your audience. With 100 percenteditable features and a user-friendly interface, creating professional presentations has never been easier. Download now and leave a lasting impression.
Development And Operations KPI Dashboard With Central Processing Unit Statistics Icons PDF
This slide covers devops KPI metrics dashboard with central processing unit statistics about input output statistics , network traffic volume under during recorded sessions. Further, this template includes numbers of sessions with waiting time.Showcasing this set of slides titled Development And Operations KPI Dashboard With Central Processing Unit Statistics Icons PDF The topics addressed in these templates are Central Processing, Output Statistics, Resource Limits All the content presented in this PPT design is completely editable. Download it and make adjustments in color, background, font etc. as per your unique business setting.
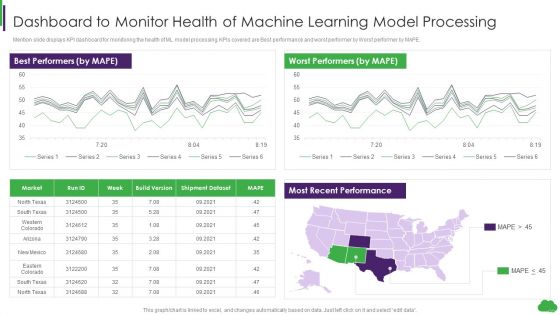
Using Ml And Devops In Product Development Process Dashboard To Monitor Health Of Machine Learning Themes PDF
Mention slide displays KPI dashboard for monitoring the health of ML model processing. KPIs covered are Best performance and worst performer by Worst performer by MAPE. Deliver and pitch your topic in the best possible manner with this Using Ml And Devops In Product Development Process Dashboard To Monitor Health Of Machine Learning Themes PDF. Use them to share invaluable insights on Learning Model Processing, Monitor Health , Dashboard and impress your audience. This template can be altered and modified as per your expectations. So, grab it now.

Devops Quality Assurance And Testing To Improve Speed And Quality IT Various Metrics To Measure Microsoft PDF
This slide provides information regarding the various metrics that considered essential in determine the effectiveness of DevOps systems Quality in terms of sprint or iteration performance, release quality, engagement level, firm level performance and other metrics. This is a devops quality assurance and testing to improve speed and quality it various metrics to measure microsoft pdf template with various stages. Focus and dispense information on four stages using this creative set, that comes with editable features. It contains large content boxes to add your information on topics like sprint or iteration performance, release quality, engagement level, firm level performance. You can also showcase facts, figures, and other relevant content using this PPT layout. Grab it now.
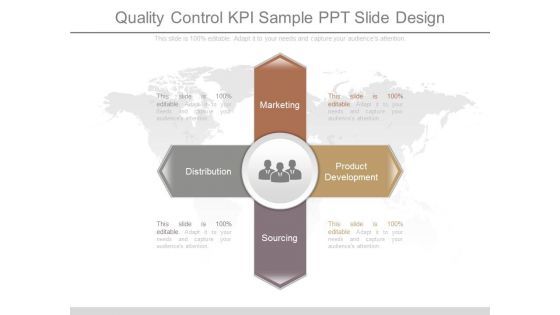
Quality Control Kpi Sample Ppt Slide Design
This is a quality control kpi sample ppt slide design. This is a four stage process. The stages in this process are marketing, distribution, product development, sourcing.
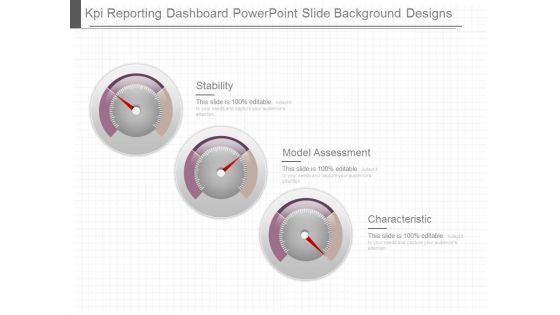
Kpi Reporting Dashboard Powerpoint Slide Background Designs
This is a kpi reporting dashboard powerpoint slide background designs. This is a three stage process. The stages in this process are stability, model assessment, characteristic.
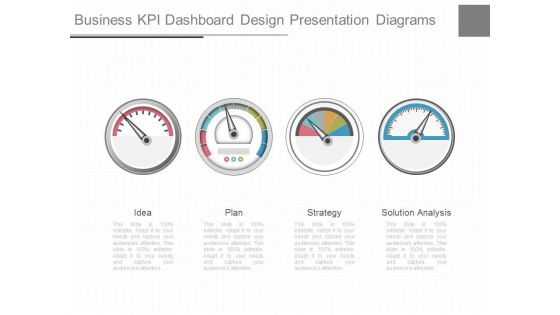
Business Kpi Dashboard Design Presentation Diagrams
This is a business kpi dashboard design presentation diagrams. This is a four stage process. The stages in this process are idea, plan, strategy, solution analysis.

Leadership Development Kpi Examples Powerpoint Slides
This is a leadership development kpi examples powerpoint slides. This is a five stage process. The stages in this process are vision, strategy and culture, finance and operation, human capital alignment, service execution, client relationships.

Media Kpi Example Ppt Design Templates
This is a media kpi example ppt design templates. This is a four stage process. The stages in this process are awareness, consideration, decision, visitors, leads, buyer journey, sales and marketing process, kpis, marketing qualified leads, sales qualified leads.

Kpi Dashboard Ppt Powerpoint Slide Design Templates
This is a kpi dashboard ppt powerpoint slide design templates. This is a four stage process. The stages in this process are sales, new customer, budget, resource and task.

Customer Service Kpi Diagram Powerpoint Slide Design
This is a customer service kpi diagram powerpoint slide design. This is a three stage process. The stages in this process are information desk, valet damage claims, gift shop sales.
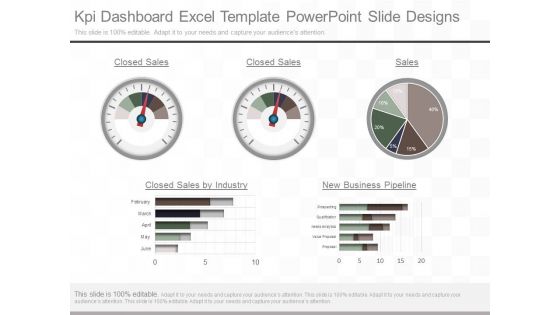
Kpi Dashboard Excel Template Powerpoint Slide Designs
This is a kpi dashboard excel template powerpoint slide designs. This is a five stage process. The stages in this process are closed sales, closed sales, sales, closed sales by industry, new business pipeline, february, march april, may, june, prospecting, qualification, needs analytics, value proposal, proposal.

Kpi Service Dashboard Ppt Powerpoint Slide Designs
This is a kpi service dashboard ppt powerpoint slide designs. This is a four stage process. The stages in this process are service requests resolved within target, service requests by priority, service requests by category, calls offered, jan, feb, mar, apr, may, june, july, aug, sep, oct, nov, dec.
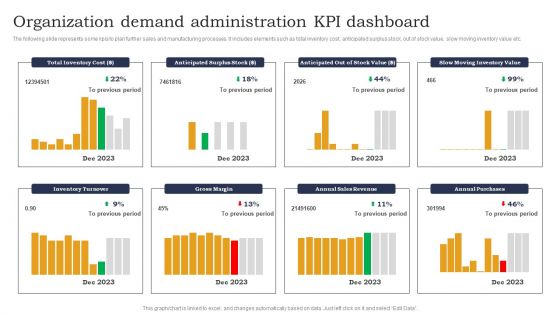
Organization Demand Administration KPI Dashboard Designs PDF
The following slide represents some kpis to plan further sales and manufacturing processes. It includes elements such as total inventory cost, anticipated surplus stock, out of stock value, slow moving inventory value etc. Pitch your topic with ease and precision using this Organization Demand Administration KPI Dashboard Designs PDF. This layout presents information on Anticipated Surplus Stock, Out Of Stock, Slow Moving Inventory. It is also available for immediate download and adjustment. So, changes can be made in the color, design, graphics or any other component to create a unique layout.

Employee Recruitment Analysis KPI Dashboard Slides PDF
The following slide presents a hiring assessment dashboard to manage HR metrics. It includes KPIs such as average time taken, cost required in hiring process along with the major sources of recruitment etc. Pitch your topic with ease and precision using this Employee Recruitment Analysis KPI Dashboard Slides PDF. This layout presents information on Agile Hiring, Non Agile Hiring, Hiring Cost Assessment. It is also available for immediate download and adjustment. So, changes can be made in the color, design, graphics or any other component to create a unique layout.
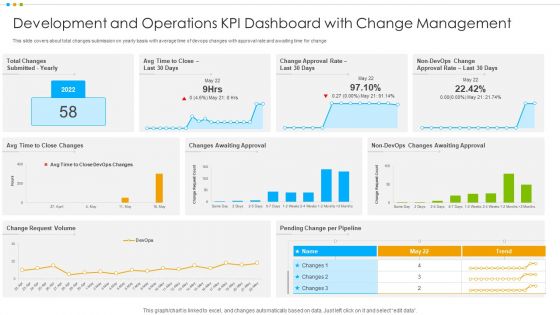
Development And Operations KPI Dashboard With Change Management Elements PDF
This slide covers about total changes submission on yearly basis with average time of devops changes with approval rate and awaiting time for change.Pitch your topic with ease and precision using this Development And Operations KPI Dashboard With Change Management Elements PDF This layout presents information on Awaiting Approval, Change Approval, Total Changes It is also available for immediate download and adjustment. So, changes can be made in the color, design, graphics or any other component to create a unique layout.

Development And Operations KPI Dashboard With Total Builds Ideas PDF
This slide covers about devops project details with build summary, static analysis , test execution results and quality check on daily basis.Showcasing this set of slides titled Development And Operations KPI Dashboard With Total Builds Ideas PDF The topics addressed in these templates are Member Assignments, Code Repository, Quality Health All the content presented in this PPT design is completely editable. Download it and make adjustments in color, background, font etc. as per your unique business setting.
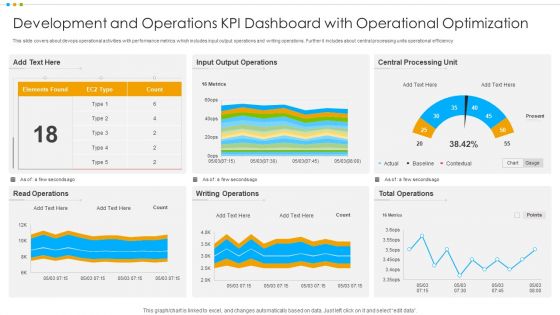
Development And Operations KPI Dashboard With Operational Optimization Pictures PDF
This slide covers about devops operational activities with performance metrics which includes input output operations and writing operations. Further it includes about central processing units operational efficiency.Pitch your topic with ease and precision using this Development And Operations KPI Dashboard With Operational Optimization Pictures PDF This layout presents information on Output Operations, Central Processing, Total Operations It is also available for immediate download and adjustment. So, changes can be made in the color, design, graphics or any other component to create a unique layout.
Website Bounce Rate KPI Icon With Dollar Sign Elements Pdf
Showcasing this set of slides titled Website Bounce Rate KPI Icon With Dollar Sign Elements Pdf. The topics addressed in these templates are Website Bounce Rate, KPI Icon, Dollar Sign. All the content presented in this PPT design is completely editable. Download it and make adjustments in color, background, font etc. as per your unique business setting.
Network KPI Dashboard Ppt PowerPoint Presentation Summary Design Ideas Cpb
This is a network kpi dashboard ppt powerpoint presentation summary design ideas cpb. This is a three stage process. The stages in this process are network kpi dashboard.

KPI Dashboard For Estimating Monthly Cash Flow Infographics Pdf
Following slide demonstrates KPI dashboard to forecast monthly business money flow for cash flow management planning. It includes components such as projected profit before tax, net operating cash flow, net financial cash flow, net investing cash flow, etc. Showcasing this set of slides titled KPI Dashboard For Estimating Monthly Cash Flow Infographics Pdf. The topics addressed in these templates are KPI Dashboard, Estimating Monthly Cash Flow, Net Financial Cash Flow. All the content presented in this PPT design is completely editable. Download it and make adjustments in color, background, font etc. as per your unique business setting.
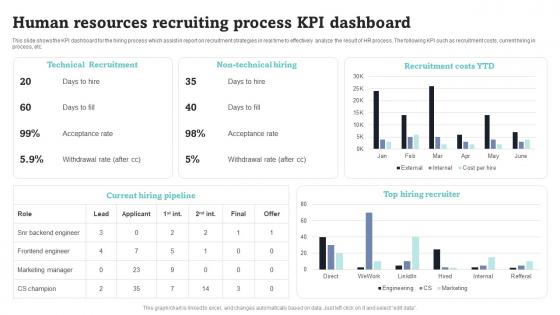
Human Resources Recruiting Process KPI Dashboard Summary Pdf
This slide shows the KPI dashboard for the hiring process which assist in report on recruitment strategies in real time to effectively analyze the result of HR process. The following KPI such as recruitment costs, current hiring in process, etc. Showcasing this set of slides titled Human Resources Recruiting Process KPI Dashboard Summary Pdf. The topics addressed in these templates are Technical Recruitment, Non Technical Hiring, Recruitment Costs. All the content presented in this PPT design is completely editable. Download it and make adjustments in color, background, font etc. as per your unique business setting.
KPI Dashboard For Tracking Policy Administration Progress Summary Pdf
Following slide demonstrates KPI dashboard to monitor business policies progress to improve organisation performance. It includes key component such as policies pending for review policy verification in process, expired policies, policy by control status, etc. Showcasing this set of slides titled KPI Dashboard For Tracking Policy Administration Progress Summary Pdf. The topics addressed in these templates are Process, Expired Policies, Policy Control Status. All the content presented in this PPT design is completely editable. Download it and make adjustments in color, background, font etc. as per your unique business setting.
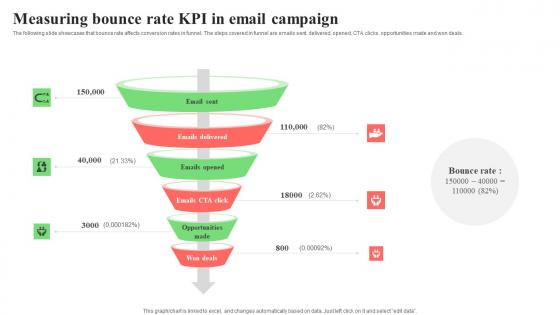
Measuring Bounce Rate KPI In Email Campaign Designs Pdf
The following slide showcases that bounce rate affects conversion rates in funnel. The steps covered in funnel are emails sent, delivered, opened, CTA clicks, opportunities made and won deals. Pitch your topic with ease and precision using this Measuring Bounce Rate KPI In Email Campaign Designs Pdf. This layout presents information on Delivered, Opened, CTA Clicks, Opportunities. It is also available for immediate download and adjustment. So, changes can be made in the color, design, graphics or any other component to create a unique layout.

Manufacturing KPI Dashboard For Process Implementing Manufacturing Strategy SS V
The following slide highlights manufacturing and production key performance indicators to track and manage processes. It includes elements such as downtime causes, production volume by machinery, number of returned items, missing parts, service, poor quality etc. Formulating a presentation can take up a lot of effort and time, so the content and message should always be the primary focus. The visuals of the PowerPoint can enhance the presenters message, so our Manufacturing KPI Dashboard For Process Implementing Manufacturing Strategy SS V was created to help save time. Instead of worrying about the design, the presenter can concentrate on the message while our designers work on creating the ideal templates for whatever situation is needed. Slidegeeks has experts for everything from amazing designs to valuable content, we have put everything into Manufacturing KPI Dashboard For Process Implementing Manufacturing Strategy SS V
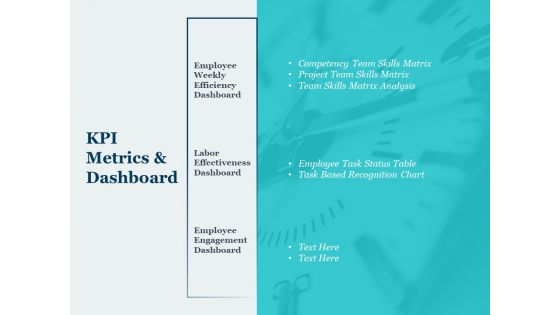
Kpi Metrics And Dashboard Ppt PowerPoint Presentation Inspiration Design Ideas
This is a kpi metrics and dashboard ppt powerpoint presentation inspiration design ideas. This is a three stage process. The stages in this process are business, management, marketing.

Various KPI To Track Employee Engagement Portrait Pdf
Following slides shows various KPIs are used to monitor employee engagement which assist in enhancing employee retention .It includes such as employee satisfaction indicators, online branding rating , turnover rate, etc. Showcasing this set of slides titled Various KPI To Track Employee Engagement Portrait Pdf The topics addressed in these templates are Employee Satisfaction Indicators, Internal Promotion Rate All the content presented in this PPT design is completely editable. Download it and make adjustments in color, background, font etc. as per your unique business setting.
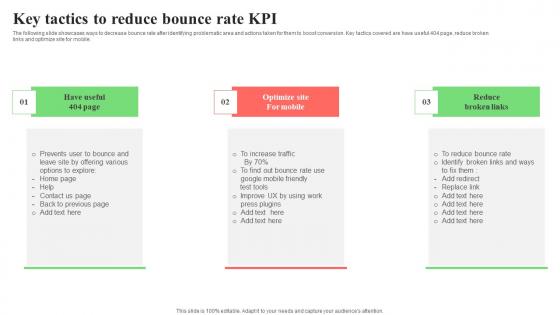
Key Tactics To Reduce Bounce Rate KPI Summary Pdf
The following slide showcases ways to decrease bounce rate after identifying problematic area and actions taken for them to boost conversion. Key tactics covered are have useful 404 page, reduce broken links and optimize site for mobile. Pitch your topic with ease and precision using this Key Tactics To Reduce Bounce Rate KPI Summary Pdf. This layout presents information on Reduce Broken, Optimize Site, Mobile. It is also available for immediate download and adjustment. So, changes can be made in the color, design, graphics or any other component to create a unique layout.

CRM KPI Metrics Suitable Customer Relationship Management CRM Mockup PDF
Presenting crm kpi metrics suitable customer relationship management crm mockup pdf to provide visual cues and insights. Share and navigate important information on five stages that need your due attention. This template can be used to pitch topics like crm kpi metrics. In addtion, this PPT design contains high resolution images, graphics, etc, that are easily editable and available for immediate download.
Content Marketing KPI Ppt PowerPoint Presentation Ideas Design Inspiration Cpb
Presenting this set of slides with name content marketing kpi ppt powerpoint presentation ideas design inspiration cpb. This is a six stage process. The stages in this process are content marketing kpi. This is a completely editable PowerPoint presentation and is available for immediate download. Download now and impress your audience.
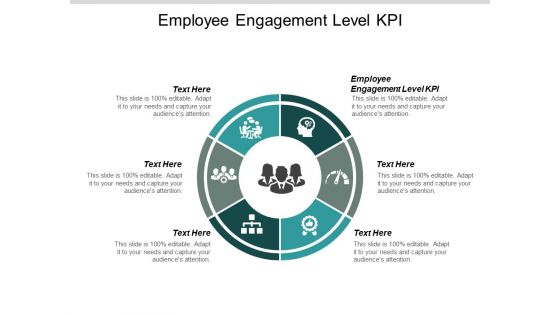
Employee Engagement Level Kpi Ppt PowerPoint Presentation Design Ideas Cpb
Presenting this set of slides with name employee engagement level kpi ppt powerpoint presentation design ideas cpb. This is a six stage process. The stages in this process are employee engagement level kpi. This is a completely editable PowerPoint presentation and is available for immediate download. Download now and impress your audience.

Email Marketing Automation Process KPI Dashboard Showcasing Email Marketing
This slide presents email marketing dashboard that track the health and success rate of multiple campaigns. It includes common email metrics such as open rate, sent, bounces, open rate, etc. Welcome to our selection of the Email Marketing Automation Process KPI Dashboard Showcasing Email Marketing. These are designed to help you showcase your creativity and bring your sphere to life. Planning and Innovation are essential for any business that is just starting out. This collection contains the designs that you need for your everyday presentations. All of our PowerPoints are 100 percent editable, so you can customize them to suit your needs. This multi-purpose template can be used in various situations. Grab these presentation templates today.

Robotic Process Automation Metrics Performance Overview KPI Dashboard Download PDF
This slide showcase Robotic process automation KPI dashboard for tracking the impact of robots failure. It also include metrics such as total bots, successful bots, failed bots, average execution time, bots success rate, etc. Showcasing this set of slides titled Robotic Process Automation Metrics Performance Overview KPI Dashboard Download PDF. The topics addressed in these templates are Robotic Process Automation, Metrics Performance Overview, Kpi Dashboard. All the content presented in this PPT design is completely editable. Download it and make adjustments in color, background, font etc. as per your unique business setting.
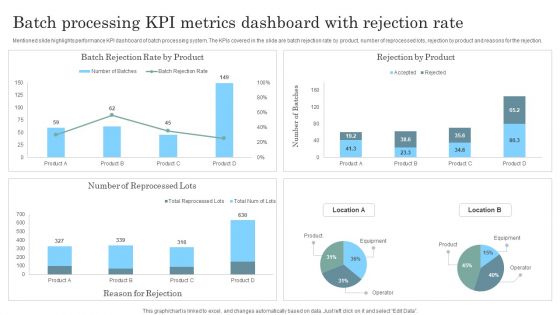
Batch Processing KPI Metrics Dashboard With Rejection Rate Topics PDF
Mentioned slide highlights performance KPI dashboard of batch processing system. The KPIs covered in the slide are batch rejection rate by product, number of reprocessed lots, rejection by product and reasons for the rejection. Pitch your topic with ease and precision using this Batch Processing KPI Metrics Dashboard With Rejection Rate Topics PDF. This layout presents information on Batch Processing KPI Metrics, Dashboard Rejection Rate. It is also available for immediate download and adjustment. So, changes can be made in the color, design, graphics or any other component to create a unique layout.
New Staff Onboarding Process KPI Tracking Dashboard Inspiration PDF
This slide showcase the KPI dashboard for tracking new hire onboarding completion progress. It includes KPIs such as onboarding completion status, employees per office, progress chart, hires starting in current and next week. Showcasing this set of slides titled New Staff Onboarding Process KPI Tracking Dashboard Inspiration PDF. The topics addressed in these templates are New Staff Onboarding Process, KPI Tracking Dashboard. All the content presented in this PPT design is completely editable. Download it and make adjustments in color, background, font etc. as per your unique business setting.

Continuous Process Improvement KPI Dashboard For IT Industry Clipart PDF
Following slide depicts the IT industry KPI dashboard which will assist in generating more of profit by improving strategic plan according to changing environment with clients preferences .The KPI mentioned in a slide are such as risk analysis, outstanding task , upcoming task, budget analysis, etc. Pitch your topic with ease and precision using this Continuous Process Improvement KPI Dashboard For IT Industry Clipart PDF. This layout presents information on Overall Progress, Risk Analysis, Budget Analysis. It is also available for immediate download and adjustment. So, changes can be made in the color, design, graphics or any other component to create a unique layout.

Corporate Scam Risk Analysis Report KPI Dashboard Themes PDF
Following slides show the report dashboard on corporate fraud risk which will assist in creating fraud prevention strategies .It includes KPI such as risk matrix, transaction split , transaction alert, etc. Pitch your topic with ease and precision using this Corporate Scam Risk Analysis Report KPI Dashboard Themes PDF. This layout presents information on Global Transaction Flow, Risk Matrix, Transaction Split, Analysis Report Kpi Dashboard. It is also available for immediate download and adjustment. So, changes can be made in the color, design, graphics or any other component to create a unique layout.
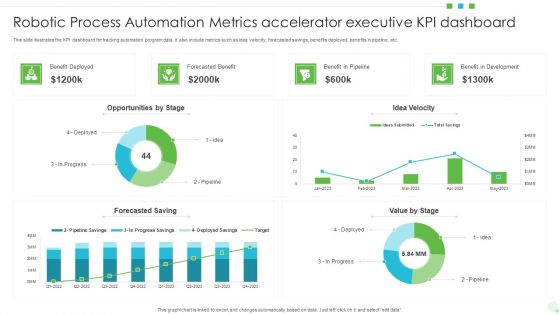
Robotic Process Automation Metrics Accelerator Executive KPI Dashboard Formats PDF
This slide illustrates the KPI dashboard for tracking automation program data. It also include metrics such as idea velocity, forecasted savings, benefits deployed, benefits in pipeline, etc. Showcasing this set of slides titled Robotic Process Automation Metrics Accelerator Executive KPI Dashboard Formats PDF. The topics addressed in these templates are Opportunities, Benefit In Development, Value. All the content presented in this PPT design is completely editable. Download it and make adjustments in color, background, font etc. as per your unique business setting.
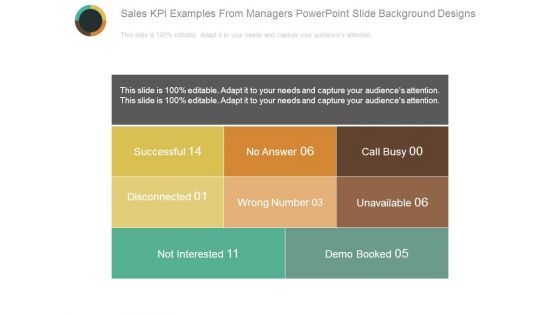
Sales Kpi Examples From Managers Powerpoint Slide Background Designs
This is a sales kpi examples from managers powerpoint slide background designs. This is a three stage process. The stages in this process are successful, no answer, call busy, disconnected, wrong number, unavailable, not interested, demo booked.
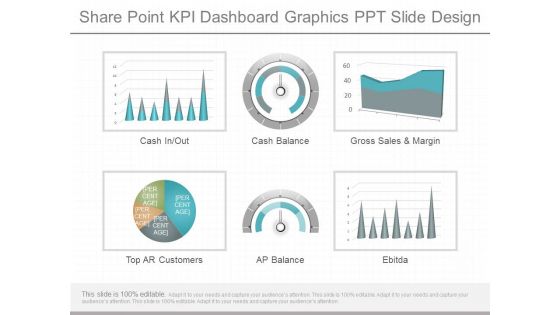
Share Point Kpi Dashboard Graphics Ppt Slide Design
This is a share point kpi dashboard graphics ppt slide design. This is a six stage process. The stages in this process are cash in out, cash balance, gross sales and margin, top ar customers, ap balance, ebitda.
Sales Kpi Tracker Ppt PowerPoint Presentation Pictures Designs
This is a sales kpi tracker ppt powerpoint presentation pictures designs. This is a two stage process. The stages in this process are leads created, sales ratio, opportunities won, top products in revenue, win ratio vs last yr.
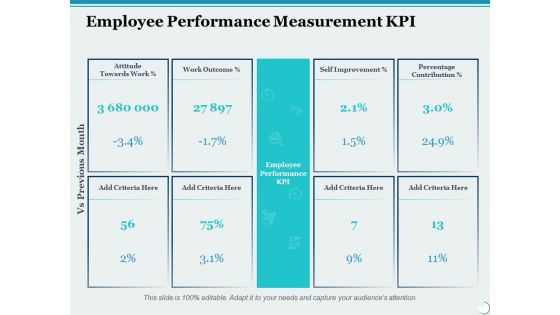
Employee Performance Measurement Kpi Ppt PowerPoint Presentation Inspiration Design Inspiration
This is a employee performance measurement kpi ppt powerpoint presentation inspiration design inspiration. This is a four stage process. The stages in this process are financial, business, management, marketing.
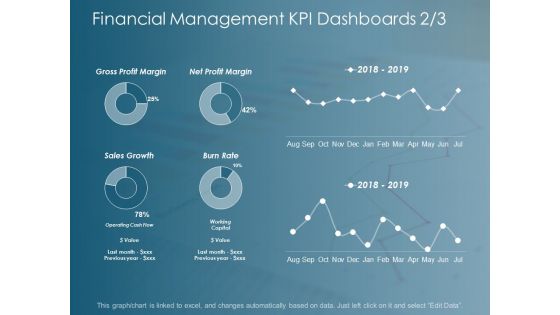
Financial Management Kpi Dashboards Business Ppt Powerpoint Presentation Inspiration Designs
This is a financial management kpi dashboards business ppt powerpoint presentation inspiration designs. This is a six stage process. The stages in this process are finance, marketing, management, investment, analysis.
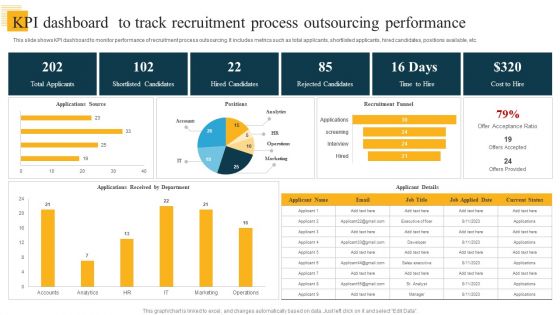
KPI Dashboard To Track Recruitment Process Outsourcing Performance Information PDF
This slide shows KPI dashboard to monitor performance of recruitment process outsourcing. It includes metrics such as total applicants, shortlisted applicants, hired candidates, positions available, etc. Showcasing this set of slides titled KPI Dashboard To Track Recruitment Process Outsourcing Performance Information PDF. The topics addressed in these templates are Shortlisted Candidates, Hired Candidates, Rejected Candidates. All the content presented in this PPT design is completely editable. Download it and make adjustments in color, background, font etc. as per your unique business setting.

Water Management KPI Metrics Showing Domestic Water Consumption Information PDF
Presenting water management KPI metrics showing domestic water consumption information pdf. to provide visual cues and insights. Share and navigate important information on three stages that need your due attention. This template can be used to pitch topics like water management kpi metrics showing domestic water consumption. In addtion, this PPT design contains high resolution images, graphics, etc, that are easily editable and available for immediate download.
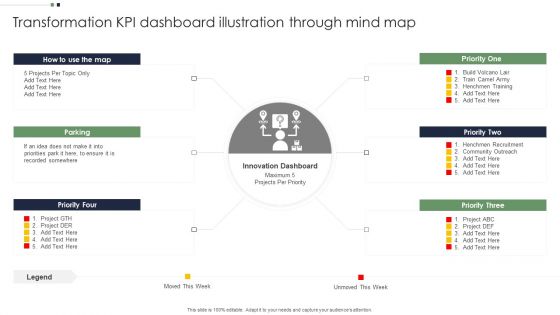
Transformation KPI Dashboard Illustration Through Mind Map Elements PDF
Persuade your audience using this Transformation KPI Dashboard Illustration Through Mind Map Elements PDF. This PPT design covers six stages, thus making it a great tool to use. It also caters to a variety of topics including Transformation KPI Dashboard, Illustration Through Mind Map. Download this PPT design now to present a convincing pitch that not only emphasizes the topic but also showcases your presentation skills.

Development And Operations KPI Dashboard IT Circular Diagram Graphics PDF
This is a development and operations kpi dashboard it circular diagram graphics pdf template with various stages. Focus and dispense information on seven stages using this creative set, that comes with editable features. It contains large content boxes to add your information on topics like circular diagram. You can also showcase facts, figures, and other relevant content using this PPT layout. Grab it now.
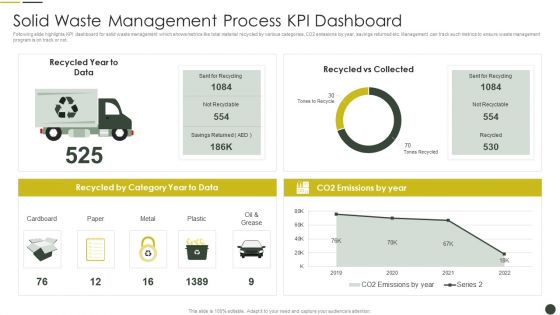
Solid Waste Management Process KPI Dashboard Pictures PDF
Following slide highlights KPI dashboard for solid waste management which shows metrics like total material recycled by various categories, CO2 emissions by year, savings returned etc. Management can track such metrics to ensure waste management program is on track or not.Showcasing this set of slides titled Solid Waste Management Process KPI Dashboard Pictures PDF The topics addressed in these templates are Recycled Category, Sent Recycling, Tones Recycle All the content presented in this PPT design is completely editable. Download it and make adjustments in color, background, font etc. as per your unique business setting.
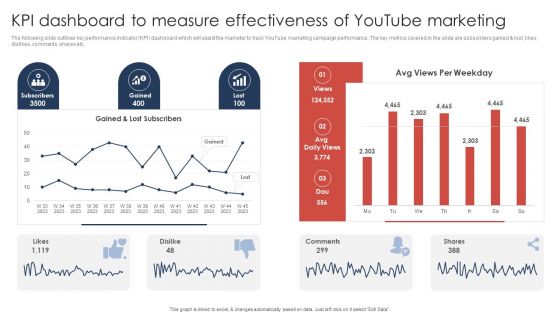
Kpi Dashboard To Measure Effectiveness Of Youtube Marketing Slides PDF
The following slide outlines key performance indicator KPI dashboard which will assist the marketer to track YouTube marketing campaign performance. The key metrics covered in the slide are subscribers gained and lost, likes, dislikes, comments, shares etc. Do you have an important presentation coming up Are you looking for something that will make your presentation stand out from the rest Look no further than Kpi Dashboard To Measure Effectiveness Of Youtube Marketing Slides PDF. With our professional designs, you can trust that your presentation will pop and make delivering it a smooth process. And with Slidegeeks, you can trust that your presentation will be unique and memorable. So why wait Grab Kpi Dashboard To Measure Effectiveness Of Youtube Marketing Slides PDF today and make your presentation stand out from the rest.
Dashboard For Cash Flow And Financial KPI Ratio Icons PDF
Showcasing this set of slides titled Dashboard For Cash Flow And Financial KPI Ratio Icons PDF. The topics addressed in these templates are Days Sales Outstanding, Days Payable Outstanding, Return On Assets. All the content presented in this PPT design is completely editable. Download it and make adjustments in color, background, font etc. as per your unique business setting.
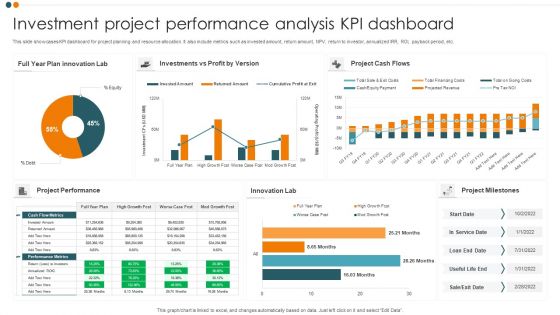
Investment Project Performance Analysis KPI Dashboard Professional PDF
This slide showcases KPI dashboard for project planning and resource allocation. It also include metrics such as invested amount, return amount, NPV, return to investor, annualized IRR, ROI, payback period, etc. Pitch your topic with ease and precision using this Investment Project Performance Analysis KPI Dashboard Professional PDF. This layout presents information on Project Cash Flows, Project Performance, Innovation Lab. It is also available for immediate download and adjustment. So, changes can be made in the color, design, graphics or any other component to create a unique layout.
KPI Dashboard For Tracking Financial Management Challenges Download PDF
Following slide demonstrates KPI dashboard for monitoring business cash flow management pain points to improve organisation financial performance. It includes elements such as quick ratio, current ration, annual cash balance, monthly cash balance, accounts receivable and payables, etc. Showcasing this set of slides titled KPI Dashboard For Tracking Financial Management Challenges Download PDF. The topics addressed in these templates are Monthly Cash Flow, Account Payable By Days, Annual Revenue, Annual Cost, Annual Net Profits. All the content presented in this PPT design is completely editable. Download it and make adjustments in color, background, font etc. as per your unique business setting.
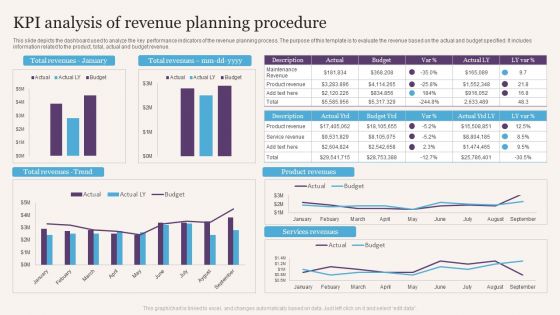
KPI Analysis Of Revenue Planning Procedure Professional PDF
This slide depicts the dashboard used to analyze the key performance indicators of the revenue planning process. The purpose of this template is to evaluate the revenue based on the actual and budget specified. It includes information related to the product, total, actual and budget revenue. Showcasing this set of slides titled KPI Analysis Of Revenue Planning Procedure Professional PDF. The topics addressed in these templates are Kpi Analysis, Revenue Planning Procedure. All the content presented in this PPT design is completely editable. Download it and make adjustments in color, background, font etc. as per your unique business setting.

Performance Measurement KPI Dashboard For Fintech Firm Topics PDF
Following slide portrays performance measurement dashboard for FinTech companies with KPIs namely available cash, cash flow, ROA, working capital ratio, days sales outstanding and days payable outstanding. Create an editable Performance Measurement KPI Dashboard For Fintech Firm Topics PDF that communicates your idea and engages your audience. Whether you are presenting a business or an educational presentation, pre designed presentation templates help save time. Performance Measurement KPI Dashboard For Fintech Firm Topics PDF is highly customizable and very easy to edit, covering many different styles from creative to business presentations. Slidegeeks has creative team members who have crafted amazing templates. So, go and get them without any delay.
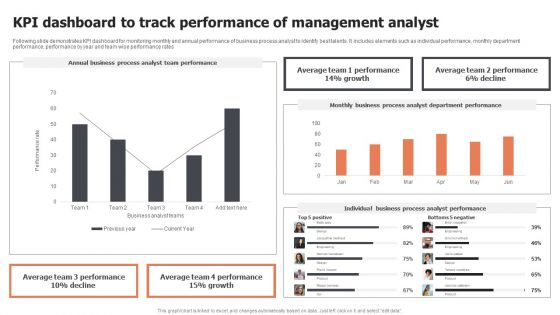
Kpi Dashboard To Track Performance Of Management Analyst Inspiration PDF
Following slide demonstrates KPI dashboard for monitoring monthly and annual performance of business process analyst to identify best talents. It includes elements such as individual performance, monthly department performance, performance by year and team wise performance rates. Showcasing this set of slides titled Kpi Dashboard To Track Performance Of Management Analyst Inspiration PDF. The topics addressed in these templates are Annual Business Process, Analyst Team Performance, Average Team. All the content presented in this PPT design is completely editable. Download it and make adjustments in color, background, font etc. as per your unique business setting.

Financial KPI Dashboard With Profit And Loss Analysis Designs PDF
Showcasing this set of slides titled Financial KPI Dashboard With Profit And Loss Analysis Designs PDF. The topics addressed in these templates are Assets And Liabilities, Cash Flow Analysis, Income And Expenses. All the content presented in this PPT design is completely editable. Download it and make adjustments in color, background, font etc. as per your unique business setting.
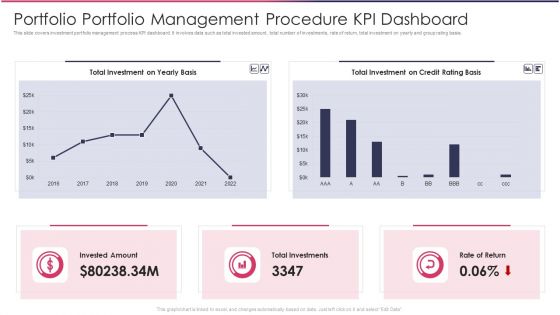
Portfolio Portfolio Management Procedure KPI Dashboard Demonstration PDF
This slide covers investment portfolio management process KPI dashboard. It involves data such as total invested amount, total number of investments, rate of return, total investment on yearly and group rating basis.Showcasing this set of slides titled Portfolio Portfolio Management Procedure KPI Dashboard Demonstration PDF The topics addressed in these templates are Total Investment, Credit Basis, Total Investments All the content presented in this PPT design is completely editable. Download it and make adjustments in color, background, font etc. as per your unique business setting.

Quarter Based Finance Review Kpi Ppt PowerPoint Presentation Background Designs
This is a quarter based finance review kpi ppt powerpoint presentation background designs. This is a five stage process. The stages in this process are cost of sales, gross profit, customer acquisition cost, other operating cost expense, operating profit, change in cash, ending cash.

Development And Operations KPI Dashboard With Successful Deployments Inspiration PDF
This template covers about total number of deployments with success ratio. Further, this slide includes average duration time and total breakdown due to errors in whole year.Showcasing this set of slides titled Development And Operations KPI Dashboard With Successful Deployments Inspiration PDF The topics addressed in these templates are Environment Deployments, Average Deployment, Breakdown Deployments All the content presented in this PPT design is completely editable. Download it and make adjustments in color, background, font etc. as per your unique business setting.
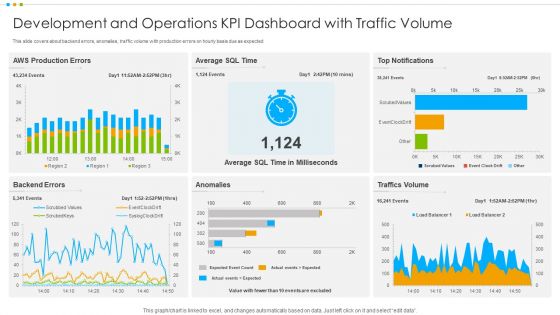
Development And Operations KPI Dashboard With Traffic Volume Professional PDF
This slide covers about backend errors, anomalies, traffic volume with production errors on hourly basis due as expected.Pitch your topic with ease and precision using this Development And Operations KPI Dashboard With Traffic Volume Professional PDF This layout presents information on Anomalies, Traffics Volume, Production Errors It is also available for immediate download and adjustment. So, changes can be made in the color, design, graphics or any other component to create a unique layout.

Development And Operations KPI Dashboard IT Timeline Diagrams PDF
This is a development and operations kpi dashboard it timeline diagrams pdf template with various stages. Focus and dispense information on five stages using this creative set, that comes with editable features. It contains large content boxes to add your information on topics like timeline, 2016 to 2021. You can also showcase facts, figures, and other relevant content using this PPT layout. Grab it now.

Recruitment Process KPI Dashboard With Cost Per Hire Demonstration PDF
The following slide highlights comprehensive employment process dashboard. The metrics covered in the dashboard are total sources of applications, vacancies statistics, recruitment decision and recruitment pipeline. Showcasing this set of slides titled recruitment process kpi dashboard with cost per hire demonstration pdf. The topics addressed in these templates are recruitment pipeline, resources, cost. All the content presented in this PPT design is completely editable. Download it and make adjustments in color, background, font etc. as per your unique business setting.
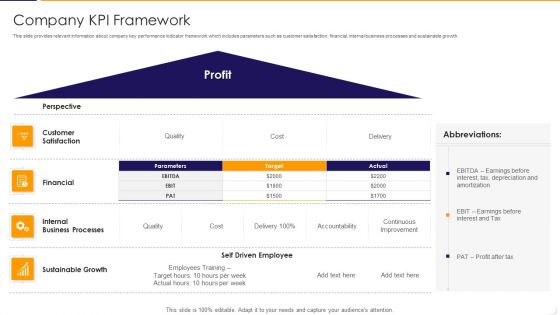
Company KPI Framework Ppt PowerPoint Presentation File Summary PDF
This slide provides relevant information about company key performance indicator framework which includes parameters such as customer satisfaction, financial, internal business processes and sustainable growth. Showcasing this set of slides titled company kpi framework ppt powerpoint presentation file summary pdf The topics addressed in these templates are financial, sustainable growth, customer satisfaction All the content presented in this PPT design is completely editable. Download it and make adjustments in color, background, font etc. as per your unique business setting.
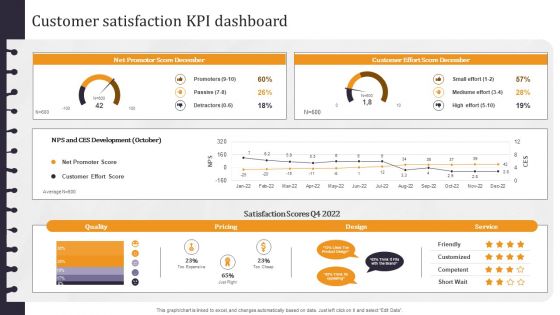
Developing Appealing Persona Customer Satisfaction Kpi Dashboard Microsoft PDF
This graph or chart is linked to excel, and changes automatically based on data. Just left click on it and select Edit Data. Do you have an important presentation coming up Are you looking for something that will make your presentation stand out from the rest Look no further than Developing Appealing Persona Customer Satisfaction Kpi Dashboard Microsoft PDF. With our professional designs, you can trust that your presentation will pop and make delivering it a smooth process. And with Slidegeeks, you can trust that your presentation will be unique and memorable. So why wait Grab Developing Appealing Persona Customer Satisfaction Kpi Dashboard Microsoft PDF today and make your presentation stand out from the rest
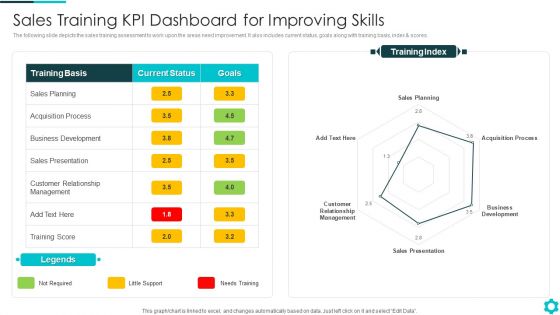
Sales Training KPI Dashboard For Improving Skills Portrait PDF
The following slide depicts the sales training assessment to work upon the areas need improvement. It also includes current status, goals along with training basis, index and scores.Showcasing this set of slides titled Sales Training KPI Dashboard For Improving Skills Portrait PDF The topics addressed in these templates are Acquisition Process, Sales Presentation, Customer Relationship Management All the content presented in this PPT design is completely editable. Download it and make adjustments in color, background, font etc. as per your unique business setting.
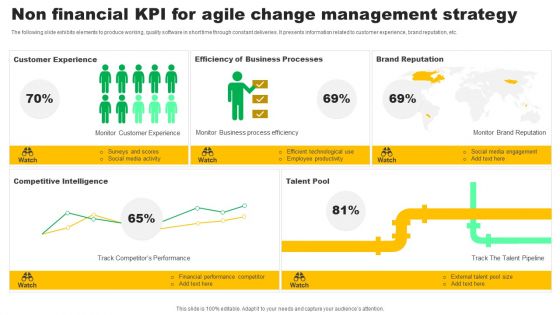
Non Financial KPI For Agile Change Management Strategy Rules PDF
The following slide exhibits elements to produce working, quality software in short time through constant deliveries. It presents information related to customer experience, brand reputation, etc. Showcasing this set of slides titled Non Financial KPI For Agile Change Management Strategy Rules PDF. The topics addressed in these templates are Customer Experience, Processes, Brand Reputation. All the content presented in this PPT design is completely editable. Download it and make adjustments in color, background, font etc. as per your unique business setting.
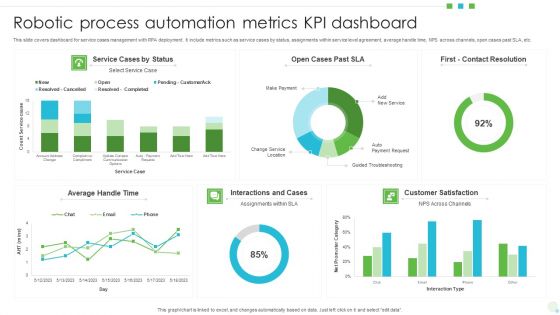
Robotic Process Automation Metrics KPI Dashboard Themes PDF
This slide covers dashboard for service cases management with RPA deployment. It include metrics such as service cases by status, assignments within service level agreement, average handle time, NPS across channels, open cases past SLA, etc. Showcasing this set of slides titled Robotic Process Automation Metrics KPI Dashboard Themes PDF. The topics addressed in these templates are Average, Service Cases, Customer Satisfaction. All the content presented in this PPT design is completely editable. Download it and make adjustments in color, background, font etc. as per your unique business setting.

Managing Business Cash Kpi Dashboard With Trade Receivables Slides PDF
Following slide depicts a key performing indicator dashboard for tracking cash flow management with special emphasis on trade receivables and payables. Key metrics include profit before, cash from operating activities, Cash flow from financing activities etc. Showcasing this set of slides titled Managing Business Cash Kpi Dashboard With Trade Receivables Slides PDF. The topics addressed in these templates are Inventory Outstanding, Payable Outstanding, Receivables Outstanding. All the content presented in this PPT design is completely editable. Download it and make adjustments in color, background, font etc. as per your unique business setting.
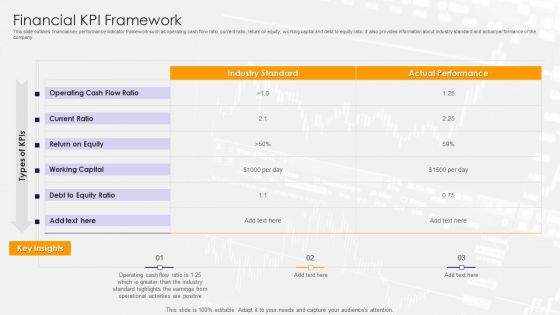
Financial KPI Framework Ppt PowerPoint Presentation Gallery Show PDF
This slide outlines financial key performance indicator framework such as operating cash flow ratio, current ratio, return on equity, working capital and debt to equity ratio. It also provides information about industry standard and actual performance of the company. Showcasing this set of slides titled financial kpi framework ppt powerpoint presentation gallery show pdf. The topics addressed in these templates are current ratio, working capital, equity. All the content presented in this PPT design is completely editable. Download it and make adjustments in color, background, font etc. as per your unique business setting.

KPI To Track Manufacturing Workflow Automated Progress Introduction PDF
Mentioned slide illustrates key performance indicators which can be used by business to evaluate organization functioning. It includes key performance indicators such as total production undetected units produced, defected units produced, process accuracy, and process velocity. Showcasing this set of slides titled KPI To Track Manufacturing Workflow Automated Progress Introduction PDF. The topics addressed in these templates are Undetected Units Produced, Defected Products Produced, Average Production Time. All the content presented in this PPT design is completely editable. Download it and make adjustments in color, background, font etc. as per your unique business setting.

KPI Dashboard Showcasing Product Management Revenue Analysis Portrait PDF
This slide provides dashboard showcasing product development project overview with completion status. It provides information regarding cash flow statements, completion progress, project overview and product approval status. Pitch your topic with ease and precision using this KPI Dashboard Showcasing Product Management Revenue Analysis Portrait PDF. This layout presents information on Completion Progress, Product Approval Status, Cash Flow Statements. It is also available for immediate download and adjustment. So, changes can be made in the color, design, graphics or any other component to create a unique layout.
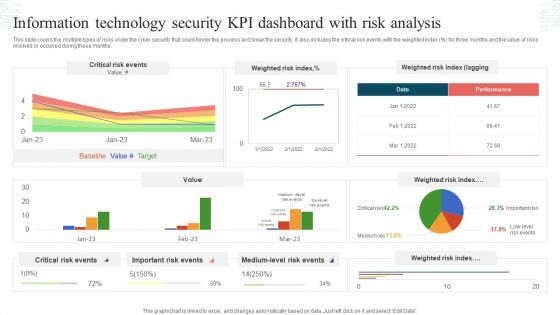
Information Technology Security KPI Dashboard With Risk Analysis Topics PDF
This slide covers the multiple types of risks under the cyber security that could hinder the process and break the security. It also includes the critical risk events with the weighted index percent for three months and the value of risks involved or occurred during these months. Showcasing this set of slides titled Information Technology Security KPI Dashboard With Risk Analysis Topics PDF. The topics addressed in these templates are Critical Risk Events, Weighted Risk Index, Important Risk Events. All the content presented in this PPT design is completely editable. Download it and make adjustments in color, background, font etc. as per your unique business setting.

KPI Dashboard To Evaluate Energy Consumption Designs PDF
The following slide depicts dashboard to measure energy utilization during the year at workplace to gain operational efficiency and develop smart ways to save for future. It includes elements such as progress by segment, transport, waste management, packaging, warehousing etc. Do you know about Slidesgeeks KPI Dashboard To Evaluate Energy Consumption Designs PDF These are perfect for delivering any kind od presentation. Using it, create PowerPoint presentations that communicate your ideas and engage audiences. Save time and effort by using our pre designed presentation templates that are perfect for a wide range of topic. Our vast selection of designs covers a range of styles, from creative to business, and are all highly customizable and easy to edit. Download as a PowerPoint template or use them as Google Slides themes.

Optimizing Online Stores Customer Checkout Behavior KPI Dashboard Brochure PDF
This slide represents the dashboard to help management in analyzing the point at which customers leave the checkout process. It includes details related to KPIs such as shipping drop-off, payment drop-off etc. Slidegeeks is here to make your presentations a breeze with Optimizing Online Stores Customer Checkout Behavior KPI Dashboard Brochure PDF With our easy-to-use and customizable templates, you can focus on delivering your ideas rather than worrying about formatting. With a variety of designs to choose from, youre sure to find one that suits your needs. And with animations and unique photos, illustrations, and fonts, you can make your presentation pop. So whether youre giving a sales pitch or presenting to the board, make sure to check out Slidegeeks first.

Development And Operations KPI Dashboard With Deployment Status And Uptime Structure PDF
This slide covers about devops dashboard recording deployment status on daily basis with regional uptime according service level agreement.Showcasing this set of slides titled Development And Operations KPI Dashboard With Deployment Status And Uptime Structure PDF The topics addressed in these templates are Development Operations, Kpi Dashboard, Deployment Uptime All the content presented in this PPT design is completely editable. Download it and make adjustments in color, background, font etc. as per your unique business setting.

Development And Operations KPI Dashboard With Test Cast Status Graphics PDF
This slide template covers about devops dashboard key performing indicators with work items assigned details , work status and resource availability.Pitch your topic with ease and precision using this Development And Operations KPI Dashboard With Test Cast Status Graphics PDF This layout presents information on Items Requirement, Requirement Base, Assigned It is also available for immediate download and adjustment. So, changes can be made in the color, design, graphics or any other component to create a unique layout.
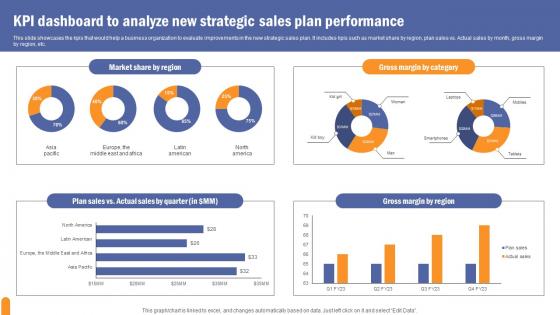
KPI Dashboard To Analyze Developing Extensive Sales And Operations Strategy Slides Pdf
This slide showcases the kpis that would help a business organization to evaluate improvements in the new strategic sales plan. It includes kpis such as market share by region, plan sales vs. Actual sales by month, gross margin by region, etc. Explore a selection of the finest KPI Dashboard To Analyze Developing Extensive Sales And Operations Strategy Slides Pdf here. With a plethora of professionally designed and pre made slide templates, you can quickly and easily find the right one for your upcoming presentation. You can use our KPI Dashboard To Analyze Developing Extensive Sales And Operations Strategy Slides Pdf to effectively convey your message to a wider audience. Slidegeeks has done a lot of research before preparing these presentation templates. The content can be personalized and the slides are highly editable. Grab templates today from Slidegeeks.

Customer Support KPI Dashboard To Track Business Process Outsourcing Company Performance Rules Pdf Wd
Following slide demonstrates KPI dashboard for monitoring performance of BPO firm providing customer support services to determine growth rate. It includes elements such as total revenue, cost percentage by revenue, customer experience, etc. Showcasing this set of slides titled Customer Support KPI Dashboard To Track Business Process Outsourcing Company Performance Rules Pdf Wd. The topics addressed in these templates are Customer Experience, Total Revenue. All the content presented in this PPT design is completely editable. Download it and make adjustments in color, background, font etc. as per your unique business setting.

KPI Dashboard To Assess Training Program Effectiveness Proven Techniques For Enhancing Summary Pdf
This slide covers KPI dashboard to assess training program effectiveness. It involves details such as overall responses on monthly basis, employee satisfaction rate, net promoter score and major training courses. Do you have an important presentation coming up Are you looking for something that will make your presentation stand out from the rest Look no further than KPI Dashboard To Assess Training Program Effectiveness Proven Techniques For Enhancing Summary Pdf. With our professional designs, you can trust that your presentation will pop and make delivering it a smooth process. And with Slidegeeks, you can trust that your presentation will be unique and memorable. So why wait Grab KPI Dashboard To Assess Training Program Effectiveness Proven Techniques For Enhancing Summary Pdf today and make your presentation stand out from the rest.
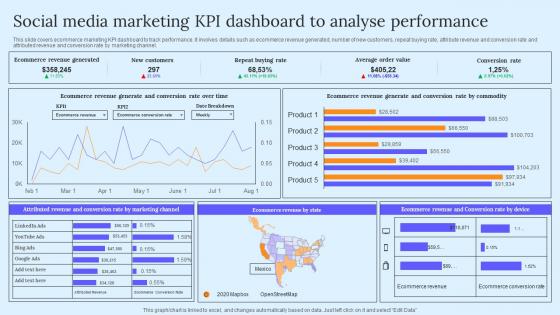
Social Media Marketing KPI Dashboard B2B Marketing Techniques To Attract Potential Pictures Pdf
This slide covers ecommerce marketing KPI dashboard to track performance. It involves details such as ecommerce revenue generated, number of new customers, repeat buying rate, attribute revenue and conversion rate and attributed revenue and conversion rate by marketing channel. Do you have an important presentation coming up Are you looking for something that will make your presentation stand out from the rest Look no further than Social Media Marketing KPI Dashboard B2B Marketing Techniques To Attract Potential Pictures Pdf. With our professional designs, you can trust that your presentation will pop and make delivering it a smooth process. And with Slidegeeks, you can trust that your presentation will be unique and memorable. So why wait Grab Social Media Marketing KPI Dashboard B2B Marketing Techniques To Attract Potential Pictures Pdf today and make your presentation stand out from the rest
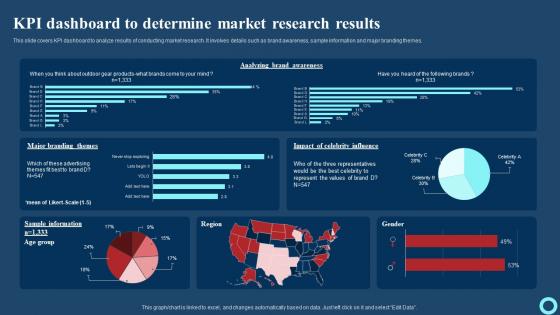
KPI Dashboard To Determine Market Research Results Effective Strategies To Enhance Structure Pdf
This slide covers KPI dashboard to analyze results of conducting market research. It involves details such as brand awareness, sample information and major branding themes. Do you have an important presentation coming up Are you looking for something that will make your presentation stand out from the rest Look no further than KPI Dashboard To Determine Market Research Results Effective Strategies To Enhance Structure Pdf With our professional designs, you can trust that your presentation will pop and make delivering it a smooth process. And with Slidegeeks, you can trust that your presentation will be unique and memorable. So why wait Grab KPI Dashboard To Determine Market Research Results Effective Strategies To Enhance Structure Pdf today and make your presentation stand out from the rest.

Comparing Current Recruitment Kpi With Industry Analysing Hr Data For Effective Decision Making
This slide provides highlights about comparative assessment of multiple recruitment metrics with industry standards. It includes parameters such as time to hire, cost per hire, turnover rate, offer acceptance rate, qualified candidates per opening, etc. Do you have an important presentation coming up Are you looking for something that will make your presentation stand out from the rest Look no further than Comparing Current Recruitment Kpi With Industry Analysing Hr Data For Effective Decision Making. With our professional designs, you can trust that your presentation will pop and make delivering it a smooth process. And with Slidegeeks, you can trust that your presentation will be unique and memorable. So why wait Grab Comparing Current Recruitment Kpi With Industry Analysing Hr Data For Effective Decision Making today and make your presentation stand out from the rest
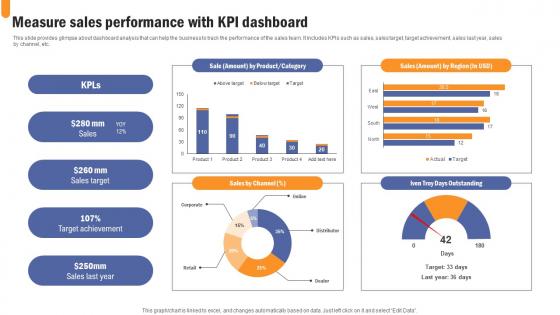
Measure Sales Performance With KPI Developing Extensive Sales And Operations Strategy Brochure Pdf
This slide provides glimpse about dashboard analysis that can help the business to track the performance of the sales team. It includes KPIs such as sales, sales target, target achievement, sales last year, sales by channel, etc. The best PPT templates are a great way to save time, energy, and resources. Slidegeeks have 100 percent editable powerpoint slides making them incredibly versatile. With these quality presentation templates, you can create a captivating and memorable presentation by combining visually appealing slides and effectively communicating your message. Download Measure Sales Performance With KPI Developing Extensive Sales And Operations Strategy Brochure Pdf from Slidegeeks and deliver a wonderful presentation.
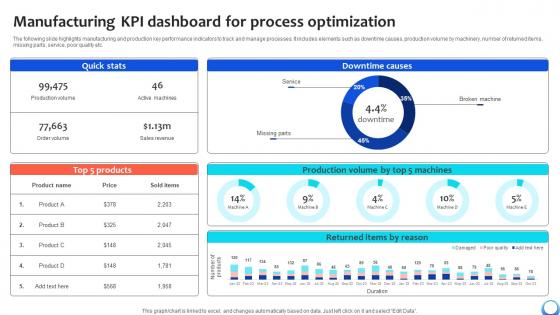
Manufacturing KPI Dashboard For Process Optimization Automating Production Process Strategy SS V
The following slide highlights manufacturing and production key performance indicators to track and manage processes. It includes elements such as downtime causes, production volume by machinery, number of returned items, missing parts, service, poor quality etc. Formulating a presentation can take up a lot of effort and time, so the content and message should always be the primary focus. The visuals of the PowerPoint can enhance the presenters message, so our Manufacturing KPI Dashboard For Process Optimization Automating Production Process Strategy SS V was created to help save time. Instead of worrying about the design, the presenter can concentrate on the message while our designers work on creating the ideal templates for whatever situation is needed. Slidegeeks has experts for everything from amazing designs to valuable content, we have put everything into Manufacturing KPI Dashboard For Process Optimization Automating Production Process Strategy SS V
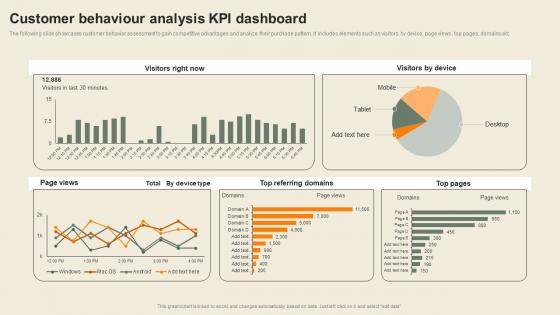
Customer Behaviour Analysis KPI Dashboard Usability Of CDP Software Tool Graphics Pdf
The following slide showcases customer behavior assessment to gain competitive advantages and analyze their purchase pattern. It includes elements such as visitors, by device, page views, top pages, domains etc. Do you have an important presentation coming up Are you looking for something that will make your presentation stand out from the rest Look no further than Customer Behaviour Analysis KPI Dashboard Usability Of CDP Software Tool Graphics Pdf. With our professional designs, you can trust that your presentation will pop and make delivering it a smooth process. And with Slidegeeks, you can trust that your presentation will be unique and memorable. So why wait Grab Customer Behaviour Analysis KPI Dashboard Usability Of CDP Software Tool Graphics Pdf today and make your presentation stand out from the rest
Ultimate Guide To Cold Calling Sources Tracking Kpi Dashboard SA SS V
This slide outlines a call-tracking dashboard that helps marketers to track call quality, encompassing volume of calls, top call sources, total calls, etc. Do you have an important presentation coming up Are you looking for something that will make your presentation stand out from the rest Look no further than Ultimate Guide To Cold Calling Sources Tracking Kpi Dashboard SA SS V. With our professional designs, you can trust that your presentation will pop and make delivering it a smooth process. And with Slidegeeks, you can trust that your presentation will be unique and memorable. So why wait Grab Ultimate Guide To Cold Calling Sources Tracking Kpi Dashboard SA SS V today and make your presentation stand out from the rest
Civil Infrastructure Designing Services Management Kpi Metrics And Dashboard Topics PDF
This is a civil infrastructure designing services management kpi metrics and dashboard topics pdf template with various stages. Focus and dispense information on two stages using this creative set, that comes with editable features. It contains large content boxes to add your information on topics like kpi metrics, kpi dashboards. You can also showcase facts, figures, and other relevant content using this PPT layout. Grab it now.
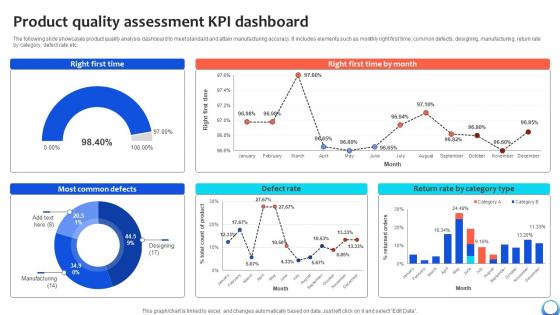
Product Quality Assessment KPI Dashboard Automating Production Process Strategy SS V
The following slide showcases product quality analysis dashboard to meet standard and attain manufacturing accuracy. It includes elements such as monthly right first time, common defects, designing, manufacturing, return rate by category, defect rate etc. Take your projects to the next level with our ultimate collection of Product Quality Assessment KPI Dashboard Automating Production Process Strategy SS V. Slidegeeks has designed a range of layouts that are perfect for representing task or activity duration, keeping track of all your deadlines at a glance. Tailor these designs to your exact needs and give them a truly corporate look with your own brand colors they will make your projects stand out from the rest

Power Management System And Technology KPI Metrics And Dashboard Ppt PowerPoint Presentation Outline Designs Download PDF
Presenting this set of slides with name power management system and technology kpi metrics and dashboard ppt powerpoint presentation outline designs download pdf. This is a two stage process. The stages in this process are kpi metrics, dashboard. This is a completely editable PowerPoint presentation and is available for immediate download. Download now and impress your audience.
Robotic Process Automation Metrics Performance Analysis KPI Dashboard Icon Graphics PDF
Pitch your topic with ease and precision using this Robotic Process Automation Metrics Performance Analysis KPI Dashboard Icon Graphics PDF. This layout presents information on Robotic Process Automation Metrics, Performance Analysis, Kpi Dashboard Icon. It is also available for immediate download and adjustment. So, changes can be made in the color, design, graphics or any other component to create a unique layout.
Employee Engagement Kpi Examples Ppt PowerPoint Presentation Gallery Design Ideas Cpb
Presenting this set of slides with name employee engagement kpi examples ppt powerpoint presentation gallery design ideas cpb. This is a three stage process. The stages in this process are employee engagement kpi examples. This is a completely editable PowerPoint presentation and is available for immediate download. Download now and impress your audience.
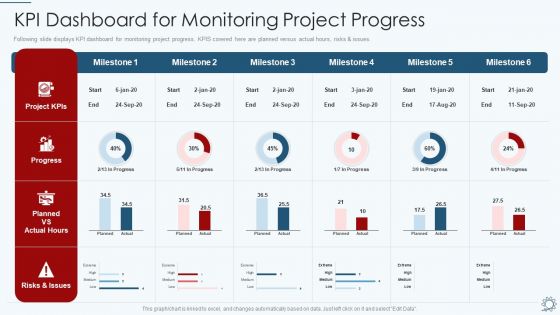
Development And Operations Pipeline IT KPI Dashboard For Monitoring Project Progress Ideas PDF
Following slide displays KPI dashboard for monitoring project progress. KPIS covered here are planned versus actual hours, risks and issues. Deliver and pitch your topic in the best possible manner with this development and operations pipeline it kpi dashboard for monitoring project progress ideas pdf. Use them to share invaluable insights on project kpis, progress, planned vs actual hours, risks and issues and impress your audience. This template can be altered and modified as per your expectations. So, grab it now.
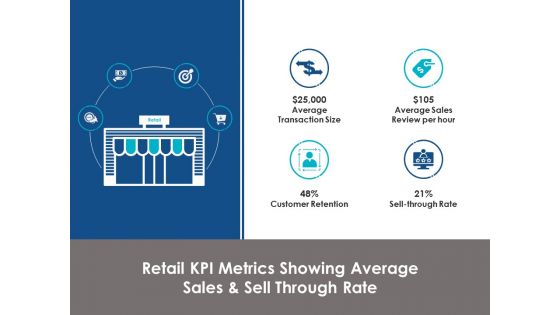
Retail Kpi Metrics Showing Average Sales And Sell Through Rate Ppt Powerpoint Presentation Styles Designs
This is a retail kpi metrics showing average sales and sell through rate ppt powerpoint presentation styles designs. This is a four stage process. The stages in this process are marketing, business, management, planning, strategy.
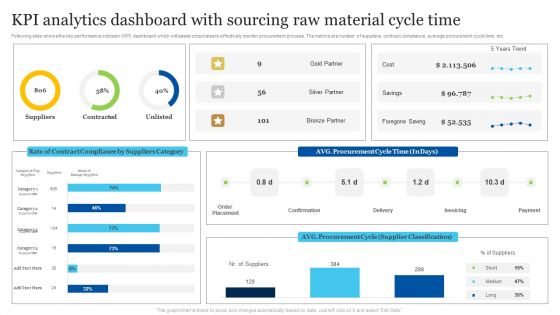
KPI Analytics Dashboard With Sourcing Raw Material Cycle Time Inspiration PDF
Following slide shows the key performance indicator KPI dashboard which will assist corporates to effectively monitor procurement process. The metrics are number of suppliers, contract compliance, average procurement cycle time, etc. Showcasing this set of slides titled KPI Analytics Dashboard With Sourcing Raw Material Cycle Time Inspiration PDF. The topics addressed in these templates are Kpi Analytics Dashboard, Sourcing Raw Material, Cycle Time. All the content presented in this PPT design is completely editable. Download it and make adjustments in color, background, font etc. as per your unique business setting.
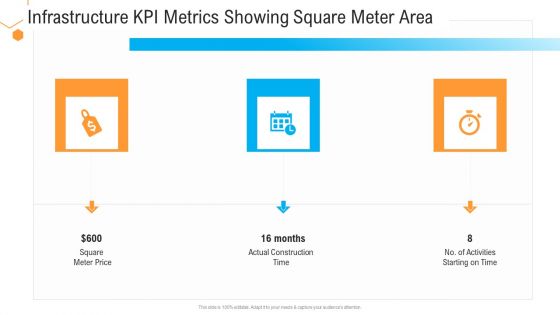
Civil Infrastructure Designing Services Management Infrastructure Kpi Metrics Showing Square Meter Area Slides PDF
Presenting civil infrastructure designing services management infrastructure kpi metrics showing square meter area slides pdf to provide visual cues and insights. Share and navigate important information on three stages that need your due attention. This template can be used to pitch topics like infrastructure kpi metrics showing square meter area. In addtion, this PPT design contains high resolution images, graphics, etc, that are easily editable and available for immediate download.
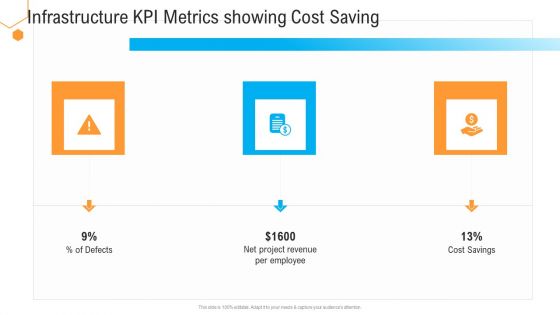
Civil Infrastructure Designing Services Management Infrastructure Kpi Metrics Showing Cost Saving Elements PDF
This is a civil infrastructure designing services management infrastructure kpi metrics showing cost saving elements pdf template with various stages. Focus and dispense information on three stages using this creative set, that comes with editable features. It contains large content boxes to add your information on topics like infrastructure kpi metrics showing cost saving. You can also showcase facts, figures, and other relevant content using this PPT layout. Grab it now.

Marketing Management Kpi Metrics Strategy Ppt PowerPoint Presentation Ideas Design Templates
This is a marketing management kpi metrics strategy ppt powerpoint presentation ideas design templates. This is a five stage process. The stages in this process are compare, marketing, business, management, planning.

Retail KPI Dashboard Showing Sales Revenue Customers Ppt PowerPoint Presentation Show Background Designs
This is a retail kpi dashboard showing sales revenue customers ppt powerpoint presentation show background designs. This is a six stage process. The stages in this process are finance, analysis, business, investment, marketing.

Kpi Dashboard To Assess Performance Of Client Onboarding Procedure Designs PDF
This slide covers KPI dashboard to assess performance of customer onboarding process. It involves details such as retail customers, SMB, current accounts and deposits. Showcasing this set of slides titled Kpi Dashboard To Assess Performance Of Client Onboarding Procedure Designs PDF. The topics addressed in these templates are Retail Customers, Accounts Current, Deposits. All the content presented in this PPT design is completely editable. Download it and make adjustments in color, background, font etc. as per your unique business setting.
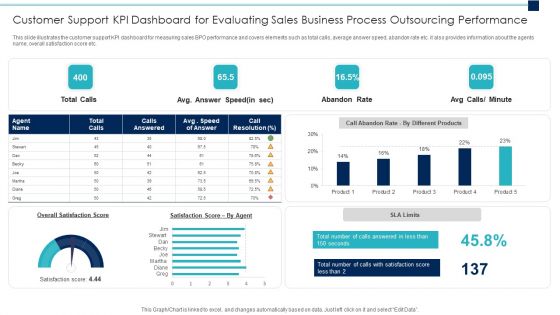
Customer Support Kpi Dashboard For Evaluating Sales Business Process Outsourcing Performance Slides PDF
Pitch your topic with ease and precision using this customer support kpi dashboard for evaluating sales business process outsourcing performance slides pdf. This layout presents information on customer support kpi dashboard for evaluating sales business process outsourcing performance. It is also available for immediate download and adjustment. So, changes can be made in the color, design, graphics or any other component to create a unique layout.
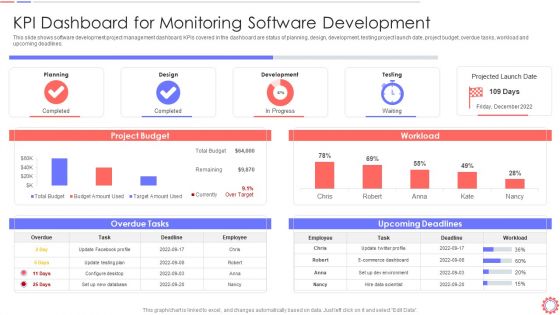
Developer Operations Automated Tools And Initiatives IT KPI Dashboard For Monitoring Demonstration PDF
This slide shows software development project management dashboard. KPIs covered in the dashboard are status of planning, design, development, testing project launch date, project budget, overdue tasks, workload and upcoming deadlines. Deliver an awe inspiring pitch with this creative developer operations automated tools and initiatives it kpi dashboard for monitoring demonstration pdf bundle. Topics like kpi dashboard for monitoring software development can be discussed with this completely editable template. It is available for immediate download depending on the needs and requirements of the user.

Kpi Metrics Dashboard To Measure Automation Performanceoptimizing Business Processes Through Automation Download PDF
The following slide outlines a comprehensive KPI dashboard which can be used by the organization to measure the automation performance in customer support department. It covers KPIs such as customer retention, costs per support, customer satisfaction, etc. Get a simple yet stunning designed Kpi Metrics Dashboard To Measure Automation Performanceoptimizing Business Processes Through Automation Download PDF. It is the best one to establish the tone in your meetings. It is an excellent way to make your presentations highly effective. So, download this PPT today from Slidegeeks and see the positive impacts. Our easy to edit Kpi Metrics Dashboard To Measure Automation Performanceoptimizing Business Processes Through Automation Download PDF can be your go to option for all upcoming conferences and meetings. So, what are you waiting for Grab this template today.

KPI Metrics To Track Effectiveness Of Sourcing Raw Material Process Portrait PDF
Following slide shows the multiple key performance indicators KPI which will assist firms to evaluate the success of procurement process. The metrics outlined in the slide are compliance rate, purchase order cycle time, supplier quality rating, supplier defect rate, and procurement return on investment ROI. Pitch your topic with ease and precision using this KPI Metrics To Track Effectiveness Of Sourcing Raw Material Process Portrait PDF. This layout presents information on Purchase Order Cycle Time, Supplier Defect Rate, Procurement Roi. It is also available for immediate download and adjustment. So, changes can be made in the color, design, graphics or any other component to create a unique layout.
Development And Operations KPI Dashboard IT Post It Notes Inspiration PDF
Presenting development and operations kpi dashboard it post it notes inspiration pdf to provide visual cues and insights. Share and navigate important information on four stages that need your due attention. This template can be used to pitch topics like post it notes. In addtion, this PPT design contains high resolution images, graphics, etc, that are easily editable and available for immediate download.
Icons Slide For Development And Operations KPI Dashboard IT Clipart PDF
Introducing our well designed icons slide for development and operations kpi dashboard it clipart pdf set of slides. The slide displays editable icons to enhance your visual presentation. The icons can be edited easily. So customize according to your business to achieve a creative edge. Download and share it with your audience.

KPI Dashboard To Analyze Performance Of Healthcare Financial Department Summary PDF
The following slide showcases key performance indicator KPI dashboard which can be used to analyze the financial performance of hospital. The metrics covered in the slide are net profit margin, income and expenses, etc. Do you have an important presentation coming up Are you looking for something that will make your presentation stand out from the rest Look no further than KPI Dashboard To Analyze Performance Of Healthcare Financial Department Summary PDF. With our professional designs, you can trust that your presentation will pop and make delivering it a smooth process. And with Slidegeeks, you can trust that your presentation will be unique and memorable. So why wait Grab KPI Dashboard To Analyze Performance Of Healthcare Financial Department Summary PDF today and make your presentation stand out from the rest.

Business Continuous Process Improvement KPI Dashboard In Healthcare Industry Guidelines PDF
Following slides shows the complete outline of healthcare business process improvement KPI dashboard which will assist in providing better services to patients . The major metrics mentioned in a slide are such as average patients discharge by hour or on weekly basis Showcasing this set of slides titled Business Continuous Process Improvement KPI Dashboard In Healthcare Industry Guidelines PDF. The topics addressed in these templates are Patients, Discharge List, Healthcare Industry. All the content presented in this PPT design is completely editable. Download it and make adjustments in color, background, font etc. as per your unique business setting.

Market Research Assessment Of Target Market Requirements Brand Analytics Kpi Dashboard For Organization Clipart PDF
The following slide outlines key performance indicator KPI dashboard that can assist marketers to evaluate brand performance on social media channels. The metrics covered are age group, gender, brand perception, branding themes, celebrity analysis, etc. Do you have an important presentation coming up Are you looking for something that will make your presentation stand out from the rest Look no further than Market Research Assessment Of Target Market Requirements Brand Analytics Kpi Dashboard For Organization Clipart PDF. With our professional designs, you can trust that your presentation will pop and make delivering it a smooth process. And with Slidegeeks, you can trust that your presentation will be unique and memorable. So why wait Grab Market Research Assessment Of Target Market Requirements Brand Analytics Kpi Dashboard For Organization Clipart PDF today and make your presentation stand out from the rest.
Robotic Process Automation Dashboard With Monthly Test Execution KPI Icons PDF
This slide covers RPA metrics for analyzing test execution on automated platforms. It also includes test execution metrics such as total test executed, test status, tests executed daily for different operation systems, etc. Pitch your topic with ease and precision using this Robotic Process Automation Dashboard With Monthly Test Execution KPI Icons PDF. This layout presents information on Robotic Process Automation Dashboard, Monthly Test Execution Kpi. It is also available for immediate download and adjustment. So, changes can be made in the color, design, graphics or any other component to create a unique layout.
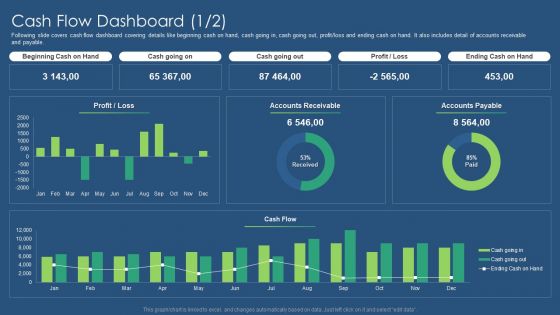
Sustainability Calculation With KPI Cash Flow Dashboard Cash Designs PDF Rules PDF
Deliver an awe inspiring pitch with this creative sustainability calculation with kpi customer satisfaction dashboard target professional pdf bundle. Topics like customer satisfaction dashboard can be discussed with this completely editable template. It is available for immediate download depending on the needs and requirements of the user.
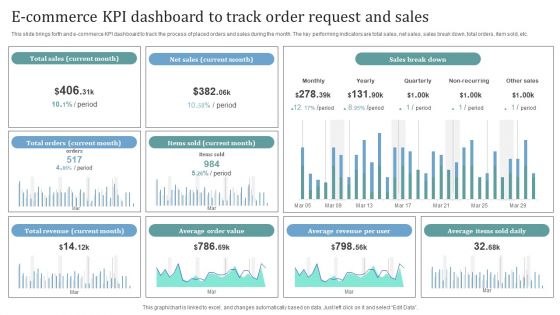
E Commerce KPI Dashboard To Track Order Request And Sales Introduction PDF
This slide brings forth and e commerce KPI dashboard to track the process of placed orders and sales during the month. The key performing indicators are total sales, net sales, sales break down, total orders, item sold, etc. Showcasing this set of slides titled E Commerce KPI Dashboard To Track Order Request And Sales Introduction PDF. The topics addressed in these templates are Total Sales, Net Sales, Sales Break Down. All the content presented in this PPT design is completely editable. Download it and make adjustments in color, background, font etc. as per your unique business setting.
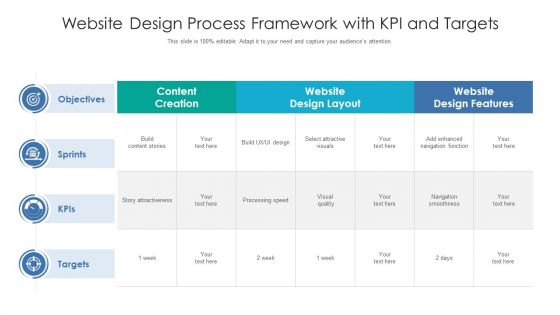
Website Design Process Framework With KPI And Targets Ppt PowerPoint Presentation Gallery Gridlines PDF
Showcasing this set of slides titled website design process framework with kpi and targets ppt powerpoint presentation gallery gridlines pdf. The topics addressed in these templates are objectives, sprints, targets. All the content presented in this PPT design is completely editable. Download it and make adjustments in color, background, font etc. as per your unique business setting.
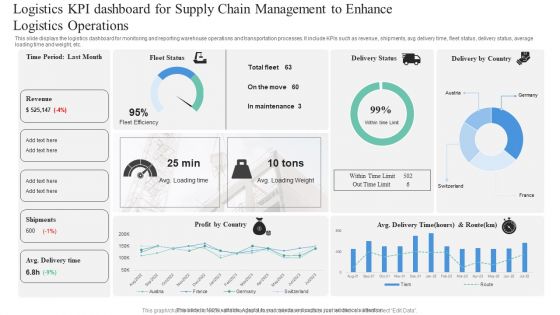
Logistics KPI Dashboard For Supply Chain Management To Enhance Logistics Operations Professional PDF
This slide displays the logistics dashboard for monitoring and reporting warehouse operations and transportation processes. It include KPIs such as revenue, shipments, avg delivery time, fleet status, delivery status, average loading time and weight, etc. Pitch your topic with ease and precision using this Logistics KPI Dashboard For Supply Chain Management To Enhance Logistics Operations Professional PDF. This layout presents information on Logistics KPI, Dashboard For Supply Chain, Management To Enhance, Logistics Operations. It is also available for immediate download and adjustment. So, changes can be made in the color, design, graphics or any other component to create a unique layout.
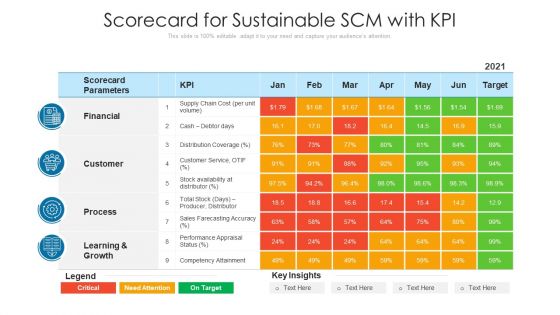
Scorecard For Sustainable SCM With KPI Ppt PowerPoint Presentation File Graphics Design PDF
Showcasing this set of slides titled scorecard for sustainable scm with kpi ppt powerpoint presentation file graphics design pdf. The topics addressed in these templates are financial, process, customer. All the content presented in this PPT design is completely editable. Download it and make adjustments in color, background, font etc. as per your unique business setting.
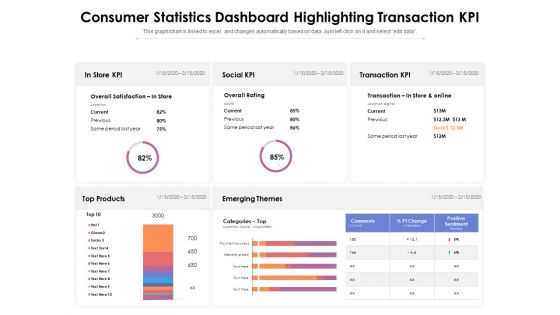
Consumer Statistics Dashboard Highlighting Transaction KPI Ppt PowerPoint Presentation Gallery Graphics Design PDF
Presenting this set of slides with name consumer statistics dashboard highlighting transaction kpi ppt powerpoint presentation gallery graphics design pdf. The topics discussed in these slides are transaction, social, process. This is a completely editable PowerPoint presentation and is available for immediate download. Download now and impress your audience.

Development And Operations KPI Dashboard For Determining Active Bugs Portrait PDF
This slide template covers about determining email and voice bugs during production line. Further, it covers about active bugs on weekly basis.Showcasing this set of slides titled Development And Operations KPI Dashboard For Determining Active Bugs Portrait PDF The topics addressed in these templates are Development Operations, Dashboard Determining, Active Bugs All the content presented in this PPT design is completely editable. Download it and make adjustments in color, background, font etc. as per your unique business setting.

Performance KPI Dashboard To Measure Strategic Business Management Performance Pictures PDF
This slide shows dashboard which can be used to track strategic business Management operations. It includes key performance indicators planning, design, development, testing, workload, etc.Showcasing this set of slides titled Performance KPI Dashboard To Measure Strategic Business Management Performance Pictures PDF The topics addressed in these templates are Development, Projected Launch, Planning All the content presented in this PPT design is completely editable. Download it and make adjustments in color, background, font etc. as per your unique business setting.
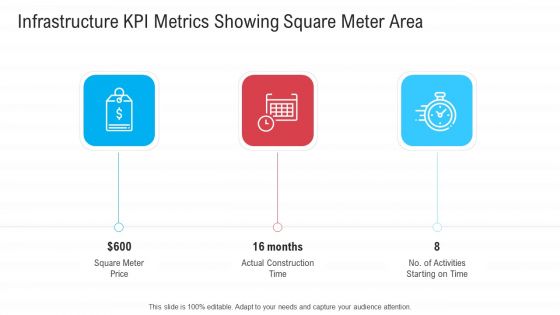
Infrastructure Designing And Administration Infrastructure KPI Metrics Showing Square Meter Area Guidelines PDF
Presenting infrastructure designing and administration infrastructure kpi metrics showing square meter area guidelines pdf to provide visual cues and insights. Share and navigate important information on three stages that need your due attention. This template can be used to pitch topics like square meter price, actual construction time, no of activities starting on time. In addtion, this PPT design contains high resolution images, graphics, etc, that are easily editable and available for immediate download.
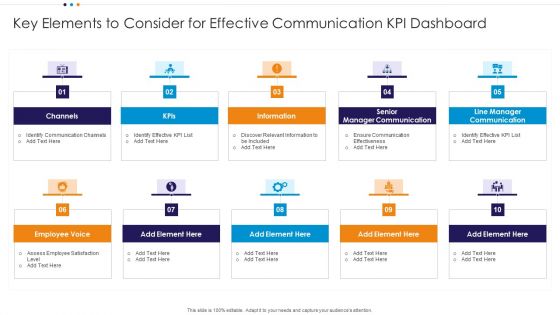
Key Elements To Consider For Effective Communication KPI Dashboard Designs PDF
Persuade your audience using this Key Elements To Consider For Effective Communication KPI Dashboard Designs PDF This PPT design covers ten stages, thus making it a great tool to use. It also caters to a variety of topics including Employee Voice, Manager Communication, Manager Communication Download this PPT design now to present a convincing pitch that not only emphasizes the topic but also showcases your presentation skills.

Business Activities Assessment Examples Infrastructure KPI Metrics Showing Square Meter Area Elements PDF
Presenting business activities assessment examples infrastructure kpi metrics showing square meter area elements pdf to provide visual cues and insights. Share and navigate important information on three stages that need your due attention. This template can be used to pitch topics like square meter price, actual construction time, activities starting on time. In addtion, this PPT design contains high resolution images, graphics, etc, that are easily editable and available for immediate download.
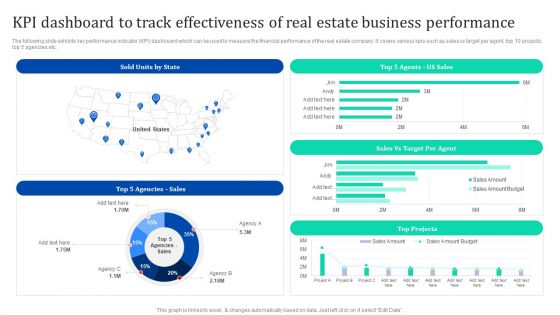
KPI Dashboard To Track Effectiveness Of Real Estate Business Enhancing Process Improvement By Regularly Themes PDF
The following slide exhibits key performance indicator KPI dashboard which can be used to measure the financial performance of the real estate company. It covers various kpis such as sales vs target per agent, top 10 projects, top 5 agencies etc. Welcome to our selection of the KPI Dashboard To Track Effectiveness Of Real Estate Business Enhancing Process Improvement By Regularly Themes PDF. These are designed to help you showcase your creativity and bring your sphere to life. Planning and Innovation are essential for any business that is just starting out. This collection contains the designs that you need for your everyday presentations. All of our PowerPoints are 100 parcent editable, so you can customize them to suit your needs. This multi-purpose template can be used in various situations. Grab these presentation templates today.
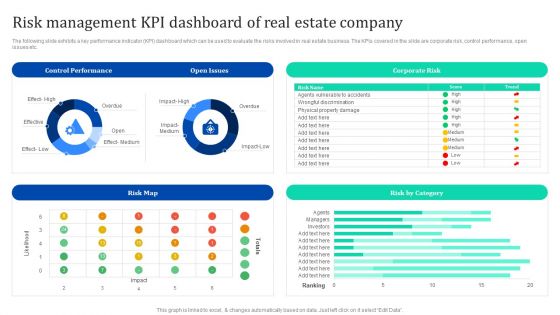
Risk Management Kpi Dashboard Of Real Estate Company Enhancing Process Improvement By Regularly Inspiration PDF
The following slide exhibits a key performance indicator KPI dashboard which can be used to evaluate the risks involved in real estate business. The KPIs covered in the slide are corporate risk, control performance, open issues etc. This Risk Management Kpi Dashboard Of Real Estate Company Enhancing Process Improvement By Regularly Inspiration PDF from Slidegeeks makes it easy to present information on your topic with precision. It provides customization options, so you can make changes to the colors, design, graphics, or any other component to create a unique layout. It is also available for immediate download, so you can begin using it right away. Slidegeeks has done good research to ensure that you have everything you need to make your presentation stand out. Make a name out there for a brilliant performance.

IT Infrastructure Governance Infrastructure KPI Metrics Showing Square Meter Area Ppt Infographics Guide PDF
Presenting it infrastructure governance infrastructure kpi metrics showing square meter area ppt infographics guide pdf. to provide visual cues and insights. Share and navigate important information on three stages that need your due attention. This template can be used to pitch topics like square meter price actual, construction time, no. activities starting time. In addtion, this PPT design contains high resolution images, graphics, etc, that are easily editable and available for immediate download.

Framework Administration Infrastructure KPI Metrics Showing Square Meter Area Elements PDF
Presenting framework administration infrastructure kpi metrics showing square meter area elements pdf to provide visual cues and insights. Share and navigate important information on three stages that need your due attention. This template can be used to pitch topics like square meter price, actual construction time, no. of activities starting on time. In addition, this PPT design contains high-resolution images, graphics, etc, that are easily editable and available for immediate download.

 Home
Home