Devops Kpi

Sustainability Calculation With KPI Cash Flow Dashboard Liquidity Ratio Inspiration PDF Introduction PDF
Following slide covers cash flow dashboard covering details like beginning cash on hand, cash going in, cash going out, profit loss and ending cash on hand. It also includes detail of accounts receivable and payable. Deliver an awe inspiring pitch with this creative sustainability calculation with kpi cash flow dashboard cash designs pdf bundle. Topics like beginning cash on hand, cash going out, profit and loss, ending cash on hand can be discussed with this completely editable template. It is available for immediate download depending on the needs and requirements of the user.
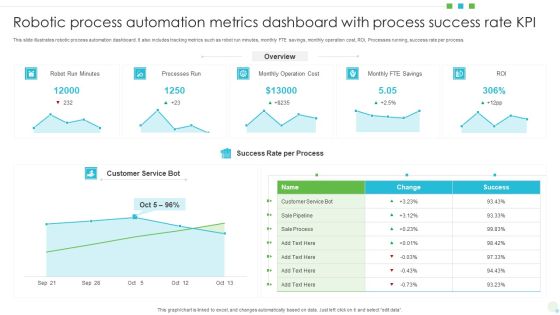
Robotic Process Automation Metrics Dashboard With Process Success Rate KPI Professional PDF
This slide illustrates robotic process automation dashboard. It also includes tracking metrics such as robot run minutes, monthly FTE savings, monthly operation cost, ROI, Processes running, success rate per process. Showcasing this set of slides titled Robotic Process Automation Metrics Dashboard With Process Success Rate KPI Professional PDF The topics addressed in these templates are Processes Run, Monthly Operation Cost, Customer Service Bot. All the content presented in this PPT design is completely editable. Download it and make adjustments in color, background, font etc. as per your unique business setting.
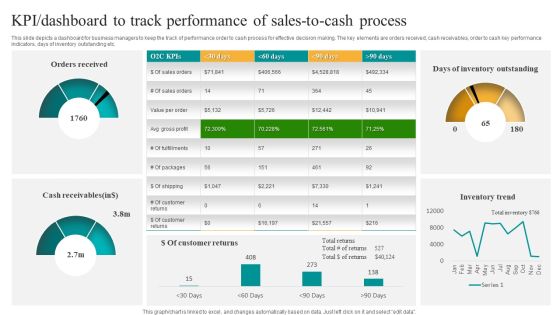
KPI Dashboard To Track Performance Of Sales To Cash Process Download PDF
This slide depicts a dashboard for business managers to keep the track of performance order to cash process for effective decision making. The key elements are orders received, cash receivables, order to cash key performance indicators, days of inventory outstanding etc. Showcasing this set of slides titled KPI Dashboard To Track Performance Of Sales To Cash Process Download PDF. The topics addressed in these templates are Orders Received, Cash Receivables, Days Inventory Outstanding. All the content presented in this PPT design is completely editable. Download it and make adjustments in color, background, font etc. as per your unique business setting.

KPI Dashboard To Track Sales And Operations Process Of Manufacturing Enterprise Brochure PDF
This slide depicts a dashboard to track the key performance metrics in sales and operations process of a manufacturing enterprise to analyze deviations in the actual and planned output. The key performing indicators are percentage deviation, dollar deviation, inventory in hand etc.Pitch your topic with ease and precision using this KPI Dashboard To Track Sales And Operations Process Of Manufacturing Enterprise Brochure PDF. This layout presents information on Planned Output, Yearly Growth, Inventory Hand. It is also available for immediate download and adjustment. So, changes can be made in the color, design, graphics or any other component to create a unique layout.
Multistep Process To Create KPI Framework Ppt PowerPoint Presentation Icon Styles PDF
This slide illustrates process to create key performance indicator framework which includes steps such as awareness, engagement, conversion and loyalty. It also includes the different types of kpis for each stage. Persuade your audience using this multistep process to create kpi framework ppt powerpoint presentation icon styles pdf This PPT design covers four stages, thus making it a great tool to use. It also caters to a variety of topics including awareness, conversion, engagement Download this PPT design now to present a convincing pitch that not only emphasizes the topic but also showcases your presentation skills.

Kpi Dashboard To Track Applicant Selection Process Ppt PowerPoint Presentation File Graphics Template PDF
This slide shows dashboard which can be used to monitor the progress of recruitment process. It includes metrics such as applications received, shortlisted applicant, selected candidates, etc. Pitch your topic with ease and precision using this Kpi Dashboard To Track Applicant Selection Process Ppt PowerPoint Presentation File Graphics Template PDF. This layout presents information on Applications Received, Shortlisted Candidates, Selected Candidates. It is also available for immediate download and adjustment. So, changes can be made in the color, design, graphics or any other component to create a unique layout.

KPI Dashboard To Track Process Products Sold By Insurance Topics PDF
This slide shows dashboard which can be used to compare insurance sales of current and previous year. It includes metrics such as monthly policy status, quarterly premium revenue, overall policy status, etc. Pitch your topic with ease and precision using this KPI Dashboard To Track Process Products Sold By Insurance Topics PDF. This layout presents information on Overall Policy Status, Quarterly Premium Revenue, Monthly Policy Status. It is also available for immediate download and adjustment. So, changes can be made in the color, design, graphics or any other component to create a unique layout.
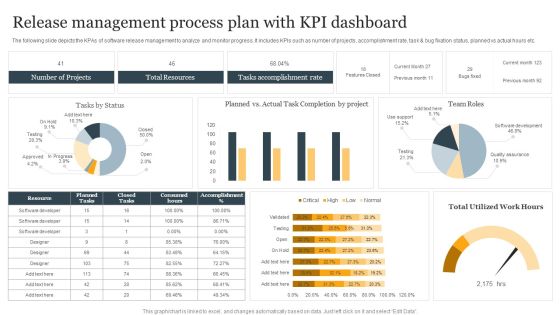
Release Management Process Plan With KPI Dashboard Ppt Infographic Template Structure PDF
The following slide depicts the KPAs of software release management to analyze and monitor progress. It includes KPIs such as number of projects, accomplishment rate, task and bug fixation status, planned vs actual hours etc. Showcasing this set of slides titled Release Management Process Plan With KPI Dashboard Ppt Infographic Template Structure PDF. The topics addressed in these templates are Number Of Projects, Total Resources, Tasks Accomplishment Rate. All the content presented in this PPT design is completely editable. Download it and make adjustments in color, background, font etc. as per your unique business setting.
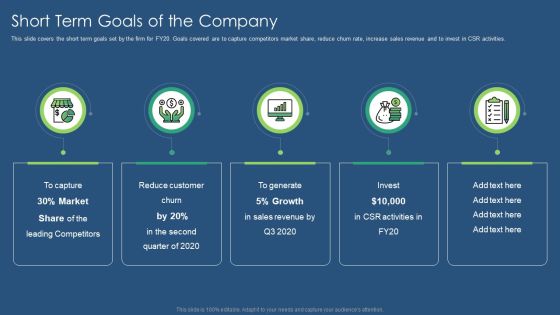
Sustainability Calculation With KPI Short Term Goals Of The Company Ppt PowerPoint Presentation File Rules PDF
This slide covers the short term goals set by the firm for FY20. Goals covered are to capture competitors market share, reduce churn rate, increase sales revenue and to invest in CSR activities. Presenting sustainability calculation with kpi short term goals of the company ppt powerpoint presentation file rules pdf to provide visual cues and insights. Share and navigate important information on five stages that need your due attention. This template can be used to pitch topics like short term goals of the company. In addtion, this PPT design contains high resolution images, graphics, etc, that are easily editable and available for immediate download.

Milestones Achieved In FY22 Company Performance Evaluation Using KPI Icons PDF
This slide demonstrates monthly milestones achieved by the company in 2022 financial year. It also includes that company listed its name in fortune 1000 list of companies. Presenting Milestones Achieved In FY22 Company Performance Evaluation Using KPI Icons PDF to provide visual cues and insights. Share and navigate important information on twelve stages that need your due attention. This template can be used to pitch topics like Company, Milestones Achieved, New Product. In addtion, this PPT design contains high resolution images, graphics, etc, that are easily editable and available for immediate download.

Customer Service Organizational Efficiency Gain Assessment With KPI Dashboard Slides PDF
The following slide highlights the key insights of customer service management to optimize issue response process. It includes elements such as average talk time, queue time, answer time, abandoned on hold, voice mails etc. Showcasing this set of slides titled Customer Service Organizational Efficiency Gain Assessment With KPI Dashboard Slides PDF. The topics addressed in these templates are Activity, Unsuccessful Inbound Calls, Efficiency. All the content presented in this PPT design is completely editable. Download it and make adjustments in color, background, font etc. as per your unique business setting.

Development And Operations KPI Dashboard Ppt PowerPoint Presentation Complete Deck With Slides
If designing a presentation takes a lot of your time and resources and you are looking for a better alternative, then this Development And Operations KPI Dashboard Ppt PowerPoint Presentation Complete Deck With Slides is the right fit for you. This is a prefabricated set that can help you deliver a great presentation on the topic. All the twelve slides included in this sample template can be used to present a birds-eye view of the topic. These slides are also fully editable, giving you enough freedom to add specific details to make this layout more suited to your business setting. Apart from the content, all other elements like color, design, theme are also replaceable and editable. This helps in designing a variety of presentations with a single layout. Not only this, you can use this PPT design in formats like PDF, PNG, and JPG once downloaded. Therefore, without any further ado, download and utilize this sample presentation as per your liking.

Understanding Our Cash Flow Statements KPI Fy 21 To 22 Debt Collection Improvement Plan Slides PDF
Purpose of the following slide is to show the major key performing indicators of the organization , these KPIs can be the operation activities, cash flow from financing activities, investing activities and the net decrease in cash flow. Presenting understanding our cash flow statements kpi fy 21 to 22 debt collection improvement plan slides pdf to provide visual cues and insights. Share and navigate important information on four stages that need your due attention. This template can be used to pitch topics like cash flow from operations, cash flow from investing activities, cash flow from financing activities, change in cash and cash equivalents. In addtion, this PPT design contains high resolution images, graphics, etc, that are easily editable and available for immediate download.
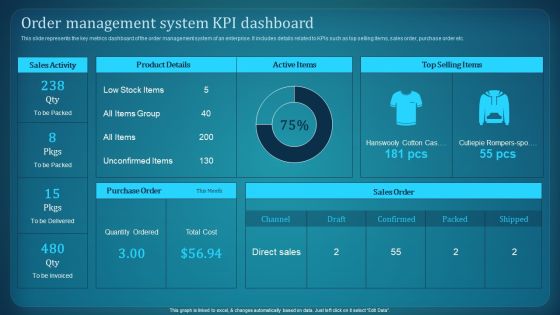
Effective Deployment Of Order Management System Order Management System KPI Download PDF
This slide represents the process flow of an order management system. It starts by receiving order, checking the order and ends with delivery of products and receival of products by customers. Do you know about Slidesgeeks Effective Deployment Of Order Management System Order Management System KPI Download PDF These are perfect for delivering any kind od presentation. Using it, create PowerPoint presentations that communicate your ideas and engage audiences. Save time and effort by using our pre-designed presentation templates that are perfect for a wide range of topic. Our vast selection of designs covers a range of styles, from creative to business, and are all highly customizable and easy to edit. Download as a PowerPoint template or use them as Google Slides themes.
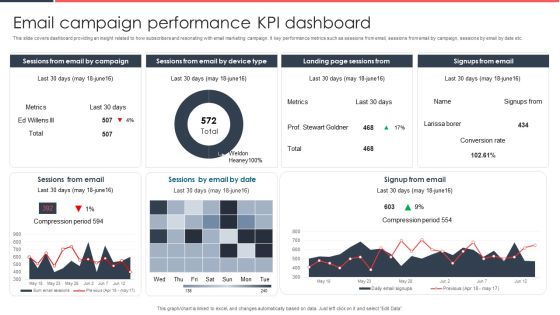
Implementing Management System To Enhance Ecommerce Processes Email Campaign Performance KPI Dashboard Download PDF
This slide covers dashboard providing an insight related to how subscribers and resonating with email marketing campaign. It key performance metrics such as sessions from email, sessions from email by campaign, sessions by email by date etc. This Implementing Management System To Enhance Ecommerce Processes Email Campaign Performance KPI Dashboard Download PDF from Slidegeeks makes it easy to present information on your topic with precision. It provides customization options, so you can make changes to the colors, design, graphics, or any other component to create a unique layout. It is also available for immediate download, so you can begin using it right away. Slidegeeks has done good research to ensure that you have everything you need to make your presentation stand out. Make a name out there for a brilliant performance.
Tracking The Improvements In HR Recruitment Process With KPI Dashboard Introduction PDF
This slide showcases the KPIs that would help a business organization to track the improvements in the new recruitment process. It includes technical hiring, non-technical hiring, current hiring pipeline, etc. This Tracking The Improvements In HR Recruitment Process With KPI Dashboard Introduction PDF from Slidegeeks makes it easy to present information on your topic with precision. It provides customization options, so you can make changes to the colors, design, graphics, or any other component to create a unique layout. It is also available for immediate download, so you can begin using it right away. Slidegeeks has done good research to ensure that you have everything you need to make your presentation stand out. Make a name out there for a brilliant performance.
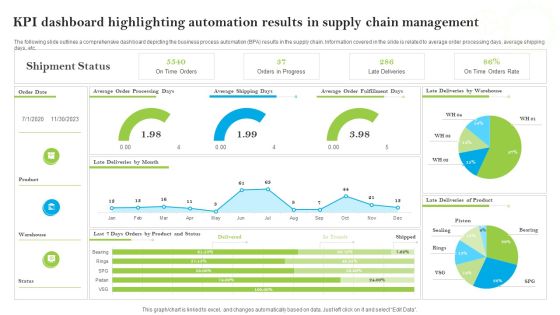
Introducing AI Tools KPI Dashboard Highlighting Automation Results In Supply Chain Portrait PDF
The following slide outlines a comprehensive dashboard depicting the business process automation BPA results in the supply chain. Information covered in the slide is related to average order processing days, average shipping days, etc. Coming up with a presentation necessitates that the majority of the effort goes into the content and the message you intend to convey. The visuals of a PowerPoint presentation can only be effective if it supplements and supports the story that is being told. Keeping this in mind our experts created Introducing AI Tools KPI Dashboard Highlighting Automation Results In Supply Chain Portrait PDF to reduce the time that goes into designing the presentation. This way, you can concentrate on the message while our designers take care of providing you with the right template for the situation.

Analyzing And Implementing Effective CMS Customer Checkout Behavior KPI Dashboard Inspiration PDF
This slide represents the dashboard to help management in analyzing the point at which customers leave the checkout process. It includes details related to KPIs such as shipping drop off, payment drop off etc. Coming up with a presentation necessitates that the majority of the effort goes into the content and the message you intend to convey. The visuals of a PowerPoint presentation can only be effective if it supplements and supports the story that is being told. Keeping this in mind our experts created Analyzing And Implementing Effective CMS Customer Checkout Behavior KPI Dashboard Inspiration PDF to reduce the time that goes into designing the presentation. This way, you can concentrate on the message while our designers take care of providing you with the right template for the situation.
Development And Operations KPI Dashboard IT Ppt PowerPoint Presentation Complete With Slides
Induce strategic thinking by presenting this complete deck. Enthrall your audience by deploying this thought provoking PPT deck. It can be downloaded in both standard and widescreen aspect ratios, thus making it a complete package to use and deploy. Convey your thoughts and actions using the twenty two slides presented in this complete deck. Additionally, feel free to alter its components like color, graphics, design, etc, to create a great first impression. Grab it now by clicking on the download button below.

Retail Kpi Dashboard Showing Revenue Vs Units Sold Top 5 Product Categories Ppt PowerPoint Presentation Layouts Designs Download
This is a retail kpi dashboard showing revenue vs units sold top 5 product categories ppt powerpoint presentation layouts designs download. This is a four stage process. The stages in this process are finance, strategy, analysis, marketing.
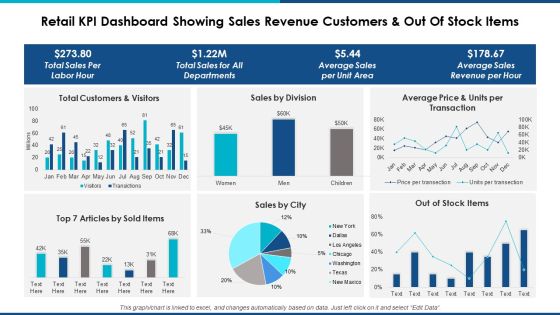
Retail Kpi Dashboard Showing Sales Revenue Customers And Out Of Stock Items Ppt Powerpoint Presentation Professional Background Designs
This is a retail kpi dashboard showing sales revenue customers and out of stock items ppt powerpoint presentation professional background designs. This is a six stage process. The stages in this process are finance, marketing, management, investment, analysis.
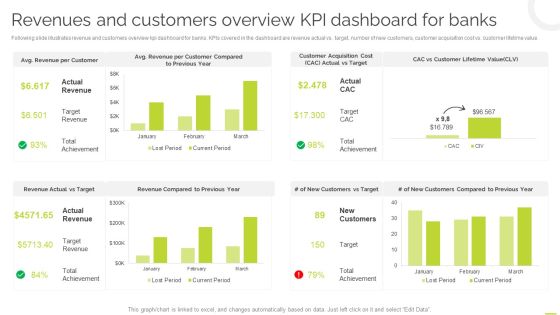
Effective BPM Tool For Business Process Management Revenues And Customers Overview KPI Dashboard For Banks Elements PDF
Following slide illustrates revenue and customers overview kpi dashboard for banks. KPIs covered in the dashboard are revenue actual vs target, number of new customers, customer acquisition cost vs. customer lifetime value. This Effective BPM Tool For Business Process Management Revenues And Customers Overview KPI Dashboard For Banks Elements PDF is perfect for any presentation, be it in front of clients or colleagues. It is a versatile and stylish solution for organizing your meetings. The Effective BPM Tool For Business Process Management Revenues And Customers Overview KPI Dashboard For Banks Elements PDF features a modern design for your presentation meetings. The adjustable and customizable slides provide unlimited possibilities for acing up your presentation. Slidegeeks has done all the homework before launching the product for you. So, do not wait, grab the presentation templates today.

Implementing Development And Operations Platforms For In Time Product Launch IT KPI Dashboard For Monitoring Elements PDF
This slide shows software development project management dashboard. KPIs covered in the dashboard are status of planning, design, development, testing project launch date, project budget, overdue tasks, workload and upcoming deadlines. Deliver and pitch your topic in the best possible manner with this implementing development and operations platforms for in time product launch it kpi dashboard for monitoring elements pdf. Use them to share invaluable insights on development, design, development, planning and impress your audience. This template can be altered and modified as per your expectations. So, grab it now.

Department Operations Systems And Processes Ppt Sample
This is a department operations systems and processes ppt sample. This is a four stage process. The stages in this process are business, marketing.

Philippine Operations International Operations Ppt Example
This is a philippine operations international operations ppt example. This is a five stage process. The stages in this process are shapes, marketing, business.

Product Support Manufacturing Operations Ppt Sample
This is a product support manufacturing operations ppt sample. This is a three stage process. The stages in this process are marketing, success, business.
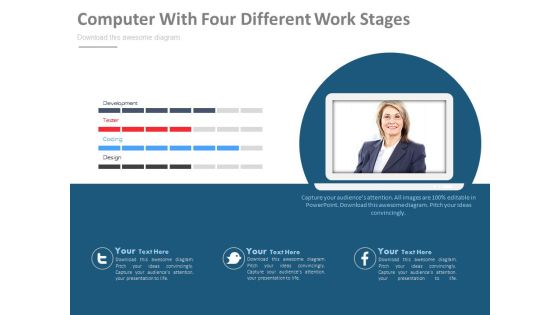
Web Conferencing And Video Chat Software Development Powerpoint Template
This PPT slide has been designed with graphics of laptop with team pictures. Download this PowerPoint to depict web conferencing and video chat services. Imprint your concepts with this professional slide in your presentations.?

Circular Diagram Of Agile Software Development Powerpoint Templates
This PowerPoint template has been designed with circular diagram This diagram is a data visualization tool that gives you a simple way to present statistical information. This slide helps your audience examine and interpret the data you present.

Agile Automation Ideas To Establish Serverless System Ppt PowerPoint Presentation Inspiration Show PDF
Presenting this set of slides with name agile automation ideas to establish serverless system ppt powerpoint presentation inspiration show pdf. This is a seen stage process. The stages in this process are docker and devops, sprint allocation automation, agile and devops, automated devops metrics, establish serverless system, devops and big data. This is a completely editable PowerPoint presentation and is available for immediate download. Download now and impress your audience.

Software Development And IT Operations Infrastructure Development IT Various Metrics To Measure Microsoft PDF
This slide provides information regarding the various metrics that considered essential in determine the effectiveness of DevOps systems in terms of DevOps deployment, error rates and application performance and other metrics. This is a software development and it operations infrastructure development it various metrics to measure microsoft pdf template with various stages. Focus and dispense information on three stages using this creative set, that comes with editable features. It contains large content boxes to add your information on topics like devops deployment, error rates, application performance. You can also showcase facts, figures, and other relevant content using this PPT layout. Grab it now.

Strategic Development And Operations Execution IT Various Metrics To Measure Diagrams PDF
This slide provides information regarding the various metrics that considered essential in determine the effectiveness of DevOps systems in terms of DevOps deployment, error rates and application performance and other metrics. This is a strategic development and operations execution it various metrics to measure diagrams pdf template with various stages. Focus and dispense information on three stages using this creative set, that comes with editable features. It contains large content boxes to add your information on topics like devops deployment, error rates, application performance. You can also showcase facts, figures, and other relevant content using this PPT layout. Grab it now.
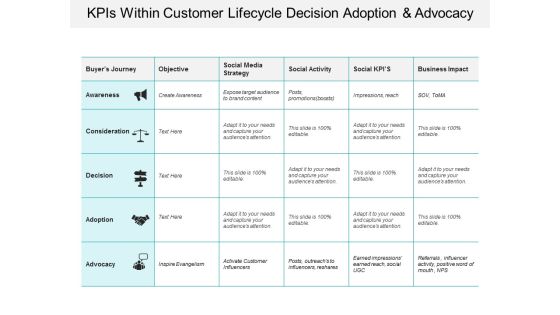
Kpis Within Customer Lifecycle Decision Adoption And Advocacy Ppt PowerPoint Presentation Infographic Template Graphics Design
This is a kpis within customer lifecycle decision adoption and advocacy ppt powerpoint presentation infographic template graphics design. This is a three stage process. The stages in this process are kpi proposal, kpi plan, kpi scheme.

Comprehensive Development And Operations Adoption Initiatives IT Various Metrics To Measure Elements PDF
This slide provides information regarding the various metrics that considered essential in determine the effectiveness of DevOps systems in terms of DevOps deployment, error rates and application performance and other metrics. Presenting comprehensive development and operations adoption initiatives it various metrics to measure elements pdf to provide visual cues and insights. Share and navigate important information on three stages that need your due attention. This template can be used to pitch topics like implementation, productivity, team, production. In addtion, this PPT design contains high resolution images, graphics, etc, that are easily editable and available for immediate download.
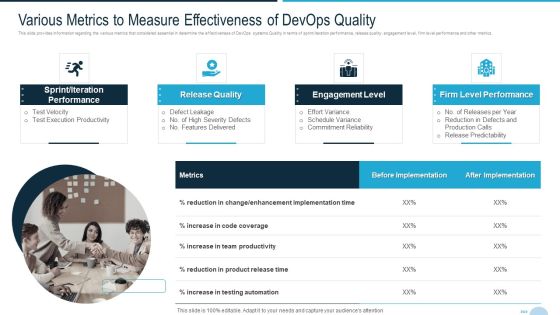
Development And Operations Quality Assurance And Validation IT Various Metrics To Measure Diagrams PDF
This slide provides information regarding the various metrics that considered essential in determine the effectiveness of DevOps systems Quality in terms of sprint or iteration performance, release quality, engagement level, firm level performance and other metrics. Presenting development and operations quality assurance and validation it various metrics to measure diagrams pdf to provide visual cues and insights. Share and navigate important information on four stages that need your due attention. This template can be used to pitch topics like engagement level, firm level performance, release quality In addtion, this PPT design contains high resolution images, graphics, etc, that are easily editable and available for immediate download.
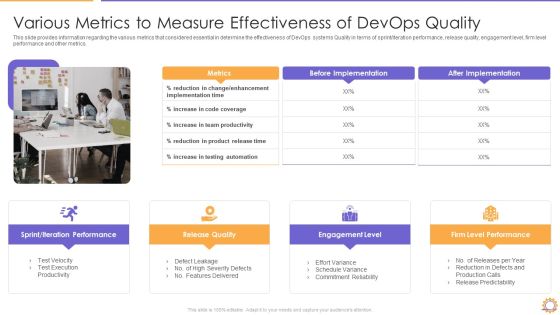
E2E Quality Assurance And Testing In Developer Operations IT Various Metrics Themes PDF Background PDF
This slide provides information regarding the various metrics that considered essential in determine the effectiveness of DevOps systems Quality in terms of sprint iteration performance, release quality, engagement level, firm level performance and other metrics. This is a e2e quality assurance and testing in developer operations it various metrics themes pdf background pdf template with various stages. Focus and dispense information on four stages using this creative set, that comes with editable features. It contains large content boxes to add your information on topics like before implementation, product failure rate, mean time to resolution You can also showcase facts, figures, and other relevant content using this PPT layout. Grab it now.

Development And Operations Quality Assurance And Validation IT Implementing Quality Assurance Professional PDF
This slide provides information regarding implementing of quality assurance in DevOps environment in terms of merging of teams, performance and quality metrics, quality assurance. and development collaboration. This is a development and operations quality assurance and validation it implementing quality assurance professional pdf template with various stages. Focus and dispense information on three stages using this creative set, that comes with editable features. It contains large content boxes to add your information on topics like merging of teams, performance and quality metrics, development collaboration You can also showcase facts, figures, and other relevant content using this PPT layout. Grab it now.
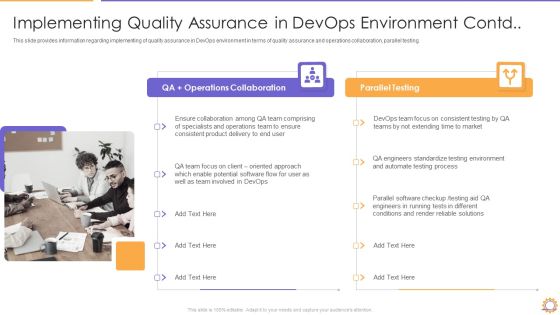
E2E Quality Assurance And Testing In Developer Operations IT Impleme Environment Contd Microsoft PDF Graphics PDF
This slide provides information regarding implementing of quality assurance in DevOps environment in terms of quality assurance and operations collaboration, parallel testing. Presenting e2e quality assurance and testing in developer operations it impleme environment contd microsoft pdf graphics pdf to provide visual cues and insights. Share and navigate important information on two stages that need your due attention. This template can be used to pitch topics like merging of teams, performance and quality metrics, development collaboration In addtion, this PPT design contains high resolution images, graphics, etc, that are easily editable and available for immediate download.

E2E Quality Assurance And Testing In Developer Operations IT Implementing Rules PDF Elements PDF
This slide provides information regarding implementing of quality assurance in DevOps environment in terms of merging of teams, performance and quality metrics, quality assurance. and development collaboration. This is a e2e quality assurance and testing in developer operations it implementing rules pdf elements pdf template with various stages. Focus and dispense information on three stages using this creative set, that comes with editable features. It contains large content boxes to add your information on topics like infrastructure code, test scripts and data, configuration server You can also showcase facts, figures, and other relevant content using this PPT layout. Grab it now.
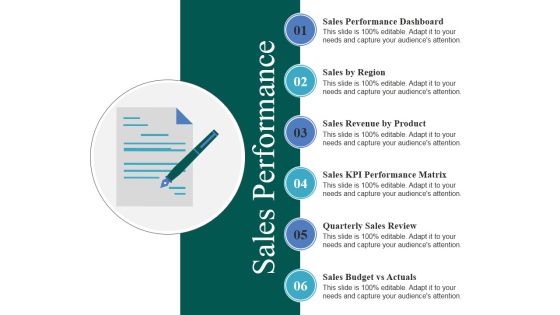
Sales Performance Ppt PowerPoint Presentation Infographics Visuals
This is a sales performance ppt powerpoint presentation infographics visuals. This is a six stage process. The stages in this process are sales by region, sales revenue by product, sales kpi performance matrix, quarterly sales review, sales budget vs actuals.

Data Processing Services Delivery Checklist To Align Business Service Delivery With Kpis Designs PDF
This slide define the checklists and guidelines to align business service delivery with KPIs and it includes defining KPIs, KPI discussion, IT culture development and integration of KPIs to consolidated dashboards. This is a Data Processing Services Delivery Checklist To Align Business Service Delivery With Kpis Designs PDF template with various stages. Focus and dispense information on six stages using this creative set, that comes with editable features. It contains large content boxes to add your information on topics like Define KPIs, KPI Discussions, Develop IT Culture. You can also showcase facts, figures, and other relevant content using this PPT layout. Grab it now.

Advance IT Service Checklist To Align Business Service Delivery With Kpis Sample Elements PDF
This slide define the checklists and guidelines to align business service delivery with KPIs and it includes defining KPIs, KPI discussion, IT culture development and integration of KPIs to consolidated dashboards. Presenting advance it service checklist to align business service delivery with kpis sample elements pdf to provide visual cues and insights. Share and navigate important information on six stages that need your due attention. This template can be used to pitch topics like define kpis, kpi discussions, develop it culture, integrate kpis to consolidated dashboards. In addtion, this PPT design contains high resolution images, graphics, etc, that are easily editable and available for immediate download.
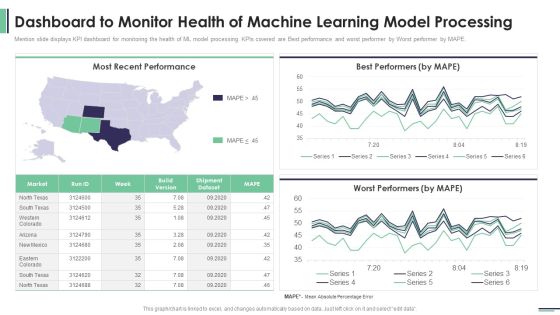
Machine Learning Development And Operations Cycle IT Dashboard To Monitor Health Of Machine Demonstration PDF
Mention slide displays KPI dashboard for monitoring the health of ML model processing. KPIs covered are Best performance and worst performer by Worst performer by MAPE.Deliver an awe inspiring pitch with this creative machine learning development and operations cycle it dashboard to monitor health of machine demonstration pdf bundle. Topics like most recent performance, best performers, worst performers can be discussed with this completely editable template. It is available for immediate download depending on the needs and requirements of the user.

Table Of Contents For Developer Operations Automated Tools And Initiatives IT Infographics PDF
Presenting table of contents for developer operations automated tools and initiatives it infographics pdf to provide visual cues and insights. Share and navigate important information on seven stages that need your due attention. This template can be used to pitch topics like employee training schedule and cost, previous projects, market analysis, business performance, kpi dashboard. In addtion, this PPT design contains high resolution images, graphics, etc, that are easily editable and available for immediate download.

Internal Audit Metrics Key Performance Measure Indicators Background PDF
This slide defines the measures of internal audit KPI Key Performance Indicators. It includes information related to the performance measures, ranking and audit process. Showcasing this set of slides titled Internal Audit Metrics Key Performance Measure Indicators Background PDF. The topics addressed in these templates are Performance Measures, Audit Process, Ranking. All the content presented in this PPT design is completely editable. Download it and make adjustments in color, background, font etc. as per your unique business setting.
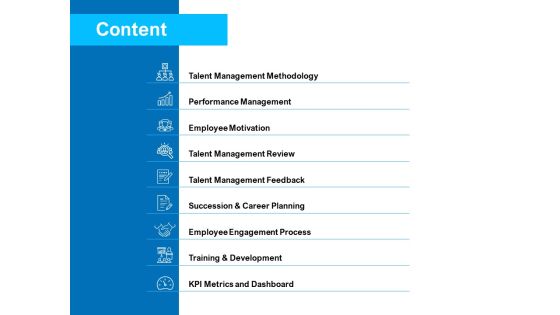
Strategic Talent Management Content Ppt PowerPoint Presentation Design Templates PDF
Deliver an awe-inspiring pitch with this creative strategic talent management content ppt powerpoint presentation design templates pdf bundle. Topics like talent management methodology, performance management, employee motivation, talent management review, talent management feedback, succession and career planning, employee engagement process, training and development, kpi metrics and dashboard can be discussed with this completely editable template. It is available for immediate download depending on the needs and requirements of the user.
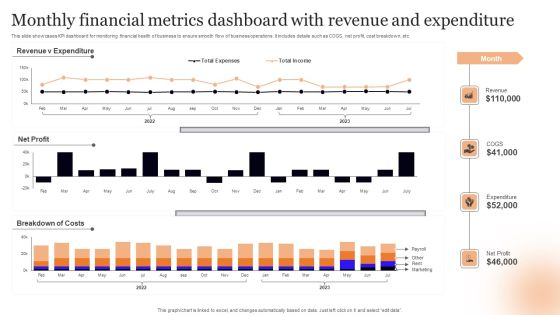
Monthly Financial Metrics Dashboard With Revenue And Expenditure Rules PDF
This slide showcases KPI dashboard for monitoring financial health of business to ensure smooth flow of business operations. It includes details such as COGS, net profit, cost breakdown, etc. Showcasing this set of slides titled Monthly Financial Metrics Dashboard With Revenue And Expenditure Rules PDF. The topics addressed in these templates are Net Profit, Costs, Expenditure. All the content presented in this PPT design is completely editable. Download it and make adjustments in color, background, font etc. as per your unique business setting.
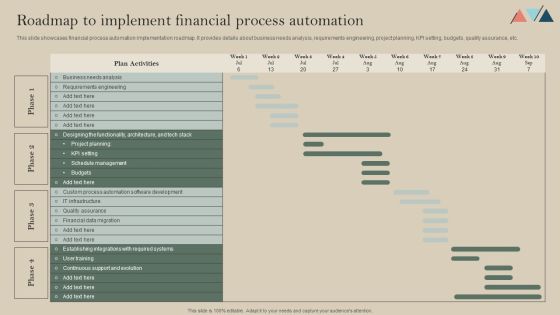
Roadmap To Implement Financial Process Automation Structure PDF
This slide showcases financial process automation implementation roadmap. It provides details about business needs analysis, requirements engineering, project planning, KPI setting, budgets, quality assurance, etc. Find a pre-designed and impeccable Roadmap To Implement Financial Process Automation Structure PDF. The templates can ace your presentation without additional effort. You can download these easy-to-edit presentation templates to make your presentation stand out from others. So, what are you waiting for Download the template from Slidegeeks today and give a unique touch to your presentation.

Table Of Contents Enhancing Process Improvement Culture Through Automation Software Brochure PDF
Presenting Table Of Contents Enhancing Process Improvement Culture Through Automation Software Brochure PDF to provide visual cues and insights. Share and navigate important information on seven stages that need your due attention. This template can be used to pitch topics like Current Scenario Evaluation, Process Automation Training Courses, Kpi Metrics Dashboard. In addtion, this PPT design contains high resolution images, graphics, etc, that are easily editable and available for immediate download.

Decision Making Analysis For Supporting Business Decisions Ideas PDF
Persuade your audience using this decision making analysis for supporting business decisions ideas pdf. This PPT design covers seven stages, thus making it a great tool to use. It also caters to a variety of topics including marketing kpi system, competing product analysis, market choice analysis. Download this PPT design now to present a convincing pitch that not only emphasizes the topic but also showcases your presentation skills.

Facts Assessment Content Ppt PowerPoint Presentation Gallery Graphics Pictures PDF
Presenting this set of slides with name facts assessment content ppt powerpoint presentation gallery graphics pictures pdf. This is a seven stage process. The stages in this process are business intelligence market overview, architectural framework, data design, data integration design, bi design, advanced final output results, kpi metrics and dashboard. This is a completely editable PowerPoint presentation and is available for immediate download. Download now and impress your audience.

Enterprise Problem Solving And Intellect Content Ppt PowerPoint Presentation Styles Format Ideas PDF
Presenting this set of slides with name enterprise problem solving and intellect content ppt powerpoint presentation styles format ideas pdf. This is a seven stage process. The stages in this process are business intelligence market overview, architectural framework, data design, data integration design, bi design, advanced final output results, kpi metrics and dashboard. This is a completely editable PowerPoint presentation and is available for immediate download. Download now and impress your audience.

Firm Productivity Administration Content Ppt PowerPoint Presentation Visual Aids Summary PDF
Presenting this set of slides with name firm productivity administration content ppt powerpoint presentation visual aids summary pdf. This is a seven stage process. The stages in this process are business intelligence market overview, architectural framework, data design, data integration design, bi design, advanced final output results, kpi metrics and dashboard. This is a completely editable PowerPoint presentation and is available for immediate download. Download now and impress your audience.

Integrated Water Resource Management Content Ppt Model Graphic Images PDF
Presenting this set of slides with name integrated water resource management content ppt model graphic images pdf. This is a seven stage process. The stages in this process are introduction, water quality, designing a monitoring program, waste water treatment and reuse, monitoring and assessment, budget, kpi metrics and dashboards. This is a completely editable PowerPoint presentation and is available for immediate download. Download now and impress your audience.
Monitoring And Evaluating Water Quality Content Ppt PowerPoint Presentation Layouts Example File PDF
Presenting this set of slides with name monitoring and evaluating water quality content ppt powerpoint presentation layouts example file pdf. This is a seven stage process. The stages in this process are introduction, water quality, designing a monitoring program, waste water treatment and reuse, monitoring and assessment, budget, kpi metrics and dashboards. This is a completely editable PowerPoint presentation and is available for immediate download. Download now and impress your audience.
Portfolio Tracking Dashboard For Management Procedure Structure PDF
This slide covers portfolio performance tracking KPI dashboard for increasing effectiveness in investment management process. It involves details such as investment, total earning, net profit and monthly portfolio performance.Pitch your topic with ease and precision using this Portfolio Tracking Dashboard For Management Procedure Structure PDF This layout presents information on Investment, Total Earning, Portfolio Performance It is also available for immediate download and adjustment. So, changes can be made in the color, design, graphics or any other component to create a unique layout.

Initiatives Atmosphere Operation Problems Pharmaceutical Firm Pharmaceutical Company Key Performance Indicators Summary PDF
The slide shows the key Performance Indicator KPI s which will help the company to track the success rate of implemented strategies. Major KPIs include number of products sold, pharma products manufactures, research and development expenses per year, total number of patients, etc Deliver and pitch your topic in the best possible manner with this initiatives atmosphere operation problems pharmaceutical firm pharmaceutical company key performance indicators summary pdf. Use them to share invaluable insights on performance, manufactured, development, research, expenses and impress your audience. This template can be altered and modified as per your expectations. So, grab it now.

Strategies Envr Onmental Operational Challenges Pharmaceutical Company Key Performance Indicators Pictures PDF
The slide shows the key Performance Indicator KPI s which will help the company to track the success rate of implemented strategies. Major KPIs include number of products sold, pharma products manufactures, research and development expenses per year, total number of patients, etc. Deliver an awe inspiring pitch with this creative strategies envr onmental operational challenges pharmaceutical company key performance indicators pictures pdf bundle. Topics like pharmaceutical company key performance indicators can be discussed with this completely editable template. It is available for immediate download depending on the needs and requirements of the user.
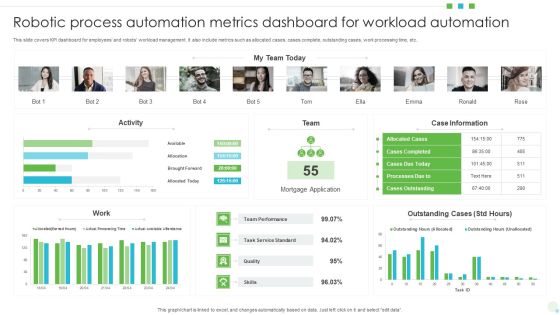
Robotic Process Automation Metrics Dashboard For Workload Automation Mockup PDF
This slide covers KPI dashboard for employees and robots workload management. It also include metrics such as allocated cases, cases complete, outstanding cases, work processing time, etc. Pitch your topic with ease and precision using this Robotic Process Automation Metrics Dashboard For Workload Automation Mockup PDF. This layout presents information on Mortgage Application, Team Performance, Case Information. It is also available for immediate download and adjustment. So, changes can be made in the color, design, graphics or any other component to create a unique layout.
Robotic Process Automation Metrics Dashboard For Tracking Business Return On Investment Information PDF
This slide illustrates KPI Dashboard for measuring time and money saved after RPA deployment. It also include metrics for analysis such as productivity in robot hours, hours saved per process, money saved per process, etc. Pitch your topic with ease and precision using this Robotic Process Automation Metrics Dashboard For Tracking Business Return On Investment Information PDF. This layout presents information on Management, Goal, Productivity. It is also available for immediate download and adjustment. So, changes can be made in the color, design, graphics or any other component to create a unique layout.

Business Sales Procedures Improvement Dashboard Designs PDF
Following slide shows the dashboard for reengineering business sales processes which assist in accelerated processing times, lower costs, better customer service, and stronger employee retention. The KPI are proposals ,opportunities, etc. Pitch your topic with ease and precision using this Business Sales Procedures Improvement Dashboard Designs PDF. This layout presents information on Deals Opportunities Ratios, Opportunity, Deals Conversion Ratio. It is also available for immediate download and adjustment. So, changes can be made in the color, design, graphics or any other component to create a unique layout.
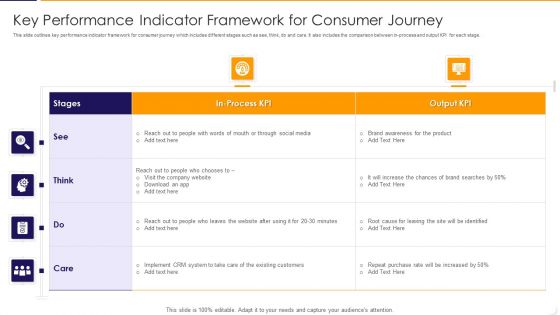
Key Performance Indicator Framework For Consumer Journey Ppt PowerPoint Presentation Gallery Good PDF
This slide outlines key performance indicator framework for consumer journey which includes different stages such as see, think, do and care. It also includes the comparison between in process and output KPI for each stage. Pitch your topic with ease and precision using this key performance indicator framework for consumer journey ppt powerpoint presentation gallery good pdf This layout presents information on social media, system, implement. It is also available for immediate download and adjustment. So, changes can be made in the color, design, graphics or any other component to create a unique layout.

Periodic Business Performance Metrics Scorecard Ideas PDF
The mentioned slide showcases how well organizations KPI have performed in overall four quarters of the year. It track and assess quarterly performance of employees,revenue generation,customer satisfaction, cash flow etc. Pitch your topic with ease and precision using this Periodic Business Performance Metrics Scorecard Ideas PDF. This layout presents information on Employee Performance, Revenue Generation, Customer Satisfaction. It is also available for immediate download and adjustment. So, changes can be made in the color, design, graphics or any other component to create a unique layout.

Human Resource Robotic Process Automation Metrics Operations Kpis With Success Rate Themes PDF
This slide covers KPI dashboard for measuring the impact of RPA deployment on the HR department. It also include metrics such as automated processes, success rate, robot utilization, robot productivity, average processes duration in hours, etc. Showcasing this set of slides titled Human Resource Robotic Process Automation Metrics Operations Kpis With Success Rate Themes PDF. The topics addressed in these templates are Processes Automated, Robot Productivity, Robot Utilization. All the content presented in this PPT design is completely editable. Download it and make adjustments in color, background, font etc. as per your unique business setting.

Service Teams Performance Analysis Robotic Process Automation Metrics Dashboard Brochure PDF
This template covers KPI dashboard for measuring the impact of RPA on support team performance. It also include metrics such as average NPS, average desktop focus, application utilization, etc. Showcasing this set of slides titled Service Teams Performance Analysis Robotic Process Automation Metrics Dashboard Brochure PDF. The topics addressed in these templates are Opportunity, Production Goal Strategically, Application Utilization. All the content presented in this PPT design is completely editable. Download it and make adjustments in color, background, font etc. as per your unique business setting.
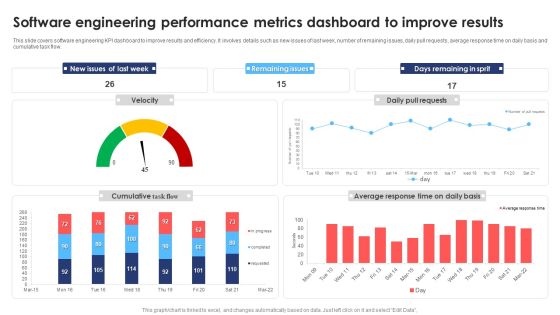
Software Engineering Performance Metrics Dashboard To Improve Results Infographics PDF
This slide covers software engineering KPI dashboard to improve results and efficiency. It involves details such as new issues of last week, number of remaining issues, daily pull requests, average response time on daily basis and cumulative task flow. Pitch your topic with ease and precision using this Software Engineering Performance Metrics Dashboard To Improve Results Infographics PDF. This layout presents information on Software Engineering Performance, Metrics Dashboard Improve Results. It is also available for immediate download and adjustment. So, changes can be made in the color, design, graphics or any other component to create a unique layout.

Best Practices To Improve Vendor Management Strategy Vendor Management Strategies Microsoft PDF
This slide showcases best practices to enhance supplier management strategy. It provides information about requirements, expectations, deadlines, collaboration, key performance indicators KPIs, vendor risk assessment, etc. Presenting Best Practices To Improve Vendor Management Strategy Vendor Management Strategies Microsoft PDF to provide visual cues and insights. Share and navigate important information on three stages that need your due attention. This template can be used to pitch topics like Vendor Collaboration, Risk Assessment, Kpi Establishment. In addtion, this PPT design contains high resolution images, graphics, etc, that are easily editable and available for immediate download.

Marketing Process Pain Points And Opportunities Professional PDF
This slide covers advertising process problems and solutions. The challenges are focus on wrong audience, lack of process definition, error in data analysis and less alignment with sales team. The solutions are develop data driven persona, use software such as Trello, identify KPI etc. Showcasing this set of slides titled Marketing Process Pain Points And Opportunities Professional PDF. The topics addressed in these templates are Focus Wrong Audience, Error Data Analysis. All the content presented in this PPT design is completely editable. Download it and make adjustments in color, background, font etc. as per your unique business setting.
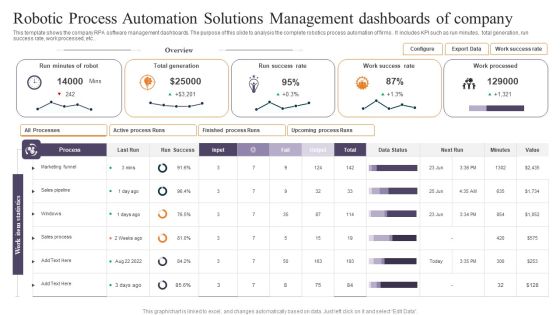
Robotic Process Automation Solutions Management Dashboards Of Company Elements PDF
This template shows the company RPA software management dashboards. The purpose of this slide to analysis the complete robotics process automation of firms . It includes KPI such as run minutes, total generation, run success rate, work processed, etc. Pitch your topic with ease and precision using this Robotic Process Automation Solutions Management Dashboards Of Company Elements PDF. This layout presents information on Minutes Of Robot, Total Generation, Success Rate. It is also available for immediate download and adjustment. So, changes can be made in the color, design, graphics or any other component to create a unique layout.

Stream Processing Dashboard With Incidents Status Ppt PowerPoint Presentation Gallery Portrait PDF
The following slide outlines a KPI dashboard of data ingestion. The dashboard covers key metrics such as incidents by category and severity, contributing cause, root cause, incident trends and status, etc. Showcasing this set of slides titled Stream Processing Dashboard With Incidents Status Ppt PowerPoint Presentation Gallery Portrait PDF. The topics addressed in these templates are Incidens, Category And Severity, Incidents By Facility, Contributing Cause. All the content presented in this PPT design is completely editable. Download it and make adjustments in color, background, font etc. as per your unique business setting.

Five Key Factors Of Strategic Planning Template PDF
The following slide highlights the five key elements off strategic planning illustrating key headings which includes vision, core value, outcome, accountability and kpi Persuade your audience using this Five Key Factors Of Strategic Planning Template PDF. This PPT design covers five stages, thus making it a great tool to use. It also caters to a variety of topics including Objective, Scope, Advantage. Download this PPT design now to present a convincing pitch that not only emphasizes the topic but also showcases your presentation skills.
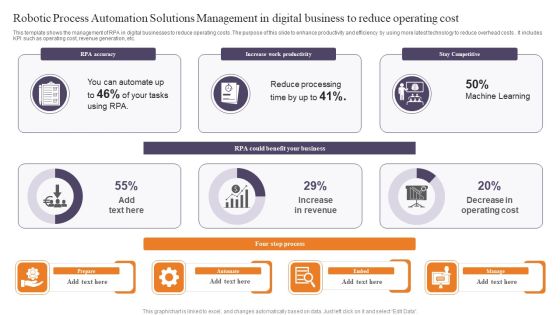
Robotic Process Automation Solutions Management In Digital Business To Reduce Operating Cost Formats PDF
This template shows the management of RPA in digital businesses to reduce operating costs .The purpose of this slide to enhance productivity and efficiency by using more latest technology to reduce overhead costs . It includes KPI such as operating cost, revenue generation, etc. Showcasing this set of slides titled Robotic Process Automation Solutions Management In Digital Business To Reduce Operating Cost Formats PDF. The topics addressed in these templates are Accuracy, Work Productivity, Stay Competitive. All the content presented in this PPT design is completely editable. Download it and make adjustments in color, background, font etc. as per your unique business setting.

Analysing Quality Scores To Determine Relevance Of Ad Content Rules PDF
This slide covers a brief introduction to quality score KPI along with improvement strategies such as using ad group and keyword structure, writing relevant and compelling ad copies, using ad formats and dynamic headlines. Find a pre designed and impeccable Analysing Quality Scores To Determine Relevance Of Ad Content Rules PDF. The templates can ace your presentation without additional effort. You can download these easy to edit presentation templates to make your presentation stand out from others. So, what are you waiting for Download the template from Slidegeeks today and give a unique touch to your presentation.
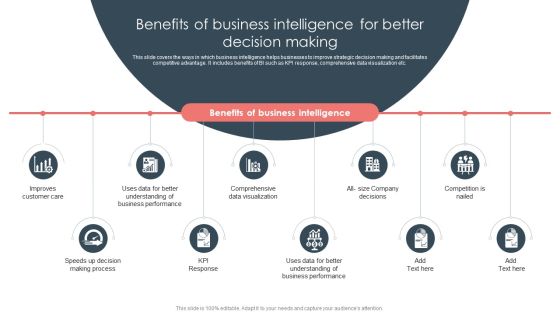
Overview Of BI For Enhanced Decision Making Benefits Of Business Intelligence For Better Decision Making Graphics PDF
This slide covers the ways in which business intelligence helps businesses to improve strategic decision making and facilitates competitive advantage. It includes benefits of BI such as KPI response, comprehensive data visualization etc. Find a pre designed and impeccable Overview Of BI For Enhanced Decision Making Benefits Of Business Intelligence For Better Decision Making Graphics PDF. The templates can ace your presentation without additional effort. You can download these easy to edit presentation templates to make your presentation stand out from others. So, what are you waiting for Download the template from Slidegeeks today and give a unique touch to your presentation.

Advanced Human Resource Value Chain With Kpis Icons PDF
This slide shows advanced HR value chain with KPIs to demonstrate its role in achieving goals. It includes aspects such as HR enablers, activities, outcomes, strategic focus , and KPI for financial, process and customer. Showcasing this set of slides titled Advanced Human Resource Value Chain With Kpis Icons PDF. The topics addressed in these templates are Strategic Focus, Process Kpis, Customer Kpis. All the content presented in this PPT design is completely editable. Download it and make adjustments in color, background, font etc. as per your unique business setting.

Database Migration Assessment Executive Summary Dashboard Mockup PDF
This slide shows the KPI dashboard of data migration assessment. It includes details related to development status to plan, target design percentage complete, field mapping percentage complete and field mapping and rule backlog. Pitch your topic with ease and precision using this Database Migration Assessment Executive Summary Dashboard Mockup PDF. This layout presents information on Wave, Process Area, Rule Build Status Plan. It is also available for immediate download and adjustment. So, changes can be made in the color, design, graphics or any other component to create a unique layout
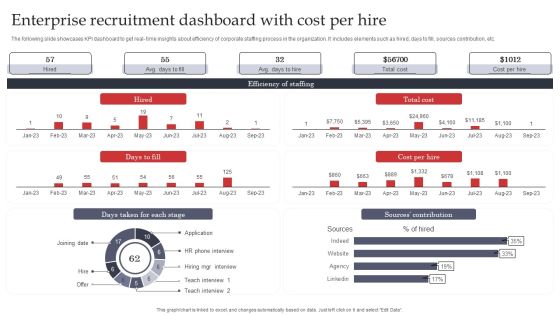
Enterprise Recruitment Dashboard With Cost Per Hire Graphics PDF
The following slide showcases KPI dashboard to get real- time insights about efficiency of corporate staffing process in the organization. It includes elements such as hired, days to fill, sources contribution, etc. Pitch your topic with ease and precision using this Enterprise Recruitment Dashboard With Cost Per Hire Graphics PDF. This layout presents information on Enterprise, Contribution, Cost. It is also available for immediate download and adjustment. So, changes can be made in the color, design, graphics or any other component to create a unique layout.
Dashboard To Track Automated Manufacturing Workflow Progress Professional PDF
Following slide demonstrates KPI dashboard for monitoring automated manufacturing processes performance which can be used by businesses to increase organization efficiency. It includes key components such as total business revenue, Number of customers, total units produced, production rate, monthly production by manufacturing lines, etc. Showcasing this set of slides titled Dashboard To Track Automated Manufacturing Workflow Progress Professional PDF. The topics addressed in these templates are Machine Utilization, Product Delivery, Defective Units Produced. All the content presented in this PPT design is completely editable. Download it and make adjustments in color, background, font etc. as per your unique business setting.

Formulating Branding Strategy To Enhance Revenue And Sales Addressing The Process To Develop Brand Designs PDF
The following slide outlines the six step process to develop and strengthen brand communication strategy. Understanding of target audience, selecting the channels, developing customer persona, determining the product USP, crafting the message and establishing key performance indicators KPI are the steps which are mentioned in the slide Crafting an eye catching presentation has never been more straightforward. Let your presentation shine with this tasteful yet straightforward Formulating Branding Strategy To Enhance Revenue And Sales Addressing The Process To Develop Brand Designs PDF template. It offers a minimalistic and classy look that is great for making a statement. The colors have been employed intelligently to add a bit of playfulness while still remaining professional. Construct the ideal Formulating Branding Strategy To Enhance Revenue And Sales Addressing The Process To Develop Brand Designs PDF that effortlessly grabs the attention of your audience. Begin now and be certain to wow your customers.

BI Implementation To Enhance Hiring Process Hr Talent Management Key Metrics Dashboard Brochure PDF
This slide represents the KPI dashboard to track and monitor management of talent by the HR department. It includes details related to talent satisfaction, talent turnover rate, fired talents etc.This BI Implementation To Enhance Hiring Process Hr Talent Management Key Metrics Dashboard Brochure PDF is perfect for any presentation, be it in front of clients or colleagues. It is a versatile and stylish solution for organizing your meetings. The BI Implementation To Enhance Hiring Process Hr Talent Management Key Metrics Dashboard Brochure PDF features a modern design for your presentation meetings. The adjustable and customizable slides provide unlimited possibilities for acing up your presentation. Slidegeeks has done all the homework before launching the product for you. So, do not wait, grab the presentation templates today.

ATS Administration To Improve Asset Management Dashboard To Track System Guidelines PDF
This slide covers KPI dashboard to track system performance. It involves detail such as total number of assets, value of assets and purchases in fiscal year. Get a simple yet stunning designed ATS Administration To Improve Asset Management Dashboard To Track System Guidelines PDF. It is the best one to establish the tone in your meetings. It is an excellent way to make your presentations highly effective. So, download this PPT today from Slidegeeks and see the positive impacts. Our easy-to-edit ATS Administration To Improve Asset Management Dashboard To Track System Guidelines PDF can be your go-to option for all upcoming conferences and meetings. So, what are you waiting for Grab this template today.
Enhanced Lead Performance Tracking Dashboard Improving Lead Generation Process Professional PDF
This slide covers the KPI dashboard for tracking improved lead management system performance. It includes metrics such as visitors, social media followers, email subscribers, organic leads, etc. Explore a selection of the finest Enhanced Lead Performance Tracking Dashboard Improving Lead Generation Process Professional PDF here. With a plethora of professionally designed and pre made slide templates, you can quickly and easily find the right one for your upcoming presentation. You can use our Enhanced Lead Performance Tracking Dashboard Improving Lead Generation Process Professional PDF to effectively convey your message to a wider audience. Slidegeeks has done a lot of research before preparing these presentation templates. The content can be personalized and the slides are highly editable. Grab templates today from Slidegeeks.
Inbound Lead Performance Tracking Dashboard Improving Lead Generation Process Pictures PDF
This slide covers the KPI dashboard for evaluating inbound lead performance. It includes metrics such as lead to opportunity ratio, opportunity to win ratio, lead conversion ratio, inbound leads, and leads in the sales funnel. The Inbound Lead Performance Tracking Dashboard Improving Lead Generation Process Pictures PDF is a compilation of the most recent design trends as a series of slides. It is suitable for any subject or industry presentation, containing attractive visuals and photo spots for businesses to clearly express their messages. This template contains a variety of slides for the user to input data, such as structures to contrast two elements, bullet points, and slides for written information. Slidegeeks is prepared to create an impression.

Consumer Lead Generation Process Enhanced Lead Performance Tracking Dashboard Portrait PDF
This slide covers the KPI dashboard for tracking improved lead management system performance. It includes metrics such as visitors, social media followers, email subscribers, organic leads, etc. Slidegeeks is here to make your presentations a breeze with Consumer Lead Generation Process Enhanced Lead Performance Tracking Dashboard Portrait PDF With our easy-to-use and customizable templates, you can focus on delivering your ideas rather than worrying about formatting. With a variety of designs to choose from, youre sure to find one that suits your needs. And with animations and unique photos, illustrations, and fonts, you can make your presentation pop. So whether youre giving a sales pitch or presenting to the board, make sure to check out Slidegeeks first.

Marketers Guide To Data Analysis Optimization Analyzing Quality Scores To Determine Relevance Of Ad Content Diagrams PDF
This slide covers a brief introduction to quality score KPI along with improvement strategies such as using ad group and keyword structure, writing relevant and compelling ad copies, using ad formats and dynamic headlines. If you are looking for a format to display your unique thoughts, then the professionally designed Marketers Guide To Data Analysis Optimization Analyzing Quality Scores To Determine Relevance Of Ad Content Diagrams PDF is the one for you. You can use it as a Google Slides template or a PowerPoint template. Incorporate impressive visuals, symbols, images, and other charts. Modify or reorganize the text boxes as you desire. Experiment with shade schemes and font pairings. Alter, share or cooperate with other people on your work. Download Marketers Guide To Data Analysis Optimization Analyzing Quality Scores To Determine Relevance Of Ad Content Diagrams PDF and find out how to give a successful presentation. Present a perfect display to your team and make your presentation unforgettable.

Real Time Content Marketing Result Dashboard Ppt Infographic Template Example PDF
The following slide depicts real time content marketing KPI dashboard to monitor traffic flow and manage promotional efforts. It includes elements such as visitors by channel, conversion rate, search, direct, sessions, average time engaged etc. The Real Time Content Marketing Result Dashboard Ppt Infographic Template Example PDF is a compilation of the most recent design trends as a series of slides. It is suitable for any subject or industry presentation, containing attractive visuals and photo spots for businesses to clearly express their messages. This template contains a variety of slides for the user to input data, such as structures to contrast two elements, bullet points, and slides for written information. Slidegeeks is prepared to create an impression.

Digital Competency Evaluation And Modification Key Kpis For Digital Transformation Portrait PDF
Purpose of the following slide is to show the KPI which can be used to measure the digital transformation, these KPIs can be customer experience, user metrics and application metrics. Do you have an important presentation coming up Are you looking for something that will make your presentation stand out from the rest Look no further than Digital Competency Evaluation And Modification Key Kpis For Digital Transformation Portrait PDF. With our professional designs, you can trust that your presentation will pop and make delivering it a smooth process. And with Slidegeeks, you can trust that your presentation will be unique and memorable. So why wait Grab Digital Competency Evaluation And Modification Key Kpis For Digital Transformation Portrait PDF today and make your presentation stand out from the rest.
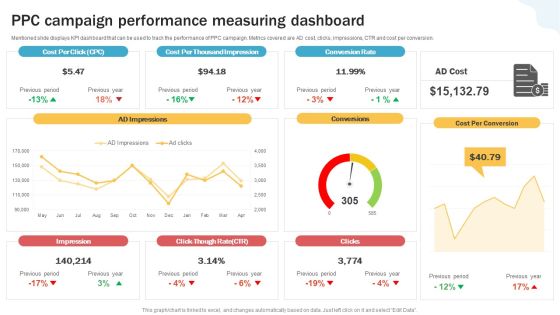
Developing Personal Brand On Social Media Channels Ppc Campaign Performance Measuring Sample PDF
Mentioned slide displays KPI dashboard that can be used to track the performance of PPC campaign. Metrics covered are AD cost, clicks, impressions, CTR and cost per conversion.Do you have an important presentation coming up Are you looking for something that will make your presentation stand out from the rest Look no further than Developing Personal Brand On Social Media Channels Ppc Campaign Performance Measuring Sample PDF. With our professional designs, you can trust that your presentation will pop and make delivering it a smooth process. And with Slidegeeks, you can trust that your presentation will be unique and memorable. So why wait Grab Developing Personal Brand On Social Media Channels Ppc Campaign Performance Measuring Sample PDF today and make your presentation stand out from the rest.

Market Evaluation Of IT Industry Financial Dashboard To Track Organization Expenses Clipart PDF
The following slide showcases KPI dashboard which can be used by finance managers to evaluate financial health of company. Revenue, expenses, net profit, bills receivable, bills payable, quick ratio, current ratio are some of the major metrics which are outlined in the slide. Do you have an important presentation coming up Are you looking for something that will make your presentation stand out from the rest Look no further than Market Evaluation Of IT Industry Financial Dashboard To Track Organization Expenses Clipart PDF. With our professional designs, you can trust that your presentation will pop and make delivering it a smooth process. And with Slidegeeks, you can trust that your presentation will be unique and memorable. So why wait Grab Market Evaluation Of IT Industry Financial Dashboard To Track Organization Expenses Clipart PDF today and make your presentation stand out from the rest.
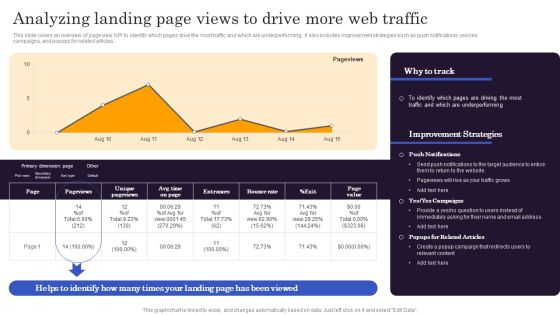
Marketers Guide To Data Analysis Optimization Analyzing Landing Page Views To Drive More Web Traffic Rules PDF
This slide covers an overview of page view KPI to identify which pages drive the most traffic and which are underperforming. It also includes improvement strategies such as push notifications, yes yes campaigns, and popups for related articles. Do you have an important presentation coming up Are you looking for something that will make your presentation stand out from the rest Look no further than Marketers Guide To Data Analysis Optimization Analyzing Landing Page Views To Drive More Web Traffic Rules PDF. With our professional designs, you can trust that your presentation will pop and make delivering it a smooth process. And with Slidegeeks, you can trust that your presentation will be unique and memorable. So why wait Grab Marketers Guide To Data Analysis Optimization Analyzing Landing Page Views To Drive More Web Traffic Rules PDF today and make your presentation stand out from the rest.

Key Performance Indicators For Business Powerpoint Slide Background Designs
This is a key performance indicators for business powerpoint slide background designs. This is a five stage process. The stages in this process are kpi.
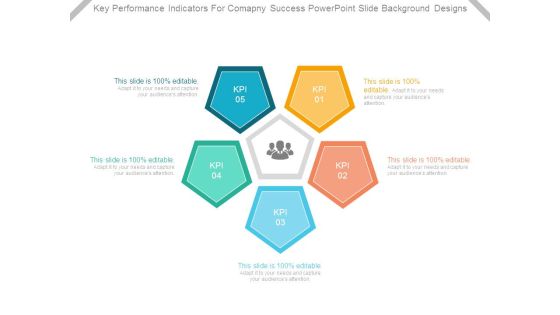
Key Performance Indicators For Company Success Powerpoint Slide Background Designs
This is a key performance indicators for company success powerpoint slide background designs. This is a five stage process. The stages in this process are kpi.

Business Process Performance Indicators Ppt Slide Design
This is a business process performance indicators ppt slide design. This is a four stage process. The stages in this process are focus, objective, measures, targets, invites, vision and strategy, area of focus, metrics, targets, objectives.

Business Performance Management Systems Ppt Design Templates
This is a business performance management systems ppt design templates. This is a five stage process. The stages in this process are people, process, strategy, kpi, accountability.
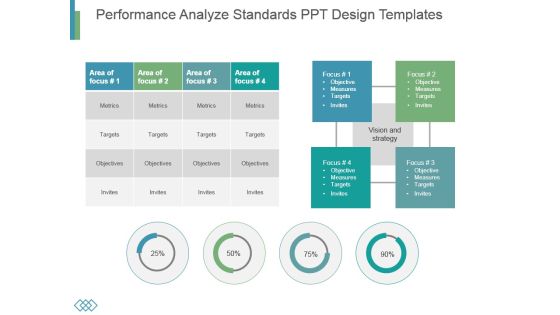
Performance Analyze Standards Ppt Design Templates
This is a performance analyze standards ppt design templates. This is a four stage process. The stages in this process are metrics, targets, objectives, invites.

Designing Effective Kpis Ppt Example
This is a designing effective kpis ppt example. This is a seven stage process. The stages in this process are goal, audience, cost, benchmark, kpi, tool, insight, the networked nonprofit.
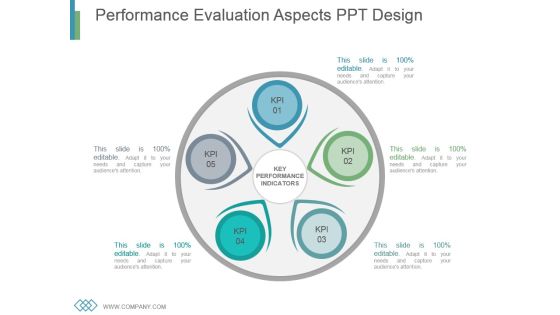
Performance Evaluation Aspects Ppt Design
This is a performance evaluation aspects ppt design. This is a five stage process. The stages in this process are business, marketing, process, strategy, management.

Bulb Design For Creative Thinking Process Powerpoint Ideas
This is a bulb design for creative thinking process powerpoint ideas. This is a five stage process. The stages in this process are idea bulls, security, business, strategy, success.

Key Financial Ratios Template Ppt PowerPoint Presentation Show Graphics Design
This is a key financial ratios template ppt powerpoint presentation show graphics design. This is a four stage process. The stages in this process are liquidity, profitability, activity, solvency.
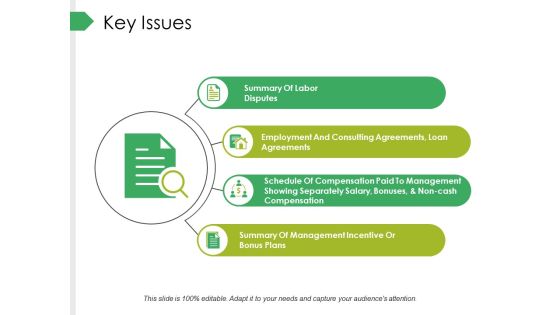
Key Issues Ppt PowerPoint Presentation Professional Design Inspiration
This is a key issues ppt powerpoint presentation professional design inspiration. This is a four stage process. The stages in this process are business, summary of labor disputes, summary of management incentive or bonus plans, employment and consulting agreements, loan agreements, marketing.
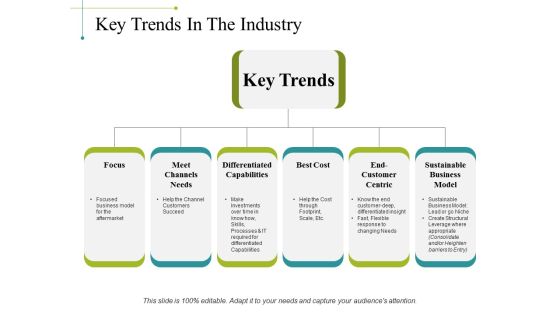
Key Trends In The Industry Ppt PowerPoint Presentation Portfolio Design Inspiration
This is a key trends in the industry ppt powerpoint presentation portfolio design inspiration. This is a six stage process. The stages in this process are focus, meet channels needs, differentiated capabilities, best cost, sustainable business model.

Business Performance Measures Powerpoint Slide
This is a business performance measures powerpoint slide designs. This is a three stage process. The stages in this process are business, marketing, performance, presentation, management.

Bar Chart With Magnifying Glass For Financial Analysis Ppt Powerpoint Presentation Infographics Designs Download
This is a bar chart with magnifying glass for financial analysis ppt powerpoint presentation infographics designs download. This is a three stage process. The stages in this process are business metrics, business kpi, business dashboard.

Media Mix Strategy Ppt PowerPoint Presentation Pictures Background Designs
This is a media mix strategy ppt powerpoint presentation pictures background designs. This is a four stage process. The stages in this process are intelligence, content venue, promotional , platforms, kpi, strategy.
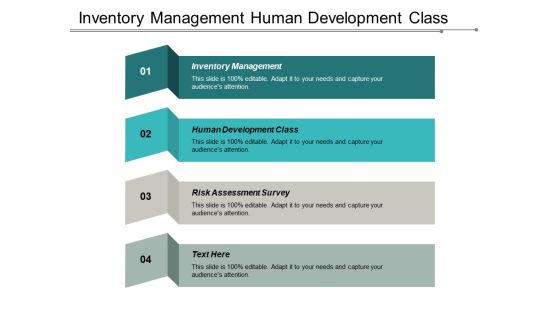
Inventory Management Human Development Class Risk Assessment Survey Ppt PowerPoint Presentation Show Designs
This is a inventory management human development class risk assessment survey ppt powerpoint presentation show designs. This is a four stage process. The stages in this process are inventory management kpi, marketing strategy research, stress management.
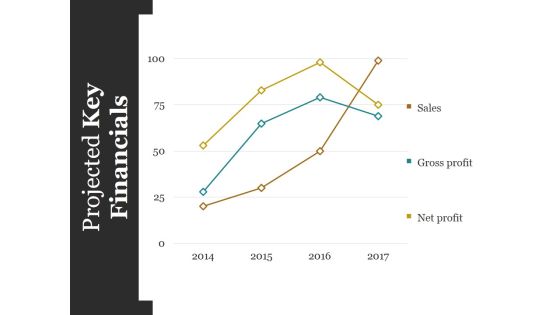
Projected Key Financials Template Ppt PowerPoint Presentation Styles Graphics Design
This is a projected key financials template ppt powerpoint presentation styles graphics design. This is a four stage process. The stages in this process are sales, gross profit, net profit.

Mid Term Goals Set Up Powerpoint Slide Design Ideas
This is a mid term goals set up powerpoint slide design ideas. This is a four stage process. The stages in this process are arrows, business, marketing, planning, years.

10 Designs To An Amazing Pitch Example Of Ppt
This is a 10 designs to an amazing pitch example of ppt. This is a ten stage process. The stages in this process are business model, money, market size, the solution, team, marketing plan, competition, elevator pitch, proprietary tech, the problem.

Steps Of Yearly Operations Planning Process Ppt PowerPoint Presentation Gallery Template PDF
The following slide showcases various steps of annual operations planning process. It includes key steps like gather diversified team, analyze precious years, set realistic goals, determine KPI, prepare monthly budgets, plan for future and revisit regularly. Pitch your topic with ease and precision using this Steps Of Yearly Operations Planning Process Ppt PowerPoint Presentation Gallery Template PDF. This layout presents information on Analyze Previous Years, Set Realistic Objectives, Determine KPI. It is also available for immediate download and adjustment. So, changes can be made in the color, design, graphics or any other component to create a unique layout.

Essential Factors To Develop Sales Remuneration Strategy Ppt Gallery Graphics PDF
The following slide highlights the essential factors to develop sales commission scheme. It illustrates company goals, roles in team, budget and industry, on target earnings, sales team kpi, company culture and payout. Persuade your audience using this Essential Factors To Develop Sales Remuneration Strategy Ppt Gallery Graphics PDF. This PPT design covers seven stages, thus making it a great tool to use. It also caters to a variety of topics including Company Goals, Budget And Industry, On Target Earnings, Sales Team KPI. Download this PPT design now to present a convincing pitch that not only emphasizes the topic but also showcases your presentation skills.
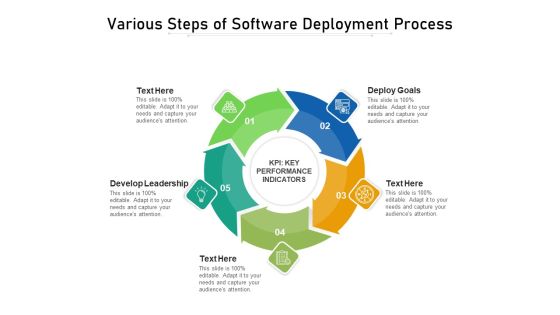
Various Steps Of Software Deployment Process Ppt PowerPoint Presentation Slides Design Ideas PDF
Presenting various steps of software deployment process ppt powerpoint presentation slides design ideas pdf to dispense important information. This template comprises five stages. It also presents valuable insights into the topics including deploy goals, develop leadership, kpi, key performance indicators. This is a completely customizable PowerPoint theme that can be put to use immediately. So, download it and address the topic impactfully.
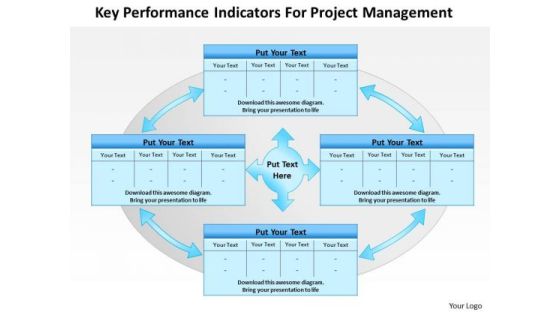
Business Framework Key Performance Indicators For Project Management PowerPoint Presentation
Our above diagram provides framework of key performance indicators for project management. It contains four interconnected text boxes. Download this diagram to make professional presentations on project management. This diagram enables the users to create their own display of the required processes in an easy way.
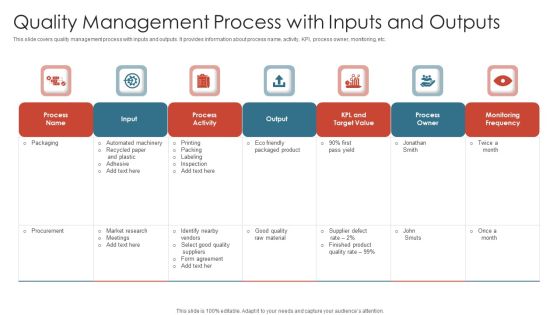
Quality Management Process With Inputs And Outputs Topics PDF
This slide covers quality management process with inputs and outputs. It provides information about process name, activity, KPI, process owner, monitoring, etc. Showcasing this set of slides titled quality management process with inputs and outputs topics pdf. The topics addressed in these templates are output, process owner, monitoring frequency. All the content presented in this PPT design is completely editable. Download it and make adjustments in color, background, font etc. as per your unique business setting.

Sales Quarterly Performance Review System Service Support Department Infographics PDF
This slide shows sales customer service division quarterly business review QBR. It provides information about quality, accuracy, absenteeism, attrition, call flow, employee tenure, etc. Pitch your topic with ease and precision using this Sales Quarterly Performance Review System Service Support Department Infographics PDF. This layout presents information on KPI, Goal, Quality Accuracy. It is also available for immediate download and adjustment. So, changes can be made in the color, design, graphics or any other component to create a unique layout.
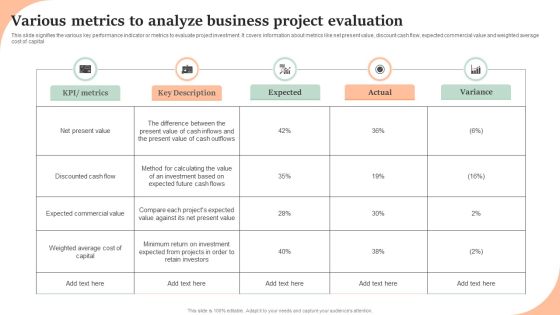
Various Metrics To Analyze Business Project Evaluation Inspiration PDF
This slide signifies the various key performance indicator or metrics to evaluate project investment. It covers information about metrics like net present value, discount cash flow, expected commercial value and weighted average cost of capital. Pitch your topic with ease and precision using this Various Metrics To Analyze Business Project Evaluation Inspiration PDF. This layout presents information on KPI, Metrics, Key Description, Expected, Actual, Variance. It is also available for immediate download and adjustment. So, changes can be made in the color, design, graphics or any other component to create a unique layout.

Process Of Developing A Digital Market Growth And Development Tactics Elements PDF
This Slide shows process of developing a digital marketing strategy which involves identifying market oriented Key Performance Indicators KPI, understand customers and market, strategic plan development, plan implementation and evaluate. This can help digital marketers in boosting online sales and increase in customer engagement. Persuade your audience using this Process Of Developing A Digital Market Growth And Development Tactics Elements PDF. This PPT design covers five stages, thus making it a great tool to use. It also caters to a variety of topics including Strategic Plan Development, Plan Implementation, Evaluate. Download this PPT design now to present a convincing pitch that not only emphasizes the topic but also showcases your presentation skills.

Various Stages For Business Process Transformation Ppt PowerPoint Presentation Model Slideshow PDF
Persuade your audience using this various stages for business process transformation ppt powerpoint presentation model slideshow pdf. This PPT design covers four stages, thus making it a great tool to use. It also caters to a variety of topics including identity and communicating the need for change, create team of experts, find the inefficient processes and define key performance indicators kpi, reengineer the processes and compare kpis. Download this PPT design now to present a convincing pitch that not only emphasizes the topic but also showcases your presentation skills.

Customer Support Staff Oriented Goals And Objectives Download PDF
This slide showcases the goals and its objectives of an employee working under customer support team. It also includes the key performance indicators that helps to measure progress against your most strategic objectives. Persuade your audience using this Customer Support Staff Oriented Goals And Objectives Download PDF. This PPT design covers three stages, thus making it a great tool to use. It also caters to a variety of topics including Goal, Objectives, KPI. Download this PPT design now to present a convincing pitch that not only emphasizes the topic but also showcases your presentation skills.

Managers Scorecard Kpis For Startups Slides PDF
This slide mentions key performance indicators that are to be considered while formulating balanced scorecard for startups. It includes attraction, engagement, value and retention KPI. Persuade your audience using this Managers Scorecard Kpis For Startups Slides PDF. This PPT design covers four stages, thus making it a great tool to use. It also caters to a variety of topics including Value, Attraction, Retention. Download this PPT design now to present a convincing pitch that not only emphasizes the topic but also showcases your presentation skills.

Our Key Performance Indicators Powerpoint Slide Designs
This is a our key performance indicators powerpoint slide designs. This is a five stage process. The stages in this process are cash flow, turnover, productivity, customer satisfaction, net income.
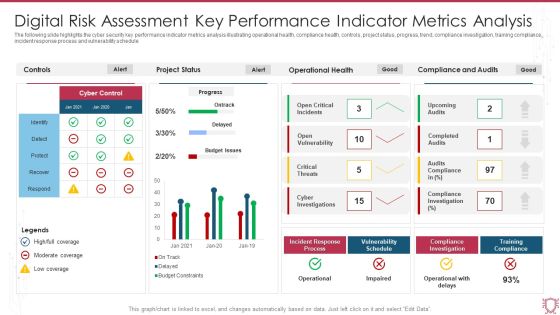
Digital Risk Assessment Key Performance Indicator Metrics Analysis Infographics PDF
The following slide highlights the cyber security key performance indicator metrics analysis illustrating operational health, compliance health, controls, project status, progress, trend, compliance investigation, training compliance, incident response process and vulnerability schedule. Showcasing this set of slides titled Digital Risk Assessment Key Performance Indicator Metrics Analysis Infographics PDF. The topics addressed in these templates are Project Status, Operational Health, Compliance And Audits. All the content presented in this PPT design is completely editable. Download it and make adjustments in color, background, font etc. as per your unique business setting.

Cyber Security Key Performance Indicators Metrics Dashboard Mockup PDF
This slide covers cyber security health status dashboard . It also includes audit and compliance, controls health, project status, incident response process, vulnerability patching schedule, investigation process and training compliance. Pitch your topic with ease and precision using this Cyber Security Key Performance Indicators Metrics Dashboard Mockup PDF. This layout presents information on Cyber Security, Vulnerability Patching Schedule, Compliance Investigation Process. It is also available for immediate download and adjustment. So, changes can be made in the color, design, graphics or any other component to create a unique layout.

Steps Involved In Electronic E Procurement System Microsoft PDF
The following slide showcases transition process and measuring criteria to assure success of e Procurement after implementation. The steps covered are identify objectives, review process, prepare strategy, ensure management support backing, develop KPI, optimal solution, team formation and measure success. Persuade your audience using this Steps Involved In Electronic E Procurement System Microsoft PDF. This PPT design covers eight stages, thus making it a great tool to use. It also caters to a variety of topics including Prepare Procurement, Team Formation, Review Procurement Process. Download this PPT design now to present a convincing pitch that not only emphasizes the topic but also showcases your presentation skills.

Communication Feedback Survey Forms After Consulting Doctor Formats PDF
This templates shows the results of after consulting. The purpose of his slide is to evaluate the communication flow between patient and doctor to receive valuable feedback major communication KPI. It includes such as does doctor listen patiently, give valuable feedback involve in decision making, etc. Showcasing this set of slides titled Communication Feedback Survey Forms After Consulting Doctor Formats PDF. The topics addressed in these templates are Problem Patiently, Explanation Prescription, Doctor Lacking. All the content presented in this PPT design is completely editable. Download it and make adjustments in color, background, font etc. as per your unique business setting.
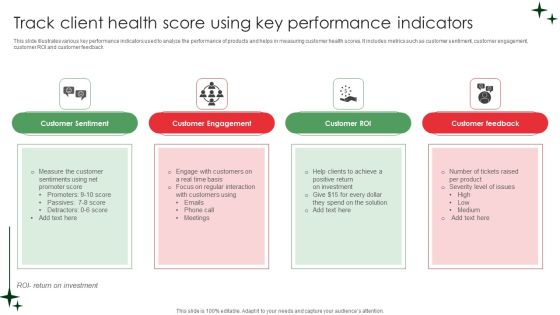
Track Client Health Score Using Key Performance Indicators Summary PDF
This slide illustrates various key performance indicators used to analyze the performance of products and helps in measuring customer health scores. It includes metrics such as customer sentiment, customer engagement, customer ROI and customer feedback. Persuade your audience using this Track Client Health Score Using Key Performance Indicators Summary PDF. This PPT design covers four stages, thus making it a great tool to use. It also caters to a variety of topics including Customer Sentiment, Customer Engagement, Customer ROI. Download this PPT design now to present a convincing pitch that not only emphasizes the topic but also showcases your presentation skills.

Key Performance Indicators For Staff Performance Management Clipart PDF
The following slide highlights the key performance Indicators for staff performance management illustrating key headings which includes revenue per hour, profit per employee, utilization rate, task completion rate, overtime per employee and employee capacity Persuade your audience using this Key Performance Indicators For Staff Growth Topics PDF This PPT design covers six stages, thus making it a great tool to use. It also caters to a variety of topics including Revenue Employee, Profit Employee, Task Completion Download this PPT design now to present a convincing pitch that not only emphasizes the topic but also showcases your presentation skills.

Key Performance Indicators Ppt PowerPoint Presentation Show Graphics Design
Presenting this set of slides with name key performance indicators ppt powerpoint presentation show graphics design. This is a five stage process. The stages in this process are business, management, planning, strategy, marketing. This is a completely editable PowerPoint presentation and is available for immediate download. Download now and impress your audience.
Key Performance Indicators Template 1 Ppt PowerPoint Presentation Background Designs
This is a key performance indicators template 1 ppt powerpoint presentation background designs. This is a five stage process. The stages in this process are business, management, process, strategy, success.

Key Performance Indicators Ppt PowerPoint Presentation Pictures Design Templates
This is a key performance indicators ppt powerpoint presentation pictures design templates. This is a five stage process. The stages in this process are day sales outstanding, cost of goods sold, customer retention rate.

Key Performance Indicators For Ecommerce Diagram Ppt Design
This is a key performance indicators for ecommerce diagram ppt design. This is a eight stage process. The stages in this process are cost strategies, price strategies, market share strategies, market size strategies, conversion optimization, social sentiment, economic factors, brand awareness.
Sales Order Processing Performance Tracking Indicators Graphics PDF
The following slide showcases key performance indicators for sales order fulfilment to meet customer expectations, specifications, deliver goods on time, compare order fulfilment against past orders. It includes elements such as category, key performance indicators, expected rate and actual rate. Showcasing this set of slides titled Sales Order Processing Performance Tracking Indicators Graphics PDF. The topics addressed in these templates are Customer Metrics, Inbound Metrics, Financial Metrics. All the content presented in this PPT design is completely editable. Download it and make adjustments in color, background, font etc. as per your unique business setting.

Call Center Process Key Performance Indicator Dashboard Mockup PDF
This slide showcases call center process measurements and key performance indicators so managers and teams can keep track of and improve performance . It includes received calls, calculating speed of answering calls , ended calls before starting conversations , average calls per minute etc. Showcasing this set of slides titled Call Center Process Key Performance Indicator Dashboard Mockup PDF. The topics addressed in these templates are Received Calls, Conversation, Abandon Rate. All the content presented in this PPT design is completely editable. Download it and make adjustments in color, background, font etc. as per your unique business setting.
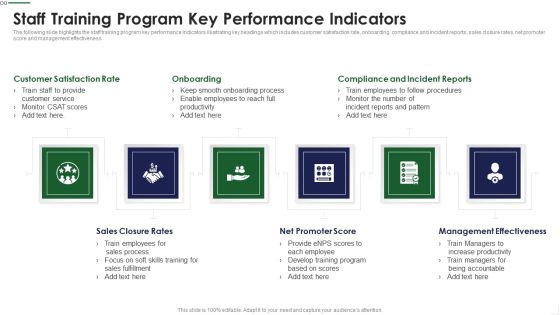
Staff Training Program Key Performance Indicators Diagrams PDF
The following slide highlights the staff training program key performance Indicators illustrating key headings which includes customer satisfaction rate, onboarding, compliance and incident reports, sales closure rates, net promoter score and management effectiveness Presenting Staff Training Program Key Performance Indicators Diagrams PDF to provide visual cues and insights. Share and navigate important information on six stages that need your due attention. This template can be used to pitch topics like Turnover Quarter, Turnover Type, Turnover Reasons In addtion, this PPT design contains high resolution images, graphics, etc, that are easily editable and available for immediate download.

Key Performance Indicators For Learning And Development Measurement Themes PDF
This slide represents KPIs that helps to measure and monitor employee performance in company. It includes four indicators training efficiency, completion rate, employee retention, ROI and scalability. Persuade your audience using this Key Performance Indicators For Learning And Development Measurement Themes PDF. This PPT design covers Four stages, thus making it a great tool to use. It also caters to a variety of topics including Training Efficiency And Impact, Completion Rate Employee Retention. Download this PPT design now to present a convincing pitch that not only emphasizes the topic but also showcases your presentation skills.

Measuring Training And Development Program Key Performance Indicators Template PDF
The purpose of this slide is to showcase certain KPIs to measure the effectiveness of a training and development program. The specific measuring criteria include training skill assessment, recognizing change, employee engagement and training feedback. Persuade your audience using this Measuring Training And Development Program Key Performance Indicators Template PDF. This PPT design covers five stages, thus making it a great tool to use. It also caters to a variety of topics including Training Skill Assessment, Recognizing Change, Employee Engagement. Download this PPT design now to present a convincing pitch that not only emphasizes the topic but also showcases your presentation skills.

Key Performance Indicators For Fulfilment Strategy Slides PDF
The following slide displays major obstacles faced by organizations in shipping and fulfilling orders received. It includes information about supply chain issues, seasonal and international fulfilment and inventory management. Persuade your audience using this Key Performance Indicators For Fulfilment Strategy Slides PDF. This PPT design covers six stages, thus making it a great tool to use. It also caters to a variety of topics including Transportation Costs, Picking Accuracy, Order Accuracy. Download this PPT design now to present a convincing pitch that not only emphasizes the topic but also showcases your presentation skills.

Key Performance Indicators For Advertising And Promotion Plan Background PDF
This slide shows KPIs for measuring effectiveness of advertising and promotion plan for increasing overall revenue. It include KPIs such as conversion rate, cost per lead and social media management, etc. Persuade your audience using this Key Performance Indicators For Advertising And Promotion Plan Background PDF. This PPT design covers five stages, thus making it a great tool to use. It also caters to a variety of topics including Conversion Rate, Cost Per Lead, Social Media Management. Download this PPT design now to present a convincing pitch that not only emphasizes the topic but also showcases your presentation skills.

Key Performance Indicators To Track Effectiveness Of Healthcare Video Marketing Professional PDF
The following slide outlines multiple metrics that can assist marketers in evaluating success of healthcare video marketing campaign. The key metrics are total views, engagement rate, click-through rate CTR, conversion rate, watch time, and social shares. Do you have an important presentation coming up Are you looking for something that will make your presentation stand out from the rest Look no further than Key Performance Indicators To Track Effectiveness Of Healthcare Video Marketing Professional PDF. With our professional designs, you can trust that your presentation will pop and make delivering it a smooth process. And with Slidegeeks, you can trust that your presentation will be unique and memorable. So why wait Grab Key Performance Indicators To Track Effectiveness Of Healthcare Video Marketing Professional PDF today and make your presentation stand out from the rest
List Business Key Performance Indicators Ppt PowerPoint Presentation Icon Designs Download
Presenting this set of slides with name list business key performance indicators ppt powerpoint presentation icon designs download. This is an editable Powerpoint four stages graphic that deals with topics like list business key performance indicators to help convey your message better graphically. This product is a premium product available for immediate download and is 100 percent editable in Powerpoint. Download this now and use it in your presentations to impress your audience.
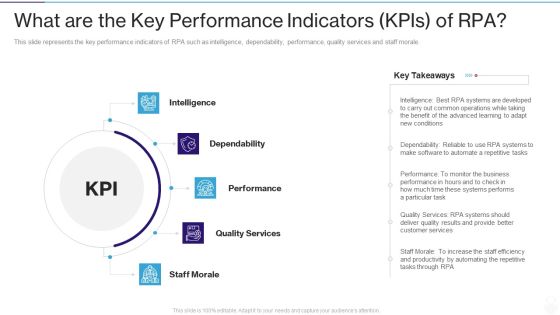
RPA IT What Are The Key Performance Indicators Kpis Of RPA Ppt Professional Design Templates PDF
This slide represents the key performance indicators of RPA such as intelligence, dependability, performance, quality services and staff morale. This is a rpa it what are the key performance indicators kpis of rpa ppt professional design templates pdf template with various stages. Focus and dispense information on five stages using this creative set, that comes with editable features. It contains large content boxes to add your information on topics like staff morale, quality services, performance, dependability, intelligence. You can also showcase facts, figures, and other relevant content using this PPT layout. Grab it now.

Tactical Approach For Vendor Reskilling Key Metrices To Measure The Supplier Performance Designs PDF
This slide indicates the key metrices to measure the supplier performance. The major KPIs listed are quality, delivery, cost, after sales support, availability and reliability along with their optimum values. Slidegeeks is here to make your presentations a breeze with Tactical Approach For Vendor Reskilling Key Metrices To Measure The Supplier Performance Designs PDF With our easy to use and customizable templates, you can focus on delivering your ideas rather than worrying about formatting. With a variety of designs to choose from, you are sure to find one that suits your needs. And with animations and unique photos, illustrations, and fonts, you can make your presentation pop. So whether you are giving a sales pitch or presenting to the board, make sure to check out Slidegeeks first.

Value Driven Management Process To Identify Performance Indicator Themes PDF
slide defines the phases leading to defining and implementing value drivers and key performance indicators. The purpose of this template is to analyze value based management model. It also includes elements such as analysis, recommendation, etc. Persuade your audience using this Value Driven Management Process To Identify Performance Indicator Themes PDF. This PPT design covers three stages, thus making it a great tool to use. It also caters to a variety of topics including Recommendation, Analytical Phase, Implementation. Download this PPT design now to present a convincing pitch that not only emphasizes the topic but also showcases your presentation skills.
Key Performance Indicators Of A Shipping Firm Ppt PowerPoint Presentation Background Designs
This is a key performance indicators of a shipping firm ppt powerpoint presentation background designs. This is a eight stage process. The stages in this process are business, strategy, marketing, process, table, management.

Business Framework Key Metrics Required For Different Company Situations PowerPoint Presentation
This diagram has been designed with framework of key metrics required for different company situations. This diagram contains rectangle of operating value drivers with four sections inside it representing terms like growth of net Income, multiyear DCF of economic profit, net income, return on sales, ROIC-WACC, and economic profit. Use this as a major element in streamlining any business process.
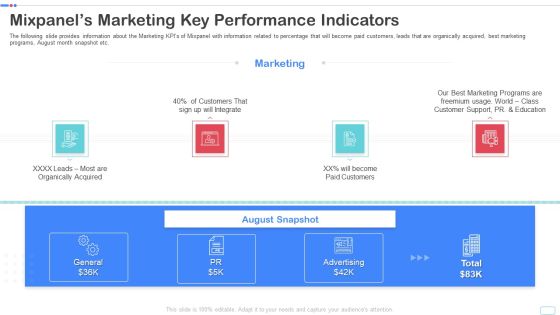
Mixpanel Capital Raising Pitch Deck Mixpanels Marketing Key Performance Indicators Portrait PDF
The following slide provides information about the Marketing KPIs of Mixpanel with information related to percentage that will become paid customers, leads that are organically acquired, best marketing programs, August month snapshot etc. Presenting mixpanel capital raising pitch deck mixpanels marketing key performance indicators portrait pdf to provide visual cues and insights. Share and navigate important information on four stages that need your due attention. This template can be used to pitch topics like mixpanels marketing key performance indicators. In addtion, this PPT design contains high resolution images, graphics, etc, that are easily editable and available for immediate download.
Five Key Performance Indicators Of Sales Team With Icons Ppt PowerPoint Presentation Gallery Introduction PDF
Persuade your audience using this five key performance indicators of sales team with icons ppt powerpoint presentation gallery introduction pdf. This PPT design covers five stages, thus making it a great tool to use. It also caters to a variety of topics including sales, win, revenue. Download this PPT design now to present a convincing pitch that not only emphasizes the topic but also showcases your presentation skills.

BI Implementation To Enhance Hiring Process Key Performance Indicators For Human Resource Management Summary PDF
This slide represents the key performance indicators that are to be tracked to monitor the effect of implementation of business intelligence in HR operations. It includes KPIs such as personnel costs, employee retention rate, employee satisfaction rate etc.The BI Implementation To Enhance Hiring Process Key Performance Indicators For Human Resource Management Summary PDF is a compilation of the most recent design trends as a series of slides. It is suitable for any subject or industry presentation, containing attractive visuals and photo spots for businesses to clearly express their messages. This template contains a variety of slides for the user to input data, such as structures to contrast two elements, bullet points, and slides for written information. Slidegeeks is prepared to create an impression.

Implementing Management System To Enhance Ecommerce Processes Key Metrics To Measure Current Performance Themes PDF
This slide represents the key performance indicators to track and monitor the performance of ecommerce website to draw effective strategies to tackle the problems. It includes key metrics for ecommerce website performance measurement such as average order value and shopping cart abandonment rate. Do you know about Slidesgeeks Implementing Management System To Enhance Ecommerce Processes Key Metrics To Measure Current Performance Themes PDF. These are perfect for delivering any kind od presentation. Using it, create PowerPoint presentations that communicate your ideas and engage audiences. Save time and effort by using our pre designed presentation templates that are perfect for a wide range of topic. Our vast selection of designs covers a range of styles, from creative to business, and are all highly customizable and easy to edit. Download as a PowerPoint template or use them as Google Slides themes.
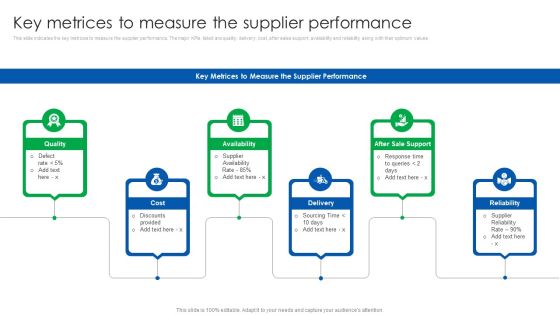
Vendor Relationship Management Strategic Plan Key Metrices To Measure The Supplier Performance Formats PDF
This slide indicates the key metrices to measure the supplier performance. The major KPIs listed are quality, delivery, cost, after sales support, availability and reliability along with their optimum values. Slidegeeks is here to make your presentations a breeze with Vendor Relationship Management Strategic Plan Key Metrices To Measure The Supplier Performance Formats PDF With our easy to use and customizable templates, you can focus on delivering your ideas rather than worrying about formatting. With a variety of designs to choose from, you are sure to find one that suits your needs. And with animations and unique photos, illustrations, and fonts, you can make your presentation pop. So whether you are giving a sales pitch or presenting to the board, make sure to check out Slidegeeks first.
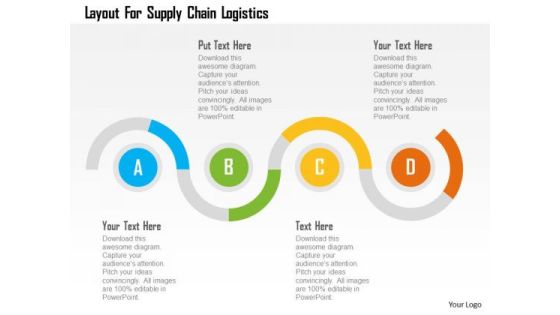
Business Diagram Layout For Supply Chain Logistics Presentation Template
This slide illustrates diagram of zigzag graphics. You may use it to represent concept of supply chain logistics. This diagram is suitable to display business information and also helps to keep your audience interested till the end of your presentation.

5 R2R Key Performance Indicators Ppt PowerPoint Presentation Model Topics PDF
Following slide outlines critical R2R KPIs. Time to close, number of entry corrections, voice of transactions per FTE, growth of CA and process costs are some of the KPIs, which will assist accounts department to measure its overall performance.Showcasing this set of slides titled 5 R2R Key Performance Indicators Ppt PowerPoint Presentation Model Topics PDF. The topics addressed in these templates are Volume Transactions, Process Cost, Entry Corrections. All the content presented in this PPT design is completely editable. Download it and make adjustments in color, background, font etc. as per your unique business setting.

Marketing Strategy For Shipping Business Key Performance Indicator Dashboard Graphics PDF
The following slide depicts the key areas in Marketing Strategy for Shipping Business to monitor and optimize supply chain processes. It includes elements such as fleet and shipment status, country wise revenue, location wise delivery, average shipment time etc.Pitch your topic with ease and precision using this Marketing Strategy For Shipping Business Key Performance Indicator Dashboard Graphics PDF. This layout presents information on Shipment Status, Average Shipment, Wise Revenue. It is also available for immediate download and adjustment. So, changes can be made in the color, design, graphics or any other component to create a unique layout.
Funnel Diagram With Icons For Sales Process Powerpoint Templates
Funnel diagram with icons have been displayed in this business slide. This business diagram slide helps to exhibit sales process. Use this diagram to build an exclusive presentation.

Yearly Company Financial Performance Indicators Of Organization Ppt Infographics Outline PDF
This slide showcases to past years values of organization for future prediction. Key metrics covered are revenue, net profit, cash flow, sales and EBITDA. Persuade your audience using this Yearly Company Financial Performance Indicators Of Organization Ppt Infographics Outline PDF. This PPT design covers five stages, thus making it a great tool to use. It also caters to a variety of topics including Revenue, Net Profit, Cash Flow. Download this PPT design now to present a convincing pitch that not only emphasizes the topic but also showcases your presentation skills.
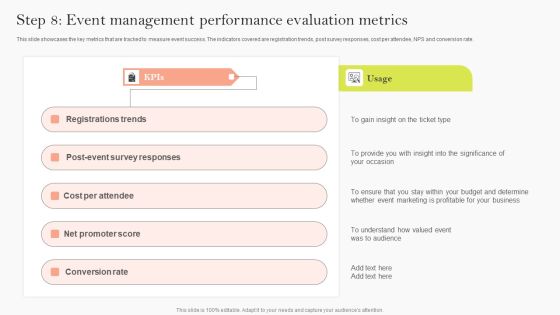
Step 8 Event Management Performance Evaluation Metrics Ppt Gallery Designs Download PDF
This slide showcases the key metrics that are tracked to measure event success. The indicators covered are registration trends, post survey responses, cost per attendee, NPS and conversion rate. There are so many reasons you need a Step 8 Event Management Performance Evaluation Metrics Ppt Gallery Designs Download PDF. The first reason is you can not spend time making everything from scratch, Thus, Slidegeeks has made presentation templates for you too. You can easily download these templates from our website easily.

Metrics To Manage Company Cash Flow Ppt Model Gridlines PDF
This slide showcases key metrics used by organizations to manage cashflow. The key performance indicators included are days, receivable, inventory and payable outstanding. Pitch your topic with ease and precision using this Metrics To Manage Company Cash Flow Ppt Model Gridlines PDF. This layout presents information on Days Receivable Outstanding, Days Inventory Outstanding, Days Payable Outstanding. It is also available for immediate download and adjustment. So, changes can be made in the color, design, graphics or any other component to create a unique layout.

Leading And Lagging Indicators For Sustainable Business Rules PDF
This slide showcase the leading and lagging key performance indicators of a sustainable and standard business. It showcases the indicators of various operations such as supply chain management, process excellence and product development. Showcasing this set of slides titled Leading And Lagging Indicators For Sustainable Business Rules PDF. The topics addressed in these templates are Leading Indicators, Lagging Indicators, Automobile Industries. All the content presented in this PPT design is completely editable. Download it and make adjustments in color, background, font etc. as per your unique business setting.

Implementing Sales Volatility Management Techniques Key Metrics To Assess Effectiveness Of Sales Designs PDF
The following slide highlights some key performance indicators to measure the effectiveness of sales risk evaluation on revenue performance. It includes elements such as opportunities, win rate, average time to win, sales velocity along with key insights etc. Do you have an important presentation coming up Are you looking for something that will make your presentation stand out from the rest Look no further than Implementing Sales Volatility Management Techniques Key Metrics To Assess Effectiveness Of Sales Designs PDF. With our professional designs, you can trust that your presentation will pop and make delivering it a smooth process. And with Slidegeeks, you can trust that your presentation will be unique and memorable. So why wait Grab Implementing Sales Volatility Management Techniques Key Metrics To Assess Effectiveness Of Sales Designs PDF today and make your presentation stand out from the rest.

Metrics To Evaluate Real Time Marketing Campaign Performance Ppt Inspiration Portfolio PDF
The following slide showcases some key performance indicators KPIs to assess real time marketing campaign results for performance review. It includes elements such as engagement, awareness, led generation, reach, impressions, click through rate, open rate etc. Get a simple yet stunning designed Metrics To Evaluate Real Time Marketing Campaign Performance Ppt Inspiration Portfolio PDF. It is the best one to establish the tone in your meetings. It is an excellent way to make your presentations highly effective. So, download this PPT today from Slidegeeks and see the positive impacts. Our easy-to-edit Metrics To Evaluate Real Time Marketing Campaign Performance Ppt Inspiration Portfolio PDF can be your go-to option for all upcoming conferences and meetings. So, what are you waiting for Grab this template today.

Hr Metrics In M And A Plan Lifecycle Template PDF
The slide showcases the use of human resource metrics to capture and manage changes after MandA deals. It includes the phases of MandA with goals, availability of data and scope.Pitch your topic with ease and precision using this Hr Metrics In M And A Plan Lifecycle Template PDF. This layout presents information on Integration Planning, Management Metrics, Good Availability. It is also available for immediate download and adjustment. So, changes can be made in the color, design, graphics or any other component to create a unique layout.

Step 8 Event Management Performance Evaluation Metrics Ppt Layouts Inspiration PDF
This slide showcases the key metrics that are tracked to measure event success. The indicators covered are registration trends, post survey responses, cost per attendee, NPS and conversion rate. Do you have an important presentation coming up Are you looking for something that will make your presentation stand out from the rest Look no further than Step 8 Event Management Performance Evaluation Metrics Ppt Layouts Inspiration PDF. With our professional designs, you can trust that your presentation will pop and make delivering it a smooth process. And with Slidegeeks, you can trust that your presentation will be unique and memorable. So why wait Grab Step 8 Event Management Performance Evaluation Metrics Ppt Layouts Inspiration PDF today and make your presentation stand out from the rest.
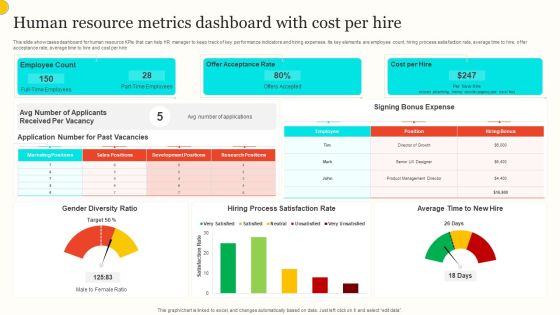
Human Resource Metrics Dashboard With Cost Per Hire Portrait PDF
This slide showcases dashboard for human resource KPIs that can help HR manager to keep track of key performance indicators and hiring expenses. Its key elements are employee count, hiring process satisfaction rate, average time to hire, offer acceptance rate, average time to hire and cost per hire. Showcasing this set of slides titled Human Resource Metrics Dashboard With Cost Per Hire Portrait PDF. The topics addressed in these templates are Employee Count, Offer Acceptance Rate, Cost Per Hire. All the content presented in this PPT design is completely editable. Download it and make adjustments in color, background, font etc. as per your unique business setting.

Company Performance Of Construction Company With Key Insights Portrait PDF
This slide showcases the construction companys performance on various areas. It include cost, time, quality and safety management, cash flow indicator etc. Pitch your topic with ease and precision using this company performance of construction company with key insights portrait pdf. This layout presents information on performance, management. It is also available for immediate download and adjustment. So, changes can be made in the color, design, graphics or any other component to create a unique layout.

Kaizen Process Report With Improvement Metrics Ppt PowerPoint Presentation File Icons PDF
This slide focuses on the kaizen event report which covers process owner, key performance indicators, summary, problem description, improvement metrics, goals, daily milestones, team members and other considerations, etc. Pitch your topic with ease and precision using this Kaizen Process Report With Improvement Metrics Ppt PowerPoint Presentation File Icons PDF. This layout presents information on Key Performance Indoctrinator, Improvement Goal, Improvement Metric. It is also available for immediate download and adjustment. So, changes can be made in the color, design, graphics or any other component to create a unique layout.
Ppt Red Circular Arrow Process Flow Network Diagram PowerPoint Template Templates
PPT red circular arrow process flow network diagram powerpoint template Templates-Use this Circular Arrow diagram to show activities that are related to the business plan metrics and monitor the results to determine if the business plan is proceeding as planned.-PPT red circular arrow process flow network diagram powerpoint template Templates-3d, arrow, background, blue, chart, clipart, colorful, connection, continuity, cycle, cyclic, diagram, direction, flow, graph, icon, illustration, isolated, loop, motion, process, progress, step, sticker, symbol, teamwork, template, turn, vector

Agile Software Development Lifecycle IT Agile Metrics To Measure Project Development Brochure PDF
Mentioned slide provides information on the agile metrics namely value delivered graph that can be used by the organization to measure its project development progress.Deliver an awe inspiring pitch with this creative agile software development lifecycle it agile metrics to measure project development brochure pdf bundle. Topics like agile metrics to measure project development progress can be discussed with this completely editable template. It is available for immediate download depending on the needs and requirements of the user.

Agile Software Development Lifecycle IT Agile Metrics To Measure Project Development Progress Contd Topics PDF
This slide provides information on the agile metrics namely work item age graph that can be used by the organization to measure its project development progress.Deliver an awe inspiring pitch with this creative agile software development lifecycle it agile metrics to measure project development progress contd topics pdf bundle. Topics like unfinished tasks, passes between, indicating the time that can be discussed with this completely editable template. It is available for immediate download depending on the needs and requirements of the user.

Agile Software Development Lifecycle IT Agile Metrics To Measure Project Development Progress Microsoft PDF
Following slide provides information on the agile metrics namely epic and release burndown graph that can be used by the organization to measure its project development progress.Deliver and pitch your topic in the best possible manner with this agile software development lifecycle it agile metrics to measure project development progress microsoft pdf Use them to share invaluable insights on agile metrics to measure project development progress and impress your audience. This template can be altered and modified as per your expectations. So, grab it now.
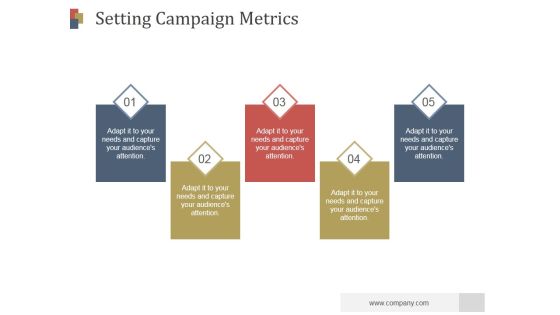
Setting Campaign Metrics Ppt PowerPoint Presentation Designs
This is a setting campaign metrics ppt powerpoint presentation designs. This is a five stage process. The stages in this process are business, strategy, marketing, management, planning.

Outcomes Summary Depicting Financial Metrics Designs PDF
This slide shows the summary of financial results which includes users and financial metrics such as monthly active users, premium subscribers, total revenues, gross profit and margin, operating income and cash flows from operating activities.Showcasing this set of slides titled Outcomes Summary Depicting Financial Metrics Designs PDF The topics addressed in these templates are Operating Margin, Gross Profit, Operating Activities All the content presented in this PPT design is completely editable. Download it and make adjustments in color, background, font etc. as per your unique business setting.
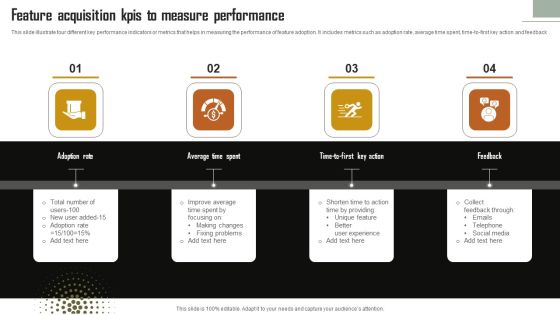
Feature Acquisition Kpis To Measure Performance Themes PDF
This slide illustrate four different key performance indicators or metrics that helps in measuring the performance of feature adoption. It includes metrics such as adoption rate, average time spent, time-to-first key action and feedback. Persuade your audience using this Feature Acquisition Kpis To Measure Performance Themes PDF. This PPT design covers four stages, thus making it a great tool to use. It also caters to a variety of topics including Adoption Rate, Average Time Spent, Feedback. Download this PPT design now to present a convincing pitch that not only emphasizes the topic but also showcases your presentation skills.

Sales Opportunity Metrics Template Presentation Design
This is a sales opportunity metrics template presentation design. This is a three stage process. The stages in this process are sales status, sales opportunities, sales product performance.

Monitor Effectiveness Metrics Powerpoint Guide
This is a monitor effectiveness metrics powerpoint guide. This is a six stage process. The stages in this process are design policies and enforcement mechanisms, deploy governance infrastructure, identify owners and funding model, monitor effectiveness metrics, deploy governance mechanisms, design governance infrastructure.

Website Design Procedure Success Metrics Formats PDF
This slide showcases website design process metrics the amount of interaction your website visitors have with your website and online brand. It includes page reviews , average time , average session duration , bounce rate , traffic sources etc. Showcasing this set of slides titled Website Design Procedure Success Metrics Formats PDF. The topics addressed in these templates are Page Views, Average Time, Bounce Rate . All the content presented in this PPT design is completely editable. Download it and make adjustments in color, background, font etc. as per your unique business setting.

Recruitment Metrics For Data Driven Selection Process Ppt PowerPoint Presentation Inspiration Graphics Download PDF
This slide highlights the key performance indicators to analyze hiring process in organization which includes time to fill, first year attrition rate, cost per hire, candidate job satisfaction and interview to hire ratio. Persuade your audience using this Recruitment Metrics For Data-Driven Selection Process Ppt PowerPoint Presentation Inspiration Graphics Download PDF. This PPT design covers one stage, thus making it a great tool to use. It also caters to a variety of topics including Candidate Job, Satisfaction, Attrition Rate. Download this PPT design now to present a convincing pitch that not only emphasizes the topic but also showcases your presentation skills.
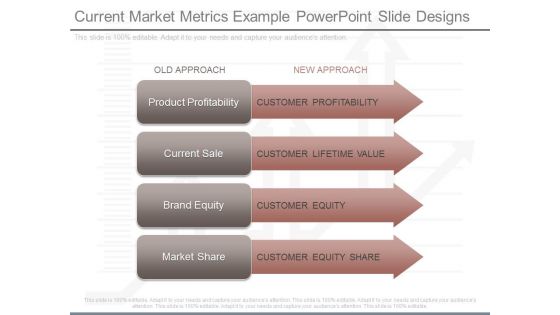
Current Market Metrics Example Powerpoint Slide Designs
This is a current market metrics example powerpoint slide designs. This is a four stage process. The stages in this process are old approach, new approach, product profitability, customer profitability, current sale, customer lifetime value, brand equity, customer equity, market share, customer equity share.
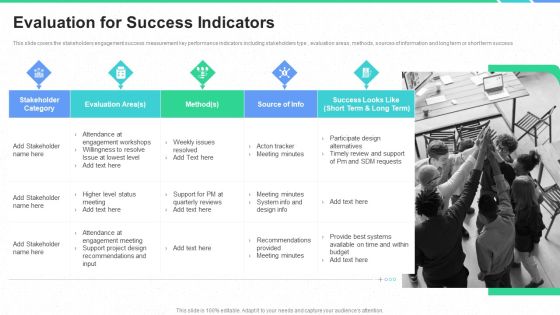
Stakeholders Participation Project Development Process Evaluation For Success Indicators Diagrams PDF
This slide covers the stakeholders engagement success measurement key performance indicators including stakeholders type , evaluation areas, methods, sources of information and long term or short term success. This is a stakeholders participation project development process evaluation for success indicators diagrams pdf template with various stages. Focus and dispense information on one stage using this creative set, that comes with editable features. It contains large content boxes to add your information on topics like stakeholder category, provide best systems available on time and within budget, support project design recommendations and input, meeting minutes. You can also showcase facts, figures, and other relevant content using this PPT layout. Grab it now.
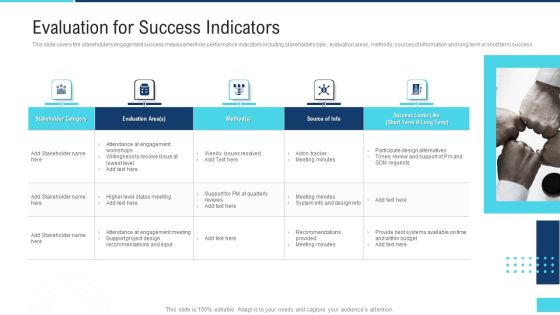
Profitable Initiation Project Engagement Process Evaluation For Success Indicators Ppt Outline Background Image PDF
This slide covers the stakeholders engagement success measurement key performance indicators including stakeholders type , evaluation areas, methods, sources of information and long term or short term success Deliver and pitch your topic in the best possible manner with this profitable initiation project engagement process evaluation for success indicators ppt outline background image pdf. Use them to share invaluable insights on stakeholder, evaluation, project design and impress your audience. This template can be altered and modified as per your expectations. So, grab it now.
Robotic Process Automation Metrics Icon Download PDF
Pitch your topic with ease and precision using this Robotic Process Automation Metrics Icon Download PDF. This layout presents information on Automation Metrics Icon, Robotic Process. It is also available for immediate download and adjustment. So, changes can be made in the color, design, graphics or any other component to create a unique layout.
Key Business Metrics Dashboard Ppt Powerpoint Presentation Icon Graphics Design
This is a key business metrics dashboard ppt powerpoint presentation icon graphics design. This is a five stage process. The stages in this process are finance, marketing, management, investment, analysis.
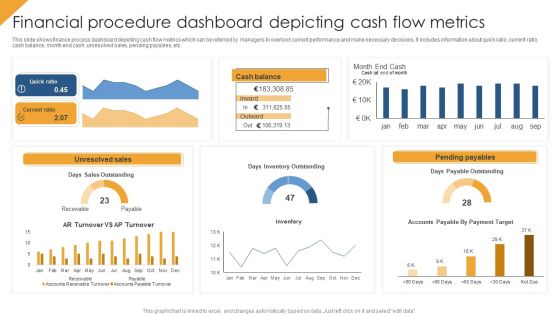
Financial Procedure Dashboard Depicting Cash Flow Metrics Structure PDF
This slide shows finance process dashboard depicting cash flow metrics which can be referred by managers to overlook current performance and make necessary decisions. It includes information about quick ratio, current ratio, cash balance, month end cash, unresolved sales, pending payables, etc. Pitch your topic with ease and precision using this Financial Procedure Dashboard Depicting Cash Flow Metrics Structure PDF. This layout presents information on Quick Ratio, Unresolved Sales, Pending Payables. It is also available for immediate download and adjustment. So, changes can be made in the color, design, graphics or any other component to create a unique layout.

 Home
Home