Devops Kpi

Strategic Performance Marketing Campaign Metrics To Measure Results Of Performance Themes Pdf
This slide showcases metrics that can help organization to track the effectiveness of performance advertisement campaign. Its key components are cost per click, cost per sales, cost per impression and cost per lead. Retrieve professionally designed Strategic Performance Marketing Campaign Metrics To Measure Results Of Performance Themes Pdf to effectively convey your message and captivate your listeners. Save time by selecting pre-made slideshows that are appropriate for various topics, from business to educational purposes. These themes come in many different styles, from creative to corporate, and all of them are easily adjustable and can be edited quickly. Access them as PowerPoint templates or as Google Slides themes. You do not have to go on a hunt for the perfect presentation because Slidegeeks got you covered from everywhere.

Measuring Training And Development Program Key Performance Indicators Template PDF
The purpose of this slide is to showcase certain KPIs to measure the effectiveness of a training and development program. The specific measuring criteria include training skill assessment, recognizing change, employee engagement and training feedback. Persuade your audience using this Measuring Training And Development Program Key Performance Indicators Template PDF. This PPT design covers five stages, thus making it a great tool to use. It also caters to a variety of topics including Training Skill Assessment, Recognizing Change, Employee Engagement. Download this PPT design now to present a convincing pitch that not only emphasizes the topic but also showcases your presentation skills.

Key Performance Indicators For Fulfilment Strategy Slides PDF
The following slide displays major obstacles faced by organizations in shipping and fulfilling orders received. It includes information about supply chain issues, seasonal and international fulfilment and inventory management. Persuade your audience using this Key Performance Indicators For Fulfilment Strategy Slides PDF. This PPT design covers six stages, thus making it a great tool to use. It also caters to a variety of topics including Transportation Costs, Picking Accuracy, Order Accuracy. Download this PPT design now to present a convincing pitch that not only emphasizes the topic but also showcases your presentation skills.
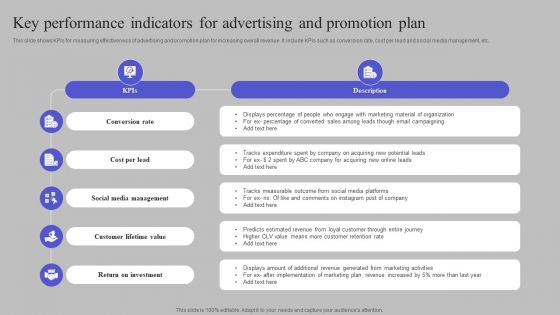
Key Performance Indicators For Advertising And Promotion Plan Background PDF
This slide shows KPIs for measuring effectiveness of advertising and promotion plan for increasing overall revenue. It include KPIs such as conversion rate, cost per lead and social media management, etc. Persuade your audience using this Key Performance Indicators For Advertising And Promotion Plan Background PDF. This PPT design covers five stages, thus making it a great tool to use. It also caters to a variety of topics including Conversion Rate, Cost Per Lead, Social Media Management. Download this PPT design now to present a convincing pitch that not only emphasizes the topic but also showcases your presentation skills.

Key Performance Indicators To Track Effectiveness Of Healthcare Video Marketing Professional PDF
The following slide outlines multiple metrics that can assist marketers in evaluating success of healthcare video marketing campaign. The key metrics are total views, engagement rate, click-through rate CTR, conversion rate, watch time, and social shares. Do you have an important presentation coming up Are you looking for something that will make your presentation stand out from the rest Look no further than Key Performance Indicators To Track Effectiveness Of Healthcare Video Marketing Professional PDF. With our professional designs, you can trust that your presentation will pop and make delivering it a smooth process. And with Slidegeeks, you can trust that your presentation will be unique and memorable. So why wait Grab Key Performance Indicators To Track Effectiveness Of Healthcare Video Marketing Professional PDF today and make your presentation stand out from the rest
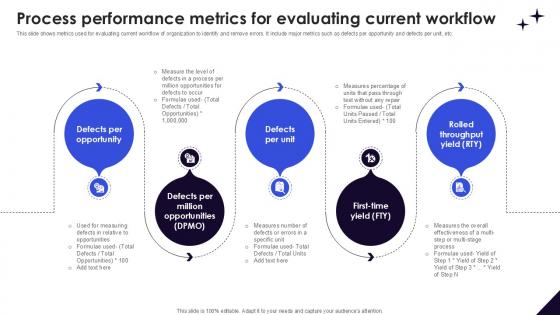
Process Performance Metrics For DMAIC Methodology To Maintain PPT PowerPoint
This slide shows metrics used for evaluating current workflow of organization to identify and remove errors. It include major metrics such as defects per opportunity and defects per unit, etc. Explore a selection of the finest Process Performance Metrics For DMAIC Methodology To Maintain PPT PowerPoint here. With a plethora of professionally designed and pre-made slide templates, you can quickly and easily find the right one for your upcoming presentation. You can use our Process Performance Metrics For DMAIC Methodology To Maintain PPT PowerPoint to effectively convey your message to a wider audience. Slidegeeks has done a lot of research before preparing these presentation templates. The content can be personalized and the slides are highly editable. Grab templates today from Slidegeeks.

Success Metrics To Measure Seo Marketing Strategies Performance Effective GTM Techniques Brochure PDF
The following slide showcases different key performance indicators KPIs that can assist marketing teams to evaluate search engine optimization SEO marketing campaign performance. The metrics outlined in slide are organic sessions, backlinks, average session duration, cost per click CPC, conversion rate, etc. Do you have an important presentation coming up Are you looking for something that will make your presentation stand out from the rest Look no further than Success Metrics To Measure Seo Marketing Strategies Performance Effective GTM Techniques Brochure PDF. With our professional designs, you can trust that your presentation will pop and make delivering it a smooth process. And with Slidegeeks, you can trust that your presentation will be unique and memorable. So why wait Grab Success Metrics To Measure Seo Marketing Strategies Performance Effective GTM Techniques Brochure PDF today and make your presentation stand out from the rest
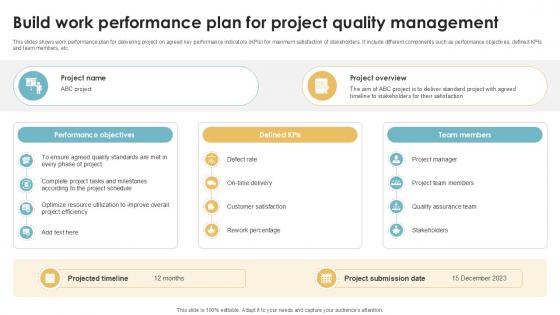
Build Work Performance Plan For Project Executing Quality Ppt Template PM SS V
This slides shows work performance plan for delivering project on agreed key performance indicators KPIs for maximum satisfaction of stakeholders. It include different components such as performance objectives, defined KPIs and team members, etc. Find a pre-designed and impeccable Build Work Performance Plan For Project Executing Quality Ppt Template PM SS V. The templates can ace your presentation without additional effort. You can download these easy-to-edit presentation templates to make your presentation stand out from others. So, what are you waiting for Download the template from Slidegeeks today and give a unique touch to your presentation.
List Business Key Performance Indicators Ppt PowerPoint Presentation Icon Designs Download
Presenting this set of slides with name list business key performance indicators ppt powerpoint presentation icon designs download. This is an editable Powerpoint four stages graphic that deals with topics like list business key performance indicators to help convey your message better graphically. This product is a premium product available for immediate download and is 100 percent editable in Powerpoint. Download this now and use it in your presentations to impress your audience.

RPA IT What Are The Key Performance Indicators Kpis Of RPA Ppt Professional Design Templates PDF
This slide represents the key performance indicators of RPA such as intelligence, dependability, performance, quality services and staff morale. This is a rpa it what are the key performance indicators kpis of rpa ppt professional design templates pdf template with various stages. Focus and dispense information on five stages using this creative set, that comes with editable features. It contains large content boxes to add your information on topics like staff morale, quality services, performance, dependability, intelligence. You can also showcase facts, figures, and other relevant content using this PPT layout. Grab it now.
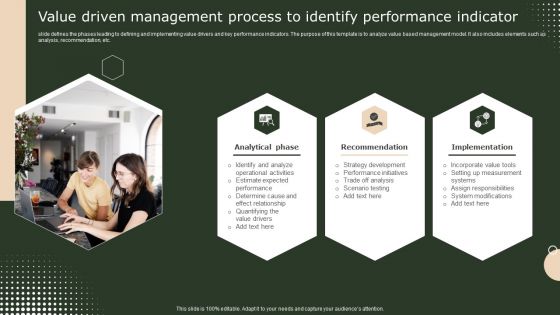
Value Driven Management Process To Identify Performance Indicator Themes PDF
slide defines the phases leading to defining and implementing value drivers and key performance indicators. The purpose of this template is to analyze value based management model. It also includes elements such as analysis, recommendation, etc. Persuade your audience using this Value Driven Management Process To Identify Performance Indicator Themes PDF. This PPT design covers three stages, thus making it a great tool to use. It also caters to a variety of topics including Recommendation, Analytical Phase, Implementation. Download this PPT design now to present a convincing pitch that not only emphasizes the topic but also showcases your presentation skills.
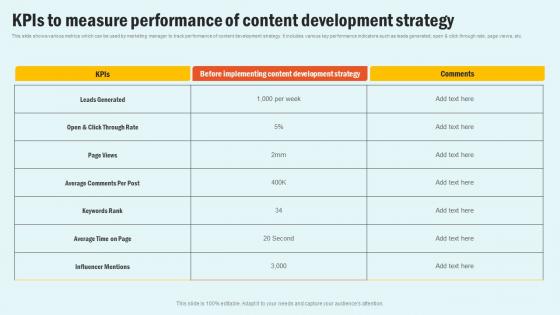
KPIs To Measure Performance Of Enhancing Website Performance With Search Engine Content Elements Pdf
This slide shows various metrics which can be used by marketing manager to track performance of content development strategy. It includes various key performance indicators such as leads generated, open and click through rate, page views, etc. Explore a selection of the finest KPIs To Measure Performance Of Enhancing Website Performance With Search Engine Content Elements Pdf here. With a plethora of professionally designed and pre made slide templates, you can quickly and easily find the right one for your upcoming presentation. You can use our KPIs To Measure Performance Of Enhancing Website Performance With Search Engine Content Elements Pdf to effectively convey your message to a wider audience. Slidegeeks has done a lot of research before preparing these presentation templates. The content can be personalized and the slides are highly editable. Grab templates today from Slidegeeks.
Key Performance Indicators Of A Shipping Firm Ppt PowerPoint Presentation Background Designs
This is a key performance indicators of a shipping firm ppt powerpoint presentation background designs. This is a eight stage process. The stages in this process are business, strategy, marketing, process, table, management.

Performance Analysis Of Existing Client Side Encryption PPT Example
The purpose of this slide is to indicate the performance analysis of the organizations current security infrastructure. The key components include where we are, the gap, where we want to be, and recommended solutions. Welcome to our selection of the Performance Analysis Of Existing Client Side Encryption PPT Example. These are designed to help you showcase your creativity and bring your sphere to life. Planning and Innovation are essential for any business that is just starting out. This collection contains the designs that you need for your everyday presentations. All of our PowerPoints are 100Percent editable, so you can customize them to suit your needs. This multi-purpose template can be used in various situations. Grab these presentation templates today.
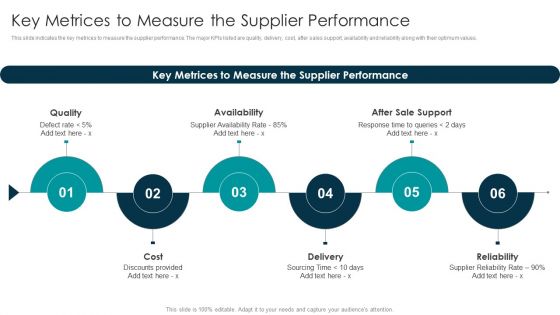
Tactical Approach For Vendor Reskilling Key Metrices To Measure The Supplier Performance Designs PDF
This slide indicates the key metrices to measure the supplier performance. The major KPIs listed are quality, delivery, cost, after sales support, availability and reliability along with their optimum values. Slidegeeks is here to make your presentations a breeze with Tactical Approach For Vendor Reskilling Key Metrices To Measure The Supplier Performance Designs PDF With our easy to use and customizable templates, you can focus on delivering your ideas rather than worrying about formatting. With a variety of designs to choose from, you are sure to find one that suits your needs. And with animations and unique photos, illustrations, and fonts, you can make your presentation pop. So whether you are giving a sales pitch or presenting to the board, make sure to check out Slidegeeks first.

BI Implementation To Enhance Hiring Process Key Performance Indicators For Human Resource Management Summary PDF
This slide represents the key performance indicators that are to be tracked to monitor the effect of implementation of business intelligence in HR operations. It includes KPIs such as personnel costs, employee retention rate, employee satisfaction rate etc.The BI Implementation To Enhance Hiring Process Key Performance Indicators For Human Resource Management Summary PDF is a compilation of the most recent design trends as a series of slides. It is suitable for any subject or industry presentation, containing attractive visuals and photo spots for businesses to clearly express their messages. This template contains a variety of slides for the user to input data, such as structures to contrast two elements, bullet points, and slides for written information. Slidegeeks is prepared to create an impression.
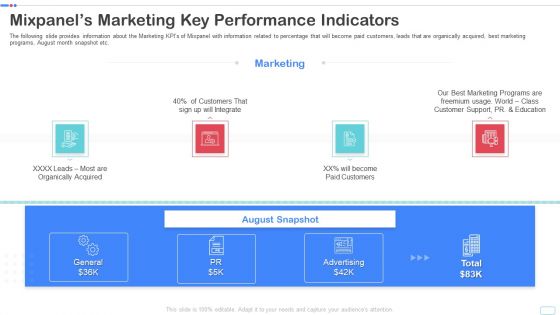
Mixpanel Capital Raising Pitch Deck Mixpanels Marketing Key Performance Indicators Portrait PDF
The following slide provides information about the Marketing KPIs of Mixpanel with information related to percentage that will become paid customers, leads that are organically acquired, best marketing programs, August month snapshot etc. Presenting mixpanel capital raising pitch deck mixpanels marketing key performance indicators portrait pdf to provide visual cues and insights. Share and navigate important information on four stages that need your due attention. This template can be used to pitch topics like mixpanels marketing key performance indicators. In addtion, this PPT design contains high resolution images, graphics, etc, that are easily editable and available for immediate download.
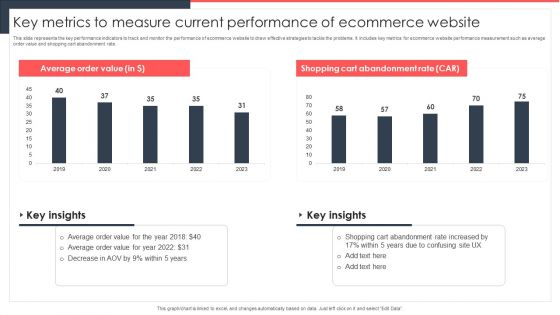
Implementing Management System To Enhance Ecommerce Processes Key Metrics To Measure Current Performance Themes PDF
This slide represents the key performance indicators to track and monitor the performance of ecommerce website to draw effective strategies to tackle the problems. It includes key metrics for ecommerce website performance measurement such as average order value and shopping cart abandonment rate. Do you know about Slidesgeeks Implementing Management System To Enhance Ecommerce Processes Key Metrics To Measure Current Performance Themes PDF. These are perfect for delivering any kind od presentation. Using it, create PowerPoint presentations that communicate your ideas and engage audiences. Save time and effort by using our pre designed presentation templates that are perfect for a wide range of topic. Our vast selection of designs covers a range of styles, from creative to business, and are all highly customizable and easy to edit. Download as a PowerPoint template or use them as Google Slides themes.
Five Key Performance Indicators Of Sales Team With Icons Ppt PowerPoint Presentation Gallery Introduction PDF
Persuade your audience using this five key performance indicators of sales team with icons ppt powerpoint presentation gallery introduction pdf. This PPT design covers five stages, thus making it a great tool to use. It also caters to a variety of topics including sales, win, revenue. Download this PPT design now to present a convincing pitch that not only emphasizes the topic but also showcases your presentation skills.

Production And Dashboard To Track Performance Of Manufacturing Operations Techniques Post Automation Tips Pdf
This slide depicts a strategic dashboard used by organizations to track performance of manufacturing operations after automating production processes. The key performance indicators are productivity before vs after automation, productivity increase rate post automation etc. Pitch your topic with ease and precision using this Production And Dashboard To Track Performance Of Manufacturing Operations Techniques Post Automation Tips Pdf This layout presents information on Productivity Before, After Automation, Process Completion It is also available for immediate download and adjustment. So, changes can be made in the color, design, graphics or any other component to create a unique layout.
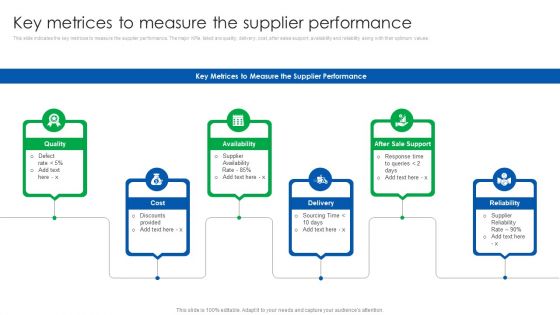
Vendor Relationship Management Strategic Plan Key Metrices To Measure The Supplier Performance Formats PDF
This slide indicates the key metrices to measure the supplier performance. The major KPIs listed are quality, delivery, cost, after sales support, availability and reliability along with their optimum values. Slidegeeks is here to make your presentations a breeze with Vendor Relationship Management Strategic Plan Key Metrices To Measure The Supplier Performance Formats PDF With our easy to use and customizable templates, you can focus on delivering your ideas rather than worrying about formatting. With a variety of designs to choose from, you are sure to find one that suits your needs. And with animations and unique photos, illustrations, and fonts, you can make your presentation pop. So whether you are giving a sales pitch or presenting to the board, make sure to check out Slidegeeks first.
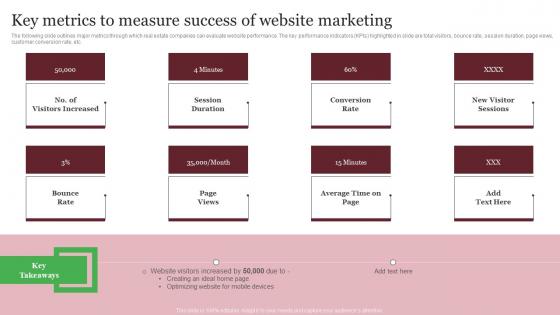
Key Metrics To Measure Success Of Website Marketing Out Of The Box Real Mockup Pdf
The following slide outlines major metrics through which real estate companies can evaluate website performance. The key performance indicators KPIs highlighted in slide are total visitors, bounce rate, session duration, page views, customer conversion rate, etc. This Key Metrics To Measure Success Of Website Marketing Out Of The Box Real Mockup Pdf from Slidegeeks makes it easy to present information on your topic with precision. It provides customization options, so you can make changes to the colors, design, graphics, or any other component to create a unique layout. It is also available for immediate download, so you can begin using it right away. Slidegeeks has done good research to ensure that you have everything you need to make your presentation stand out. Make a name out there for a brilliant performance.

Performance Analysis Of Binance Platform Globally Complete Roadmap To Blockchain BCT SS V
This slide covers key performance metrics and indicators for assessing performance of Binance exchange platform. It includes performance related revenue earned, profit generation along with Binance annual users for year 2017-2021. Do you have an important presentation coming up Are you looking for something that will make your presentation stand out from the rest Look no further than Performance Analysis Of Binance Platform Globally Complete Roadmap To Blockchain BCT SS V. With our professional designs, you can trust that your presentation will pop and make delivering it a smooth process. And with Slidegeeks, you can trust that your presentation will be unique and memorable. So why wait Grab Performance Analysis Of Binance Platform Globally Complete Roadmap To Blockchain BCT SS V today and make your presentation stand out from the rest

5 R2R Key Performance Indicators Ppt PowerPoint Presentation Model Topics PDF
Following slide outlines critical R2R KPIs. Time to close, number of entry corrections, voice of transactions per FTE, growth of CA and process costs are some of the KPIs, which will assist accounts department to measure its overall performance.Showcasing this set of slides titled 5 R2R Key Performance Indicators Ppt PowerPoint Presentation Model Topics PDF. The topics addressed in these templates are Volume Transactions, Process Cost, Entry Corrections. All the content presented in this PPT design is completely editable. Download it and make adjustments in color, background, font etc. as per your unique business setting.
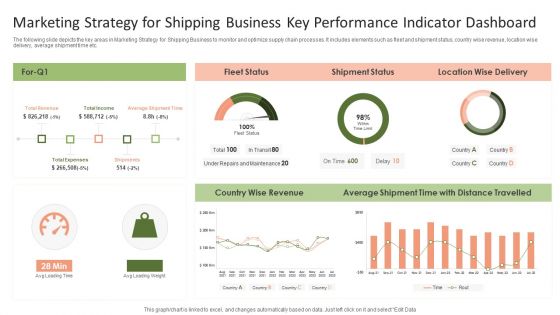
Marketing Strategy For Shipping Business Key Performance Indicator Dashboard Graphics PDF
The following slide depicts the key areas in Marketing Strategy for Shipping Business to monitor and optimize supply chain processes. It includes elements such as fleet and shipment status, country wise revenue, location wise delivery, average shipment time etc.Pitch your topic with ease and precision using this Marketing Strategy For Shipping Business Key Performance Indicator Dashboard Graphics PDF. This layout presents information on Shipment Status, Average Shipment, Wise Revenue. It is also available for immediate download and adjustment. So, changes can be made in the color, design, graphics or any other component to create a unique layout.
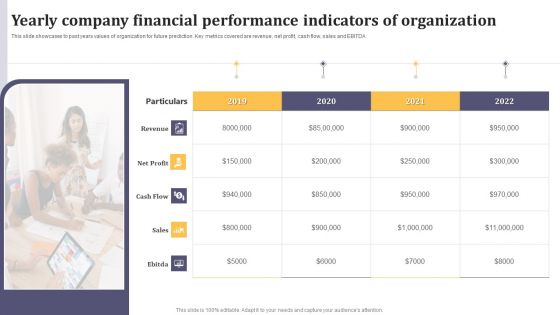
Yearly Company Financial Performance Indicators Of Organization Ppt Infographics Outline PDF
This slide showcases to past years values of organization for future prediction. Key metrics covered are revenue, net profit, cash flow, sales and EBITDA. Persuade your audience using this Yearly Company Financial Performance Indicators Of Organization Ppt Infographics Outline PDF. This PPT design covers five stages, thus making it a great tool to use. It also caters to a variety of topics including Revenue, Net Profit, Cash Flow. Download this PPT design now to present a convincing pitch that not only emphasizes the topic but also showcases your presentation skills.
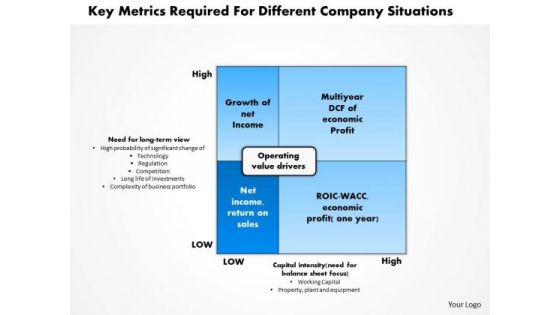
Business Framework Key Metrics Required For Different Company Situations PowerPoint Presentation
This diagram has been designed with framework of key metrics required for different company situations. This diagram contains rectangle of operating value drivers with four sections inside it representing terms like growth of net Income, multiyear DCF of economic profit, net income, return on sales, ROIC-WACC, and economic profit. Use this as a major element in streamlining any business process.
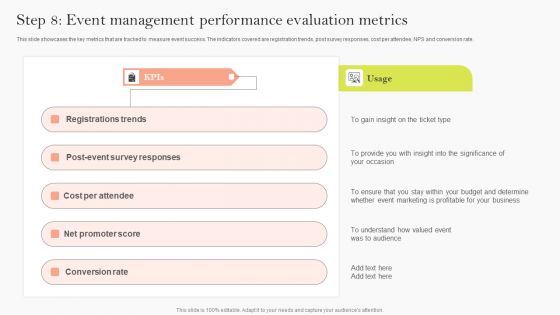
Step 8 Event Management Performance Evaluation Metrics Ppt Gallery Designs Download PDF
This slide showcases the key metrics that are tracked to measure event success. The indicators covered are registration trends, post survey responses, cost per attendee, NPS and conversion rate. There are so many reasons you need a Step 8 Event Management Performance Evaluation Metrics Ppt Gallery Designs Download PDF. The first reason is you can not spend time making everything from scratch, Thus, Slidegeeks has made presentation templates for you too. You can easily download these templates from our website easily.

Metrics To Manage Company Cash Flow Ppt Model Gridlines PDF
This slide showcases key metrics used by organizations to manage cashflow. The key performance indicators included are days, receivable, inventory and payable outstanding. Pitch your topic with ease and precision using this Metrics To Manage Company Cash Flow Ppt Model Gridlines PDF. This layout presents information on Days Receivable Outstanding, Days Inventory Outstanding, Days Payable Outstanding. It is also available for immediate download and adjustment. So, changes can be made in the color, design, graphics or any other component to create a unique layout.

Key Process To Implement Big Data Practice In Manufacturing Industry Diagrams Pdf
The purpose of this slide is to represent procedure to establish big data techniques in manufacturing businesses. It includes various stages such as establishing business key performance indicators, assessing issues in manufacturing, carrying out cost benefit analysis of project and implementing big data in manufacturing process.Showcasing this set of slides titled Key Process To Implement Big Data Practice In Manufacturing Industry Diagrams Pdf The topics addressed in these templates are Expect Incorporating, Understand Performance, Manufacturing Plant All the content presented in this PPT design is completely editable. Download it and make adjustments in color, background, font etc. as per your unique business setting.
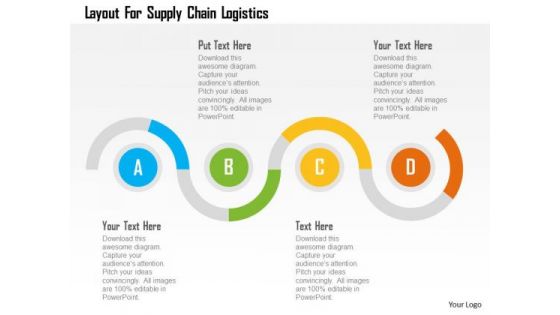
Business Diagram Layout For Supply Chain Logistics Presentation Template
This slide illustrates diagram of zigzag graphics. You may use it to represent concept of supply chain logistics. This diagram is suitable to display business information and also helps to keep your audience interested till the end of your presentation.

Leading And Lagging Indicators For Sustainable Business Rules PDF
This slide showcase the leading and lagging key performance indicators of a sustainable and standard business. It showcases the indicators of various operations such as supply chain management, process excellence and product development. Showcasing this set of slides titled Leading And Lagging Indicators For Sustainable Business Rules PDF. The topics addressed in these templates are Leading Indicators, Lagging Indicators, Automobile Industries. All the content presented in this PPT design is completely editable. Download it and make adjustments in color, background, font etc. as per your unique business setting.
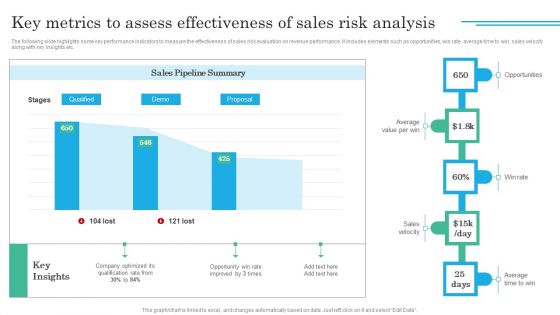
Implementing Sales Volatility Management Techniques Key Metrics To Assess Effectiveness Of Sales Designs PDF
The following slide highlights some key performance indicators to measure the effectiveness of sales risk evaluation on revenue performance. It includes elements such as opportunities, win rate, average time to win, sales velocity along with key insights etc. Do you have an important presentation coming up Are you looking for something that will make your presentation stand out from the rest Look no further than Implementing Sales Volatility Management Techniques Key Metrics To Assess Effectiveness Of Sales Designs PDF. With our professional designs, you can trust that your presentation will pop and make delivering it a smooth process. And with Slidegeeks, you can trust that your presentation will be unique and memorable. So why wait Grab Implementing Sales Volatility Management Techniques Key Metrics To Assess Effectiveness Of Sales Designs PDF today and make your presentation stand out from the rest.
Funnel Diagram With Icons For Sales Process Powerpoint Templates
Funnel diagram with icons have been displayed in this business slide. This business diagram slide helps to exhibit sales process. Use this diagram to build an exclusive presentation.
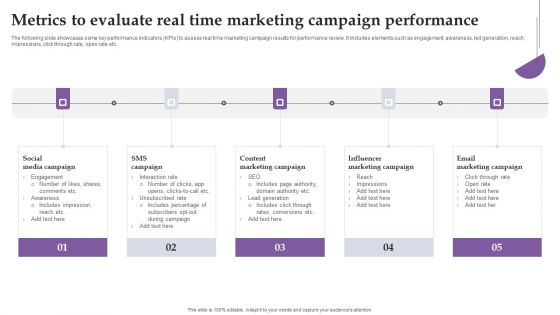
Metrics To Evaluate Real Time Marketing Campaign Performance Ppt Inspiration Portfolio PDF
The following slide showcases some key performance indicators KPIs to assess real time marketing campaign results for performance review. It includes elements such as engagement, awareness, led generation, reach, impressions, click through rate, open rate etc. Get a simple yet stunning designed Metrics To Evaluate Real Time Marketing Campaign Performance Ppt Inspiration Portfolio PDF. It is the best one to establish the tone in your meetings. It is an excellent way to make your presentations highly effective. So, download this PPT today from Slidegeeks and see the positive impacts. Our easy-to-edit Metrics To Evaluate Real Time Marketing Campaign Performance Ppt Inspiration Portfolio PDF can be your go-to option for all upcoming conferences and meetings. So, what are you waiting for Grab this template today.

Step 8 Event Management Performance Evaluation Metrics Ppt Layouts Inspiration PDF
This slide showcases the key metrics that are tracked to measure event success. The indicators covered are registration trends, post survey responses, cost per attendee, NPS and conversion rate. Do you have an important presentation coming up Are you looking for something that will make your presentation stand out from the rest Look no further than Step 8 Event Management Performance Evaluation Metrics Ppt Layouts Inspiration PDF. With our professional designs, you can trust that your presentation will pop and make delivering it a smooth process. And with Slidegeeks, you can trust that your presentation will be unique and memorable. So why wait Grab Step 8 Event Management Performance Evaluation Metrics Ppt Layouts Inspiration PDF today and make your presentation stand out from the rest.

Human Resource Metrics Dashboard With Cost Per Hire Portrait PDF
This slide showcases dashboard for human resource KPIs that can help HR manager to keep track of key performance indicators and hiring expenses. Its key elements are employee count, hiring process satisfaction rate, average time to hire, offer acceptance rate, average time to hire and cost per hire. Showcasing this set of slides titled Human Resource Metrics Dashboard With Cost Per Hire Portrait PDF. The topics addressed in these templates are Employee Count, Offer Acceptance Rate, Cost Per Hire. All the content presented in this PPT design is completely editable. Download it and make adjustments in color, background, font etc. as per your unique business setting.

Hr Metrics In M And A Plan Lifecycle Template PDF
The slide showcases the use of human resource metrics to capture and manage changes after MandA deals. It includes the phases of MandA with goals, availability of data and scope.Pitch your topic with ease and precision using this Hr Metrics In M And A Plan Lifecycle Template PDF. This layout presents information on Integration Planning, Management Metrics, Good Availability. It is also available for immediate download and adjustment. So, changes can be made in the color, design, graphics or any other component to create a unique layout.
Kaizen Process Report With Improvement Metrics Ppt PowerPoint Presentation File Icons PDF
This slide focuses on the kaizen event report which covers process owner, key performance indicators, summary, problem description, improvement metrics, goals, daily milestones, team members and other considerations, etc. Pitch your topic with ease and precision using this Kaizen Process Report With Improvement Metrics Ppt PowerPoint Presentation File Icons PDF. This layout presents information on Key Performance Indoctrinator, Improvement Goal, Improvement Metric. It is also available for immediate download and adjustment. So, changes can be made in the color, design, graphics or any other component to create a unique layout.
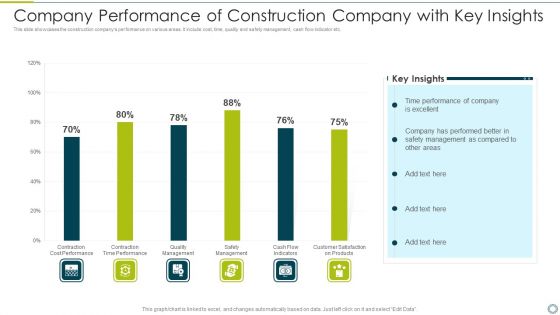
Company Performance Of Construction Company With Key Insights Portrait PDF
This slide showcases the construction companys performance on various areas. It include cost, time, quality and safety management, cash flow indicator etc. Pitch your topic with ease and precision using this company performance of construction company with key insights portrait pdf. This layout presents information on performance, management. It is also available for immediate download and adjustment. So, changes can be made in the color, design, graphics or any other component to create a unique layout.

Setting Campaign Metrics Ppt PowerPoint Presentation Designs
This is a setting campaign metrics ppt powerpoint presentation designs. This is a five stage process. The stages in this process are business, strategy, marketing, management, planning.
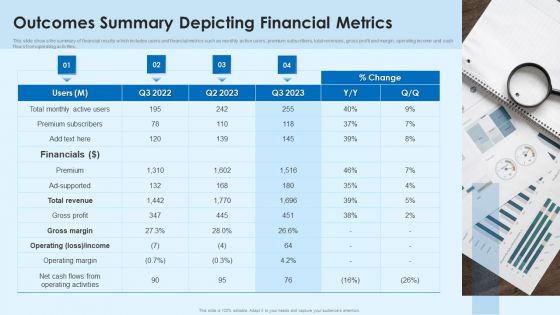
Outcomes Summary Depicting Financial Metrics Designs PDF
This slide shows the summary of financial results which includes users and financial metrics such as monthly active users, premium subscribers, total revenues, gross profit and margin, operating income and cash flows from operating activities.Showcasing this set of slides titled Outcomes Summary Depicting Financial Metrics Designs PDF The topics addressed in these templates are Operating Margin, Gross Profit, Operating Activities All the content presented in this PPT design is completely editable. Download it and make adjustments in color, background, font etc. as per your unique business setting.
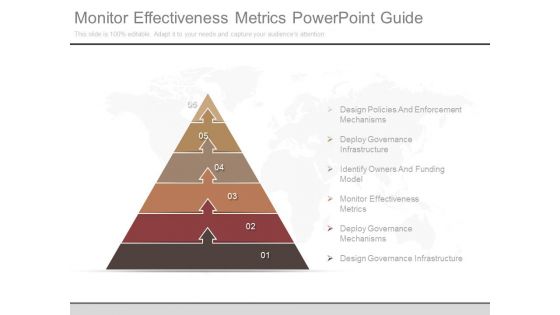
Monitor Effectiveness Metrics Powerpoint Guide
This is a monitor effectiveness metrics powerpoint guide. This is a six stage process. The stages in this process are design policies and enforcement mechanisms, deploy governance infrastructure, identify owners and funding model, monitor effectiveness metrics, deploy governance mechanisms, design governance infrastructure.
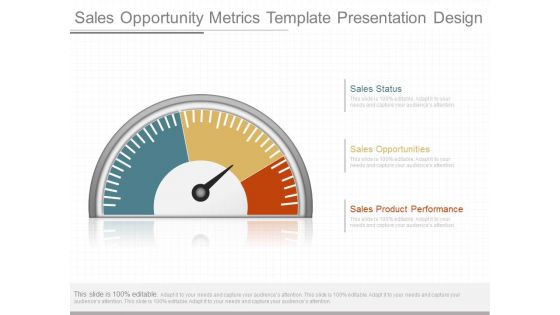
Sales Opportunity Metrics Template Presentation Design
This is a sales opportunity metrics template presentation design. This is a three stage process. The stages in this process are sales status, sales opportunities, sales product performance.

Agile Software Development Lifecycle IT Agile Metrics To Measure Project Development Brochure PDF
Mentioned slide provides information on the agile metrics namely value delivered graph that can be used by the organization to measure its project development progress.Deliver an awe inspiring pitch with this creative agile software development lifecycle it agile metrics to measure project development brochure pdf bundle. Topics like agile metrics to measure project development progress can be discussed with this completely editable template. It is available for immediate download depending on the needs and requirements of the user.
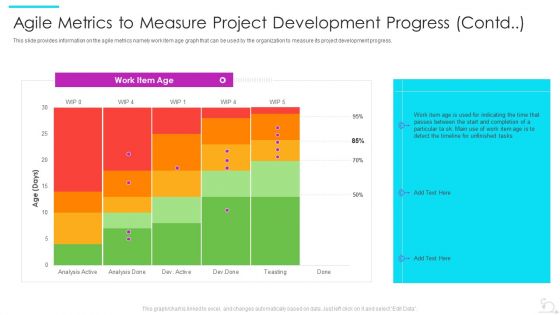
Agile Software Development Lifecycle IT Agile Metrics To Measure Project Development Progress Contd Topics PDF
This slide provides information on the agile metrics namely work item age graph that can be used by the organization to measure its project development progress.Deliver an awe inspiring pitch with this creative agile software development lifecycle it agile metrics to measure project development progress contd topics pdf bundle. Topics like unfinished tasks, passes between, indicating the time that can be discussed with this completely editable template. It is available for immediate download depending on the needs and requirements of the user.
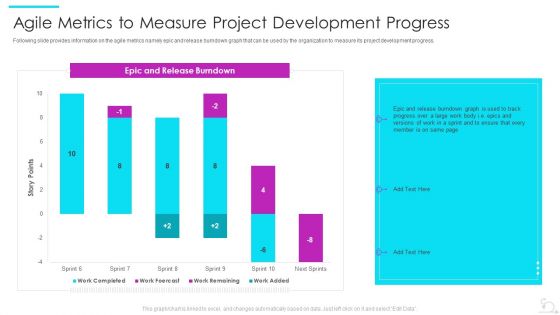
Agile Software Development Lifecycle IT Agile Metrics To Measure Project Development Progress Microsoft PDF
Following slide provides information on the agile metrics namely epic and release burndown graph that can be used by the organization to measure its project development progress.Deliver and pitch your topic in the best possible manner with this agile software development lifecycle it agile metrics to measure project development progress microsoft pdf Use them to share invaluable insights on agile metrics to measure project development progress and impress your audience. This template can be altered and modified as per your expectations. So, grab it now.

Website Design Procedure Success Metrics Formats PDF
This slide showcases website design process metrics the amount of interaction your website visitors have with your website and online brand. It includes page reviews , average time , average session duration , bounce rate , traffic sources etc. Showcasing this set of slides titled Website Design Procedure Success Metrics Formats PDF. The topics addressed in these templates are Page Views, Average Time, Bounce Rate . All the content presented in this PPT design is completely editable. Download it and make adjustments in color, background, font etc. as per your unique business setting.
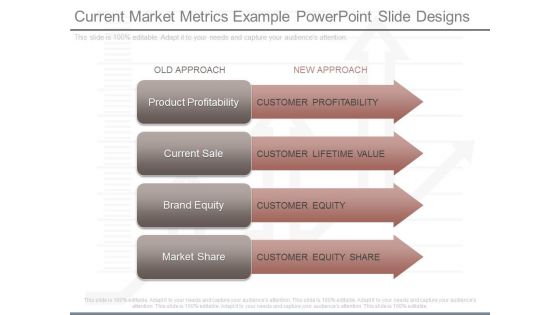
Current Market Metrics Example Powerpoint Slide Designs
This is a current market metrics example powerpoint slide designs. This is a four stage process. The stages in this process are old approach, new approach, product profitability, customer profitability, current sale, customer lifetime value, brand equity, customer equity, market share, customer equity share.
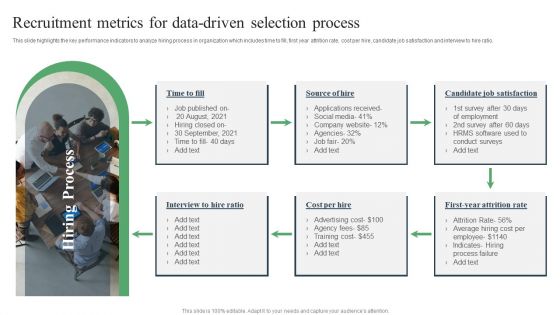
Recruitment Metrics For Data Driven Selection Process Ppt PowerPoint Presentation Inspiration Graphics Download PDF
This slide highlights the key performance indicators to analyze hiring process in organization which includes time to fill, first year attrition rate, cost per hire, candidate job satisfaction and interview to hire ratio. Persuade your audience using this Recruitment Metrics For Data-Driven Selection Process Ppt PowerPoint Presentation Inspiration Graphics Download PDF. This PPT design covers one stage, thus making it a great tool to use. It also caters to a variety of topics including Candidate Job, Satisfaction, Attrition Rate. Download this PPT design now to present a convincing pitch that not only emphasizes the topic but also showcases your presentation skills.

Feature Acquisition Kpis To Measure Performance Themes PDF
This slide illustrate four different key performance indicators or metrics that helps in measuring the performance of feature adoption. It includes metrics such as adoption rate, average time spent, time-to-first key action and feedback. Persuade your audience using this Feature Acquisition Kpis To Measure Performance Themes PDF. This PPT design covers four stages, thus making it a great tool to use. It also caters to a variety of topics including Adoption Rate, Average Time Spent, Feedback. Download this PPT design now to present a convincing pitch that not only emphasizes the topic but also showcases your presentation skills.
Robotic Process Automation Metrics Icon Download PDF
Pitch your topic with ease and precision using this Robotic Process Automation Metrics Icon Download PDF. This layout presents information on Automation Metrics Icon, Robotic Process. It is also available for immediate download and adjustment. So, changes can be made in the color, design, graphics or any other component to create a unique layout.

Stakeholders Participation Project Development Process Evaluation For Success Indicators Diagrams PDF
This slide covers the stakeholders engagement success measurement key performance indicators including stakeholders type , evaluation areas, methods, sources of information and long term or short term success. This is a stakeholders participation project development process evaluation for success indicators diagrams pdf template with various stages. Focus and dispense information on one stage using this creative set, that comes with editable features. It contains large content boxes to add your information on topics like stakeholder category, provide best systems available on time and within budget, support project design recommendations and input, meeting minutes. You can also showcase facts, figures, and other relevant content using this PPT layout. Grab it now.

Profitable Initiation Project Engagement Process Evaluation For Success Indicators Ppt Outline Background Image PDF
This slide covers the stakeholders engagement success measurement key performance indicators including stakeholders type , evaluation areas, methods, sources of information and long term or short term success Deliver and pitch your topic in the best possible manner with this profitable initiation project engagement process evaluation for success indicators ppt outline background image pdf. Use them to share invaluable insights on stakeholder, evaluation, project design and impress your audience. This template can be altered and modified as per your expectations. So, grab it now.
Key Business Metrics Dashboard Ppt Powerpoint Presentation Icon Graphics Design
This is a key business metrics dashboard ppt powerpoint presentation icon graphics design. This is a five stage process. The stages in this process are finance, marketing, management, investment, analysis.
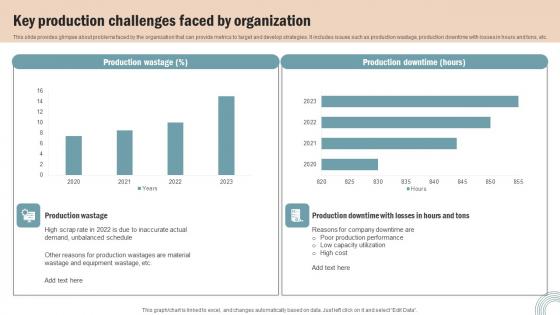
Key Production Challenges Faced Operations Strategy Improve Business Productivity Information Pdf
This slide provides glimpse about problems faced by the organization that can provide metrics to target and develop strategies. It includes issues such as production wastage, production downtime with losses in hours and tons, etc. Make sure to capture your audiences attention in your business displays with our gratis customizable Key Production Challenges Faced Operations Strategy Improve Business Productivity Information Pdf. These are great for business strategies, office conferences, capital raising or task suggestions. If you desire to acquire more customers for your tech business and ensure they stay satisfied, create your own sales presentation with these plain slides.
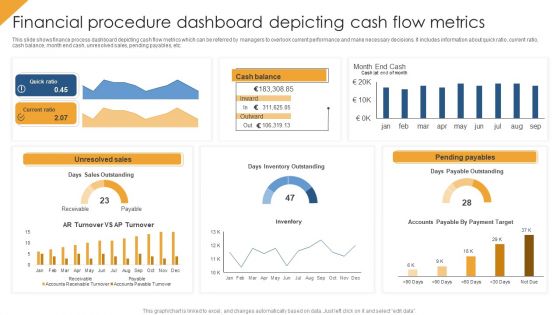
Financial Procedure Dashboard Depicting Cash Flow Metrics Structure PDF
This slide shows finance process dashboard depicting cash flow metrics which can be referred by managers to overlook current performance and make necessary decisions. It includes information about quick ratio, current ratio, cash balance, month end cash, unresolved sales, pending payables, etc. Pitch your topic with ease and precision using this Financial Procedure Dashboard Depicting Cash Flow Metrics Structure PDF. This layout presents information on Quick Ratio, Unresolved Sales, Pending Payables. It is also available for immediate download and adjustment. So, changes can be made in the color, design, graphics or any other component to create a unique layout.

Debt Recovery Dashboard With Cash Flow Metrics Summary PDF
This slide showcase debt collection dashboard with cash flow metrics which contains 12 month collection totals by client, non payers, client with most debtors, paid vs. owed debtor and income by agent. It can assist businesses in reviewing the money collected and lent to various clients.Pitch your topic with ease and precision using this Debt Recovery Dashboard With Cash Flow Metrics Summary PDF This layout presents information on Debt Recovery, Dashboard Cash, Flow Metrics It is also available for immediate download and adjustment. So, changes can be made in the color, design, graphics or any other component to create a unique layout.

Ppt Red Circular Arrow Process Flow Network Diagram PowerPoint Template Templates
PPT red circular arrow process flow network diagram powerpoint template Templates-Use this Circular Arrow diagram to show activities that are related to the business plan metrics and monitor the results to determine if the business plan is proceeding as planned.-PPT red circular arrow process flow network diagram powerpoint template Templates-3d, arrow, background, blue, chart, clipart, colorful, connection, continuity, cycle, cyclic, diagram, direction, flow, graph, icon, illustration, isolated, loop, motion, process, progress, step, sticker, symbol, teamwork, template, turn, vector

Cash Flow Metrics Ppt PowerPoint Presentation Complete Deck With Slides
Improve your presentation delivery using this Cash Flow Metrics Ppt PowerPoint Presentation Complete Deck With Slides. Support your business vision and objectives using this well-structured PPT deck. This template offers a great starting point for delivering beautifully designed presentations on the topic of your choice. Comprising thirteen slides this professionally designed template is all you need to host discussion and meetings with collaborators. Each slide is self-explanatory and equipped with high-quality graphics that can be adjusted to your needs. Therefore, you will face no difficulty in portraying your desired content using this PPT slideshow. This PowerPoint slideshow contains every important element that you need for a great pitch. It is not only editable but also available for immediate download and utilization. The color, font size, background, shapes everything can be modified to create your unique presentation layout. Therefore, download it now.
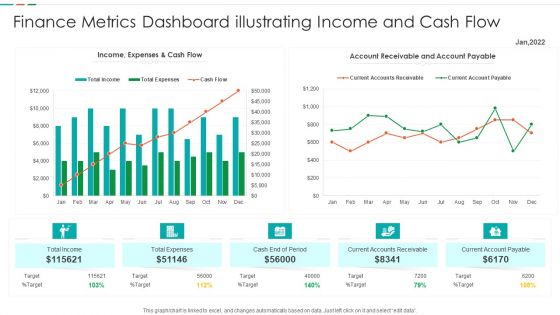
Finance Metrics Dashboard Illustrating Income And Cash Flow Template PDF
This graph or chart is linked to excel, and changes automatically based on data. Just left click on it and select edit data. Pitch your topic with ease and precision using this Finance Metrics Dashboard Illustrating Income And Cash Flow Template PDF. This layout presents information on Current Accounts Receivable, Current Account Payable, Cash End Period, Account Receivable Account. It is also available for immediate download and adjustment. So, changes can be made in the color, design, graphics or any other component to create a unique layout.
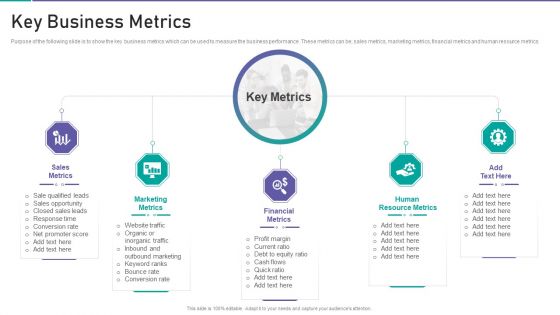
Corporate Organization Playbook Key Business Metrics Ppt Inspiration Elements PDF
Purpose of the following slide is to show the key business metrics which can be used to measure the business performance. These metrics can be sales metrics, marketing metrics, financial metrics and human resource metrics. Presenting corporate organization playbook key business metrics ppt inspiration elements pdf to provide visual cues and insights. Share and navigate important information on five stages that need your due attention. This template can be used to pitch topics like sales metrics, marketing metrics, financial metrics, human resource metrics. In addtion, this PPT design contains high resolution images, graphics, etc, that are easily editable and available for immediate download.

Business Growth Roadmap Success Flowchart With Metrics Themes PDF
This slide presents business development success flowchart that highlights operations and contribution of inputs in producing quality output and its final impact on organization. It includes metrics to track each phase such as industry income, interaction intensity and organizational publications. Presenting Business Growth Roadmap Success Flowchart With Metrics Themes PDF to dispense important information. This template comprises four stages. It also presents valuable insights into the topics including Important Business Research, High Quality Research Conducted, Building Opportunities. This is a completely customizable PowerPoint theme that can be put to use immediately. So, download it and address the topic impactfully.

Software Application Development Performance Metrics Mockup PDF
This slide showcase software application metrics indicator to monitor software quantitative measure for achieving improvement in application and alignment with organization objectives. It includes indicators like CPU usage, memory usage, per minute and byte per requester rate, security exposure and latency and uptime Persuade your audience using this Software Application Development Performance Metrics Mockup PDF. This PPT design covers Six stages, thus making it a great tool to use. It also caters to a variety of topics including Latency And Uptime, Memory Usage, Security Exposure . Download this PPT design now to present a convincing pitch that not only emphasizes the topic but also showcases your presentation skills.
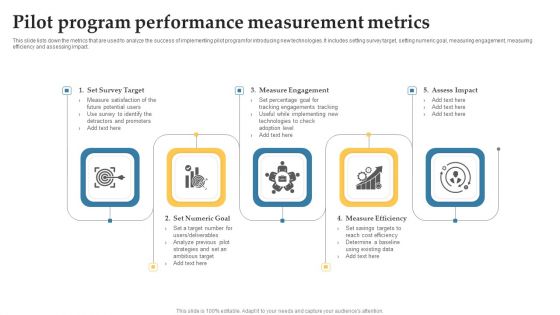
Pilot Program Performance Measurement Metrics Ideas PDF
This slide lists down the metrics that are used to analyze the success of implementing pilot program for introducing new technologies. It includes setting survey target, setting numeric goal, measuring engagement, measuring efficiency and assessing impact. Persuade your audience using this Pilot Program Performance Measurement Metrics Ideas PDF. This PPT design covers five stages, thus making it a great tool to use. It also caters to a variety of topics including Measure Engagement, Assess Impact, Measure Efficiency. Download this PPT design now to present a convincing pitch that not only emphasizes the topic but also showcases your presentation skills.

Key Web Software Performance Metrics Background PDF
Persuade your audience using this Key Web Software Performance Metrics Background PDF. This PPT design covers Seven stages, thus making it a great tool to use. It also caters to a variety of topics including User Satisfaction, Peak Response Time, Time To Interactive. Download this PPT design now to present a convincing pitch that not only emphasizes the topic but also showcases your presentation skills.

Key Metrics For Hotel Administration Management Linear Process Designs PDF
Presenting this set of slides with name key metrics for hotel administration management linear process designs pdf. This is a four stage process. The stages in this process are linear process. This is a completely editable PowerPoint presentation and is available for immediate download. Download now and impress your audience.

Vendor Performance Analysis And Administration Key Steps Of Supplier Evaluation Process Structure PDF
The following slide showcases various steps for evaluating vendor performance to streamline business operations and optimize costs. It includes steps such as identify performance indicators, develop an evaluation ranking, identify appropriate methods, determine deficiencies, optimize weak links and conduct routine evaluation. There are so many reasons you need a Vendor Performance Analysis And Administration Key Steps Of Supplier Evaluation Process Structure PDF. The first reason is you cannot spend time making everything from scratch, Thus, Slidegeeks has made presentation templates for you too. You can easily download these templates from our website easily.
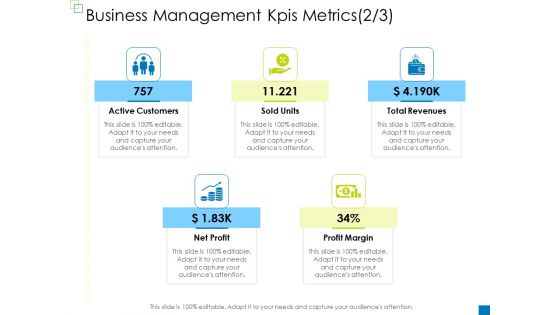
Enterprise Management Business Management Kpis Metrics Net Diagrams PDF
Presenting enterprise management business management kpis metrics net diagrams pdf to provide visual cues and insights. Share and navigate important information on five stages that need your due attention. This template can be used to pitch topics like active customers, total revenues, net profit, profit margin, sold units. In addition, this PPT design contains high-resolution images, graphics, etc, that are easily editable and available for immediate download.

Enterprise Governance Business Management Kpis Metrics Net Information PDF
Presenting enterprise governance business management kpis metrics net information pdf to provide visual cues and insights. Share and navigate important information on five stages that need your due attention. This template can be used to pitch topics like active customers, net profit, profit margin, sold units, total revenues. In addition, this PPT design contains high-resolution images, graphics, etc, that are easily editable and available for immediate download.
Setting Campaign Metrics Ppt PowerPoint Presentation Show Designs
This is a setting campaign metrics ppt powerpoint presentation show designs. This is a five stage process. The stages in this process are icons, business, marketing, management, success.

Key Evaluation Metrics Ppt Powerpoint Presentation Styles Design Inspiration
This is a key evaluation metrics ppt powerpoint presentation styles design inspiration. This is a five stage process. The stages in this process are business, marketing, icons, finance.

Banking Performance Metrics Ppt PowerPoint Presentation Slides Design Templates Cpb
Presenting this set of slides with name banking performance metrics ppt powerpoint presentation slides design templates cpb. This is an editable Powerpoint five stages graphic that deals with topics like banking performance metrics to help convey your message better graphically. This product is a premium product available for immediate download and is 100 percent editable in Powerpoint. Download this now and use it in your presentations to impress your audience.
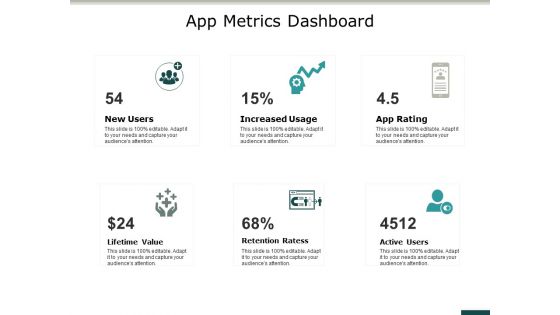
App Metrics Dashboard Ppt PowerPoint Presentation Inspiration Design Inspiration
This is a app metrics dashboard ppt powerpoint presentation inspiration design inspiration. This is a six stage process. The stages in this process are business, management, marketing.
Supplier Relationship Management Metrics Ppt PowerPoint Presentation Styles Designs
This is a supplier relationship management metrics ppt powerpoint presentation styles designs. This is a six stage process. The stages in this process are supplier relationship management metrics.
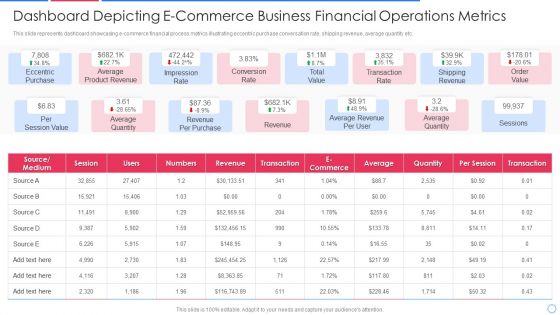
Dashboard Depicting E-Commerce Business Financial Operations Metrics Topics PDF
This slide represents dashboard showcasing e-commerce financial process metrics illustrating eccentric purchase conversation rate, shipping revenue, average quantity etc.Showcasing this set of slides titled dashboard depicting e-commerce business financial operations metrics topics pdf The topics addressed in these templates are eccentric purchase, average product revenue, impression rate All the content presented in this PPT design is completely editable. Download it and make adjustments in color, background, font etc. as per your unique business setting.
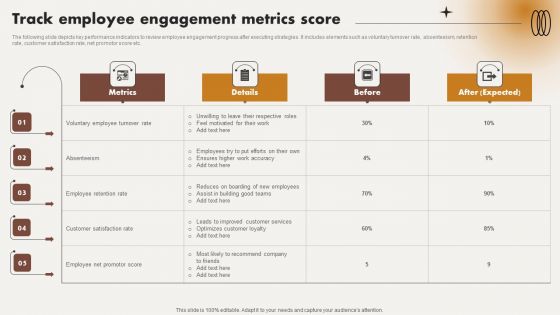
Analyzing And Improving Staff Work Satisfaction Track Employee Engagement Metrics Score Portrait PDF
The following slide depicts key performance indicators to review employee engagement progress after executing strategies. It includes elements such as voluntary turnover rate, absenteeism, retention rate, customer satisfaction rate, net promotor score etc. Do you have an important presentation coming up Are you looking for something that will make your presentation stand out from the rest Look no further than Analyzing And Improving Staff Work Satisfaction Track Employee Engagement Metrics Score Portrait PDF. With our professional designs, you can trust that your presentation will pop and make delivering it a smooth process. And with Slidegeeks, you can trust that your presentation will be unique and memorable. So why wait Grab Analyzing And Improving Staff Work Satisfaction Track Employee Engagement Metrics Score Portrait PDF today and make your presentation stand out from the rest.

Performance Metrics Examples Ppt PowerPoint Presentation Inspiration Design Templates
This is a performance metrics examples ppt powerpoint presentation inspiration design templates. This is a eight stage process. The stages in this process are performance metrics examples.

Hr Metrics Analytics Ppt Powerpoint Presentation Model Background Designs Cpb
This is a hr metrics analytics ppt powerpoint presentation model background designs cpb. This is a one stage process. The stages in this process are hr metrics analytics.
Agile And Lean Metrics Ppt PowerPoint Presentation Icon Background Designs
This is a agile and lean metrics ppt powerpoint presentation icon background designs. This is a two stage process. The stages in this process are cycle time, circular time, circle time.
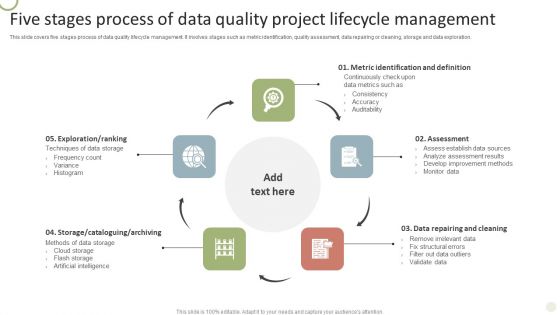
Five Stages Process Of Data Quality Project Lifecycle Management Rules PDF
This slide covers five stages process of data quality lifecycle management. It involves stages such as metric identification, quality assessment, data repairing or cleaning, storage and data exploration.Presenting Five Stages Process Of Data Quality Project Lifecycle Management Rules PDF to dispense important information. This template comprises five stages. It also presents valuable insights into the topics including Identification Definition, Analyze Assessment, Develop Improvement. This is a completely customizable PowerPoint theme that can be put to use immediately. So, download it and address the topic impactfully.

Key Evaluation Metrics Ppt PowerPoint Presentation File Design Ideas
This is a key evaluation metrics ppt powerpoint presentation file design ideas. This is a five stage process. The stages in this process are business, icons, strategy, marketing, finance.
Key Sales Performance Metrics Ppt PowerPoint Presentation Icon Design Templates
This is a key sales performance metrics ppt powerpoint presentation icon design templates. This is a four stage process. The stages in this process are campaigns to drive traffic, visitors, trials, closed deals, business.

Key Financial Metrics Ppt PowerPoint Presentation Portfolio Design Inspiration Cpb
Presenting this set of slides with name key financial metrics ppt powerpoint presentation portfolio design inspiration cpb. This is an editable Powerpoint four stages graphic that deals with topics like key financial metrics to help convey your message better graphically. This product is a premium product available for immediate download and is 100 percent editable in Powerpoint. Download this now and use it in your presentations to impress your audience.

Designing And Deployment Implementation Data Transmission And Metrics Professional PDF
This slide showcases the Implementation with process automation which includes assignment and workflow approach, data transmission and setting up metrics with CRM software.. Deliver an awe inspiring pitch with this creative designing and deployment implementation data transmission and metrics professional pdf bundle. Topics like data transmission, setup metrics, crm can be discussed with this completely editable template. It is available for immediate download depending on the needs and requirements of the user.
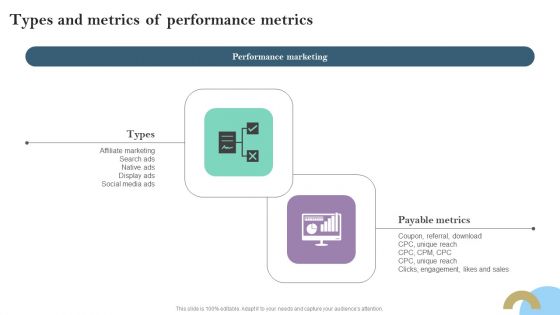
Types And Metrics Of Performance Metrics Ppt PowerPoint Presentation File Portfolio PDF
Find a pre designed and impeccable Types And Metrics Of Performance Metrics Ppt PowerPoint Presentation File Portfolio PDF. The templates can ace your presentation without additional effort. You can download these easy to edit presentation templates to make your presentation stand out from others. So, what are you waiting for Download the template from Slidegeeks today and give a unique touch to your presentation.

Key Sales Performance Metrics Ppt PowerPoint Presentation Slides Designs
This is a key sales performance metrics ppt powerpoint presentation slides designs. This is a four stage process. The stages in this process are campaigns to drive traffic, visitors, trials, closed deals.

Social Media Metrics Ppt PowerPoint Presentation File Design Inspiration
This is a social media metrics ppt powerpoint presentation file design inspiration. This is a four stage process. The stages in this process are facebook, google, twitter, youtube.
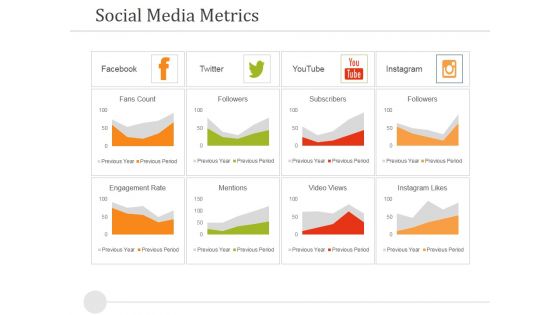
Social Media Metrics Ppt PowerPoint Presentation Layouts Designs Download
This is a social media metrics ppt powerpoint presentation layouts designs download. This is a eight stage process. The stages in this process are facebook, twitter, youtube, instagram.
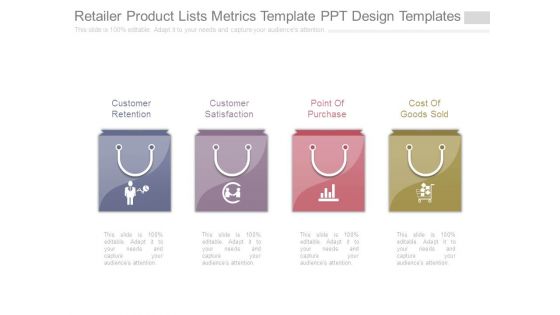
Retailer Product Lists Metrics Template Ppt Design Templates
This is a retailer product lists metrics template ppt design templates. This is a four stage process. The stages in this process are customer retention, customer satisfaction, point of purchase, cost of goods sold.
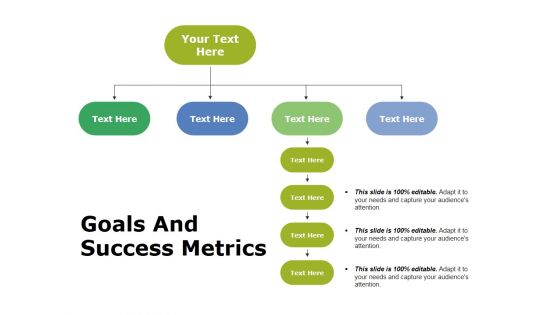
Goals And Success Metrics Ppt PowerPoint Presentation Layouts Design Templates
This is a goals and success metrics ppt powerpoint presentation layouts design templates. This is a four stage process. The stages in this process are goals, marketing, success, planning, strategy.
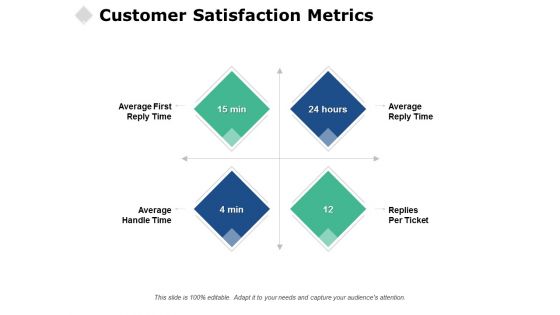
Customer Satisfaction Metrics Ppt PowerPoint Presentation Gallery Graphics Design
Presenting this set of slides with name customer satisfaction metrics ppt powerpoint presentation gallery graphics design. This is a four stage process. The stages in this process are business, management, planning, strategy, marketing. This is a completely editable PowerPoint presentation and is available for immediate download. Download now and impress your audience.

Financial Projections And Key Metrics Ppt PowerPoint Presentation Designs
This is a financial projections and key metrics ppt powerpoint presentation designs. This is a five stage process. The stages in this process are profits, expenses, sales, of employees, of customers.
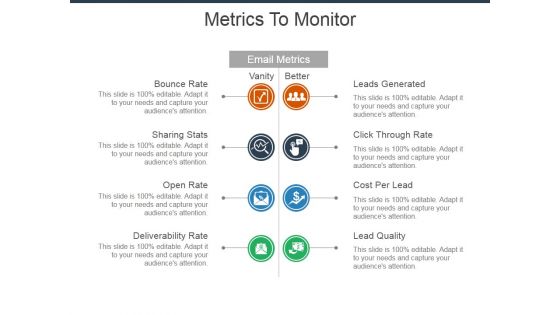
Metrics To Monitor Ppt Powerpoint Presentation Professional Graphics Design
This is a metrics to monitor ppt powerpoint presentation professional graphics design. This is a four stage process. The stages in this process are leads generated, click through rate, cost per lead, lead quality, deliverability rate, open rate, sharing stats, bounce rate.
Recruitment Media Metrics Ppt PowerPoint Presentation File Design Ideas Cpb
Presenting this set of slides with name recruitment media metrics ppt powerpoint presentation file design ideas cpb. This is a seven stage process. The stages in this process are recruitment media metrics. This is a completely editable PowerPoint presentation and is available for immediate download. Download now and impress your audience.
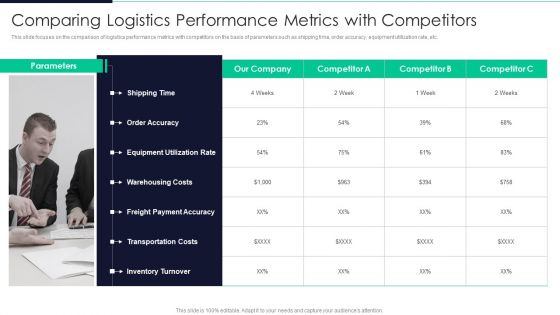
Developing Excellence In Logistics Operations Comparing Logistics Performance Metrics Diagrams PDF
This slide focuses on the comparison of logistics performance metrics with competitors on the basis of parameters such as shipping time, order accuracy, equipment utilization rate, etc.Deliver an awe inspiring pitch with this creative Developing Excellence In Logistics Operations Comparing Logistics Performance Metrics Diagrams PDF bundle. Topics like Order Accuracy, Equipment Utilization, Transportation Costs can be discussed with this completely editable template. It is available for immediate download depending on the needs and requirements of the user.

Process Model For Data Quality Kpis Metrics Identification Brochure PDF
This slide covers process to identify data defects causing business problems. It includes activities consisting of three phase such as identification phase to identify business problems, specification phase to develop the data quality metrics and verification phase to ensure the data quality metrics meet the requirements. Persuade your audience using this Process Model For Data Quality Kpis Metrics Identification Brochure PDF. This PPT design covers Seven stages, thus making it a great tool to use. It also caters to a variety of topics including Business Process, Identification And Metrics, Verify Requirement Fulfilment. Download this PPT design now to present a convincing pitch that not only emphasizes the topic but also showcases your presentation skills.
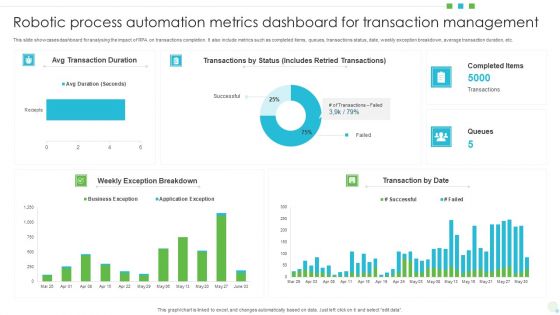
Robotic Process Automation Metrics Dashboard For Transaction Management Ideas PDF
This slide showcases dashboard for analysing the impact of RPA on transactions completion. It also include metrics such as completed items, queues, transactions status, date, weekly exception breakdown, average transaction duration, etc. Showcasing this set of slides titled Robotic Process Automation Metrics Dashboard For Transaction Management Ideas PDF. The topics addressed in these templates are Dashboard For Transaction Management, Robotic Process Automation Metrics. All the content presented in this PPT design is completely editable. Download it and make adjustments in color, background, font etc. as per your unique business setting.
Content Marketing Freelance Metrics To Track Performance Icons PDF
The following slide highlights the content marketing freelance metrics to track performance which illustrates four categories of metrics depicting seo outcome, company revenue, user behaviour,and engagement. Persuade your audience using this Content Marketing Freelance Metrics To Track Performance Icons PDF. This PPT design covers four stages, thus making it a great tool to use. It also caters to a variety of topics including User Bahavior, Company Revenue, Engagement. Download this PPT design now to present a convincing pitch that not only emphasizes the topic but also showcases your presentation skills.

Developing Excellence In Logistics Operations Kpis To Track Transportation Management System Performance Clipart PDF
This slide focuses on key performance indicators to track transportation management system performance which includes freight cost for each unit shipped, outbound and inbound freight costs, etc.Deliver and pitch your topic in the best possible manner with this Developing Excellence In Logistics Operations Kpis To Track Transportation Management System Performance Clipart PDF Use them to share invaluable insights on Inbound Freight, Transportation Time, Freight Billing and impress your audience. This template can be altered and modified as per your expectations. So, grab it now.
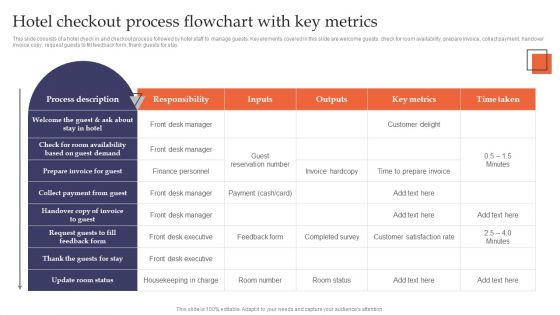
Hotel Checkout Process Flowchart With Key Metrics Structure PDF
This slide consists of a hotel check in and checkout process followed by hotel staff to manage guests. Key elements covered in this slide are welcome guests, check for room availability, prepare invoice, collect payment, handover invoice copy, request guests to fill feedback form, thank guests for stay. Showcasing this set of slides titled Hotel Checkout Process Flowchart With Key Metrics Structure PDF. The topics addressed in these templates are Responsibility, Outputs, Key Metrics. All the content presented in this PPT design is completely editable. Download it and make adjustments in color, background, font etc. as per your unique business setting.
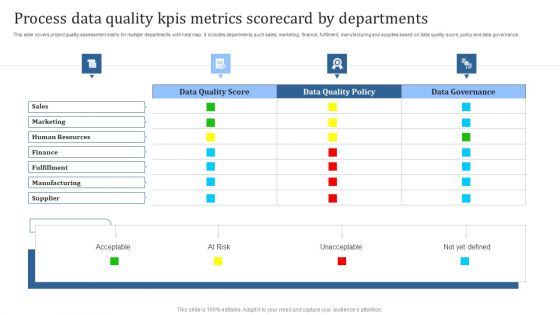
Process Data Quality Kpis Metrics Scorecard By Departments Template PDF
This slide covers project quality assessment matrix for multiple departments with heat map. It includes departments such sales, marketing, finance, fulfilment, manufacturing and supplies based on data quality score, policy and data governance. Showcasing this set of slides titled Process Data Quality Kpis Metrics Scorecard By Departments Template PDF. The topics addressed in these templates are Acceptable, At Risk, Unacceptable. All the content presented in this PPT design is completely editable. Download it and make adjustments in color, background, font etc. as per your unique business setting.
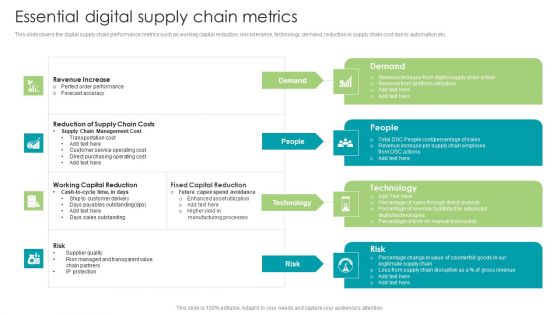
Robotic Process Automation Essential Digital Supply Chain Metrics Diagrams PDF
This slide covers the digital supply chain performance metrics such as working capital reduction, risk tolerance, technology, demand, reduction in supply chain cost due to automation etc. Explore a selection of the finest Robotic Process Automation Essential Digital Supply Chain Metrics Diagrams PDF here. With a plethora of professionally designed and pre-made slide templates, you can quickly and easily find the right one for your upcoming presentation. You can use our Robotic Process Automation Essential Digital Supply Chain Metrics Diagrams PDF to effectively convey your message to a wider audience. Slidegeeks has done a lot of research before preparing these presentation templates. The content can be personalized and the slides are highly editable. Grab templates today from Slidegeeks.
Supply Chain Management Operational Metrics Strategic Sourcing Process Icons PDF
Presenting supply chain management operational metrics strategic sourcing process icons pdf. to provide visual cues and insights. Share and navigate important information on six stages that need your due attention. This template can be used to pitch topics like communication with new suppliers, understanding the spent category, supplier market assessment. In addtion, this PPT design contains high resolution images, graphics, etc, that are easily editable and available for immediate download.

Business Strategy Development Process Business Management Kpis Metrics Margin Pictures PDF
Presenting business strategy development process business management kpis metrics margin pictures pdf to provide visual cues and insights. Share and navigate important information on five stages that need your due attention. This template can be used to pitch topics like active customers, sold units, total revenues, profit margin, net profit. In addtion, this PPT design contains high resolution images, graphics, etc, that are easily editable and available for immediate download.
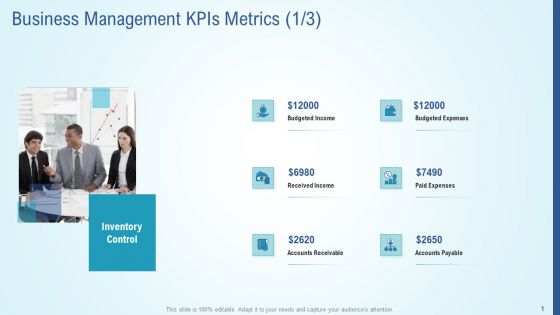
Business Strategy Development Process Business Management Kpis Metrics Paid Elements PDF
Presenting business strategy development process business management kpis metrics paid elements pdf to provide visual cues and insights. Share and navigate important information on six stages that need your due attention. This template can be used to pitch topics like budgeted income, budgeted expenses, received income, accounts receivable, accounts payable. In addtion, this PPT design contains high resolution images, graphics, etc, that are easily editable and available for immediate download.
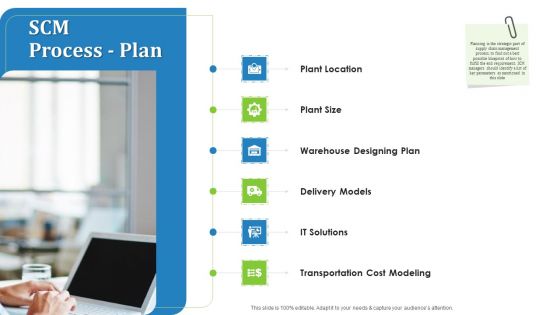
Supply Chain Management Operational Metrics SCM Process Plan Professional PDF
This is a supply chain management operational metrics SCM process plan professional pdf. template with various stages. Focus and dispense information on six stages using this creative set, that comes with editable features. It contains large content boxes to add your information on topics like plant location, plant size, warehouse designing plan. You can also showcase facts, figures, and other relevant content using this PPT layout. Grab it now.

Business Management Kpis Metrics Customers Business Analysis Method Ppt Infographic Template Example PDF
Presenting business management kpis metrics customers business analysis method ppt infographic template example pdf to provide visual cues and insights. Share and navigate important information on five stages that need your due attention. This template can be used to pitch topics like active customers, sold units, total revenues, net profit, profit margin. In addtion, this PPT design contains high resolution images, graphics, etc, that are easily editable and available for immediate download.

Sales And Business Development Action Plan Marketing Future Action Metrics Ppt Infographics Designs Download PDF
Presenting this set of slides with name sales and business development action plan marketing future action metrics ppt infographics designs download pdf. This is a one stage process. The stages in this process are metrics, current, goal, timeline, brand awareness, conversion rate optimization. This is a completely editable PowerPoint presentation and is available for immediate download. Download now and impress your audience.
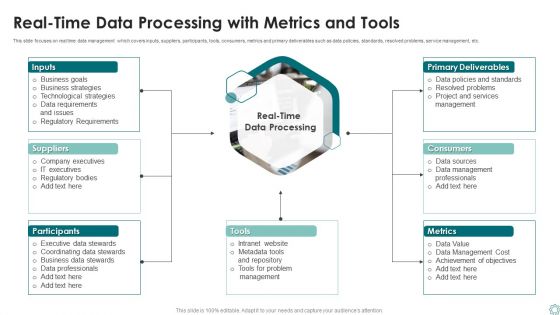
Real Time Data Processing With Metrics And Tools Ppt Styles Topics PDF
This slide focuses on real time data management which covers inputs, suppliers, participants, tools, consumers, metrics and primary deliverables such as data policies, standards, resolved problems, service management, etc. Persuade your audience using this Real Time Data Processing With Metrics And Tools Ppt Styles Topics PDF. This PPT design covers one stages, thus making it a great tool to use. It also caters to a variety of topics including Suppliers, Participants, Metrics, Consumers, Primary Deliverables. Download this PPT design now to present a convincing pitch that not only emphasizes the topic but also showcases your presentation skills.
Cash Flow Metrics To Measure Firms Financial Position Icon Ppt Gallery Deck PDF
Showcasing this set of slides titled Cash Flow Metrics To Measure Firms Financial Position Icon Ppt Gallery Deck PDF. The topics addressed in these templates are Cash Flow, Metrics To Measure, Firms Financial, Position Icon. All the content presented in this PPT design is completely editable. Download it and make adjustments in color, background, font etc. as per your unique business setting.

Bizbok Business Architecture Metrics And Measures Ppt PowerPoint Presentation File Design Templates
Presenting this set of slides with name bizbok business architecture metrics and measures ppt powerpoint presentation file design templates. This is a three stage process. The stages in this process are business strategy, business architecture, actionable plans, management, marketing. This is a completely editable PowerPoint presentation and is available for immediate download. Download now and impress your audience.
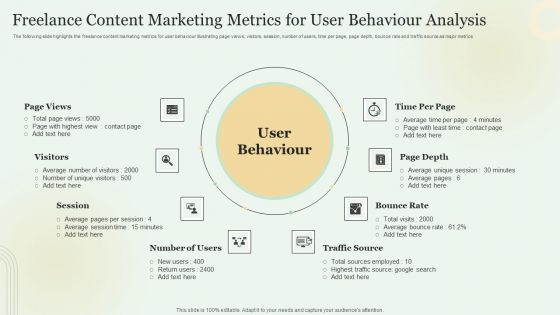
Freelance Content Marketing Metrics For User Behaviour Analysis Mockup PDF
The following slide highlights the freelance content marketing metrics for user behaviour illustrating page views, visitors, session, number of users, time per page, page depth, bounce rate and traffic source as major metrics. Persuade your audience using this Freelance Content Marketing Metrics For User Behaviour Analysis Mockup PDF. This PPT design covers eight stages, thus making it a great tool to use. It also caters to a variety of topics including Bounce Rate, Traffic Source, User Behaviour. Download this PPT design now to present a convincing pitch that not only emphasizes the topic but also showcases your presentation skills.

Extensive Sales Metrics For Product Performance Summary PDF
This slide showcase metrics of product sales performances which help managers to determine whether sales team hitting their set targets and future goals. It include metrics such as total revenue, net revenue retention, repeat customer rate and average customer lifetime value.Persuade your audience using this Extensive Sales Metrics For Product Performance Summary PDF. This PPT design covers four stages, thus making it a great tool to use. It also caters to a variety of topics including Total Revenue, Net Revenue Retention. Download this PPT design now to present a convincing pitch that not only emphasizes the topic but also showcases your presentation skills.
Business Commodity Market KPIS 6 Steps Roadmap For Product Marketing Metrics Proposal Designs PDF
Presenting this set of slides with name business commodity market kpis 6 steps roadmap for product marketing metrics proposal designs pdf. This is a seven stage process. The stages in this process are roadmap. This is a completely editable PowerPoint presentation and is available for immediate download. Download now and impress your audience.
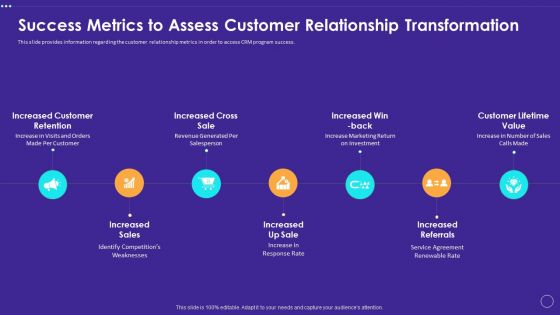
Success Metrics To Assess Customer Relationship Transformation Formats PDF
This slide provides information regarding the customer relationship metrics in order to access CRM program success. Get a simple yet stunning designed Success Metrics To Assess Customer Relationship Transformation Formats PDF. It is the best one to establish the tone in your meetings. It is an excellent way to make your presentations highly effective. So, download this PPT today from Slidegeeks and see the positive impacts. Our easy to edit Success Metrics To Assess Customer Relationship Transformation Formats PDF can be your go to option for all upcoming conferences and meetings. So, what are you waiting for Grab this template today.
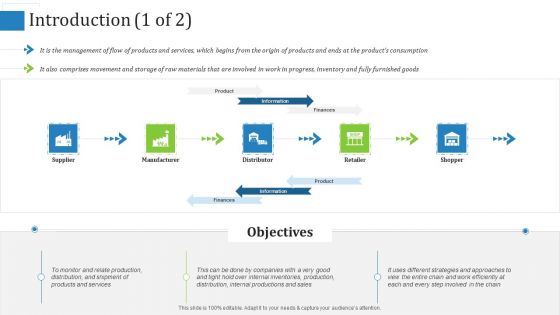
Supply Chain Management Operational Metrics Introduction Supplier Graphics PDF
Presenting supply chain management operational metrics introduction supplier graphics pdf. to provide visual cues and insights. Share and navigate important information on six stages that need your due attention. This template can be used to pitch topics like supply chain components, SCM process flow, SCM implementation steps. In addtion, this PPT design contains high resolution images, graphics, etc, that are easily editable and available for immediate download.

Psychological Marketing Metrics That Influence Buying Behaviour Elements PDF
This slide covers metrics to develop effective marketing material by understanding customer behavior and then utilizing them to achieve goals of company. It includes trust, fear, guilt, belonging, time, value and competition. Persuade your audience using this Psychological Marketing Metrics That Influence Buying Behaviour Elements PDF. This PPT design covers seven stages, thus making it a great tool to use. It also caters to a variety of topics including Competition, Value, Trust. Download this PPT design now to present a convincing pitch that not only emphasizes the topic but also showcases your presentation skills.
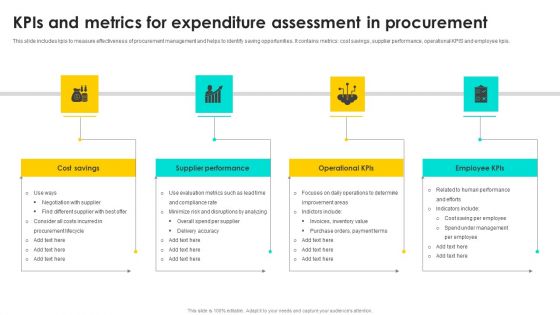
Kpis And Metrics For Expenditure Assessment In Procurement Slides PDF
This slide includes kpis to measure effectiveness of procurement management and helps to identify saving opportunities. It contains metrics cost savings, supplier performance, operational KPIS and employee kpis. Persuade your audience using this Kpis And Metrics For Expenditure Assessment In Procurement Slides PDF. This PPT design covers Four stages, thus making it a great tool to use. It also caters to a variety of topics including Cost Savings, Supplier Performance. Download this PPT design now to present a convincing pitch that not only emphasizes the topic but also showcases your presentation skills.

User Behavior Metrics For Content Performance Analysis Pictures PDF
This slide exhibits content metrics based on consumer behavior to understand customer interaction with website. It contains five points page views, average time on page, users, new and returning visitors, bounce rate and pages per session. Persuade your audience using this User Behavior Metrics For Content Performance Analysis Pictures PDF. This PPT design covers Six stages, thus making it a great tool to use. It also caters to a variety of topics including Page Views, New And Returning Visitors. Download this PPT design now to present a convincing pitch that not only emphasizes the topic but also showcases your presentation skills.

Key Metrics To Track PPC Marketing Campaigns Topics PDF
This slide exhibits metrics that helps to increase return on investment of paid campaigns. It includes five key indicators clicks, impressions, conversion rate, quality score and return on ad spend. Persuade your audience using this Key Metrics To Track PPC Marketing Campaigns Topics PDF. This PPT design covers five stages, thus making it a great tool to use. It also caters to a variety of topics including Conversion Rate, Return On Ad Spend, Impressions. Download this PPT design now to present a convincing pitch that not only emphasizes the topic but also showcases your presentation skills.

Metrics To Track Employee Engagement And Coordination Background PDF
The following slide outlines metrics to track employee collaboration aimed at motivating employee productivity for resolving issues and boost engagement. It covers turnover rate, retention rate, net promoter score, employee performance and workload balance. Persuade your audience using this Metrics To Track Employee Engagement And Coordination Background PDF. This PPT design covers six stages, thus making it a great tool to use. It also caters to a variety of topics including Turnover Rate, Employee Performance, Retention Rate. Download this PPT design now to present a convincing pitch that not only emphasizes the topic but also showcases your presentation skills.
Project Performance Metrics Bulb Or Idea Ppt Gallery Pictures PDF
Presenting project performance metrics bulb or idea ppt gallery pictures pdf to provide visual cues and insights. Share and navigate important information on three stages that need your due attention. This template can be used to pitch topics like bulb or idea. In addtion, this PPT design contains high resolution images, graphics, etc, that are easily editable and available for immediate download.

Client Life Cycle Marketing Metrics Ppt Portfolio Graphic Tips PDF
This slide shows the key marketing KPIs such as conversion rate, impressions etc. in customer journey cycle. Persuade your audience using this client life cycle marketing metrics ppt portfolio graphic tips pdf. This PPT design covers five stages, thus making it a great tool to use. It also caters to a variety of topics including awareness, consideration, decision, retention, advocacy. Download this PPT design now to present a convincing pitch that not only emphasizes the topic but also showcases your presentation skills.
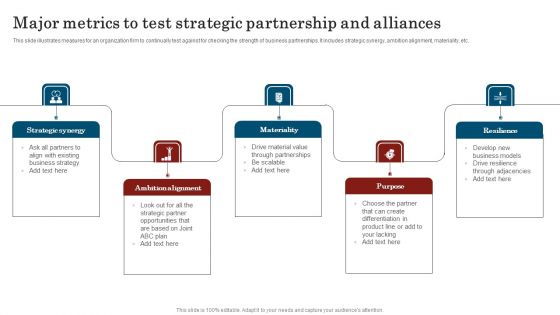
Major Metrics To Test Strategic Partnership And Alliances Graphics PDF
This slide illustrates measures for an organization firm to continually test against for checking the strength of business partnerships. It includes strategic synergy, ambition alignment, materiality, etc. Persuade your audience using this Major Metrics To Test Strategic Partnership And Alliances Graphics PDF. This PPT design covers five stages, thus making it a great tool to use. It also caters to a variety of topics including Strategic Synergy, Ambition Alignment, Materiality. Download this PPT design now to present a convincing pitch that not only emphasizes the topic but also showcases your presentation skills.
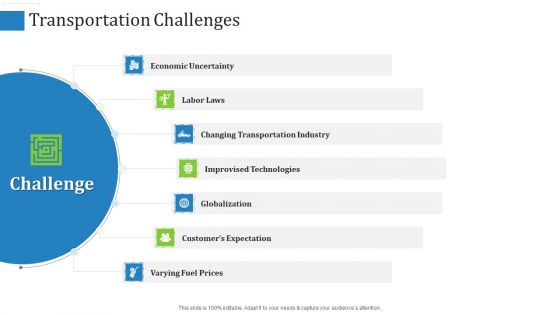
Supply Chain Management Operational Metrics Transportation Challenges Structure PDF
Presenting supply chain management operational metrics transportation challenges structure pdf. to provide visual cues and insights. Share and navigate important information on seven stages that need your due attention. This template can be used to pitch topics like economic uncertainty, changing transportation industry, improvised technologies. In addtion, this PPT design contains high resolution images, graphics, etc, that are easily editable and available for immediate download.
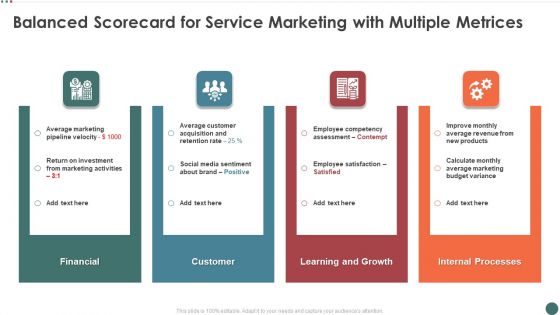
Balanced Scorecard For Service Marketing With Multiple Metrices Infographics PDF
Presenting balanced scorecard for service marketing with multiple metrices infographics pdf to provide visual cues and insights. Share and navigate important information on three stages that need your due attention. This template can be used to pitch topics like average marketing, average customer acquisition, employee competency In addtion, this PPT design contains high resolution images, graphics, etc, that are easily editable and available for immediate download.
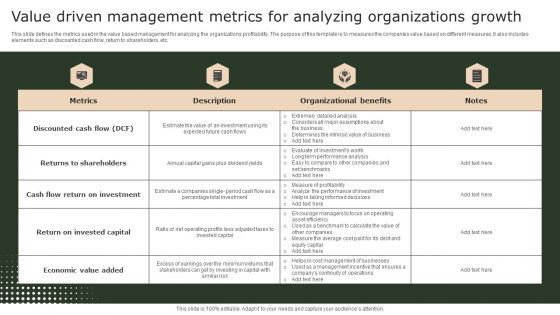
Value Driven Management Metrics For Analyzing Organizations Growth Inspiration PDF
This slide defines the metrics used in the value based management for analyzing the organizations profitability. The purpose of this template is to measures the companies value based on different measures. It also includes elements such as discounted cash flow, return to shareholders, etc. Pitch your topic with ease and precision using this Value Driven Management Metrics For Analyzing Organizations Growth Inspiration PDF. This layout presents information on Metrics, Organizational Benefits, Investment. It is also available for immediate download and adjustment. So, changes can be made in the color, design, graphics or any other component to create a unique layout.
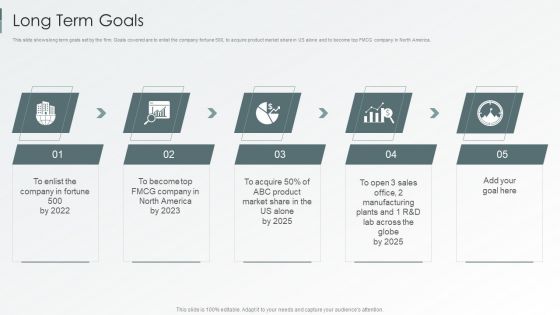
Enterprise Sustainability Performance Metrics Long Term Goals Demonstration PDF
This slide shows long term goals set by the firm. Goals covered are to enlist the company fortune 500, to acquire product market share in US alone and to become top FMCG company in North America.Presenting Enterprise Sustainability Performance Metrics Long Term Goals Demonstration PDF to provide visual cues and insights. Share and navigate important information on five stages that need your due attention. This template can be used to pitch topics like Company In Fortune, Manufacturing, Lab Across. In addtion, this PPT design contains high resolution images, graphics, etc, that are easily editable and available for immediate download.

Data Quality Kpis Metrics Scorecard For Core Business Processes Topics PDF
This slide covers score for data obtained from core business activities and process. It includes quality metrics such as accuracy, completeness, consistency, integrity, timeliness, uniqueness and validity for data from business partners, finance, material management, sales, etc. Showcasing this set of slides titled Data Quality Kpis Metrics Scorecard For Core Business Processes Topics PDF. The topics addressed in these templates are Data Quality, Errors, Reports. All the content presented in this PPT design is completely editable. Download it and make adjustments in color, background, font etc. as per your unique business setting.
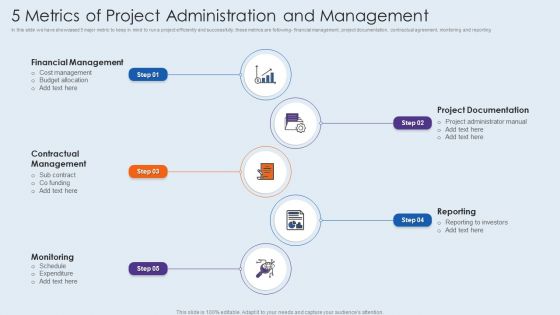
5 Metrics Of Project Administration And Management Structure PDF
In this slide we have showcased 5 major metric to keep in mind to run a project efficiently and successfully, these metrics are following financial management, project documentation, contractual agreement, monitoring and reporting. Persuade your audience using this 5 metrics of project administration and management structure pdf. This PPT design covers five stages, thus making it a great tool to use. It also caters to a variety of topics including financial management, contractual management, monitoring. Download this PPT design now to present a convincing pitch that not only emphasizes the topic but also showcases your presentation skills.
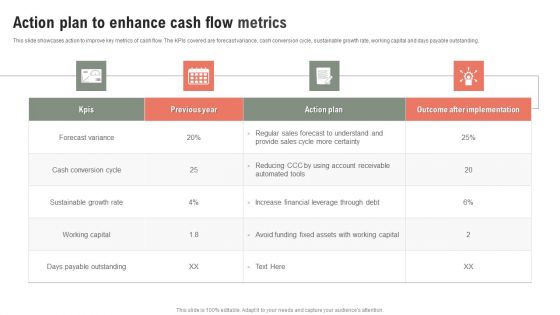
Action Plan To Enhance Cash Flow Metrics Ppt Show Maker PDF
This slide showcases action to improve key metrics of cash flow. The KPIs covered are forecast variance, cash conversion cycle, sustainable growth rate, working capital and days payable outstanding. Showcasing this set of slides titled Action Plan To Enhance Cash Flow Metrics Ppt Show Maker PDF. The topics addressed in these templates are Forecast Variance, Cash Conversion Cycle, Sustainable Growth Rate. All the content presented in this PPT design is completely editable. Download it and make adjustments in color, background, font etc. as per your unique business setting.
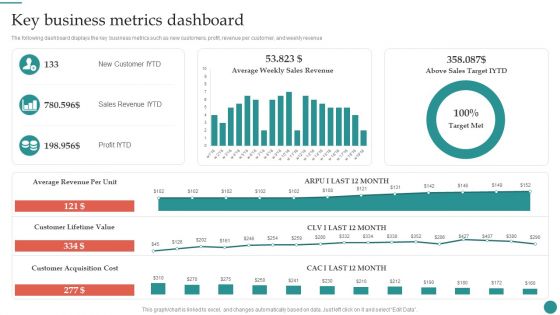
Key Business Metrics Dashboard Company Process Administration And Optimization Playbook Infographics PDF
The following dashboard displays the key business metrics such as new customers, profit, revenue per customer, and weekly revenue. Slidegeeks is here to make your presentations a breeze with Key Business Metrics Dashboard Company Process Administration And Optimization Playbook Infographics PDF With our easy-to-use and customizable templates, you can focus on delivering your ideas rather than worrying about formatting. With a variety of designs to choose from, you are sure to find one that suits your needs. And with animations and unique photos, illustrations, and fonts, you can make your presentation pop. So whether you are giving a sales pitch or presenting to the board, make sure to check out Slidegeeks first.

Operating Activity Metrics Showing Net Cash Flow Ppt Outline Slide Download PDF
This slide showcases annual cash inflow of different companys. The graph shows the profitability potential of the firm. Showcasing this set of slides titled Operating Activity Metrics Showing Net Cash Flow Ppt Outline Slide Download PDF. The topics addressed in these templates are Net Cash Flow, Operating Activities, Key Insights, 2020 To 2022. All the content presented in this PPT design is completely editable. Download it and make adjustments in color, background, font etc. as per your unique business setting.
Metrics To Improve Cash Flow Tracking Icon Ppt Inspiration Outfit PDF
Persuade your audience using this Metrics To Improve Cash Flow Tracking Icon Ppt Inspiration Outfit PDF. This PPT design covers three stages, thus making it a great tool to use. It also caters to a variety of topics including Metrics To Improve, Cash Flow, Tracking Icon. Download this PPT design now to present a convincing pitch that not only emphasizes the topic but also showcases your presentation skills.
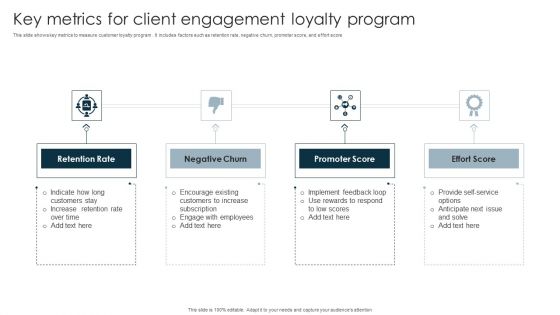
Key Metrics For Client Engagement Loyalty Program Microsoft PDF
This slide shows key metrics to measure customer loyalty program . It includes factors such as retention rate, negative churn, promoter score, and effort score. Persuade your audience using this Key Metrics For Client Engagement Loyalty Program Microsoft PDF. This PPT design covers four stages, thus making it a great tool to use. It also caters to a variety of topics including Retention Rate, Negative Churn, Promoter Score, Effort Score. Download this PPT design now to present a convincing pitch that not only emphasizes the topic but also showcases your presentation skills.
Customer Relationship Management Various CRM Program Success Metrics Icons PDF
This slide covers information regarding the metrics associated customer relationship to analyze CRM program success. Coming up with a presentation necessitates that the majority of the effort goes into the content and the message you intend to convey. The visuals of a PowerPoint presentation can only be effective if it supplements and supports the story that is being told. Keeping this in mind our experts created Customer Relationship Management Various CRM Program Success Metrics Icons PDF to reduce the time that goes into designing the presentation. This way, you can concentrate on the message while our designers take care of providing you with the right template for the situation.
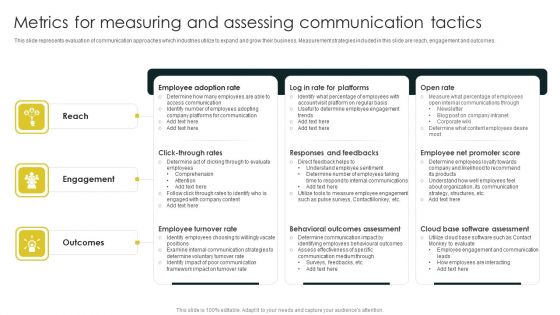
Metrics For Measuring And Assessing Communication Tactics Sample PDF
This slide represents evaluation of communication approaches which industries utilize to expand and grow their business. Measurement strategies included in this slide are reach, engagement and outcomes. Persuade your audience using this Metrics For Measuring And Assessing Communication Tactics Sample PDF. This PPT design covers three stages, thus making it a great tool to use. It also caters to a variety of topics including Reach, Engagement, Outcomes . Download this PPT design now to present a convincing pitch that not only emphasizes the topic but also showcases your presentation skills

Accounting Pitch Deck Key Financial Projections For Upcoming Years Designs PDF
This slide illustrates key performance indicators highlighting the financial projections for upcoming years. KPIs covered here are revenue breakdown, profitability and cash flow.Deliver an awe inspiring pitch with this creative accounting pitch deck key financial projections for upcoming years designs pdf bundle. Topics like revenue breakdown, profitability, cumulative cash flow can be discussed with this completely editable template. It is available for immediate download depending on the needs and requirements of the user.

Key Ratios And Metrics To Measure Cash Flow Statement Ppt Gallery Graphics PDF
This slide showcases main KPIs to measure cash flow. The KPIs included are cash flow per share, cash flow yield, margin, invested capital and net debt to free cash flow. Persuade your audience using this Key Ratios And Metrics To Measure Cash Flow Statement Ppt Gallery Graphics PDF. This PPT design covers six stages, thus making it a great tool to use. It also caters to a variety of topics including Fundamental, Valuation, Efficiency, Profitability. Download this PPT design now to present a convincing pitch that not only emphasizes the topic but also showcases your presentation skills.
Cash Flow Metrics To Determine Firm Financial Health Ppt Icon PDF
This slide showcases KPIs that provides information on the potential and financial health of company. The KPIs covered are working capital, liquidity ratio, operating cashflow, days payable outstanding and account receivable turnover. Showcasing this set of slides titled Cash Flow Metrics To Determine Firm Financial Health Ppt Icon PDF. The topics addressed in these templates are Working Capital, Liquidity Ratio, Operating Cashflow. All the content presented in this PPT design is completely editable. Download it and make adjustments in color, background, font etc. as per your unique business setting.

Cash Flow Metrics To Measure Firm Operations Effectiveness Ppt Outline Infographic Template PDF
This slide showcases yearly cash conversion cycle to determine companys working capital management. It includes DSO, DIO, DPO and CCC that measure the average number of days organization takes to collect payment and pay bills. Pitch your topic with ease and precision using this Cash Flow Metrics To Measure Firm Operations Effectiveness Ppt Outline Infographic Template PDF. This layout presents information on Cash Conversion Cycle, 2019 To 2022, Cash Flow. It is also available for immediate download and adjustment. So, changes can be made in the color, design, graphics or any other component to create a unique layout.
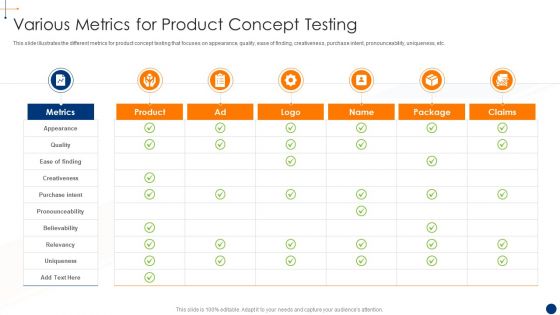
New Product Development Process Optimization Various Metrics For Product Designs PDF
This slide illustrates the different metrics for product concept testing that focuses on appearance, quality, ease of finding, creativeness, purchase intent, pronounceability, uniqueness, etc. Deliver and pitch your topic in the best possible manner with this new product development process optimization various metrics for product designs pdf. Use them to share invaluable insights on various metrics for product concept testing and impress your audience. This template can be altered and modified as per your expectations. So, grab it now.
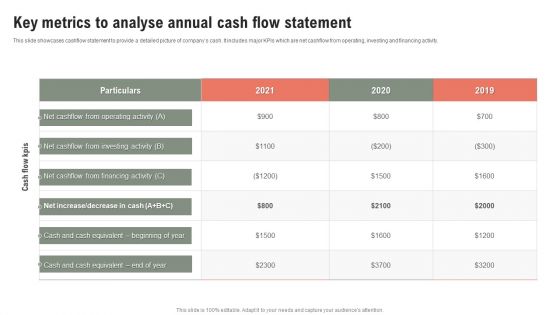
Key Metrics To Analyse Annual Cash Flow Statement Ppt Gallery Microsoft PDF
This slide showcases cashflow statement to provide a detailed picture of companys cash. It includes major KPIs which are net cashflow from operating, investing and financing activity. Pitch your topic with ease and precision using this Key Metrics To Analyse Annual Cash Flow Statement Ppt Gallery Microsoft PDF. This layout presents information on Net Cashflow, 2019 To 2021, Investing Activity. It is also available for immediate download and adjustment. So, changes can be made in the color, design, graphics or any other component to create a unique layout.
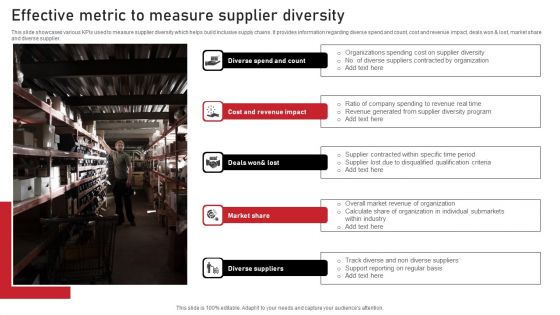
Effective Metric To Measure Supplier Diversity Themes PDF
This slide showcases various KPIs used to measure supplier diversity which helps build inclusive supply chains. It provides information regarding diverse spend and count, cost and revenue impact, deals won and lost, market share and diverse supplier. Persuade your audience using this Effective Metric To Measure Supplier Diversity Themes PDF. This PPT design covers five stages, thus making it a great tool to use. It also caters to a variety of topics including Market Share, Diverse Suppliers, Impact. Download this PPT design now to present a convincing pitch that not only emphasizes the topic but also showcases your presentation skills.

Operational Process Improvement Dashboard With RACI Chart And Action Timeline Metric Designs PDF
Deliver an awe inspiring pitch with this creative operational process improvement dashboard with raci chart and action timeline metric designs pdf bundle. Topics like metric, target, quality, customer can be discussed with this completely editable template. It is available for immediate download depending on the needs and requirements of the user.
Cybersecurity Operations Cybersecops Metrics To Track Secops Impact On Business Icons PDF
This slide refers to the key metrics to track the impact of SecOps implementation on business. The purpose of this slide is to highlight the key metrics for SecOps tracking, including mean time to acknowledge, mean time to resolve, incidents remediated and escalations between each tier. Get a simple yet stunning designed Cybersecurity Operations Cybersecops Metrics To Track Secops Impact On Business Icons PDF. It is the best one to establish the tone in your meetings. It is an excellent way to make your presentations highly effective. So, download this PPT today from Slidegeeks and see the positive impacts. Our easy to edit Cybersecurity Operations Cybersecops Metrics To Track Secops Impact On Business Icons PDF can be your go to option for all upcoming conferences and meetings. So, what are you waiting for Grab this template today.

Metrics To Evaluate Marketing Organizational Efficiency Gains Microsoft PDF
The following slide highlights metrics to assess efficiency benefits through marketing processes. It also constitutes of goals such as brand awareness, engagement, lead generation, sales, customer retention cross sell etc. Showcasing this set of slides titled Metrics To Evaluate Marketing Organizational Efficiency Gains Microsoft PDF. The topics addressed in these templates are Goals, Metrics, Comments. All the content presented in this PPT design is completely editable. Download it and make adjustments in color, background, font etc. as per your unique business setting.
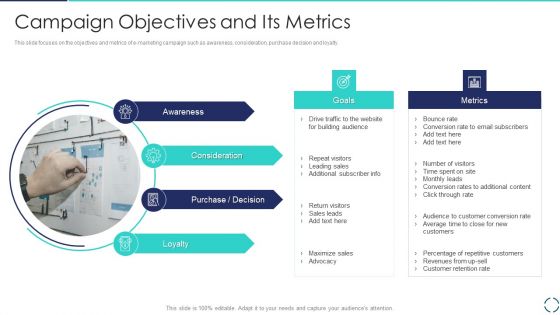
Optimizing E Business Promotion Plan Campaign Objectives And Its Metrics Infographics PDF
This slide focuses on the objectives and metrics of e-marketing campaign such as awareness, consideration, purchase decision and loyalty. Presenting Optimizing E Business Promotion Plan Campaign Objectives And Its Metrics Infographics PDF to provide visual cues and insights. Share and navigate important information on four stages that need your due attention. This template can be used to pitch topics like Awareness, Consideration, Purchase Decision. In addtion, this PPT design contains high resolution images, graphics, etc, that are easily editable and available for immediate download.
Success Metrics For Data Analytics Speculation Business Analysis Modification Toolkit Icons PDF
This slide shows the key success factors for evaluating the success of data analytics program. The foremost key metrics includes discovery, insights, outcomes and actions.Presenting Success Metrics For Data Analytics Speculation Business Analysis Modification Toolkit Icons PDF to provide visual cues and insights. Share and navigate important information on four stages that need your due attention. This template can be used to pitch topics like Observations Information, Generate Insights, Keys Success. In addtion, this PPT design contains high resolution images, graphics, etc, that are easily editable and available for immediate download.
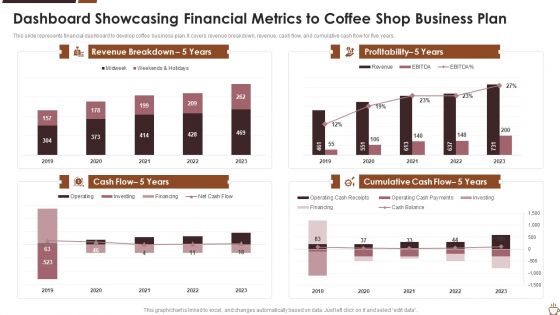
Dashboard Showcasing Financial Metrics To Coffee Shop Business Plan Background PDF
This slide represents financial dashboard to develop coffee business plan. It covers revenue breakdown, revenue, cash flow, and cumulative cash flow for five years. Showcasing this set of slides titled dashboard showcasing financial metrics to coffee shop business plan background pdf. The topics addressed in these templates are dashboard showcasing financial metrics to coffee shop business plan. All the content presented in this PPT design is completely editable. Download it and make adjustments in color, background, font etc. as per your unique business setting.
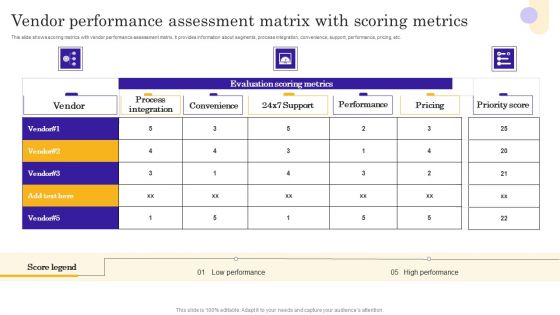
Vendor Performance Assessment Matrix With Scoring Metrics Style PDF
This slide shows scoring metrics with vendor performance assessment matrix. It provides information about segments, process integration, convenience, support, performance, pricing, etc. Pitch your topic with ease and precision using this Vendor Performance Assessment Matrix With Scoring Metrics Style PDF. This layout presents information on Process Integration, Convenience, Performance. It is also available for immediate download and adjustment. So, changes can be made in the color, design, graphics or any other component to create a unique layout.

Metrics That Communicate The Efficiency And Effectiveness Of Business Impacting Services Ppt Ideas Grid PDF
This template covers the set of KPIs that most effectively represent the efficiency and effectiveness business contribution of the documented business impacting services, apps, or projects. Presenting metrics that communicate the efficiency and effectiveness of business impacting services ppt ideas grid pdf to provide visual cues and insights. Share and navigate important information on four stages that need your due attention. This template can be used to pitch topics like service level, application, revenue, cost efficiency, risk. In addtion, this PPT design contains high resolution images, graphics, etc, that are easily editable and available for immediate download.
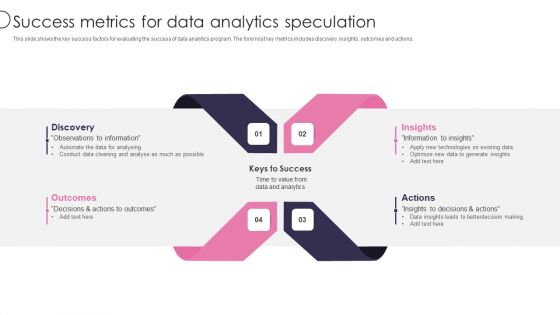
Information Transformation Process Toolkit Success Metrics For Data Analytics Speculation Designs PDF
This slide shows the key success factors for evaluating the success of data analytics program. The foremost key metrics includes discovery, insights, outcomes and actions. Presenting Information Transformation Process Toolkit Success Metrics For Data Analytics Speculation Designs PDF to provide visual cues and insights. Share and navigate important information on four stages that need your due attention. This template can be used to pitch topics like Keys To Success, Insights, Discovery, Outcomes. In addtion, this PPT design contains high resolution images, graphics, etc, that are easily editable and available for immediate download.
Social Media Monitoring Metrics Ppt PowerPoint Presentation Summary Design Ideas Cpb
This is a social media monitoring metrics ppt powerpoint presentation summary design ideas cpb. This is a two stage process. The stages in this process are social media monitoring metrics.
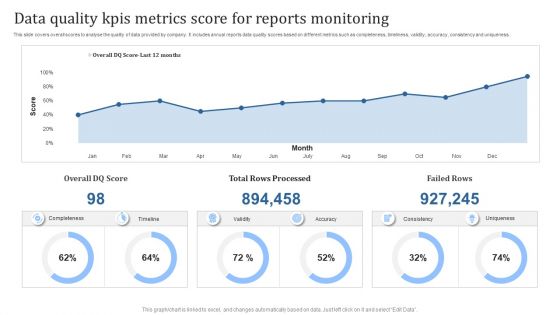
Data Quality Kpis Metrics Score For Reports Monitoring Download PDF
This slide covers overall scores to analyse the quality of data provided by company. It includes annual reports data quality scores based on different metrics such as completeness, timeliness, validity, accuracy, consistency and uniqueness. Showcasing this set of slides titled Data Quality Kpis Metrics Score For Reports Monitoring Download PDF. The topics addressed in these templates are Total Rows Processed, Failed Rows. All the content presented in this PPT design is completely editable. Download it and make adjustments in color, background, font etc. as per your unique business setting.
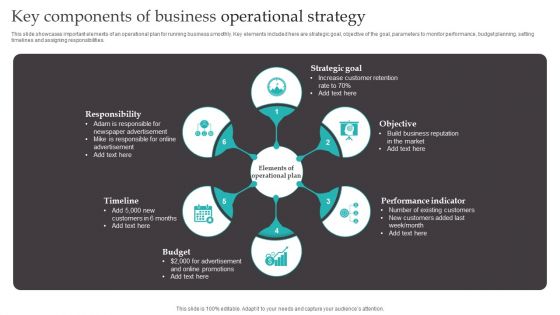
Key Components Of Business Operational Strategy Demonstration PDF
This slide showcases important elements of an operational plan for running business smoothly. Key elements included here are strategic goal, objective of the goal, parameters to monitor performance, budget planning, setting timelines and assigning responsibilities. Persuade your audience using this Key Components Of Business Operational Strategy Demonstration PDF. This PPT design covers six stages, thus making it a great tool to use. It also caters to a variety of topics including Strategic Goal, Objective, Performance Indicator. Download this PPT design now to present a convincing pitch that not only emphasizes the topic but also showcases your presentation skills.
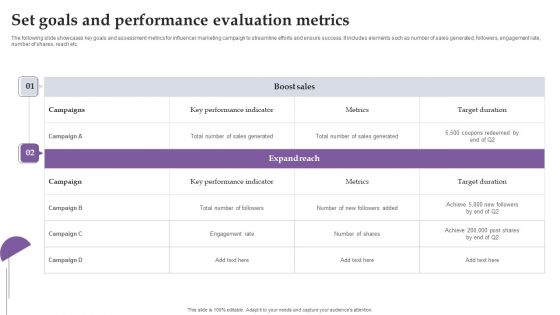
Set Goals And Performance Evaluation Metrics Ppt Professional Master Slide
The following slide showcases key goals and assessment metrics for influencer marketing campaign to streamline efforts and ensure success. It includes elements such as number of sales generated, followers, engagement rate, number of shares, reach etc. Do you have an important presentation coming up Are you looking for something that will make your presentation stand out from the rest Look no further than Set Goals And Performance Evaluation Metrics Ppt Professional Master Slide. With our professional designs, you can trust that your presentation will pop and make delivering it a smooth process. And with Slidegeeks, you can trust that your presentation will be unique and memorable. So why wait Grab Set Goals And Performance Evaluation Metrics Ppt Professional Master Slide today and make your presentation stand out from the rest
Dashboard Tracking Warehouse Capacity And Utilization Metrics Icons PDF
This slide represents a dashboard providing an enterprise-level view of warehouse capacity and utilization to enable process improvements. It monitors KPIs such as shelf capacity used by inventory type, storage device, honeycomb percentage, days on hand by inventory type, and by items. Create an editable Dashboard Tracking Warehouse Capacity And Utilization Metrics Icons PDF that communicates your idea and engages your audience. Whether you are presenting a business or an educational presentation, pre-designed presentation templates help save time. Dashboard Tracking Warehouse Capacity And Utilization Metrics Icons PDF is highly customizable and very easy to edit, covering many different styles from creative to business presentations. Slidegeeks has creative team members who have crafted amazing templates. So, go and get them without any delay.
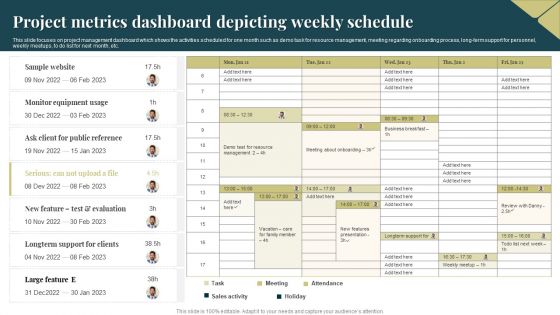
Project Metrics Dashboard Depicting Weekly Schedule Graphics PDF
This slide focuses on project management dashboard which shows the activities scheduled for one month such as demo task for resource management, meeting regarding onboarding process, long term support for personnel, weekly meetups, to do list for next month, etc. Showcasing this set of slides titled Project Metrics Dashboard Depicting Weekly Schedule Graphics PDF. The topics addressed in these templates are Equipment, Sales Activity, Resource. All the content presented in this PPT design is completely editable. Download it and make adjustments in color, background, font etc. as per your unique business setting.
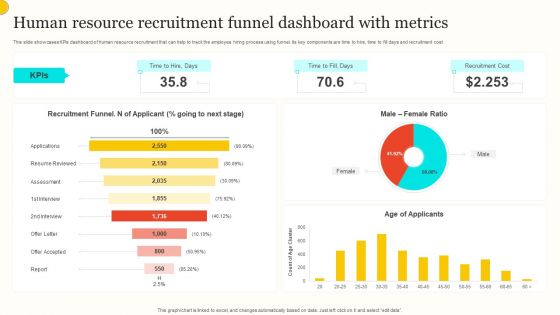
Human Resource Recruitment Funnel Dashboard With Metrics Summary PDF
This slide showcases KPIs dashboard of human resource recruitment that can help to track the employee hiring process using funnel. Its key components are time to hire, time to fill days and recruitment cost. Showcasing this set of slides titled Human Resource Recruitment Funnel Dashboard With Metrics Summary PDF. The topics addressed in these templates are Recruitment Funnel, Male Female Ratio, Age Applicants. All the content presented in this PPT design is completely editable. Download it and make adjustments in color, background, font etc. as per your unique business setting.

Account Payable Metrics To Quantify Performance Of Invoice Process Management Designs PDF
This slide showcases various KPIs to measure performance of invoice process in organization to increase its efficiency. It includes key components such as processing time, cost, exception rate, working capital, discount captured, etc. Presenting Account Payable Metrics To Quantify Performance Of Invoice Process Management Designs PDF to dispense important information. This template comprises six stages. It also presents valuable insights into the topics including Invoice Processing Time, Cost to Process, Exception Rate, Working Capital. This is a completely customizable PowerPoint theme that can be put to use immediately. So, download it and address the topic impactfully.
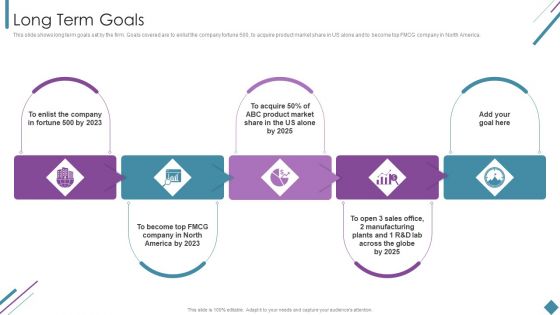
Metrics To Measure Business Performance Long Term Goals Ppt Gallery Templates PDF
This slide shows long term goals set by the firm. Goals covered are to enlist the company fortune 500, to acquire product market share in US alone and to become top FMCG company in North America. Presenting Metrics To Measure Business Performance Long Term Goals Ppt Gallery Templates PDF to provide visual cues and insights. Share and navigate important information on five stages that need your due attention. This template can be used to pitch topics like Product Market, Sales Office, Goal. In addtion, this PPT design contains high resolution images, graphics, etc, that are easily editable and available for immediate download.
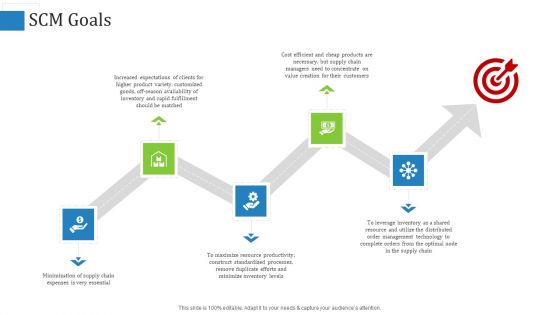
Supply Chain Management Operational Metrics SCM Goals Background PDF
Presenting supply chain management operational metrics SCM goals background pdf. to provide visual cues and insights. Share and navigate important information on five stages that need your due attention. This template can be used to pitch topics like minimization of supply chain expenses is very essential, standardized processes. In addtion, this PPT design contains high resolution images, graphics, etc, that are easily editable and available for immediate download.
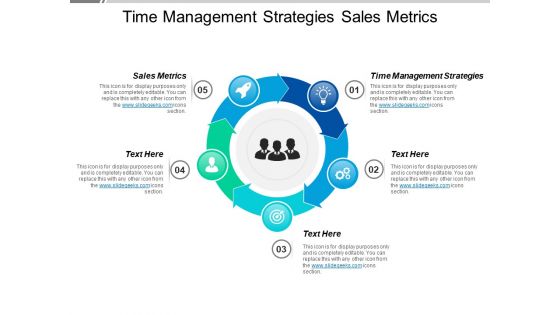
Time Management Strategies Sales Metrics Ppt PowerPoint Presentation Summary Designs Download
This is a time management strategies sales metrics ppt powerpoint presentation summary designs download. This is a five stage process. The stages in this process are time management strategies, sales metrics.

Business Strategy Template Ppt PowerPoint Presentation Infographic Template Graphics Design
This is a business strategy template ppt powerpoint presentation infographic template graphics design. This is a four stage process. The stages in this process are purpose, key objectives, initiatives, key performance indicators.

Security Risk Analysis Model With Metrics Ppt PowerPoint Presentation Outline Designs PDF
Persuade your audience using this security risk analysis model with metrics ppt powerpoint presentation outline designs pdf. This PPT design covers three stages, thus making it a great tool to use. It also caters to a variety of topics including automated discovery, define system relationships, automated asset classification. Download this PPT design now to present a convincing pitch that not only emphasizes the topic but also showcases your presentation skills.
5 Boxes For Campaign Kpis And Metrics Good Ppt PowerPoint Presentation Designs
This is a 5 boxes for campaign kpis and metrics good ppt powerpoint presentation designs. This is a five stage process. The stages in this process are business, marketing, icons, metrics, strategy.

Comprehensive Guide For Enhancing Performance Of Customer Service Center Evaluate Performance Mockup PDF
This slide highlights call center key performance indicators which can be used to evaluate organization and employee performance which includes service level, response time, abandonment rate, quality monitoring scores, customer satisfaction and first call resolution. This Comprehensive Guide For Enhancing Performance Of Customer Service Center Evaluate Performance Mockup PDF is perfect for any presentation, be it in front of clients or colleagues. It is a versatile and stylish solution for organizing your meetings. The Comprehensive Guide For Enhancing Performance Of Customer Service Center Evaluate Performance Mockup PDF features a modern design for your presentation meetings. The adjustable and customizable slides provide unlimited possibilities for acing up your presentation. Slidegeeks has done all the homework before launching the product for you. So, do not wait, grab the presentation templates today

Business Commodity Market KPIS Cost For Product Marketing Metrics Proposal Graphics PDF
Presenting this set of slides with name business commodity market kpis cost for product marketing metrics proposal graphics pdf. This is a one stage process. The stages in this process are marketing, optimization, design, website content, email marketing. This is a completely editable PowerPoint presentation and is available for immediate download. Download now and impress your audience.
Important Call Performance Metrics Track Ppt PowerPoint Presentation Outline Design Templates Cpb
Presenting this set of slides with name important call performance metrics track ppt powerpoint presentation outline design templates cpb. This is an editable Powerpoint six stages graphic that deals with topics like important call performance metrics track to help convey your message better graphically. This product is a premium product available for immediate download and is 100 percent editable in Powerpoint. Download this now and use it in your presentations to impress your audience.
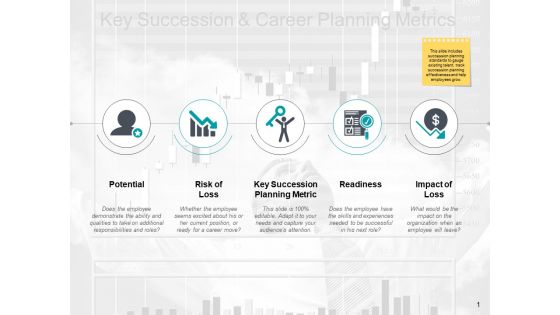
Key Succession And Career Planning Metrics Ppt PowerPoint Presentation File Graphics Design
This is a key succession and career planning metrics ppt powerpoint presentation file graphics design. This is a two stage process. The stages in this process are marketing, business, management, planning, strategy.

Manufacturing Operations Management Process Manufacturing Performance Analysis Inspiration PDF
This slide represents manufacturing performance analysis with key strategies to improve production indicators. It includes production rate, product quality, downtime, scrap rate, etc. Retrieve professionally designed Manufacturing Operations Management Process Manufacturing Performance Analysis Inspiration PDF to effectively convey your message and captivate your listeners. Save time by selecting pre made slideshows that are appropriate for various topics, from business to educational purposes. These themes come in many different styles, from creative to corporate, and all of them are easily adjustable and can be edited quickly. Access them as PowerPoint templates or as Google Slides themes. You do not have to go on a hunt for the perfect presentation because Slidegeeks got you covered from everywhere.

API Integration Software Development Aligning API Design With Target Metrics Topics PDF
Presenting this set of slides with name api integration software development aligning api design with target metrics topics pdf. This is a four stage process. The stages in this process are link with customers, better experiences for developers and end users, more security. This is a completely editable PowerPoint presentation and is available for immediate download. Download now and impress your audience.

Boosting Yearly Business Revenue Quarterly Sales Goals With Key Metrics Demonstration PDF
This slide can be used by sales managers to represents sales goals per quarter using various metrics. It includes metrics such as sales growth, customer acquisition cost, sales cycle length, customer churn rate, average revenue per unit, etc. Do you have an important presentation coming up Are you looking for something that will make your presentation stand out from the rest Look no further than Boosting Yearly Business Revenue Quarterly Sales Goals With Key Metrics Demonstration PDF. With our professional designs, you can trust that your presentation will pop and make delivering it a smooth process. And with Slidegeeks, you can trust that your presentation will be unique and memorable. So why wait Grab Boosting Yearly Business Revenue Quarterly Sales Goals With Key Metrics Demonstration PDF today and make your presentation stand out from the rest.

Operational Performance Metrics Customer Support Tickets Ppt PowerPoint Presentation Outline Graphics Design
This is a operational performance metrics customer support tickets ppt powerpoint presentation outline graphics design. This is a four stage process. The stages in this process are customer support tickets, percentage of product defects, lob efficiency measure, process downtime level.

Diversity And Inclusion Strategy With Metric To Improve Business Performance Information PDF
This slide showcases diversity and inclusion strategy with KPIs which help businesses understand causality, find success factors and study potential outcomes. It provides information regarding diversity, recruitment , innovation and expectations of internal and external customers. Pitch your topic with ease and precision using this Diversity And Inclusion Strategy With Metric To Improve Business Performance Information PDF. This layout presents information on Stakeholders, Customer, Business Processes. It is also available for immediate download and adjustment. So, changes can be made in the color, design, graphics or any other component to create a unique layout.
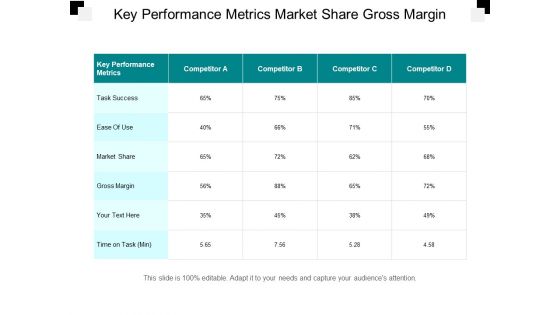
Key Performance Metrics Market Share Gross Margin Ppt PowerPoint Presentation File Design Inspiration
This is a key performance metrics market share gross margin ppt powerpoint presentation file design inspiration. This is a five stage process. The stages in this process are competitive analysis, benchmark competition, competition landscape.
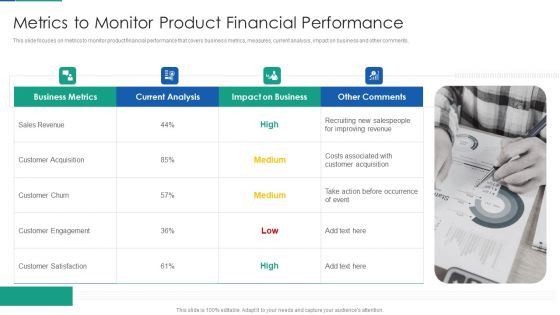
Agile Product Life Process Management Metrics To Monitor Product Financial Performance Ideas PDF
This slide focuses on metrics to monitor product financial performance that covers business metrics, measures, current analysis, impact on business and other comments. Presenting agile product life process management metrics to monitor product financial performance ideas pdf to provide visual cues and insights. Share and navigate important information on four stages that need your due attention. This template can be used to pitch topics like metrics to monitor product financial performance . In addtion, this PPT design contains high resolution images, graphics, etc, that are easily editable and available for immediate download.
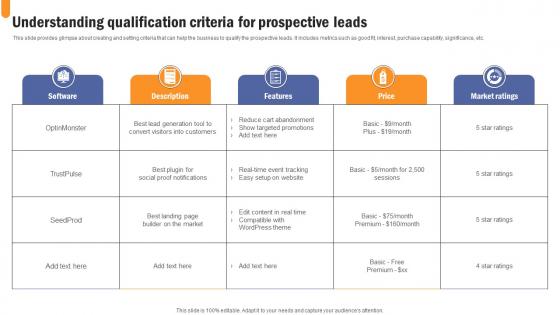
Understanding Qualification Criteria Developing Extensive Sales And Operations Strategy Ideas Pdf
This slide provides glimpse about creating and setting criteria that can help the business to qualify the prospective leads. It includes metrics such as good fit, interest, purchase capability, significance, etc. Present like a pro with Understanding Qualification Criteria Developing Extensive Sales And Operations Strategy Ideas Pdf Create beautiful presentations together with your team, using our easy to use presentation slides. Share your ideas in real time and make changes on the fly by downloading our templates. So whether you are in the office, on the go, or in a remote location, you can stay in sync with your team and present your ideas with confidence. With Slidegeeks presentation got a whole lot easier. Grab these presentations today.

 Home
Home