AI PPT Maker
Templates
PPT Bundles
Design Services
Business PPTs
Business Plan
Management
Strategy
Introduction PPT
Roadmap
Self Introduction
Timelines
Process
Marketing
Agenda
Technology
Medical
Startup Business Plan
Cyber Security
Dashboards
SWOT
Proposals
Education
Pitch Deck
Digital Marketing
KPIs
Project Management
Product Management
Artificial Intelligence
Target Market
Communication
Supply Chain
Google Slides
Research Services
 One Pagers
All Categories
-
Home
- Customer Favorites
- Data Icon
Data Icon

Business Diagram Four Staged Arrows With Different Graphics Of Communication Concept Presentation Te
Four staged arrow with different graphics has been used to craft this power point template. This PPT diagram contains the concept of data communication. Use this PPT for business and technology related presentations.

Information Technology Disaster Resilience Plan Phase 4 Setting Up The Recovery Goals Infographics PDF
This slide defines the fourth stage of a DR plan, which is setting up the recovery goals and prioritizing data based on its business value.Deliver and pitch your topic in the best possible manner with this Information Technology Disaster Resilience Plan Phase 4 Setting Up The Recovery Goals Infographics PDF. Use them to share invaluable insights on Data Recovery, Disruptive Event, System Back and impress your audience. This template can be altered and modified as per your expectations. So, grab it now.
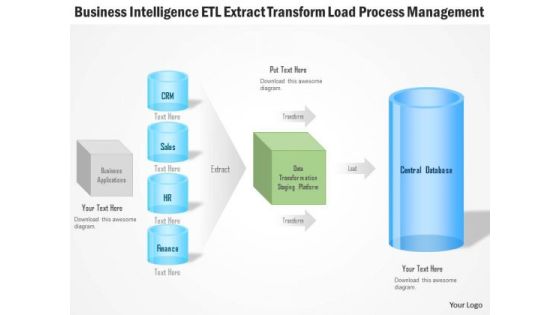
Business Diagram Business Intelligence Etl Extract Transform Load Process Management Ppt Slide
Explain the load process management and ETL extract transform with this unique PPT. This PPT contains the graphic of computer server and data base with connectivity. This PPT can be used for business intelligence related topics in any presentation.
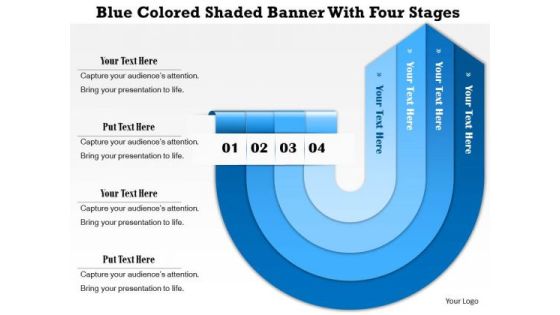
Business Diagram Blue Colored Shaded Banner With Four Stages Presentation Template
Blue colored twisted arrows are used to design this business diagram. These arrows are in banner style with four stages. Use this amazing slide for your data representation in effective manner. Build a unique presentation for your viewers

Business Diagram Red Umbrella Under The Magnifier For Search Presentation Template
Graphic of red umbrella and magnifier has been used to craft this PPT diagram. This PPT contains the concept of search. Use this PPT for data and business related presentations.

Sample Of Three Types Of Internet Of Things Diagram Ppt Slides
This is a sample of three types of internet of things diagram ppt slides. This is a three stage process. The stages in this process are things with networked sensors, analytic engines, data storage.
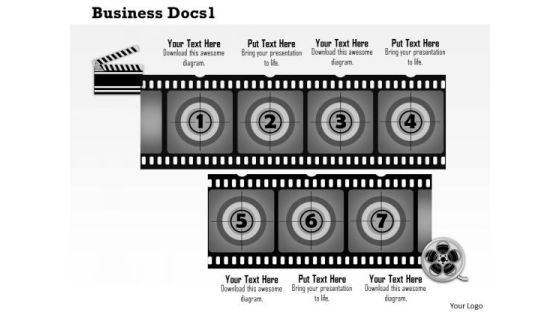
Business Framework Business Docs1 PowerPoint Presentation
Four text boxes with traffic lights are used to decorate this Power Point template slide. This PPT slide contains the concept of data representation. This PPT can be used for business and marketing presentations.

Clustered Column Professional PDF
Deliver an awe inspiring pitch with this creative clustered column professional pdf bundle. Topics like product, data can be discussed with this completely editable template. It is available for immediate download depending on the needs and requirements of the user.
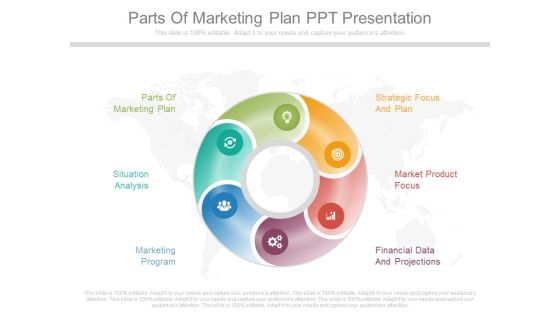
Parts Of Marketing Plan Ppt Presentation
This is a parts of marketing plan ppt presentation. This is a six stage process. The stages in this process are parts of marketing plan, strategic focus and plan, situation analysis, market product focus, marketing program, financial data and projections.

Bars Displaying Percentage Growth PowerPoint Templates
Our above PPT slide contains bar graph displaying percentage growth. This diagram of bar graph helps to depict statistical information. Use this diagram to impart more clarity to data and to create more sound impact on viewers.

Four Horizontal Text Banners Powerpoint Template
This PowerPoint template has been designed with four horizontal text banners. This diagram is excellent visual tools for business presentations. Download this PPT slide to explain complex data immediately and clearly.

Business Framework Put Option Long PowerPoint Presentation
Our above diagram helps to represent data graphically. Use this put option long diagram for stock market related topics. This diagram has area for your own text to assist you get your point across.

Research Business Intelligence Ppt Powerpoint Templates
This is a research business intelligence ppt powerpoint templates. This is a seven stage process. The stages in this process are data warehousing, reporting, analytics, datamining, qap, epr, benchmarking.
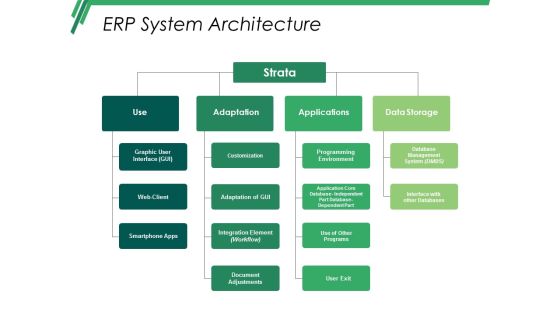
Erp System Architecture Ppt PowerPoint Presentation Pictures Master Slide
This is a erp system architecture ppt powerpoint presentation pictures master slide. This is a four stage process. The stages in this process are use, strata, adaptation, applications, data storage.

Pyramid For Financial Accounting Information Powerpoint Slides
This PowerPoint template has been designed with graphics of pyramid chart. This PPT slide can be used to prepare presentations for profit growth report and also for financial data analysis. You can download finance PowerPoint template to prepare awesome presentations.

Gear Infographic For Business Analysis PowerPoint Templates
Our above slide contains diagram of gear infographic. This gear infographic slide helps to exhibit business analysis. Use this diagram to impart more clarity to data and to create more sound impact on viewers.

Board With Bar Graph For Financial Analysis Powerpoint Slides
You can download this PowerPoint template to display statistical data and analysis. This PPT slide contains display board with bar graph. Draw an innovative business idea using this professional diagram.

Investment Crowdfunding Ppt PowerPoint Presentation Complete Deck With Slides
This is a investment crowdfunding ppt powerpoint presentation complete deck with slides. This is a one stage process. The stages in this process are business, tables, growth, success, data analysis.
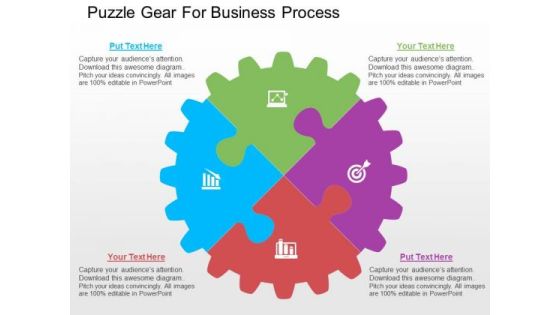
Puzzle Gear For Business Process PowerPoint Templates
Our above PPT slide contains circular gear puzzle diagram. This puzzle gear circular diagram helps to exhibit process planning and solutions. Use this diagram to impart more clarity to data and to create more sound impact on viewers.
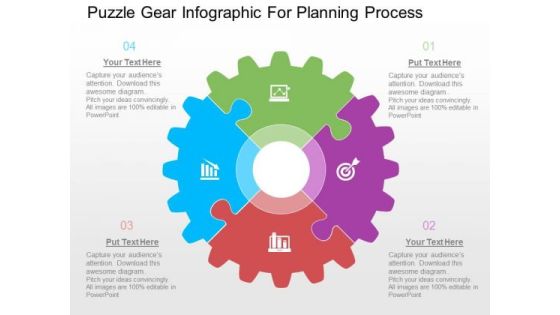
Puzzle Gear Infographic For Planning Process PowerPoint Templates
Our above PPT slide contains circular gear puzzle diagram. This puzzle gear circular diagram helps to exhibit process planning and solutions. Use this diagram to impart more clarity to data and to create more sound impact on viewers.

Stock Photo Golden Dollar Symbol With Pie Graph PowerPoint Slide
This Power Point template has been crafted with graphic of golden dollar symbol and pie chart on a tablet. Display the concept of financial data analysis with this image. Use this image to present financial reports in business presentations.
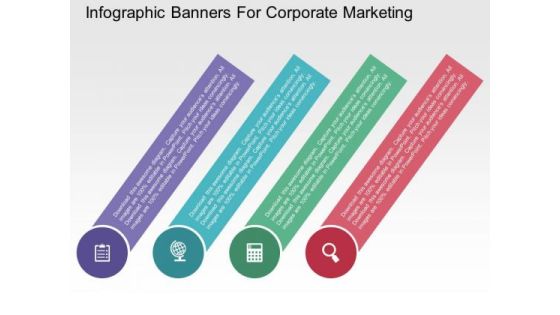
Infographic Banners For Corporate Marketing PowerPoint Templates
Our above PPT slide contains diagram of infographic banners. It helps to display steps of corporate marketing. Use this diagram to impart more clarity to data and to create more sound impact on viewers.

Business Men On Gears Towards Success Trophy Powerpoint Templates
Our above slide contains diagram of business men on gears towards success trophy. It helps to exhibit strategy process and competition. Use this diagram to impart more clarity to data and to create more sound impact on viewers.

Illustration Of Save Money Concept Powerpoint Templates
This business slide has been designed with infographic square. These text boxes can be used for data representation. Use this diagram for your business presentations. Build a quality presentation for your viewers with this unique diagram.

Circles With Percentage Values Powerpoint Templates
This PowerPoint template displays circles with percentage values. This business diagram is suitable for financial data analysis. Use this business diagram slide to highlight the key issues of your presentation.

Four Tags For Strategy Planning Process Powerpoint Template
Steps for strategy planning can be explained with this diagram. This PowerPoint template contains diagram of four infographic tags. You can also use this design for data analysis in business presentations

Four Steps Circular Infographic Powerpoint Templates
Our above slide contains diagram of three stage circular infographic. It helps to display global business analysis. Use this diagram to impart more clarity to data and to create more sound impact on viewers.

Arrows Infographic For Strategic Management Concept Powerpoint Template
Our above PPT slide contains four curved arrows infographic design. This business diagram helps to depict business information for strategic management. Use this diagram to impart more clarity to data and to create more sound impact on viewers.

Team With Bar Graph And Teamwork
This Power Point template has been designed with graphic of 3d team forming a pie chart. In this slide team is displaying data analysis and comparison. Use this editable slide to build innovative presentation for your viewers.

Colorful Circle Arrow Design Powerpoint Template
Our above PPT slide contains circular arrow design. This business diagram helps to exhibit process flow. Use this diagram to impart more clarity to data and to create more sound impact on viewers.
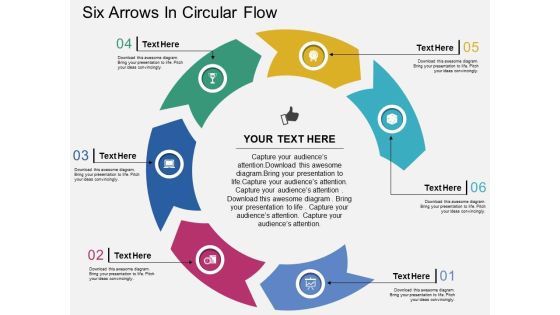
Six Arrows In Circular Flow Powerpoint Templates
Our above PPT slide contains graphics of circular diagram. This business diagram helps to display outline of business plan. Use this template to impart more clarity to data and to create more sound impact on viewers.
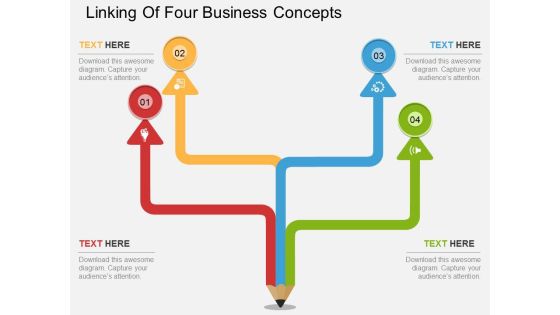
Linking Of Four Business Concepts Powerpoint Template
This PowerPoint template has been designed with four steps pencil diagram. This diagram is excellent visual tools to present link of steps. Download this PPT slide to explain complex data immediately and clearly.
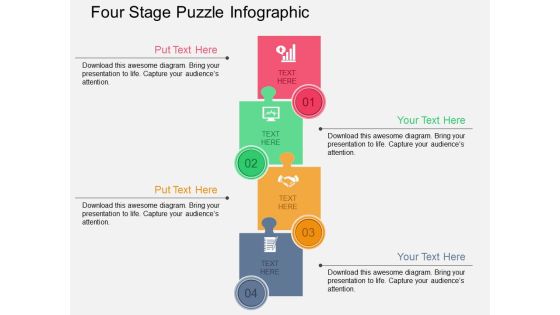
Four Stage Puzzle Infographic Powerpoint Templates
Our above slide contains diagram of puzzles infographic. It helps to exhibit business management and strategies. Use this diagram to impart more clarity to data and to create more sound impact on viewers.
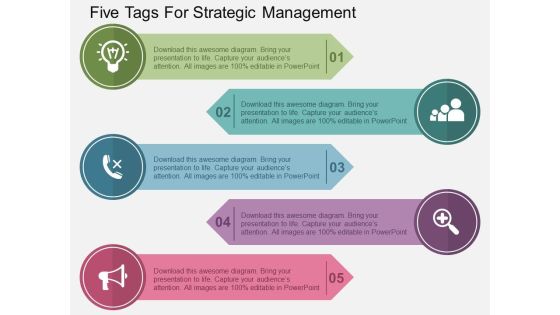
Five Tags For Strategic Management Powerpoint Templates
Our above slide contains diagram of circular infographic. It helps to exhibit six steps of goal planning. Use this diagram to impart more clarity to data and to create more sound impact on viewers.

PowerPoint Designs Process Chart Strategy Ppt Slide
PowerPoint Designs process Chart Strategy PPT Slide-This Process Chart can be used as data flow diagram to show the flow of the data as it moves from beginning process to end result.-3d, arrow, art, business, chart, circle, concept, connection, cycle, development, diagram, direction, element, environment, finance, financial, flow, graphic, group, investment, isolated, market,, movement, organization, passive income, perspective, presentation, process chart, recycle, report, sign, step, success, symbol, teamwork-PowerPoint Designs process Chart Strategy PPT Slide

Dashboard With Increasing Values Powerpoint Slides
This innovative, stunningly beautiful dashboard has been designed for data visualization. It contains pie charts with increasing percentage values. This PowerPoint template helps to display your information in a useful, simple and uncluttered way.

Four Options Zigzag Infographics Powerpoint Template
Emphatically define your message with our above template which contains four options zigzag infographic. This business diagram may be used to plot data series. Deliver amazing presentations to mesmerize your audience.

Arrow In Labyrinth Moving Towards Year 2016 Powerpoint Templates
Our above slide contains graphics of labyrinth with arrow on 2016 and globe. It helps to display concept of global business strategy. Use this diagram to impart more clarity to data and to create more sound impact on viewers.
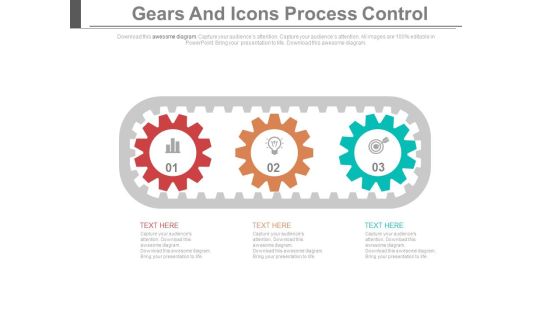
Three Gears Steps For Innovative Process Powerpoint Template
This PowerPoint slide contains graphics of three gears steps. It helps to exhibit innovative process steps. Use this diagram to impart more clarity to data and to create more sound impact on viewers.

Leader With Team And Unique Idea Powerpoint Template
Our above slide contains graphics of leader with team holding idea bulb. This PowerPoint template helps to display teamwork and unique idea. Use this diagram to impart more clarity to data and to create more sound impact on viewers.

Cylinder With Four Corporate Marketing Steps Powerpoint Template
Our above slide contains graphics of cylinder with four text tags. It may be used to display marketing steps. Use this diagram to impart more clarity to data and to create more sound impact on viewers.

Arrows With Circles And Idea Bulb Powerpoint Template
Our above slide contains graphics of arrows with circles and idea bulb. It helps to display innovative ideas. Use this diagram to impart more clarity to data and to create more sound impact on viewers.

Profit Growth Graph With Gears Powerpoint Template
This business slide contains profit growth graph with gears. This PowerPoint template helps to display outline of business plan. Use this diagram to impart more clarity to data and to create more sound impact on viewers.

Bar Graph For Marketing Research Process Powerpoint Slides
This PowerPoint template has been designed with diagram of bar graph. This PPT slide can be used to prepare presentations for profit growth report and also for financial data analysis. You can download finance PowerPoint template to prepare awesome presentations.

PowerPoint Slide Sales Business Process Ppt Layouts
This Diagram makes information accessible throughout the organization with a collective, visible view of critical data from different perspectives and providing the tools to upcoming business scenarios and plan for change.

Team Pictures With Names And Profile Powerpoint Slides
This PowerPoint template has been designed with team pictures and profile information. This diagram is excellent visual tools to present team profile. Download this PPT slide to explain complex data immediately and clearly.
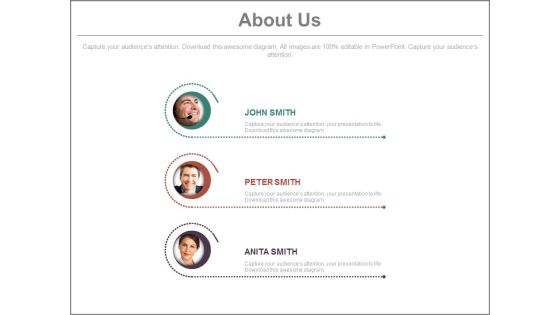
Team Profiles For About Us Slide Powerpoint Slides
This PowerPoint template has been designed with team pictures and profile information. This diagram is excellent visual tools to present team profile. Download this PPT slide to explain complex data immediately and clearly.

Business People Profile For Social Media Powerpoint Slides
This PowerPoint template has been designed with business people profile information. This diagram is excellent visual tools to present team profile with social media. Download this PPT slide to explain complex data immediately and clearly.

PowerPoint Design Gear Process Company Ppt Template
PowerPoint Design Gear Process Company PPT Template-This PowerPoint diagram shows three gears that represent three processes. You can add data depending on the number of processes you want to include in your presentation.-PowerPoint Design Gear Process Company PPT Template
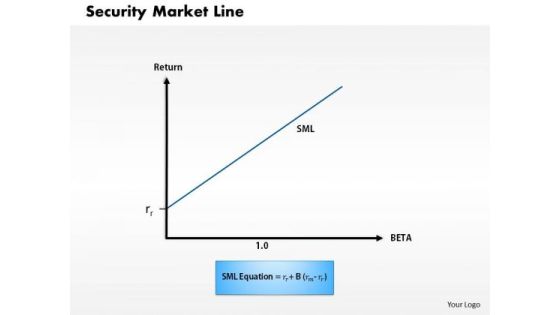
Business Framework Security Market Line 1 PowerPoint Presentation
This diagram displays graph of security market line. You can use line graph to plot changes in data over time, such as monthly revenue and earnings changes or daily changes in stock market prices.

Business Framework Security Market Line 11 PowerPoint Presentation
This diagram displays graph of security market line. You can use line graph to plot changes in data over time, such as monthly revenue and earnings changes or daily changes in stock market prices.
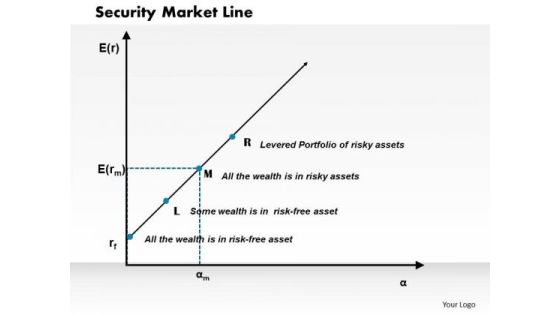
Business Framework Security Market Line PowerPoint Presentation
This diagram displays graph of security market line. You can use line graph to plot changes in data over time, such as monthly revenue and earnings changes or daily changes in stock market prices.
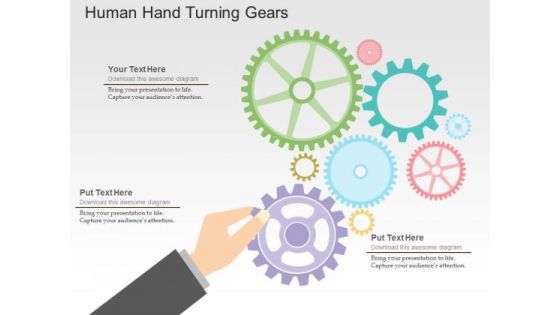
Human Hand Turning Gears PowerPoint Templates
Our above slide contains graphics of human hand turning gears. It helps to display concepts of process control and management. Use this diagram to impart more clarity to data and to create more sound impact on viewers.

Man Climbing On Books With Ladder PowerPoint Templates
Our above slide contains graphics of man climbing on books with help of ladder. It helps to display concept of education and success. Use this diagram to impart more clarity to data and to create more sound impact on viewers.

Diamond Design With Two Levels And Eight Stages Powerpoint Template
Our above slide contains graphics of diamond design with two levels and eight stages. It helps to display concepts in visual manner. Use this diagram to impart more clarity to data and to create more sound impact on viewers.

3D Man Moving Toward Arrow Powerpoint Template
Our above PPT slide contains graphics of 3d man moving towards arrow. This PowerPoint template helps to exhibit finding possible solutions. Use this diagram to impart more clarity to data and to create more sound impact on viewers.
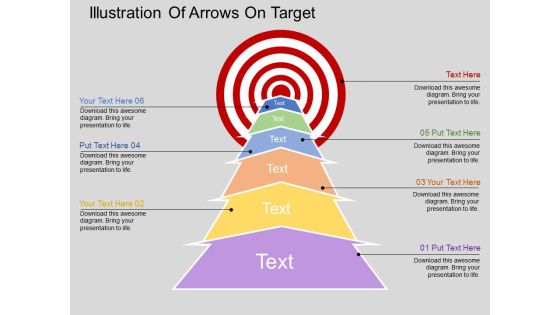
Illustration Of Arrows On Target Powerpoint Templates
Our above slide illustrates arrow steps towards target. This PowerPoint template may be used to exhibit target planning. Use this diagram to impart more clarity to data and to create more sound impact on viewers.

Money Exchange Electronic Transactions Powerpoint Templates
Our above slide contains illustration of money exchange. It helps to display electronic transactions. Use this diagram to impart more clarity to data and to create more sound impact on viewers.

Business Man On Road With Question Mark Powerpoint Template
Our above PPT slide contains road graphics with business man and question mark. It helps to exhibit finding possible solutions. Use this diagram to impart more clarity to data and to create more sound impact on viewers.

Donating Money To Charity Powerpoint Template
Our above slide contains ten staged colorful infographic. It helps to exhibit concepts of charity and donation. Use this diagram to impart more clarity to data and to create more sound impact on viewers.
