AI PPT Maker
Templates
PPT Bundles
Design Services
Business PPTs
Business Plan
Management
Strategy
Introduction PPT
Roadmap
Self Introduction
Timelines
Process
Marketing
Agenda
Technology
Medical
Startup Business Plan
Cyber Security
Dashboards
SWOT
Proposals
Education
Pitch Deck
Digital Marketing
KPIs
Project Management
Product Management
Artificial Intelligence
Target Market
Communication
Supply Chain
Google Slides
Research Services
 One Pagers
All Categories
-
Home
- Customer Favorites
- Data Icon
Data Icon

Circular Diagram Of Cfl Bulbs Powerpoint Templates
This PowerPoint template has been designed with circular diagram of CFL bulbs. It helps to exhibit business strategies and ideas. Use this diagram to impart more clarity to data and to create more sound impact on viewers.
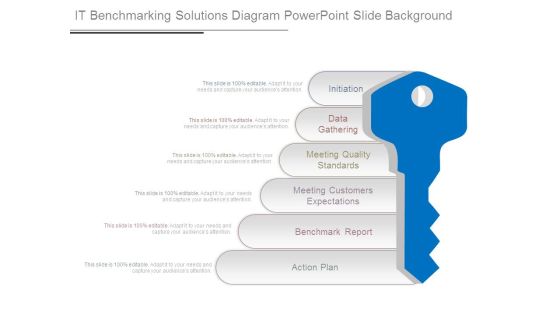
It Benchmarking Solutions Diagram Powerpoint Slide Background
This is a it benchmarking solutions diagram powerpoint slide background. This is a six stage process. The stages in this process are initiation, data gathering, meeting quality standards, meeting customers expectations, benchmark report, action plan.
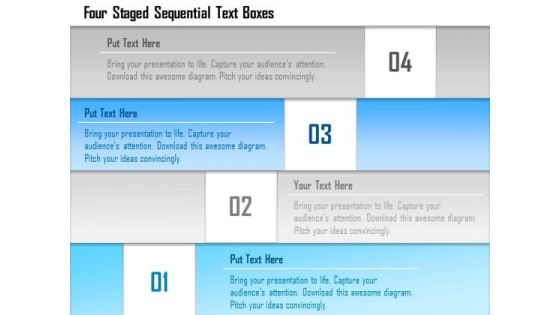
Business Diagram Four Staged Sequential Text Boxes Presentation Template
Four staged sequential stair designed text boxes are used to design this power point template. This PPT contains the concept of data flow. Use this PPT for your business and finance related presentations.

Business Diagram Of Two Text Boxes With Globe Presentation Template
This power point template has been designed with graphic of two text boxes and globe. This PPT contains the concept of global business data representation. Use this PPT for your global business related topics in any presentation.
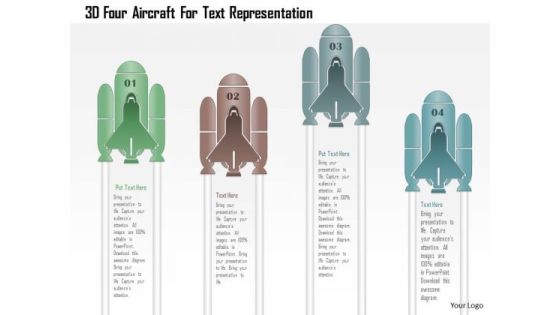
Business Diagram 3d Four Aircraft For Text Representation PowerPoint Template
Graphic of 3d four aircraft text boxes has been used to design this power point template. This PPT slide contains the concept of data flow. Use this PPT slide for business and sales related presentations.
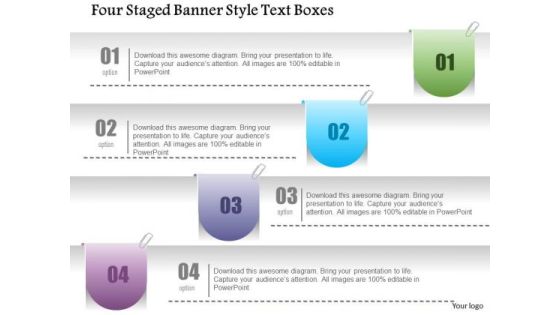
Business Diagram Four Staged Banner Style Text Boxes PowerPoint Template
Four staged banner style text boxes are used to craft this power point template slide. This PPT slide contains the concept of data updating and representation. Use this PPT and crate an impact on your viewers.

Channel Management Reviews Diagram Presentation Backgrounds
This is a channel management reviews diagram presentation backgrounds. This is a six stage process. The stages in this process are channel identification, market and data analysis, trade interviews, result analysis, strategy development, field audits.
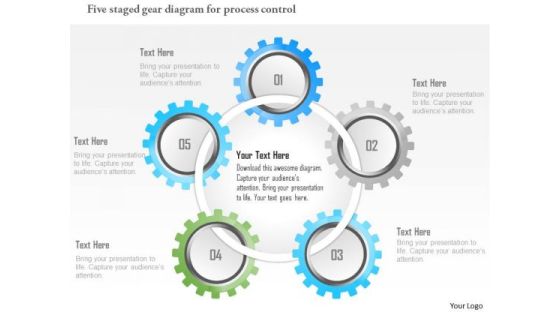
Business Diagram Five Staged Gear Diagram For Process Control Presentation Template
Our above slide displays five staged gear diagram for process control. Download our above diagram to express information in a visual way. Use this diagram and get good comments for data related presentations.
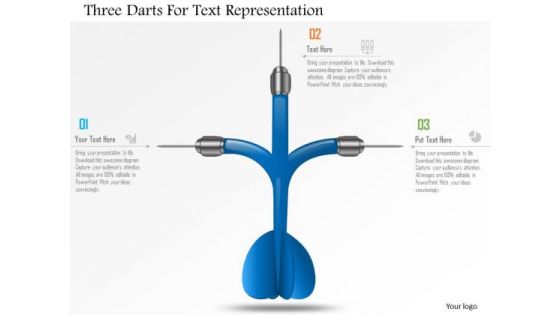
Business Diagram Three Darts For Text Representation Presentation Template
Graphic of three darts has been used to design this power point template. This PPT contains the concept of data representation. Use this PPT and build an exclusive presentation for your viewers.

Business Intelligence Pillar Diagram Powerpoint Presentation
This is a business intelligence pillar diagram powerpoint presentation. This is a three stage process. The stages in this process are business intelligence strategy, business process strategy, data strategy, technology strategy.
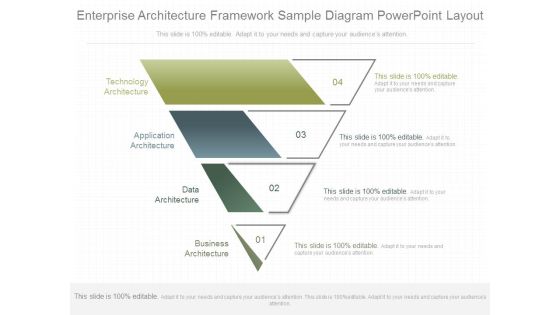
Enterprise Architecture Framework Sample Diagram Powerpoint Layout
This is a enterprise architecture framework sample diagram powerpoint layout. This is a four stage process. The stages in this process are technology architecture, application architecture, data architecture, business architecture.
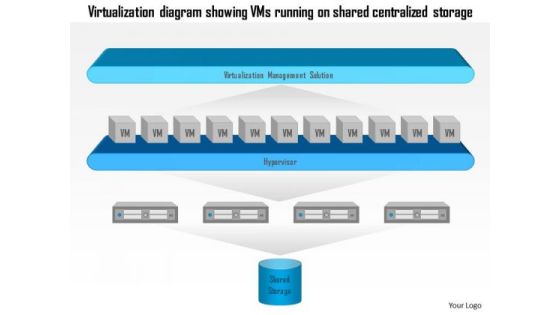
Business Diagram Virtualization Diagram Showing Vms Running On Shared Centralized Storage Ppt Slide
This diagram has been designed with graphic of virtualization diagram. This diagram is representing the VMS running on shared and centralized storage. This diagram may be used for data storage related presentations.

Flower Diagram For Educational Training Powerpoint Template
Colorful flowers have been used to design this PowerPoint diagram. This colorful PPT slide may be used for educational training. You can use this design for data analysis in business presentations

Email Survey Service Diagram Ppt Slide Design
This is a email survey service diagram ppt slide design. This is a four stage process. The stages in this process are design, administration, data collection, report and analysis.

Business Research Process Diagram Ppt Example
This is a business research process diagram ppt example. This is a five stage process. The stages in this process are business issues decision, analysis and reporting, data collection, questionnaire development, research objectives methodology.

Channel Assessment Diagram Ppt Infographic Template
This is a channel assessment diagram ppt infographic template. This is a five stage process. The stages in this process are channel identification, market and data analysis, field audits, trade interviews, strategy development.
Trading Computerized System Diagram Presentation Ideas
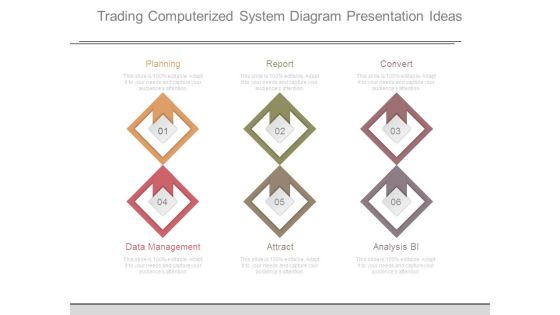
This is a trading computerized system diagram presentation ideas. This is a six stage process. The stages in this process are planning, report, convert, data management, attract, analysis bi.

Continuous Risk Assessment Diagram Powerpoint Slides Templates
This is a continuous risk assessment diagram powerpoint slides templates. This is a eight stage process. The stages in this process are internal audit plan, project planning, data analysis, project reporting, stakeholder reporting, project execution, risk assessment, project reporting.

Energy Administration Flowchart Diagram Presentation Visuals
This is a energy administration flowchart diagram presentation visuals. This is a five stage process. The stages in this process are inventory, measurement, data analysis, assessment of funding, implication.
Global Management Consulting Services Diagram Powerpoint Presentation
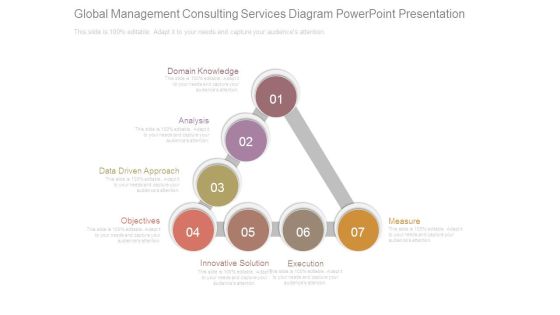
This is a global management consulting services diagram powerpoint presentation. This is a seven stage process. The stages in this process are domain knowledge, analysis, data driven approach, objectives, innovative solution, execution, measure.

Stock Photo Black Brown Pie Chart For Business Result PowerPoint Slide
This high quality image is designed with pie chart. Use this image to make business reports. Use this outstanding image in presentations relating to data analysis and reports. Go ahead and add charm to your presentations.
Stock Photo Colorful 3d Pie Chart For Business Result PowerPoint Slide
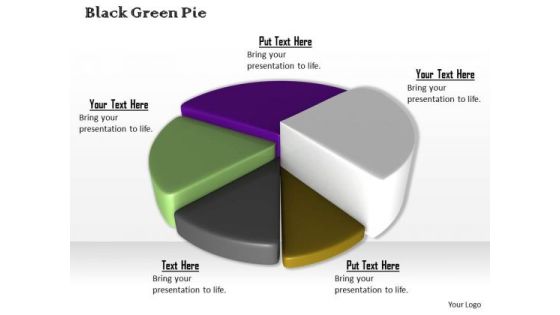
This high quality image is designed with pie chart. Use this image to make business reports. Use this outstanding image in presentations relating to data analysis and reports. Go ahead and add charm to your presentations.

Infographic Diagram With Percentage Values Powerpoint Template
Visually support your presentation with our above template containing infographic diagram with percentage values. This diagram is excellent visual tools for explaining huge amounts of information where complex data needs to be explained immediately and clearly.
Business Diagram Four Staged Gear Process Diagram For Process Flow Presentation Template
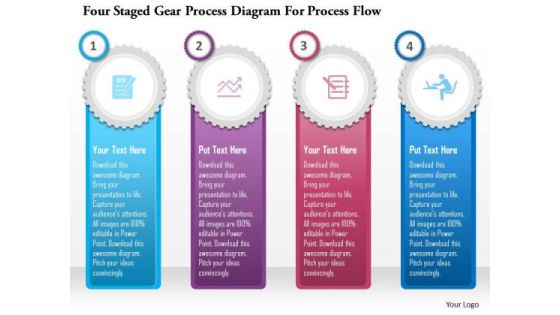
Graphic of four staged gear process diagram has been used to design this power point template diagram. This PPT diagram contains the concept of data and process flow. Use this PPT for marketing and sales related presentations.

Diamond Process Flow Infographic Diagram Powerpoint Template
Our above slide contains diamond process flow infographic diagram. This PowerPoint template helps to display six steps in linear flow. Use this diagram to impart more clarity to data and to create more sound impact on viewers.

3D Arrows Step Process Diagram Powerpoint Template
Our above slide contains graphics of arrows step process diagram. It helps to display innovative ideas. Use this diagram to impart more clarity to data and to create more sound impact on viewers.

Colorful Circle Arrow Diagram Powerpoint Template
Our above PPT slide contains circular arrow design. This business diagram helps to exhibit process flow. Use this diagram to impart more clarity to data and to create more sound impact on viewers.

Colorful Circular Arrows Diagram Powerpoint Template
Our above PPT slide contains circular arrow design. This business diagram helps to exhibit process flow. Use this diagram to impart more clarity to data and to create more sound impact on viewers.

Diagram Of Colorful Circular Arrows Powerpoint Template
Our above PPT slide contains circular arrow design. This business diagram helps to exhibit process flow. Use this diagram to impart more clarity to data and to create more sound impact on viewers.
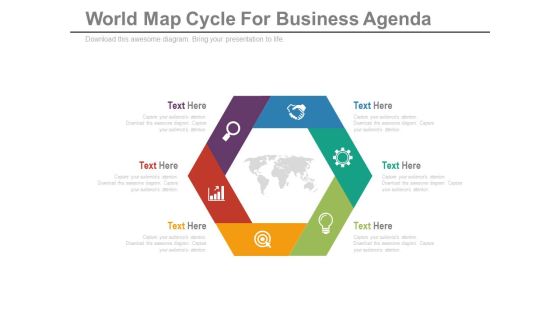
Diagram For Global Business Strategy Powerpoint Template
Our above slide contains hexagonal infographic diagram. This PowerPoint template helps to display global business strategy. Use this diagram to impart more clarity to data and to create more sound impact on viewers.

Business Framework Golden Circle PowerPoint Presentation
This business diagram has been designed with graphic of blue colored circle. This business slide is suitable to display data analysis in any business presentation. Use this slide to build a unique presentations for your viewers

Five Staged Vertical Process Diagram Presentation Template
Five staged vertical process diagram has been used to design this power point template. This PPT contains the concept of dependent data representation. Use this PPT and build presentation for business and marketing related topics.
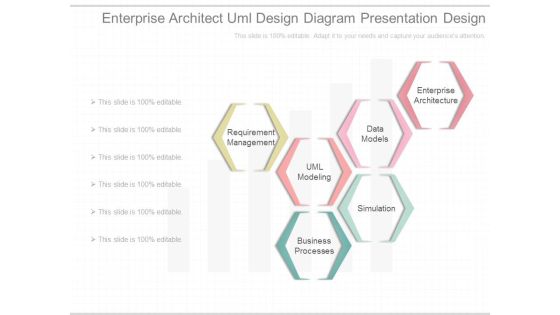
Enterprise Architect Uml Design Diagram Presentation Design
This is a enterprise architect uml design diagram presentation design. This is a six stage process. The stages in this process are requirement management, uml modeling, data models, business processes, simulation, enterprise architecture.

Sample Of Dbms Model Diagram Powerpoint Slides
This is a sample of dbms model diagram powerpoint slides. This is a one stage process. The stages in this process are applications, sql, query processor, buffer manager, disk space and io manage, data files, logs, index structure.

Feasibility Of Project Diagram Presentation Visuals
This is a feasibility of project diagram presentation visuals. This is a four stage process. The stages in this process are scope and define the problem, data gathering and investigation, develop option, recommendation report.

Future Of Ecommerce Diagram Ppt Example File
This is a future of ecommerce diagram ppt example file. This is a six stage process. The stages in this process are responsive design, rich functionalities, social media, omni channel, mobile, data segmentation.
Decision Support System Diagram Presentation Outline
This is a decision support system diagram presentation outline. This is a five stage process. The stages in this process are communication driven dss, data driven dss, document driven dss, knowledge driven dss, model driven dss.
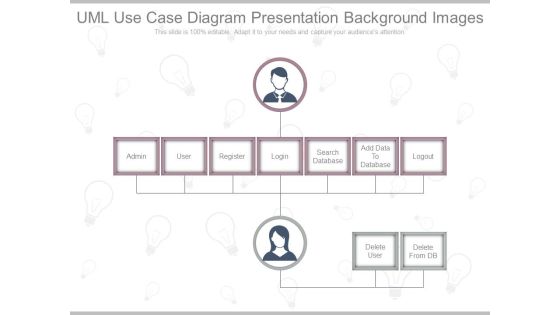
Uml Use Case Diagram Presentation Background Images
This is a uml use case diagram presentation background images. This is a seven stage process. The stages in this process are admin, user, register, login, search database, add data to database, logout.

Web Based Sale Solution Diagram Powerpoint Guide
This is a web based sale solution diagram powerpoint guide. This is a six stage process. The stages in this process are fool proof inventory, real time visibility, increased availability, zero maintenance, easy data administration, secure offline.

Finance Operations Planning Sample Diagram Ppt Example
This is a finance operations planning sample diagram ppt example. This is a six stage process. The stages in this process are consolidation, analytics, corporate, external reporting, business unit, data preparation and transfer, ledger close, management reporting.\n\n\n\n\n\n\n\n\n \n

Database Layout Tool Diagram Presentation Visuals
This is a database layout tool diagram presentation visuals. This is a three stage process. The stages in this process are database concepts, data modeling, database layout tool, database design.\n\n\n\n

Qualitative Market Research Diagram Ppt Presentation
This is a qualitative market research diagram ppt presentation. This is a five stage process. The stages in this process are qualitative, data collection tools, online communities, web survey chat, online forums, focus groups, depth interviews triads dyads.

Investment Research Example Diagram Ppt Example File
This is a investment research example diagram ppt example file. This is a four stage process. The stages in this process are research reports, data and pricing, education, investment tools.

Alternative Workplace Strategy Diagram Ppt Sample
This is a alternative workplace strategy diagram ppt sample. This is a five stage process. The stages in this process are data exploration, develop the strategy, build a business case, develop implement, evaluate and improve.

Digital Marketing Services Sample Diagram Ppt Images
This is a digital marketing services sample diagram ppt images. This is a eight stage process. The stages in this process are data science, display ppc, cro, email, social media, online articles, seo, mobile apps.
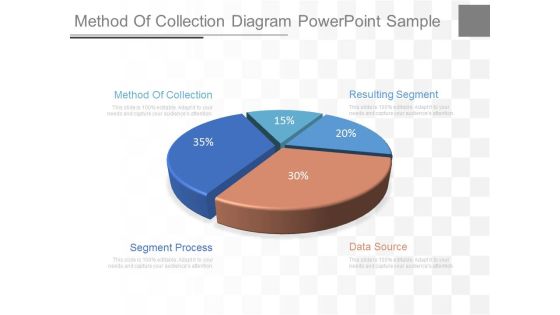
Method Of Collection Diagram Powerpoint Sample
This is a method of collection diagram powerpoint sample. This is a five stage process. The stages in this process are method of collection, segment process, data source, resulting segment.

Architect Design And Solutions Diagram Powerpoint Slides
This is a architect design and solutions diagram powerpoint slides. This is a six stage process. The stages in this process are data safety, efficiently, speed, reliability, convenience, security.

Marketing Operating System Sample Diagram Powerpoint Presentation
This is a marketing operating system sample diagram powerpoint presentation. This is a five stage process. The stages in this process are data management, message delivery, confidentiality, partner management, directory, cross channel media, transformation, analytics and insights, delivery management, authentication.

Asset Management Solutions Sample Diagram Powerpoint Images
This is a asset management solutions sample diagram powerpoint images. This is a eight stage process. The stages in this process are o and m practices, portfolio management, fund valuation, condition assessment, fund portal, organizational models, data management, risk management.
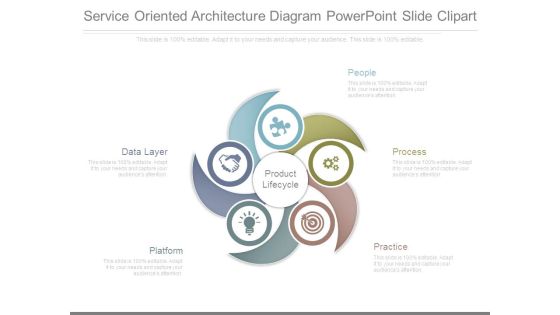
Service Oriented Architecture Diagram Powerpoint Slide Clipart
This is a service oriented architecture diagram powerpoint slide clipart. This is a five stage process. The stages in this process are product lifecycle, data layer, platform, people, process, practice.

Service Quality Management System Diagram Sample File
This is a service quality management system diagram sample file. This is a four stage process. The stages in this process are forma quality, linguistic quality, data security, short reaction time.

Automation Marketing Service Diagram Presentation Visual Aids
This is a automation marketing service diagram presentation visual aids. This is a four stage process. The stages in this process are data archiving, academic software, customer, new business.

Analytics Solutions Diagram Sample Of Ppt Presentation
This is a analytics solutions diagram sample of ppt presentation. This is a four stage process. The stages in this process are analytic applications, analytics, data sources, business intelligence.

Transaction Process Diagram Ppt Images Gallery
This is a transaction process diagram ppt images gallery. This is a five stage process. The stages in this process are data entry, tp batch online, database maintenance, document report generation, inquiry processing.

Business Management Consulting Services Diagram Powerpoint Slide
This is a business management consulting services diagram powerpoint slide. This is a eight stage process. The stages in this process are strategy, business consulting, performance, management, operations, data sciences, organization, enterprise devices.
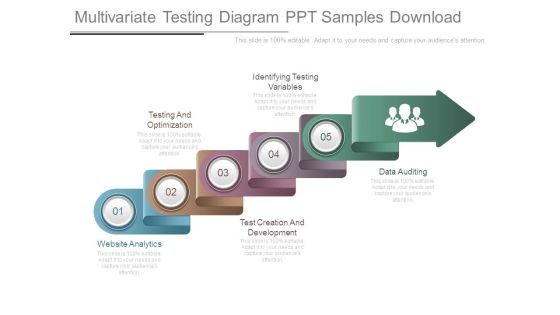
Multivariate Testing Diagram Ppt Samples Download
This is a multivariate testing diagram ppt samples download. This is a five stage process. The stages in this process are website analytics, testing and optimization, test creation and development, identifying testing variables, data auditing.
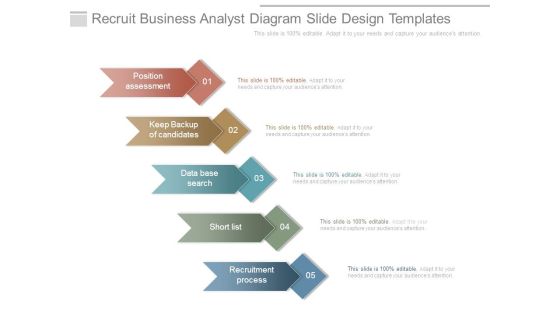
Recruit Business Analyst Diagram Slide Design Templates
This is a recruit business analyst diagram slide design templates. This is a five stage process. The stages in this process are position assessment, keep backup of candidates, data base search, short list, recruitment process.
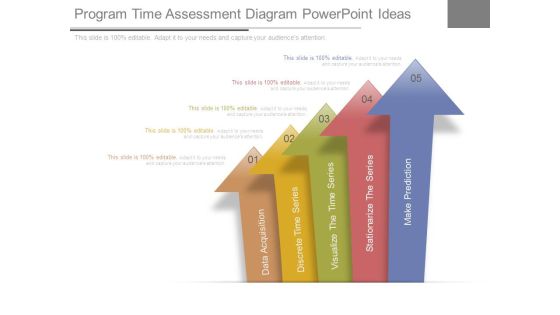
Program Time Assessment Diagram Powerpoint Ideas
This is a program time assessment diagram powerpoint ideas. This is a five stage process. The stages in this process are data acquisition, discrete time series, visualize the time series, stationarize the series, make prediction.

Trends In Sales Diagram Ppt Examples Slides
This is a trends in sales diagram ppt examples slides. This is a five stage process. The stages in this process are event roi, single platform, sales data and analytics, art of follow ups, mobility, trends in sales.
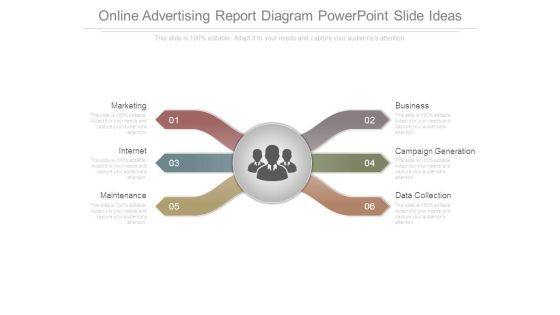
Online Advertising Report Diagram Powerpoint Slide Ideas
This is a online advertising report diagram powerpoint slide ideas. This is a six stage process. The stages in this process are marketing, internet, maintenance, business, campaign generation, data collection.
