AI PPT Maker
Templates
PPT Bundles
Design Services
Business PPTs
Business Plan
Management
Strategy
Introduction PPT
Roadmap
Self Introduction
Timelines
Process
Marketing
Agenda
Technology
Medical
Startup Business Plan
Cyber Security
Dashboards
SWOT
Proposals
Education
Pitch Deck
Digital Marketing
KPIs
Project Management
Product Management
Artificial Intelligence
Target Market
Communication
Supply Chain
Google Slides
Research Services
 One Pagers
All Categories
-
Home
- Customer Favorites
- Data Icon
Data Icon

Arrows Business Operation Ppt Small Plan Template PowerPoint Slides
We present our arrows business operation ppt small plan template PowerPoint Slides.Download and present our Arrows PowerPoint Templates because You are working at that stage with an air of royalty. Let our PowerPoint Templates and Slides be the jewels in your crown. Present our Process and Flows PowerPoint Templates because You will get more than you ever bargained for. Present our Flow Charts PowerPoint Templates because Our PowerPoint Templates and Slides will let you Clearly mark the path for others to follow. Use our Business PowerPoint Templates because You have gained great respect for your brilliant ideas. Use our PowerPoint Templates and Slides to strengthen and enhance your reputation. Present our Shapes PowerPoint Templates because You aspire to touch the sky with glory. Let our PowerPoint Templates and Slides provide the fuel for your ascent.Use these PowerPoint slides for presentations relating to Corporate, tool, business, plan, study, concept, evaluation, success, presentation, symbol, stragety,graphic, finance, data, goal, report, publication, management, graph, icon, chart, system, objective, direction, projections, growth, operation, interpretation,organization, illustrate, competition, profit, detail, publish, financial, prediction, present, communicate, arrows. The prominent colors used in the PowerPoint template are Yellow, Green, Orange.

IT Database Mining Process Phases Demonstration PDF
Showcasing this set of slides titled IT Database Mining Process Phases Demonstration PDF. The topics addressed in these templates are Data Source, Exploration Transformation, Pattern Recognition. All the content presented in this PPT design is completely editable. Download it and make adjustments in color, background, font etc. as per your unique business setting.
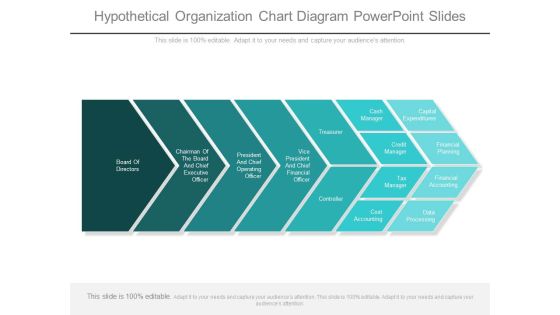
Hypothetical Organization Chart Diagram Powerpoint Slides
This is a hypothetical organization chart diagram powerpoint slides. This is a seven stage process. The stages in this process are board of directors, chairman of the board and chief executive officer, president and chief operating officer, vice president and chief financial officer, treasurer, controller, cash manager, capital expenditures, credit manager, financial planning, tax manager, financial accounting, cost accounting, data processing.
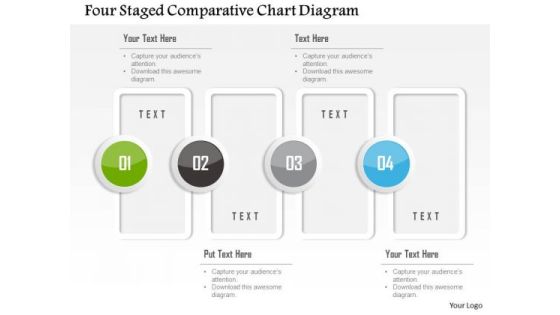
Business Diagram Four Staged Comparative Chart Diagram Presentation Template
This business diagram has been designed with four staged comparative chart. This slide suitable for data representation. You can also use this slide to present four steps of any business process. Use this diagram to present your views in a wonderful manner.

Business Diagram Six Staged Comparative Chart Diagram Presentation Template
This business diagram has been designed with six staged comparative chart. This slide suitable for data representation. You can also use this slide to present four steps of any business process. Use this diagram to present your views in a wonderful manner.

PowerPoint Themes Comb Process Success Ppt Slides
PowerPoint Themes Comb Process Success PPT Slides-Circular diagram applications include context diagrams, diagrams for mind mapping, audit flow diagram, circular process flow diagrams, data flow diagrams and more. This PowerPoint Diagram will let you explain the combo Process which will lead to Success. -PowerPoint Themes Comb Process Success PPT Slides

Business Diagram Application Database Network Email File Print Services Virtualized Ppt Slide
This technology diagram has been designed with graphic of servers and computers. This slide depicts concept of data base networking and email connectivity. This diagram slide can be used for representing virtualization techniques of database connectivity and email file print service.
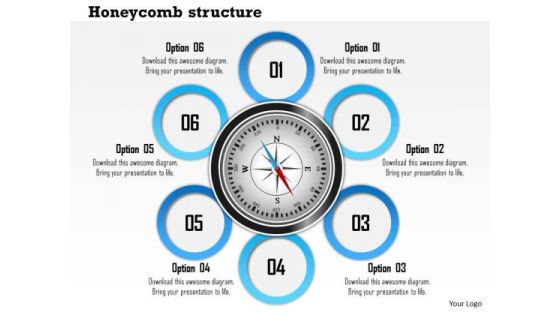
Business Diagram Six Staged Honey Comb Structure Diagram Presentation Template
This Power Point template slide has been designed with graphic of 3d compass and six text circles around it. Display any six levels of data with this exclusive diagram and get good remarks. Give professional appearance to your presentations using this business slide.

1 Desktop Tower Server And Database By The Side Showing Compute And Storage Ppt Slides
This Powerpoint image slide has been designed to explain the concept of database connectivity and data storage. To display these concepts we have used graphic of server with database. Explain cloud computing with this innovative PPT slide. Build a strong presentation for cloud computing technology using this image slide.

Three Phase Workflow Of Situation Monitoring Ppt PowerPoint Presentation Outline Design Inspiration PDF
Presenting this set of slides with name three phase workflow of situation monitoring ppt powerpoint presentation outline design inspiration pdf. This is a three stage process. The stages in this process are data capture, awareness perception, comprehension awareness, heuristics definition, analyzing application, determining problems. This is a completely editable PowerPoint presentation and is available for immediate download. Download now and impress your audience.
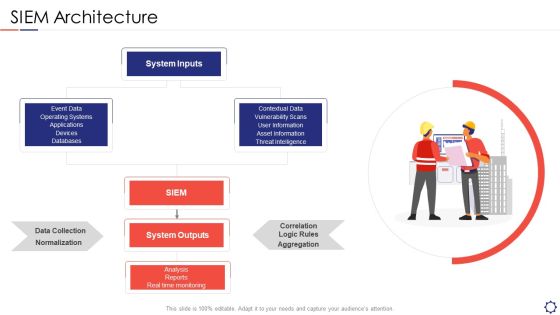
SIEM Architecture Ppt Gallery Themes PDF
Presenting siem architecture ppt gallery themes pdf to provide visual cues and insights. Share and navigate important information on one stages that need your due attention. This template can be used to pitch topics like data collection, normalization, databases, operating systems. In addtion, this PPT design contains high resolution images, graphics, etc, that are easily editable and available for immediate download.

Business Analyst Key Skills Diagram Powerpoint Ideas
This is a business analyst key skills diagram powerpoint ideas. This is a four stage process. The stages in this process are business analysis role skills and abilities, business analysis role, personal underlying competencies and characteristics, techniques and tools experiences and skills, data and process modelling, requirements workshops, prototyping, interviewing, metrics and key performance indicators, vendor and software assessment.
Asset Management Solution Diagram Ppt Example File
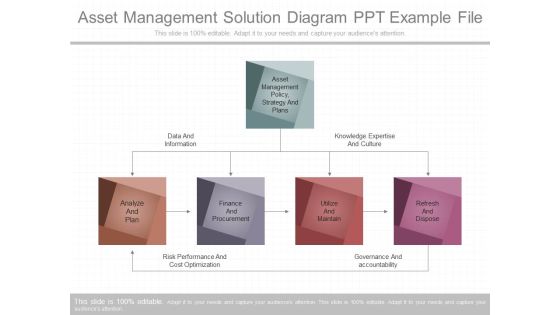
This is a asset management solution diagram ppt example file. This is a five stage process. The stages in this process are asset management policy, strategy and plans, analyze and plan, finance and procurement, utilize and maintain, refresh and dispose, data and information, knowledge expertise and culture, risk performance and cost optimization, governance and accountability.

Ppt Linear Arrow 9 State Diagram PowerPoint Templates
PPT linear arrow 9 state diagram PowerPoint Templates-Use this PowerPoint diagram to define basic work and data flow and quality management processes to increase efficiency of your business.-PPT linear arrow 9 state diagram PowerPoint Templates-Arrow, Background, Collection, Completed, Concept, Confirmation, Design, Flow, Graph, Graphic, Illustration, Indication, Indicator, Information, Instruction, Interface, Internet, Layout, Measurement, Order, Phase, Pointer, Process, Progress, Reflection, Scale, Shape, Sign
Pie Chart With Increasing Percentage Values Powerpoint Slides
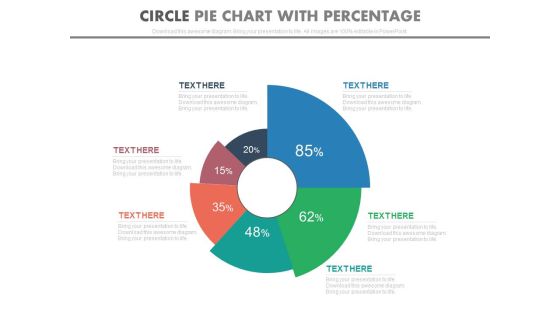
This PowerPoint template has been designed with diagram of pie chart with increasing percentage values. This PPT slide can be used to prepare presentations for profit growth report and also for financial data analysis. You can download finance PowerPoint template to prepare awesome presentations.

Commodity Unique Selling Proposition Sales Forecasting Diagrams PDF
Show the comparison of your historical and Projected data in this slide. Deliver and pitch your topic in the best possible manner with this commodity unique selling proposition sales forecasting diagrams pdf. Use them to share invaluable insights on sales forecasting and impress your audience. This template can be altered and modified as per your expectations. So, grab it now.

1 Memory Chip Shown By Pcb Printed Circuit Board With Chips And Connections Ppt Slides
This Powerpoint image slide has been designed with memory chip on PCB printed circuit board. This image explains the chip design and its connection inside the computers to explain data storage inside the memory chip. Define the usage of memory chip and PCBs inside the computers by using this PPT slide.
Business Diagram Three Staged Text Boxes Agenda Diagram Presentation Template
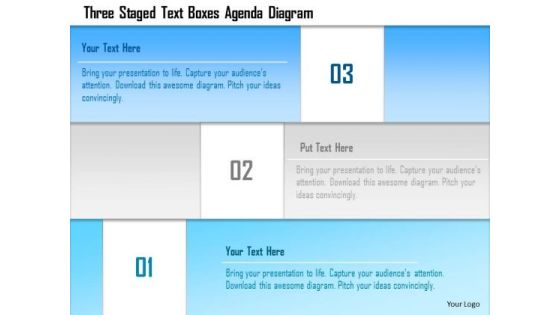
This business diagram has been designed with Three staged text Boxes agenda design. This slide suitable for data representation. You can also use this slide to present three steps of any business process. Use this diagram to present your views in a wonderful manner.

Consumer Statistics Tools Analysis Chart Ppt PowerPoint Presentation File Picture PDF
Presenting this set of slides with name consumer statistics tools analysis chart ppt powerpoint presentation file picture pdf. The topics discussed in these slides are forecasting accuracy, visualization friendliness, data science. This is a completely editable PowerPoint presentation and is available for immediate download. Download now and impress your audience.

PowerPoint Template Comb Process Process Ppt Slides
PowerPoint Template Comb Process Process PPT Slides-Circular diagrams can be used in many different situations, for example if you need to show a flow diagram in your organization or business presentations. Circular diagram applications include context diagrams, diagrams for mind mapping, audit flow diagram, circular process flow diagrams, data flow diagrams and more.-PowerPoint Template Comb Process Process PPT Slides

Customer Relationship Management Dashboard Digital Marketing Integration In CRM Diagrams PDF
Deliver and pitch your topic in the best possible manner with this customer relationship management dashboard digital marketing integration in crm diagrams pdf. Use them to share invaluable insights on personalized and predictive recommendations, guided selling, customer and product data and impress your audience. This template can be altered and modified as per your expectations. So, grab it now.

Process Of Sales And Operations Planning S And Op Diagram Sample Of Ppt
This is a process of sales and operations planning s and op diagram sample of ppt. This is a eight stage process. The stages in this process are data gathering and review, orders, supplier brand, executive meeting, partnership meeting, demand planning, product, customer.
Effort Saving Grid Chart With Standard Reporting Ppt PowerPoint Presentation Layouts Graphics PDF
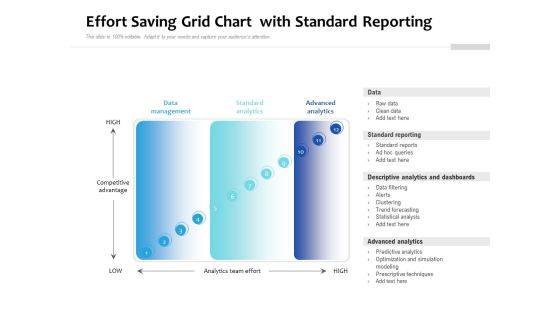
Presenting effort saving grid chart with standard reporting ppt powerpoint presentation layouts graphics pdf to dispense important information. This template comprises twelve stages. It also presents valuable insights into the topics including data management, standard analytics, advanced analytics. This is a completely customizable PowerPoint theme that can be put to use immediately. So, download it and address the topic impactfully.
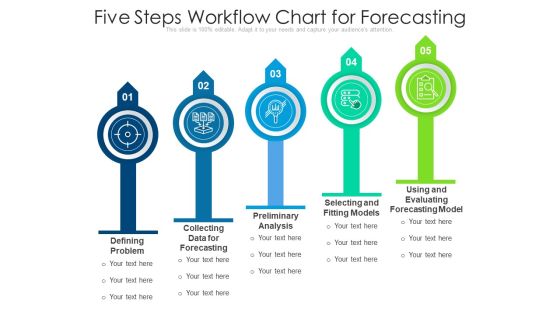
Five Steps Workflow Chart For Forecasting Ppt PowerPoint Presentation Outline Designs Download PDF
Presenting five steps workflow chart for forecasting ppt powerpoint presentation outline designs download pdf to dispense important information. This template comprises five stages. It also presents valuable insights into the topics including collecting data for forecasting, preliminary analysis, selecting and fitting models. This is a completely customizable PowerPoint theme that can be put to use immediately. So, download it and address the topic impactfully.

Business Diagram Gear With Five Steps Diagram Presentation Template
This power point template has been crafted with graphic of gear and five text boxes. These text boxes are used to show data flow and gears are used to display process control. Use this PPT for your business and marketing related presentations.

Business Activities Assessment Examples Infrastructure Industry Key Stats Diagrams PDF
Deliver an awe inspiring pitch with this creative business activities assessment examples infrastructure industry key stats diagrams pdf bundle. Topics like subsidiary companies, points of presence, racks utilized, data centers can be discussed with this completely editable template. It is available for immediate download depending on the needs and requirements of the user.

Steps Of Decision Making In Spiral Diagram Graphics PDF
Presenting steps of decision making in spiral diagram graphics pdf to dispense important information. This template comprises six stages. It also presents valuable insights into the topics including identifying problem, specifying criteria, determining possible solutions, conducting data analysis, choosing best option. This is a completely customizable PowerPoint theme that can be put to use immediately. So, download it and address the topic impactfully.
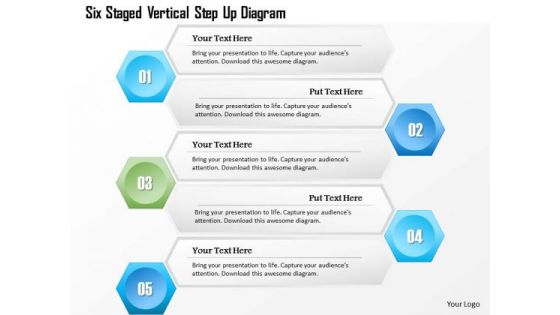
Business Diagram Six Staged Vertical Step Up Diagram Presentation Template
This business diagram has been designed with six staged vertical steps diagram. This slide suitable for data representation. You can also use this slide to present six steps of any business process. Use this diagram to present your views in a wonderful manner.
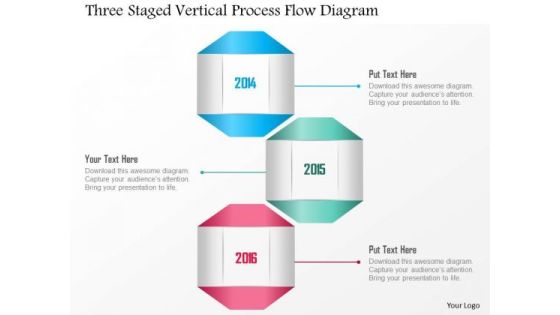
Business Diagram Three Staged Vertical Process Flow Diagram Presentation Template
This business diagram has been designed with three staged vertical process flow design. This slide suitable for data representation. You can also use this slide to present three steps of any business process. Use this diagram to present your views in a wonderful manner.
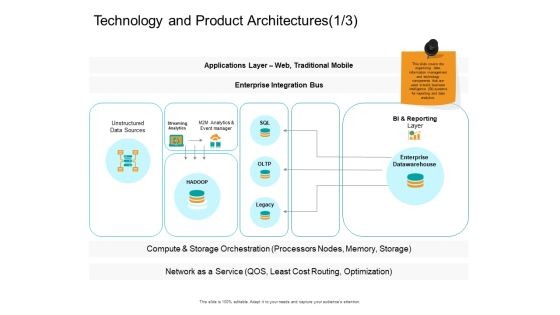
Facts Assessment Technology And Product Architectures Enterprise Themes PDF
Presenting this set of slides with name facts assessment technology and product architectures enterprise themes pdf. This is a one stage process. The stages in this process are unstructured data sources, bi and reporting, layer enterprise datawarehouse, compute and storage, optimization. This is a completely editable PowerPoint presentation and is available for immediate download. Download now and impress your audience.

Customer Acquisition Campaign Diagram Powerpoint Slide Information
This is a customer acquisition campaign diagram powerpoint slide information. This is a seven stage process. The stages in this process are brand awareness email campaigns, demand generation, sales data and analytics, sales process, sales and marketing target strategy, products and services, business goals and initiatives, customer acquisition.
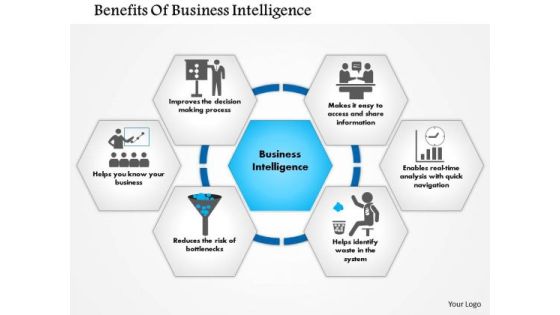
Business Framework Benefits Of Business Intelligence PowerPoint Presentation
Define the benefits of business intelligence with our exclusive power point diagram slide. This diagram slide has been crafted with graphic of business intelligence model. This diagram represents the tools, systems and software to show the strategic planning process. Use this BI model for transforming raw data in in meaning full information.

Nursing Administration Financial Performance Key Trends Ppt Infographics Themes PDF
Deliver an awe inspiring pitch with this creative nursing administration financial performance key trends ppt infographics themes pdf bundle. Topics like data analytics, avoid overbuilding, cybersecurity investment, value based payments, updating the financial leadership model can be discussed with this completely editable template. It is available for immediate download depending on the needs and requirements of the user.

Business Diagram Seven Staged Banner Style Text Boxes Presentation Template
Seven staged horizontal cut has been used to design this business diagram. This slide is useful for data display. Use this rainbow colored diagram to depict seven steps of any business process. It helps in clearly conveying your message to clients and audience

Business Diagram Six Staged Multicolored Linear Text Boxes Presentation Template
Six staged horizontal cut has been used to design this business diagram. This slide is useful for data display. Use this rainbow colored diagram to depict six steps of any business process. It helps in clearly conveying your message to clients and audience
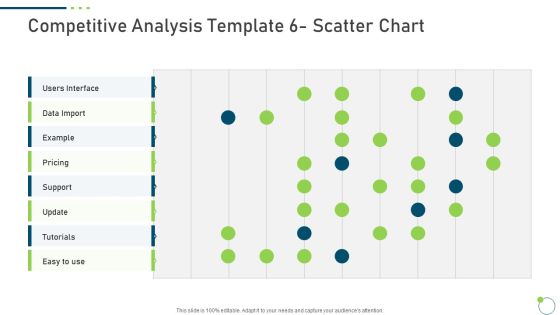
Investor Pitch Deck New Venture Capital Raising Competitive Analysis Template 6 Scatter Chart Pricing Portrait PDF
Deliver an awe inspiring pitch with this creative investor pitch deck new venture capital raising competitive analysis template 6 scatter chart pricing portrait pdf bundle. Topics like pricing, tutorials, data import, support can be discussed with this completely editable template. It is available for immediate download depending on the needs and requirements of the user.

Procedure Of Time Series Analysis Diagram Powerpoint Slide Clipart
This is a procedure of time series analysis diagram powerpoint slide clipart. This is a eight stage process. The stages in this process are data acquisition, preprocessing, correlation and spectral analysis, build the arima model, make predictions, modeling and prediction, statistical analysis, visualize the time series.
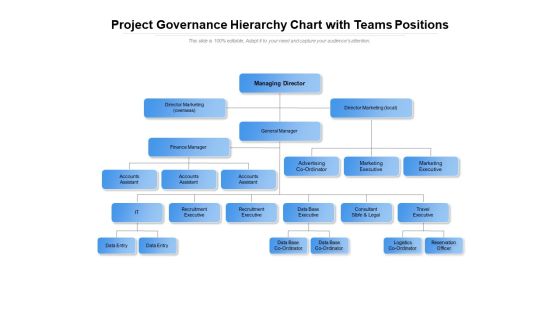
Project Governance Hierarchy Chart With Teams Positions Ppt PowerPoint Presentation File Background
Presenting this set of slides with name project governance hierarchy chart with teams positions ppt powerpoint presentation file background. This is a seven stage process. The stages in this process are accounts assistant, reservation officer, director marketing, finance manager, data entry. This is a completely editable PowerPoint presentation and is available for immediate download. Download now and impress your audience.

Sample Financial Services Marketing Diagram Powerpoint Image
This is a sample financial services marketing diagram powerpoint image. This is a ten stage process. The stages in this process are distributed marketing, indirect marketing, data providers, preference engine, ecrm, social media, sem and seo, campaign management, crm lead management, managed services.
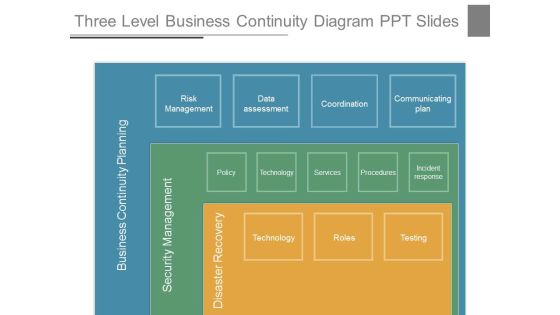
Three Level Business Continuity Diagram Ppt Slides
This is a three level business continuity diagram ppt slides. This is a three stage process. The stages in this process are business continuity planning, security management, disaster recovery, technology, roles, testing, risk management, data assessment, coordination, communicating plan, policy, technology, services, procedures, incident response.
Tracking And Assessment Framework For Business Operations Themes PDF
Presenting Tracking And Assessment Framework For Business Operations Themes PDF to dispense important information. This template comprises Four stages. It also presents valuable insights into the topics including Indicator Domains, Data Source, Business Operations. This is a completely customizable PowerPoint theme that can be put to use immediately. So, download it and address the topic impactfully.
Financial Planning Process Sample Diagram Ppt Slide
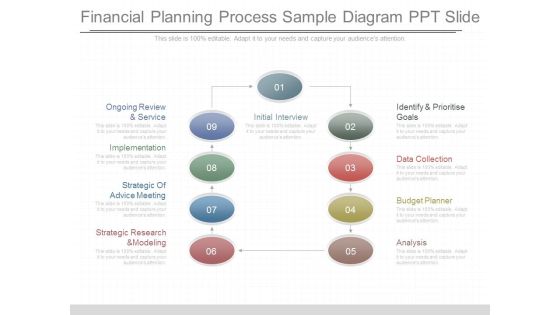
This is a financial planning process sample diagram ppt slide. This is a nine stage process. The stages in this process are initial interview, identify and prioritise goals, data collection, budget planner, analysis, strategic research and modeling, strategic of advice meeting, implementation, ongoing review and service.

Strategic Planning Methodology Diagram Presentation Portfolio
This is a strategic planning methodology diagram presentation portfolio. This is a five stage process. The stages in this process are annual deployment of the vital few objectives, develop the short term vital few objectives, create the new strategy, data collection and analysis, review the existing strategy of the organization.

Facts Assessment Architecture Introduction Ppt PowerPoint Presentation Slides Themes PDF
Presenting this set of slides with name facts assessment architecture introduction ppt powerpoint presentation slides themes pdf. The topics discussed in these slides are client tier, application tier, intelligence tier, processing tier, data tier. This is a completely editable PowerPoint presentation and is available for immediate download. Download now and impress your audience.
Seed Capital The Problem Ppt PowerPoint Presentation Summary Themes PDF
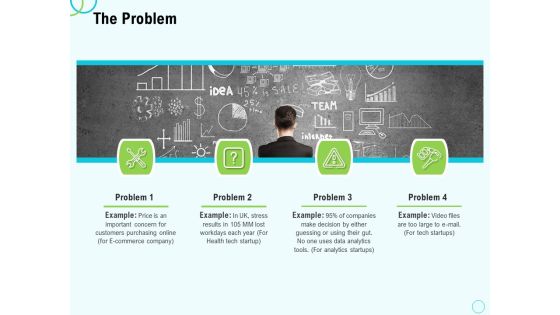
Presenting this set of slides with name seed capital the problem ppt powerpoint presentation summary themes pdf. The topics discussed in these slides are problem, price, Health tech startup, data analytics tools, analytics startups. This is a completely editable PowerPoint presentation and is available for immediate download. Download now and impress your audience.
Construction Management Services IT Infrastructure Optimization Themes PDF
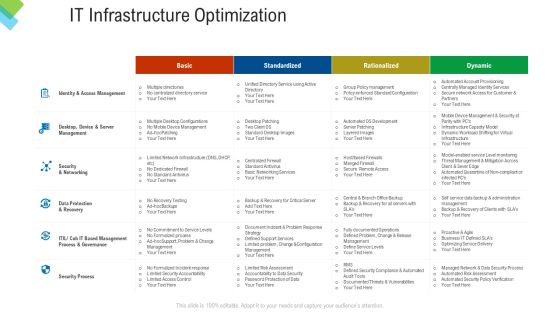
Deliver and pitch your topic in the best possible manner with this construction management services it infrastructure optimization themes pdf. Use them to share invaluable insights on security process, security and networking, management process, data protection, server management and impress your audience. This template can be altered and modified as per your expectations. So, grab it now.

Gantt Chart For Thesis Writing And Research Process Ppt PowerPoint Presentation Gallery Show PDF
Presenting this set of slides with name gantt chart for thesis writing and research process ppt powerpoint presentation gallery show pdf. The topics discussed in these slides are planning, data collection, analysis. This is a completely editable PowerPoint presentation and is available for immediate download. Download now and impress your audience.

PowerPoint Backgrounds Cycle Process Graphic Ppt Designs
PowerPoint Backgrounds Cycle Process Graphic PPT Designs-Represent your data on this diagram in a meaningful and concise manner. This Cycle Process Diagram is type of graphic organizer that shows how items are related to one another in time-oriented cycle.-PowerPoint Backgrounds Cycle Process Graphic PPT Designs
PowerPoint Layout Blocks Process Diagram Ppt Slide
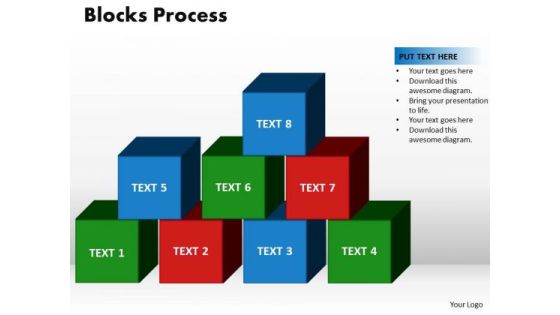
PowerPoint Layout Blocks Process Diagram PPT Slide-Compare the relationship between sets of data with this Layout Blocks Process Diagram-Achievement, action, activity, block, box, building, business, cartoon, challenge, concept, construction, cube, decisions, goal, human, idea, illustration, label, male, meeting, occupation, organization, partnership, people, person, process, progress, puppet, rendering, solution, stack, strategy, success, support, teamwork-PowerPoint Layout Blocks Process Diagram PPT Slide

Smart Metering Management Diagram Good Ppt Example
This is a smart metering management diagram good ppt example. This is a eight stage process. The stages in this process are reporting, customer information system, billing system, asset management, network information system, security manager, dc persistency, monitoring and control, meter data management.

Table Of Contents Procurement Analytics Slide Diagrams PDF
Presenting Table Of Contents Procurement Analytics Slide Diagrams PDF to provide visual cues and insights. Share and navigate important information on one stage that need your due attention. This template can be used to pitch topics like Data Analysis, Enterprise Procurement, Budget Analysis. In addtion, this PPT design contains high resolution images, graphics, etc, that are easily editable and available for immediate download.
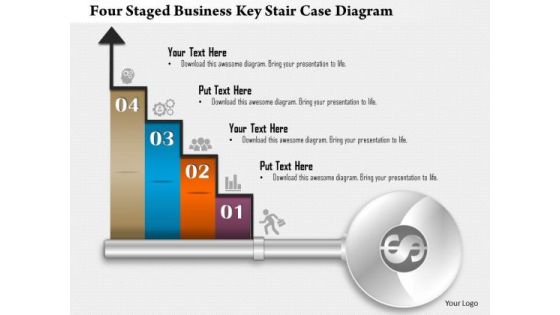
Business Diagram Four Staged Business Key Stair Case Diagram Presentation Template
This business diagram has been designed with four staged key stairs case. This slide suitable for data representation. You can also use this slide to present four steps of any business process. Use this diagram to present your views in a wonderful manner.

Human Resource System Features Chart With User Rating Ppt PowerPoint Presentation File Example PDF
Pitch your topic with ease and precision using this human resource system features chart with user rating ppt powerpoint presentation file example pdf. This layout presents information on basic suite cost, cloud support, big data analyses. It is also available for immediate download and adjustment. So, changes can be made in the color, design, graphics or any other component to create a unique layout.
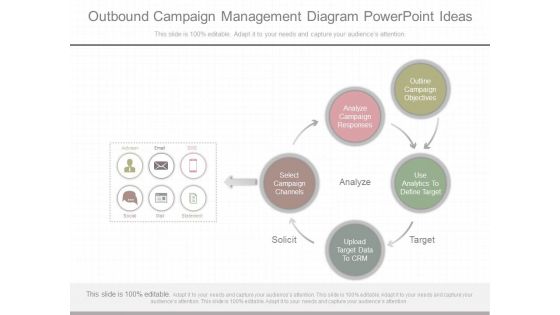
Outbound Campaign Management Diagram Powerpoint Ideas
This is a outbound campaign management diagram powerpoint ideas. This is a five stage process. The stages in this process are solicit , select campaign channels, analyze campaign responses, outline campaign objectives, use analytics to define target, upload target data to crm, analyze, target.

Crm And Internet Marketing Strategy Diagram Examples
This is a crm and internet marketing strategy diagram examples. This is a one stage process. The stages in this process are changes implemented, quality assurance, web enabling, data migration, customer acceptance, application maintenance, crm process, third party confirmation, usability modeling, crating technical architecture, preparing modeling and streamlining strategy, gathering crm strategy.
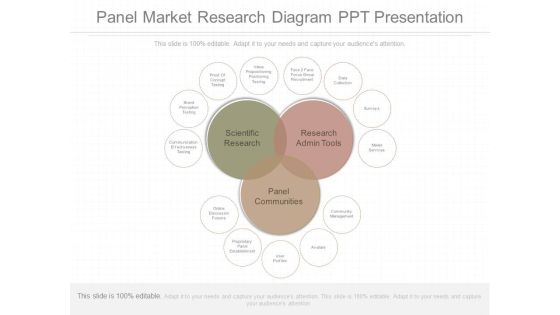
Panel Market Research Diagram Ppt Presentation
This is a panel market research diagram ppt presentation. This is a three stage process. The stages in this process are scientific research, research admin tools, panel communities, online discussion forums, proprietary panel establishment, user profiles, avatars, community management, communication effectiveness testing, brand perception testing, proof of concept testing, value propositioning positioning testing, face two face focus group recruitment, data collection, surveys, mailer services.

Omni Consumer Communication Channel Diagram Ppt Design
This is a omni consumer communication channel diagram ppt design. This is a six stage process. The stages in this process are outline campaign objectives, campaign management, analyze campaign responses, use analytics to define target, upload target data to crm, select campaign channels, analyze, solicit, target.

Market Research Databases Example Diagram Ppt Samples
This is a market research databases example diagram ppt samples. This is a four stage process. The stages in this process are survey data plus rich engagement, excellent use of emails from a database, focus groups that transcend geography, market research databases, enables repeat conversations and inquiries.
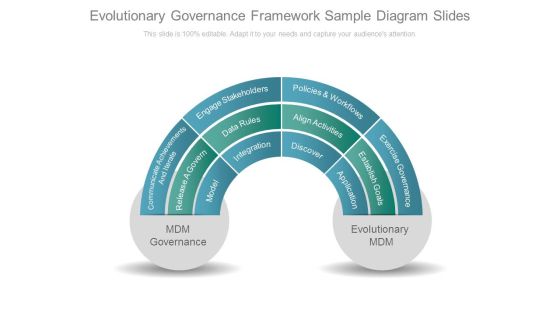
Evolutionary Governance Framework Sample Diagram Slides
This is a evolutionary governance framework sample diagram slides. This is a four stage process. The stages in this process are mdm governance, communicate achievements and iterate, model, release a govern, engage stakeholders, data rules, integration, policies and workflows, align activities, discover, exercise governance, establish goals, application, evolutionary mdm.
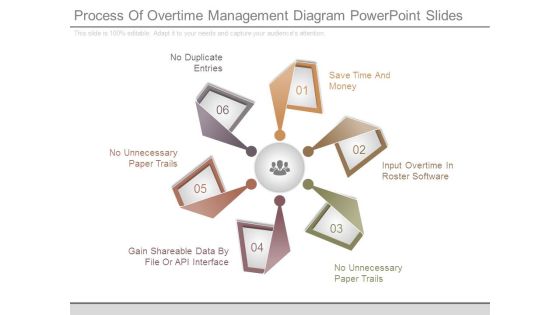
Process Of Overtime Management Diagram Powerpoint Slides
This is a process of overtime management diagram powerpoint slides. This is a six stage process. The stages in this process are no duplicate entries, no unnecessary paper trails, gain shareable data by file or api interface, save time and money, input overtime in roster software, no unnecessary paper trails.
