AI PPT Maker
Templates
PPT Bundles
Design Services
Business PPTs
Business Plan
Management
Strategy
Introduction PPT
Roadmap
Self Introduction
Timelines
Process
Marketing
Agenda
Technology
Medical
Startup Business Plan
Cyber Security
Dashboards
SWOT
Proposals
Education
Pitch Deck
Digital Marketing
KPIs
Project Management
Product Management
Artificial Intelligence
Target Market
Communication
Supply Chain
Google Slides
Research Services
 One Pagers
All Categories
-
Home
- Customer Favorites
- Data Icon
Data Icon
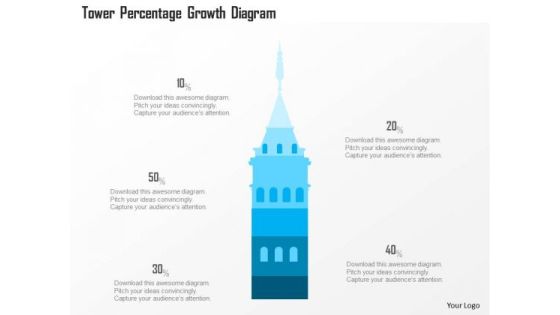
Business Diagram Tower Percentage Growth Diagram Presentation Template
This power point diagram slide has been crafted with graphic of 3d blue tower and text boxes. This PPT slide contains the concept of data and text representations. Use this PPT slide for your business and management related presentations.

Business Diagram Abstract Info Graphics 3 Steps Presentation Template
This slide displays info graphics three steps diagram. This info graphics template can be used for workflow layout. Simply add your data in this business diagram and create your own customized presentations.
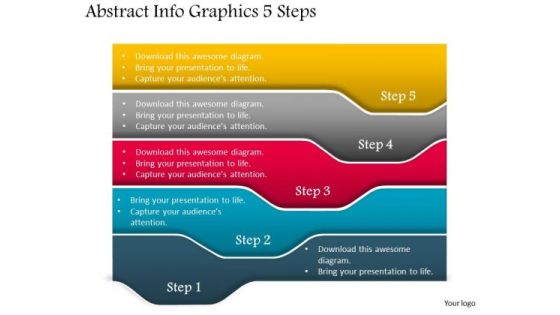
Business Diagram Abstract Info Graphics 5 Steps Presentation Template
This slide displays info graphics five steps diagram. This info graphics template can be used for workflow layout. Simply add your data in this business diagram and create your own customized presentations.

1 Printed Circuit Board Pcb With Chip Cpu Microprocessor With Connections For Eda Ppt Slides
Use this professional diagram to give presentations on data processors, microprocessor and integrated circuits. This diagram has graphics of printed circuit board PCB with chip CPU microprocessor with connections. This diagram is best to give presentations on electronic systems.
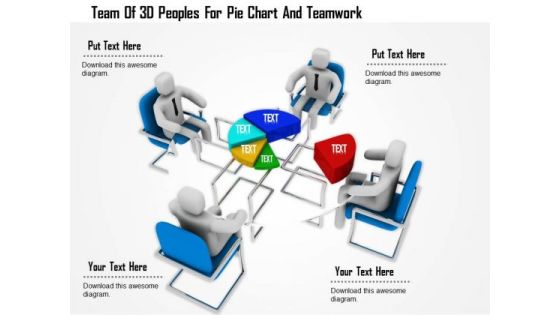
Team Of 3d Peoples For Pie Chart And Teamwork
This Power Point template has been designed with graphic of 3d team forming a pie chart. In this slide team is displaying data analysis. Use this editable slide to build innovative presentation for your viewers.

Business Framework 10 Percent To 90 Percent PowerPoint Presentation
This business diagram has been designed with graphic of multiple pie graphs. This diagram slide contains the concept of result analysis with percentage values. Use this diagram to present and compare data in an impressive manner

Business Diagram Global Business And Marketing Agenda Diagram Presentation Template
Display the concept of global agenda and marketing agenda in your business presentation. This PPT slide contains the graphic of text boxes. Use this PPT slide for your business and marketing data related presentations.
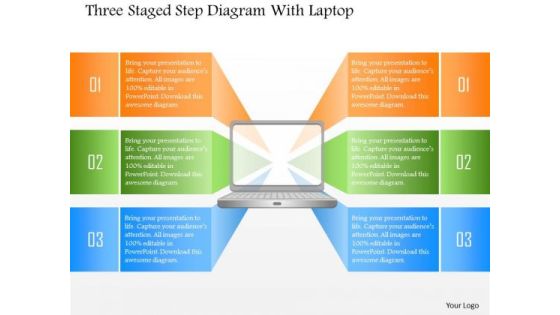
Business Diagram Three Staged Step Diagram With Laptop PowerPoint Template
Three staged step diagram with laptop has been used to craft this power point template slide. This PPT contains the concept of data representation for computer technology related topics. Use this PPt for your technology related presentations.

Business Diagram Four Semicircular Arrow Diagram Presentation Template
Graphic of four semicircular arrow diagram has been used to craft this power point template diagram. This PPT diagram contains the concept of data and text representation. Use this PPT for marketing and business related presentations.
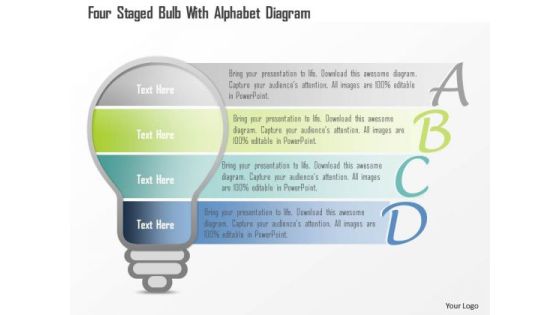
Business Diagram Four Staged Bulb With Alphabet Diagram PowerPoint Template
Four staged bulb with alphabet diagram has been used to design this power point template. This PPT diagram contains the concept of educational data representation. Use this PPT and build an exclusive presentation for education related topics.

Five Phases Of Corporate Analysis And Intervention Clipart PDF
This slide covers five phases of organizational diagnosis and intervention. It involves scouting, contracting, study design, data gathering and analysis and feedback. Presenting Five Phases Of Corporate Analysis And Intervention Clipart PDF to dispense important information. This template comprises five stages. It also presents valuable insights into the topics including Contracting, Data Gathering, Analysis. This is a completely customizable PowerPoint theme that can be put to use immediately. So, download it and address the topic impactfully.
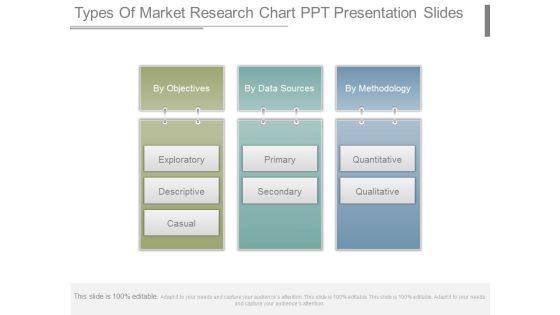
Types Of Market Research Chart Ppt Presentation Slides
This is a types of market research chart ppt presentation slides. This is a three stage process. The stages in this process are by objectives, exploratory, descriptive, causal, by data sources, primary, secondary, by methodology, quantitative, qualitative.

Business Intelligence Ecosystem Chart Example Of Ppt Presentation
This is a business intelligence ecosystem chart example of ppt presentation. This is a eight stage process. The stages in this process are strategy, data mining, customers, market, business outcome, leadership skills, suppliers, competition.
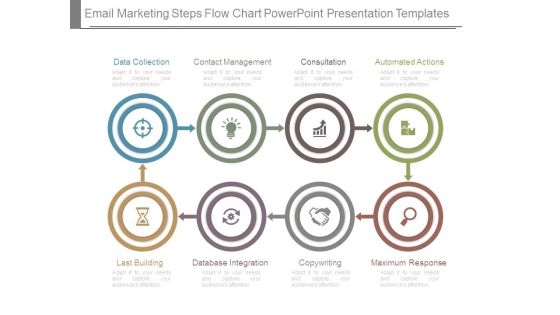
Email Marketing Steps Flow Chart Powerpoint Presentation Templates
This is a email marketing steps flow chart powerpoint presentation templates. This is a eight stage process. The stages in this process are data collection, contact management, consultation, automated actions, last building, database integration, copywriting, maximum response.

Deeper Learning Cultivator Ppt Slides Themes
This is a deeper learning cultivator ppt slides themes. This is a five stage process. The stages in this process are social emotional learning facilitator, data driven, lifelong learner, deeper learning cultivator, personalized learning architect.
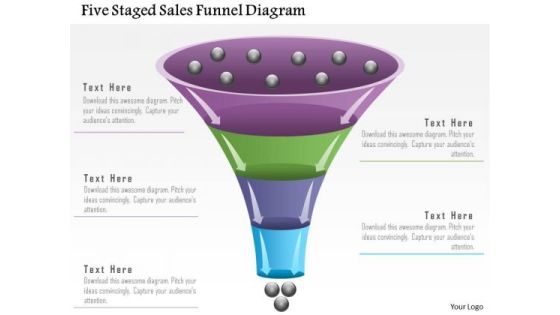
Business Diagram Five Staged Sales Funnel Diagram Presentation Template
Our above slide displays five staged sales funnel diagram. Download our above diagram to express information in a visual way. Use this diagram and get good comments for data related presentations.
Business Diagram Three Staged Horizontal Process Flow Diagram Presentation Template
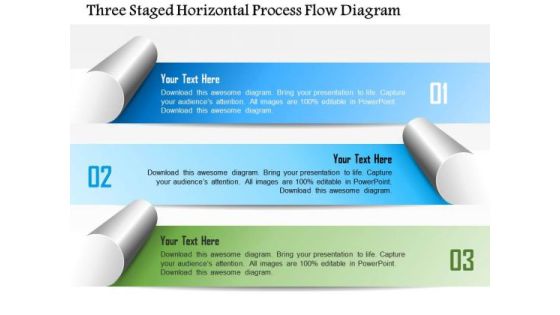
This business slide displays three staged horizontal process flow diagram. This diagram is useful for data display. Use this colorful diagram to depict three steps of any business process. It helps in clearly conveying your message to clients and audience.
Busines Diagram Four Staged Vertical Arrow Diagram Presentation Template
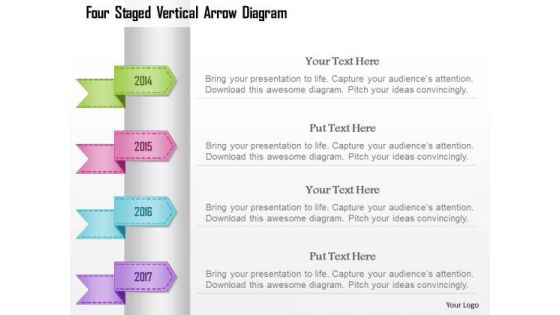
Four staged vertical arrow diagram has been used to design this business diagram. This business diagram contains the concept of data representation. This pre designed high quality image slide will make your presentations simply the best.

Business Diagram Four Staged Flag Diagram For Timeline Presentation Template
Graphic of four staged flag diagram has been used to decorate this power point template diagram. This PPT diagram contains the concept of data flow and timeline formation. Use this PPT for marketing and business related presentations.

Business Diagram Four Staged Process Diagram Presentation Template
Graphic of four staged process diagram has been used to craft this power point template diagram. This PPT diagram contains the concept of data and process flow representation. Use this PPT for marketing and business related presentations.

Business Diagram Three Interconnected Funnel Diagram Presentation Template
Graphic of three interconnected funnel diagram has been used to design this power point template diagram. This PPT diagram contains the concept of data and process flow. Use this PPT for marketing and business related presentations.

Six Phases Of Training Needs Assessment Professional PDF
This slide depicts the different phases for development analysis. It includes phases such as scoping, planning, data gathering, gap analysis, report preparation and presentation of finding. Presenting six phases of training needs assessment professional pdf to dispense important information. This template comprises six stages. It also presents valuable insights into the topics including planning, gap analysis, data gathering. This is a completely customizable PowerPoint theme that can be put to use immediately. So, download it and address the topic impactfully.
Busines Diagram Four Staged Like Diagram For Business Presentation Template
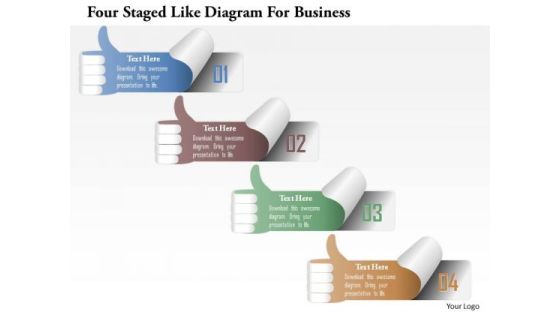
Four staged like diagram has been used to design this business diagram. This slide contains the concept of data flow and emoticons. This slide offers an excellent background to build professional presentations.
Business Diagram Circles Diagram To Explain Four Concepts Presentation Template
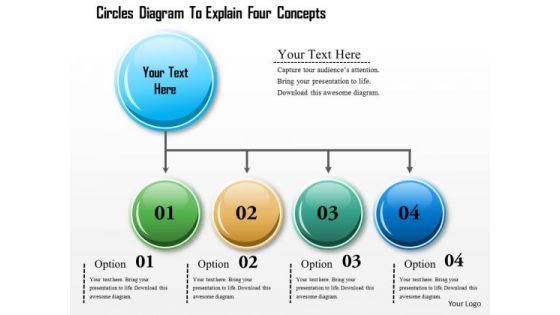
Explain the concept of data flow in any presentation with this unique PPT. This PPT contains the graphic of four staged text boxes. This PPT is suitable for business and sales presentations.
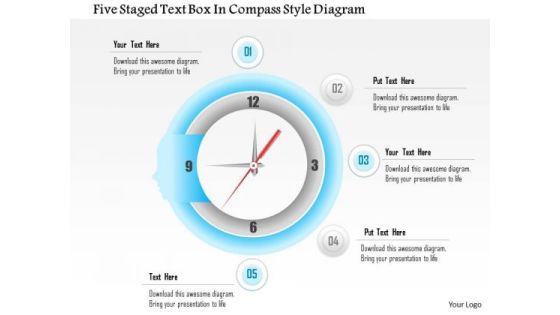
Business Diagram Five Staged Text Box In Compass Style Diagram Presentation Template
This Power Point template slide has been designed with graphic of five staged text boxes. This PPT slide contains the compass style diagram. This PPT slide can display data analysis. Use this PPT slide for your business presentations.
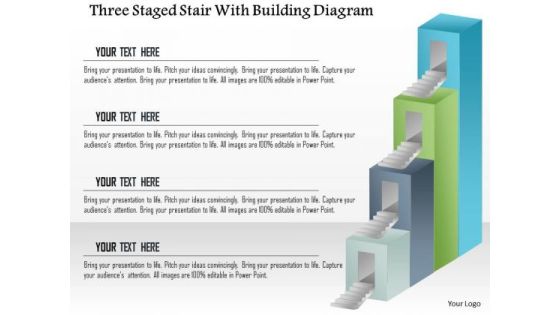
Business Diagram Three Staged Stair With Building Diagram Presentation Template
This Power Point template slide has been designed with graphic of three staged stair diagram. This PPT slide contains the concept of data representation. Use this PPt slide and build innovative presentation for your viewers.
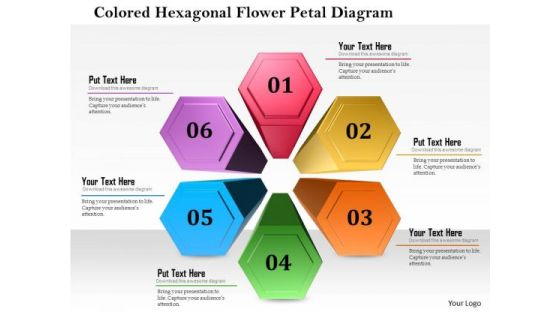
Business Diagram Colored Hexagon Flower Petal Diagram Presentation Template
This business diagram displays colored hexagon flower petal design. This Power Point slide can be used for data representation. Use this PPT slide to show flow of activities in circular manner. Get professional with this exclusive business slide.
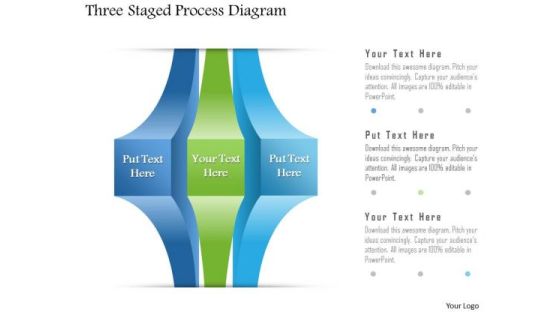
Business Diagram Three Staged Process Diagram PowerPoint Template
Three staged process diagram graphic has been used to design this power point template slide. This PPT contains the concept of data representation for business or marketing. Use this PPT for your business and sales related presentations.
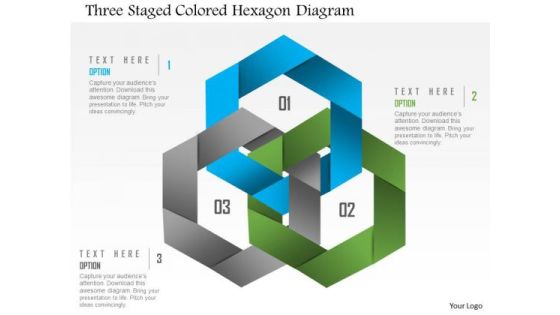
Business Diagram Three Staged Colored Hexagon Diagram PowerPoint Template
Three staged colored hexagon diagram has been used to design this power point template. This PPT contains the concept of study based data representation. This PPT is suitable for business and sales related presentations.
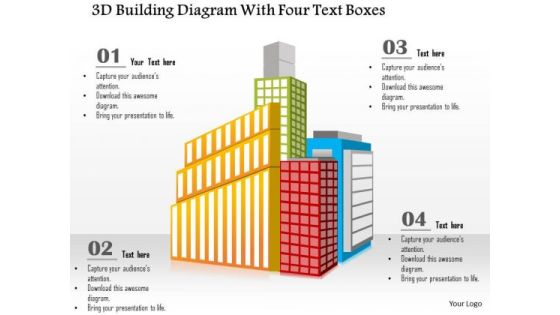
Busines Diagram 3d Building Diagram With Four Text Boxes Presentation Template
This business diagram has been designed with graphic of 3d building diagram and four text boxes. This business slide is useful for data representation. Use this diagram to make professional presentations.

Business Diagram Four Colored Tablets With Text Boxes Presentation Template
Graphic of four colored tablets has been used to design this power point template diagram. This PPT diagram contains the concept of data and text representation. Use this PPT for marketing and business related presentations.
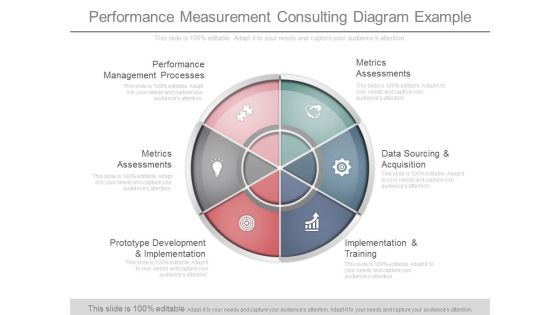
Performance Measurement Consulting Diagram Example
This is a performance measurement consulting diagram example. This is a six stage process. The stages in this process are performance management processes, metrics assessments, prototype development and implementation, metrics assessments, data sourcing and acquisition, implementation and training.
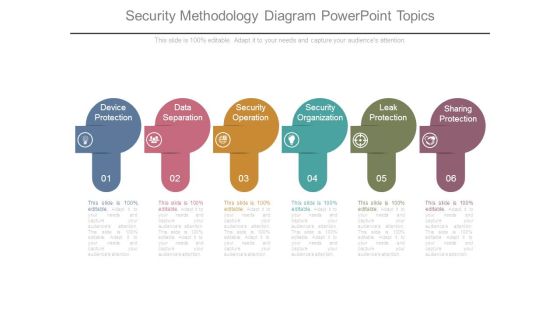
Security Methodology Diagram Powerpoint Topics
This is a security methodology diagram powerpoint topics. This is a six stage process. The stages in this process are device protection, data separation, security operation, security organization, leak protection, sharing protection.

Project Management Regulatory Compliance Report Phases Professional PDF
The following slide exhibits compliance reporting stages in project management. It provides information about project scope, planning, requirements, data management, product setup, test, live, etc. Presenting Project Management Regulatory Compliance Report Phases Professional PDF to dispense important information. This template comprises three stages. It also presents valuable insights into the topics including Plan And Requirement, Data Management, Train Project Team. This is a completely customizable PowerPoint theme that can be put to use immediately. So, download it and address the topic impactfully.
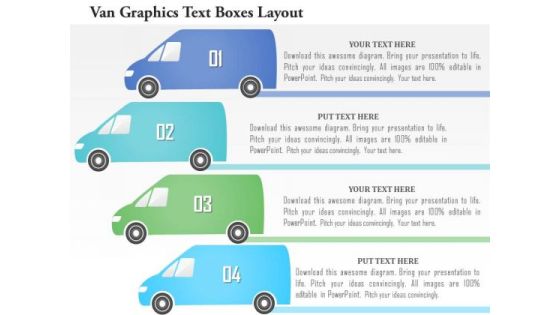
Business Diagram Van Graphics Text Boxes Layout Presentation Template
This business diagram has been designed with graphic of van style four text boxes. These text boxes are used to display data for any process. Download this diagram to build an exclusive presentation for your views.
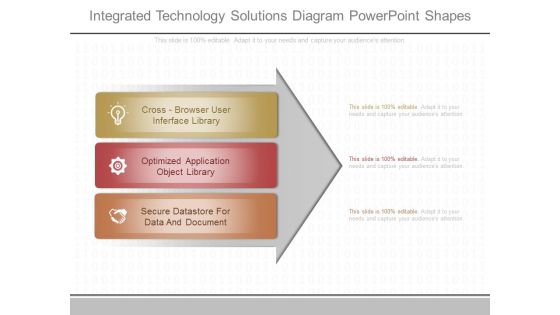
Integrated Technology Solutions Diagram Powerpoint Shapes
This is a integrated technology solutions diagram powerpoint shapes. This is a three stage process. The stages in this process are cross browser user interface library, optimized application object library, secure datastore for data and document.

Business Diagram Seven Staged Flower Petal Diagram For Text Representation Presentation Template
This business diagram displays seven staged flower petal diagram. This Power Point slide can be used for data representation. Use this PPT slide to show flow of activities in circular manner. Get professional with this exclusive business slide.
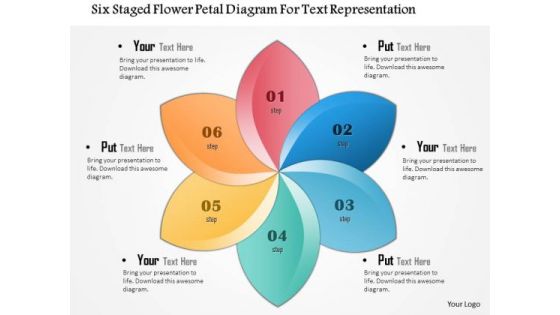
Business Diagram Six Staged Flower Petal Diagram For Text Representation Presentation Template
This business diagram displays six staged flower petal diagram. This Power Point slide can be used for data representation. Use this PPT slide to show flow of activities in circular manner. Get professional with this exclusive business slide.

Business Diagram Four Balloons With Text Boxes PowerPoint Template
Graphic of four balloons style text box diagram has been used to design this power point template slide. This PPT slide contains the concept of business data flow. Use this PPT for your business and marketing related presentations.

User Experience Management With Database Diagram Slides
This is a user experience management with database diagram slides. This is a six stage process. The stages in this process are web, harvesting, text database, linguistic analysis, refinement, fact database, data analysis, web ui, alerts, api, user experience.
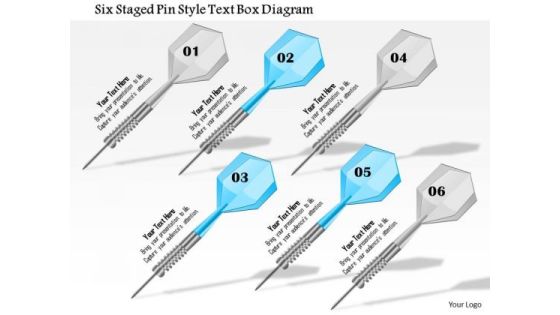
Business Diagram Six Staged Pin Style Text Box Diagram Presentation Template
This Power Point template slide has been crafted with graphic of six staged pin style text boxes. This PPT slide contain the concept of sales data analysis. Use this PPT slide for your business and sales related presentations.

Business Diagram Four Staged Road Sign Diagram For Text Representation Presentation Template
Four staged road sign diagram has been used to design this power point template. This PPT contains the concept of text and data representation. Use this PPT and build quality presentation for your viewers.

Introduction Of Information System Diagram Powerpoint Guide
This is a introduction of information system diagram powerpoint guide. This is a six stage process. The stages in this process are executive information systems, purpose, transaction processing systems, information processes, participants, data information.
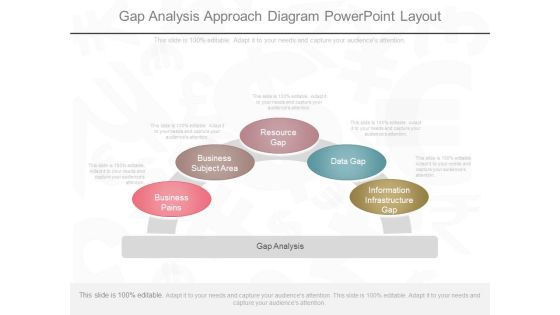
Gap Analysis Approach Diagram Powerpoint Layout
This is a gap analysis approach diagram powerpoint layout. This is a five stage process. The stages in this process are information infrastructure gap, data gap, resource gap, business subject area, business pains.
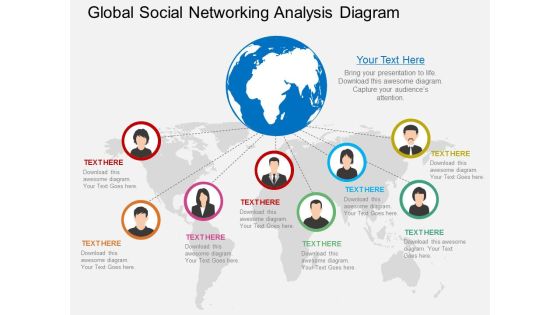
Global Social Networking Analysis Diagram Powerpoint Template
Our above PowerPoint slide contains diagram of globe with people pictures. Download this business slide to illustrate social networking. Use this diagram to impart more clarity to data and to create more sound impact on viewers.

Business Diagram Three Paper Clips For Text Representation Presentation Template
Three paper clips are used to design this power point template slide. This PPT slide has been crafted for data representation techniques. Use this PPT slide for your business and marketing related presentations.

Market Research And Analysis Diagram Ppt Sample
This is a market research and analysis diagram ppt sample. This is a five stage process. The stages in this process are location analysis, data mining, sowt analysis, market research and analysis, competition analysis, marketing potential.
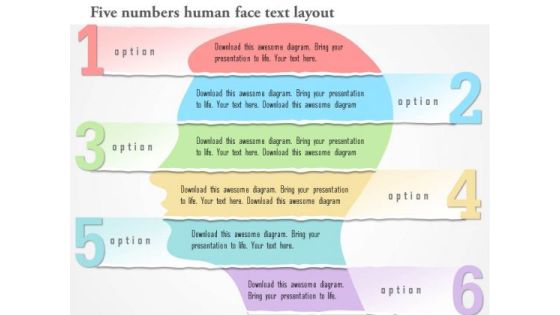
Business Diagram Six Numbers Human Face Text Layout Presentation Template
Graphic of six numeric tags and human face has been used to design this business diagram. Download our above diagram to express information in a visual way. Use this diagram and get good comments for data related presentations.
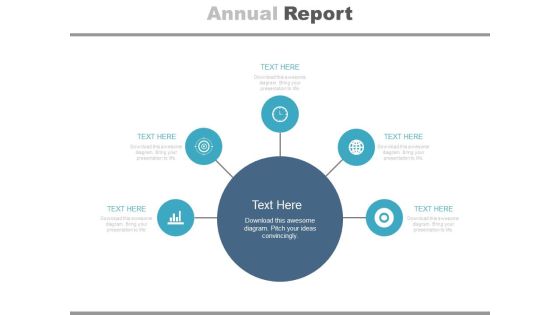
Diagram For Market Research Analysis Powerpoint Slides
This PowerPoint template has been designed with circular infographic diagram. It can be used to display steps for market research and also for financial data analysis. You can download finance PowerPoint template to prepare awesome presentations.
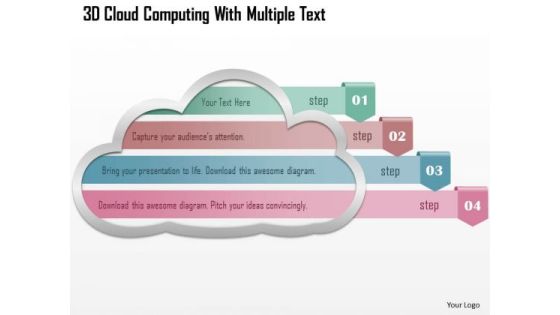
Business Diagram 3d Cloud Computing With Multiple Text PowerPoint Template
This power point template has been crafted with graphic of 3d clouds. This PPT slide contains the concept of cloud computing and data representation. This PPT can be used for cloud technology related presentations.
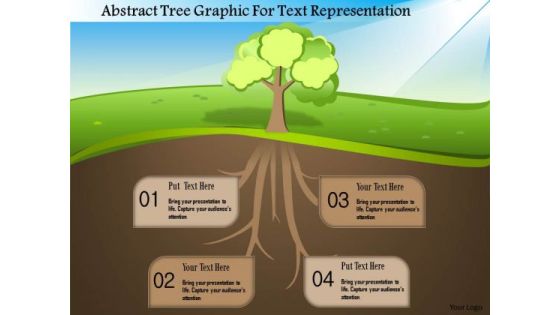
Business Diagram Abstract Tree Graphic For Text Representation Presentation Template
This business diagram displays tree graphics with text boxes. This business slide contains the concept of data representation. Use this diagram to display business information more effectively and to build professional presentation for your viewers.

Business Diagram Five Staged Pencil Style Text Boxes Presentation Template
Our above slide displays five staged pencil style text boxes. Download our above diagram to express information in a visual way. Use this diagram and get good comments for data related presentations.
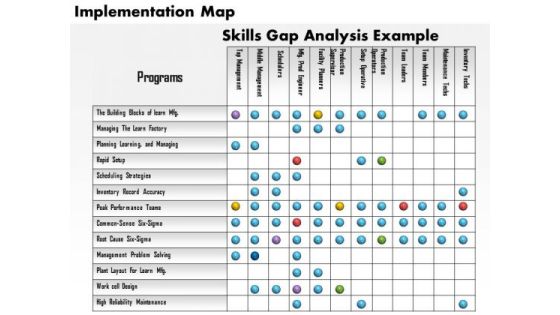
Business Framework Implementation Map PowerPoint Presentation
Graphic of implementation map has been used to decorate this power point diagram slide. This PPT slide contains the concept of data representation. This PPT diagram slide can be used for business and finance related presentations.

Business Framework Battery Charge Loading Bar PowerPoint Presentation
This business diagram displays bar graph of five battery cells. This business slide contains the concept of business growth shown in multiple levels. Use this diagram to present and compare data in an impressive manner.
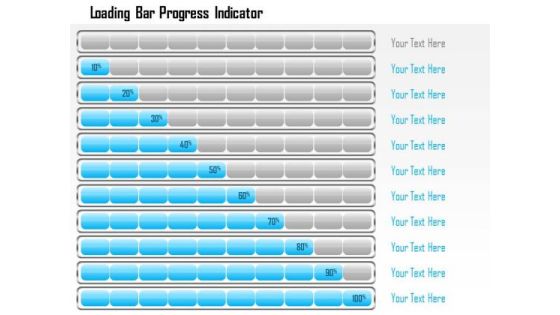
Business Framework Loading Bar Progress Indicator PowerPoint Presentation
This business diagram displays bar progress indicators. This business slide contains the concept of business growth shown in multiple levels. Use this diagram to present and compare data in an impressive manner.

Business Diagram Five Staged Pin Style Text Box Diagram Presentation Template
This Power Point template slide has been designed with graphic of five staged pin style boxes. This PPT slide contains the concept of business data representation. Use this PPT slide for your business presentation.

Busines Diagram Four Bulb Design For Text Representation Presentation Template
Four bulb design text diagram has been used to design this business slide. Use this diagram to display data in visual manner. This slide offers an excellent background to build professional presentations.

Business Diagram Three Colored Text Boxes Representation PowerPoint Template
Three colored text boxes diagram has been used to design this power point template. This PPT contains the concept of process based data representation. This PPT is suitable for business and sales related presentations.

Business Diagram Six Staged Ribbon Style Text Boxes Presentation Template
Graphic of four staged diagram has been used to design this power point template slide. This PPT slide contains the data flow. This PPT slide can be used for business and marketing related presentations.
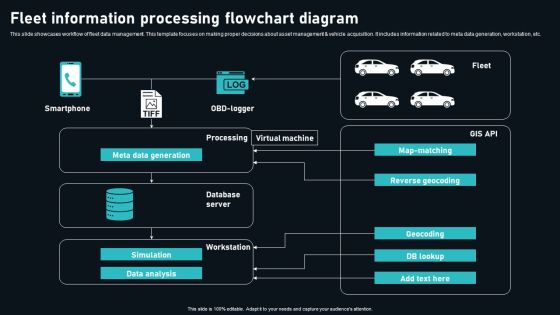
Fleet Information Processing Flowchart Diagram Themes PDF
This slide showcases workflow of fleet data management. This template focuses on making proper decisions about asset management and vehicle acquisition. It includes information related to meta data generation, workstation, etc. Showcasing this set of slides titled Fleet Information Processing Flowchart Diagram Themes PDF. The topics addressed in these templates are Smartphone, Processing, Virtual Machine. All the content presented in this PPT design is completely editable. Download it and make adjustments in color, background, font etc. as per your unique business setting.
