AI PPT Maker
Templates
PPT Bundles
Design Services
Business PPTs
Business Plan
Management
Strategy
Introduction PPT
Roadmap
Self Introduction
Timelines
Process
Marketing
Agenda
Technology
Medical
Startup Business Plan
Cyber Security
Dashboards
SWOT
Proposals
Education
Pitch Deck
Digital Marketing
KPIs
Project Management
Product Management
Artificial Intelligence
Target Market
Communication
Supply Chain
Google Slides
Research Services
 One Pagers
All Categories
-
Home
- Customer Favorites
- Data Icon
Data Icon

Datafy Phases Of Datafication As A Use Perspective Ideas PDF
This slide represents the phases of datafication from a use perspective and the stages include domain, data generation, analyzing data and generating output, and data-driven interventions. Each phase includes four steps, such as step counter, webshop, Schiphol-asito, and predictive policing. The Datafy Phases Of Datafication As A Use Perspective Ideas PDF is a compilation of the most recent design trends as a series of slides. It is suitable for any subject or industry presentation, containing attractive visuals and photo spots for businesses to clearly express their messages. This template contains a variety of slides for the user to input data, such as structures to contrast two elements, bullet points, and slides for written information. Slidegeeks is prepared to create an impression.

Feedback Management Diagram Powerpoint Slide Themes
This is a feedback management diagram powerpoint slide themes. This is a seven stage process. The stages in this process are phone, ivr, web, social media, face to face, email, data base operational and customer, enterprises feedback management.

B2b Integration Examples Diagram Powerpoint Slide Themes
This is a b2b integration examples diagram powerpoint slide themes. This is a four stage process. The stages in this process are data integration, process modeling and design, governance and security, managed file transfer.

1 Public Or Private Cloud Surrounded By Devices Iphone Laptop Tablet Storage Servers Ppt Slides
This diagram displays graphics of public or private cloud surrounded by devices I-phone laptop tablet storage servers. Use this diagram to depict concepts of data storage, technology and communication. Grab the attention of your team with this eye catching diagram.

Business Diagram Pie Chart With Key Performance Indicator Presentation Template
This power point template slide has been crafted with graphic of pie chart and magnifier. This PPT contains the concept of performance indication. Use this PPT for data technology and business related presentations.

1 Weekly Schedule Of Tape Backup Showing Timeline Of Retention Dates And Times Ppt Slides
This Powerpoint image slide has been designed with graphic of magnetic tapes. These tapes are used to take data backups and to create records. This PPT slide may be used to display weekly schedule of tape backup with timeline representation.

Business Diagram Business People Over Bar Chart PowerPoint Template
This Power Point template has been designed with graphic of business people and bar chart. This PPT contains the concept of result analysis and business data display. Use this PPT slide for your business and marketing related presentations.

Business Diagram Three Circular Financial Pie Chart PowerPoint Template
This power point template has been designed with graphic of three circular pie chart. This pie chart is suitable for financial data representation. Use this PPt for your business and finance related presentations.

PowerPoint Design Cycle Process Chart Ppt Design
PowerPoint Design Cycle Process Chart PPT Design-This Cycle process diagram depicts process stages in a more understandable and vivid manner. Use this diagram to represent data that is easy to comprehend and analyze.-PowerPoint Design Cycle Process Chart PPT Design

Business Diagram Geographically Distributed Public Cloud Connected To Cities Around World Map Ppt Sl
This technology diagram has been designed with graphic of world map and cloud. In this diagram, cloud is connected to the multiple cities around the world. Use this diagram slide for your data distribution related topics in any presentation.

Chart Of Four Business Steps Powerpoint Templates
This business diagram displays flow of four business steps. This editable slide is suitable to present growth management. Use this diagram for business and finance related topics and display complete data analysis in your presentation.
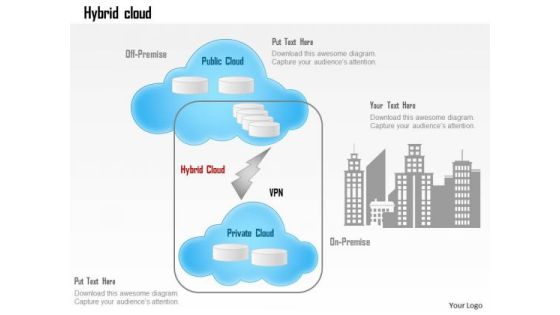
Business Diagram Hybrid Cloud Off Premise Public Cloud Office Connectivity Ppt Slide
This technology diagram slide has been designed with graphic of hybrids cloud. This diagram displays the connectivity of cloud in private and public premise. Use this graphics for your data transfer related presentations.
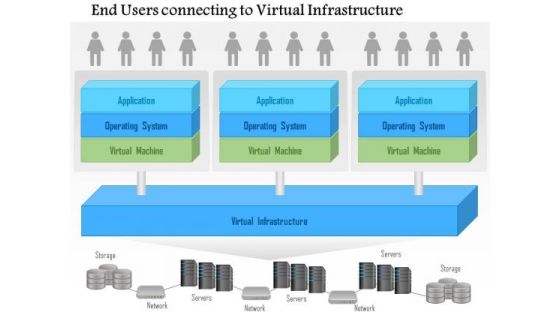
Business Diagram End Users Connecting To A Virtual Infrastructure Ppt Slide
This PowerPoint template has been designed with graphic of computer network. This slide depicts concept of end user connectivity and virtual infrastructure. This diagram is suitable to represent data and cloud structure related topics.
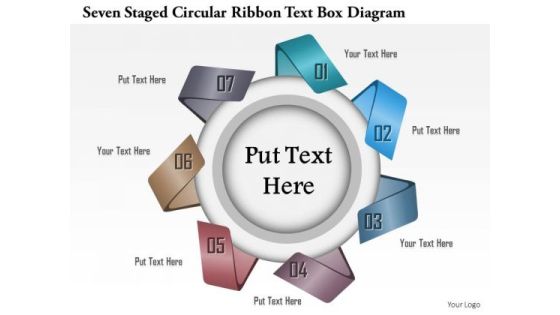
Business Diagram Seven Staged Circular Ribbon Text Box Diagram Presentation Template
This Power Point template slide has been used to display the concept of business data analysis. This PPT slide contains the graphic of seven staged circular ribbon style text boxes. Use this PPT slide for your business presentations.

Busines Diagram Four Staged Abstract Vector Banner Set Diagram Presentation Template
Four staged abstract vector banner set diagram has been used to design this business diagram. Use this profession slide for data representation. Deliver amazing presentations to mesmerize your audience.

Competitive Analysis Scatter Chart Radar Chart Ppt PowerPoint Presentation Model
This is a competitive analysis scatter chart radar chart ppt powerpoint presentation model. This is a eight stage process. The stages in this process are users interface, data import, example, pricing, support, update, tutorials, easy to use.

Business Diagram Seven Staged Concentric Diagram For Global Agenda Presentation Template
This Power Point template slide has been designed with graphic of seven staged concentric diagram. This PPT slide contains the concept of global agenda. Use this PPT slide for business and global data related presentation.
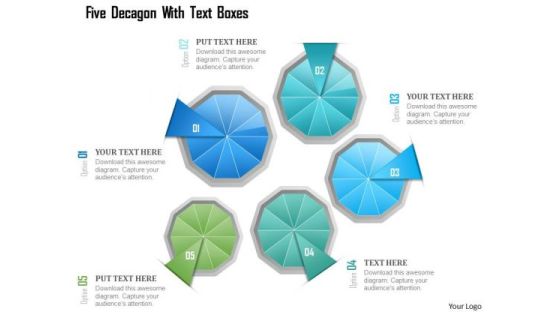
Busines Diagram Five Decagon With Text Boxes Presentation Template
This business diagram has been designed with graphic of five decagon and text boxes. This slide contains the concept of business data flow. Deliver amazing presentations to mesmerize your audience.

Competitive Analysis Scatter Chart Radar Chart Ppt PowerPoint Presentation Infographics
This is a competitive analysis scatter chart radar chart ppt powerpoint presentation infographics. This is a eight stage process. The stages in this process are users interface, data import, example, pricing, support, update, tutorials, easy to use.
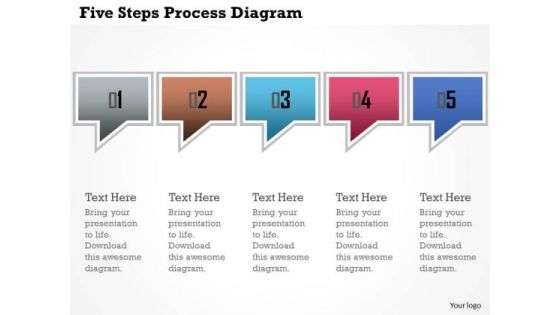
Business Diagram Five Steps Process Diagram Presentation Template
This power point template has been crafted with graphic of five dialogue boxes. This PPT contains the concept of text and data representation. Use this PPT for your business and marketing related presentations.

Business Diagram Five Staged Circular Process Diagram For Text Representation Presentation Template
Our above slide displays Five staged circular process diagram. Download our above diagram to express information in a visual way. Use this diagram and get good comments for data related presentations.
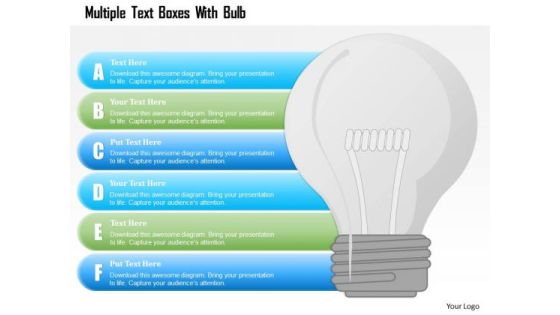
Busines Diagram Multiple Text Boxes With Bulb Presentation Template
This business diagram has been designed with graphic of multiple text boxes and bulb. This slide can be used for data representation and idea generation. Use this slide for your business and technology related presentations.
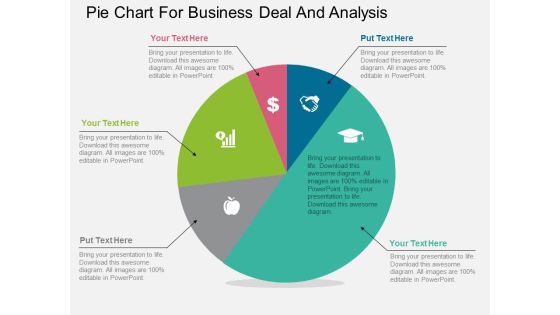
Pie Chart For Business Deal And Analysis Powerpoint Template
Our above PPT slide contains diagram of pentagon infographic. It helps to display steps of corporate marketing. Use this diagram to impart more clarity to data and to create more sound impact on viewers.
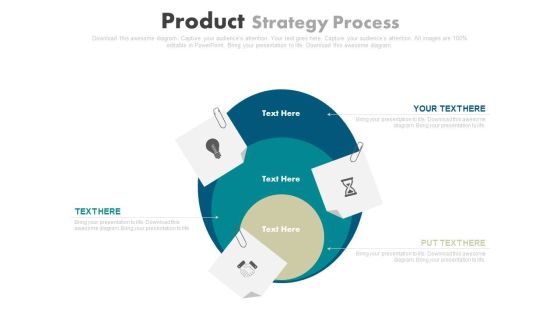
Three Steps Business Strategy Chart Powerpoint Template
This PowerPoint slide contains three steps infographic hart. It helps to exhibit business strategy steps. Use this diagram to impart more clarity to data and to create more sound impact on viewers.
Quality Management System Consulting Example Powerpoint Guide
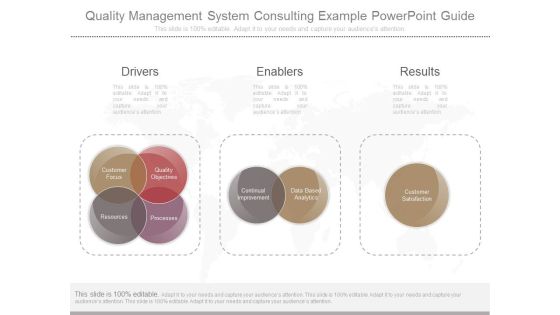
This is a quality management system consulting example powerpoint guide. This is a three stage process. The stages in this process are drivers, enablers, results, customer focus, quality objectives, processes, resources, continual improvement, data based analytics, customer satisfaction.

Business Diagram Six Pie Charts For Result Representation And Percentage Presentation Template
Display the concept of result analysis in your business presentation. This PPT slide contains the graphic of six pie charts. Use this PPT slide for your business and marketing data related presentations.
Business Diagram Of Four Text Boxes Presentation Slide Template
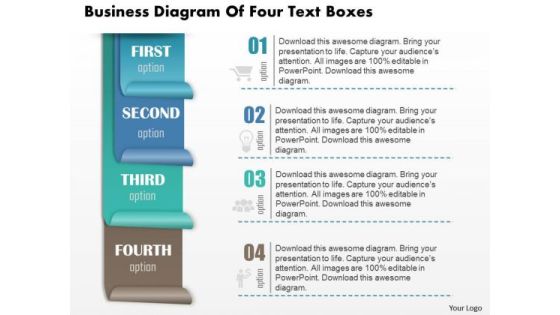
This business diagram power point slide has been crafted with four text boxes. Explain business data and calculation with this innovative diagram slide. Use this diagram slide for business and marketing presentations.
Business Diagram Five Linear Pie Charts For Result Analysis Presentation Template
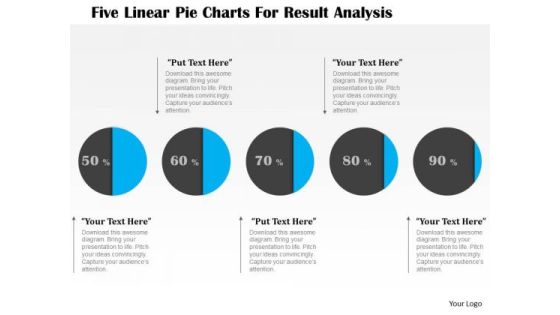
This business diagram displays graphic of five staged process flow diagram. This PPT slide contains the concept of business data representation. Use this diagram to build professional presentation for your viewers.

Business Diagram Laptop Made With Puzzle For Text Display Presentation Template
This Power Point template slide has been crafted with graphic of laptop which is made with puzzles. This PPT slide contains the concept of text representation. Use this PPT slide for business data representation.

Business Diagram Three Different Pie Charts For Result Analysis Presentation Template
Three different pie charts are used to designed this power point template slide. This PPT slide contains the concept of result analysis. Use this PPT slide for your data and process related presentations.

Pie Charts For Financial Ratio Analysis Powerpoint Slides
This PowerPoint template has been designed with diagram of pie charts. This PPT slide can be used to prepare presentations for profit growth report and also for financial data analysis. You can download finance PowerPoint template to prepare awesome presentations.

Business Diagram 3d Venn Diagram For Global Business Project Presentation Template
This business diagram displays 3d Venn diagram. This editable slide is suitable to present business reports. Use this diagram for business and finance related topics and display complete data analysis in your presentation.

Venn Business Chart With Percentage Value Powerpoint Template
This PPT slide contains Venn business chart with percentage values. This PPT diagram is suitable to present data comparison and analysis. Enlighten others on the process with this innovative PowerPoint template.
Business Framework Business Growth And Expansion Chart Timeline PowerPoint Presentation
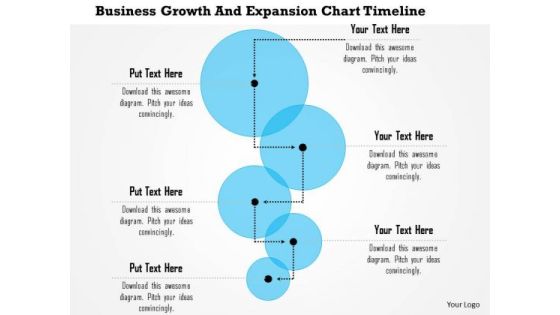
Six staged process flow linear diagram is used to design this Power Point template. This PPT slide contains the concept of data and process flow. This exclusive PPT can be used for linear process flow representation in any presentation.

Business Diagram Examples Of Traditional Virtual Architecture With Virtualized Environment Ppt Slide
This PowerPoint template has been designed with graphic of two servers. This slide contains the example of traditional virtual architecture and environment. This diagram slide is suitable to represent data and cloud structure related topics.
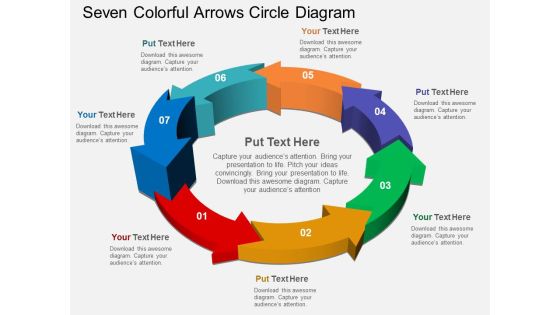
Seven Colorful Arrows Circle Diagram Powerpoint Templates
Our above PPT slide contains arrows infographic. It helps to display outline of business plan. Use this diagram to impart more clarity to data and to create more sound impact on viewers.

Business Diagram Circles With Pencils For Business Structures Presentation Template
This business diagram has been designed with graphic of pencils with text circles. This slide helps to depict business data and process. Use this slide to build quality presentations for your viewers.
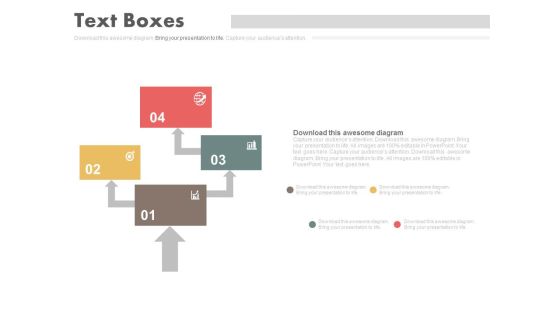
Four Steps Arrow Chart Design Powerpoint Slides
This PowerPoint template has been designed with four steps arrow chart. This PPT slide can be used to prepare presentations for marketing reports and also for financial data analysis. You can download finance PowerPoint template to prepare awesome presentations.

Business Diagram 10 Business Steps In Circle Presentation Template
This business consulting diagram helps to explain the course or movement of information in a process. This diagram is ideal for data representation and can also be used to show stages of a business process.

Competitive Analysis Scatter Chart Radar Chart Ppt PowerPoint Presentation Portfolio Templates
This is a competitive analysis scatter chart radar chart ppt powerpoint presentation portfolio templates. This is a eight stage process. The stages in this process are users interface, data import, example, pricing, support.
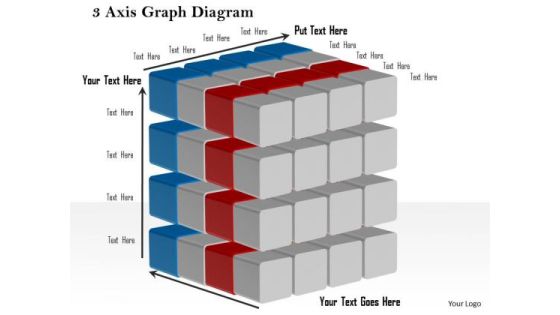
Business Framework 3 Axis Graph Diagram PowerPoint Presentation
This business diagram displays 3 axis graphs with cubes. This editable slide contains the concept of business and success. Use this diagram in your business presentations to display data in graphical manner.
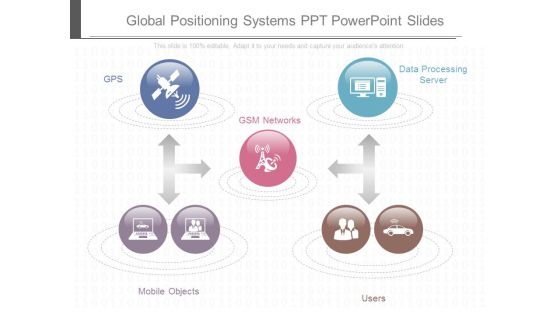
Global Positioning Systems Ppt Powerpoint Slides
This is a global positioning systems ppt powerpoint slides. This is a five stage process. The stages in this process are gps, data processing server, gsm networks, mobile objects, users.
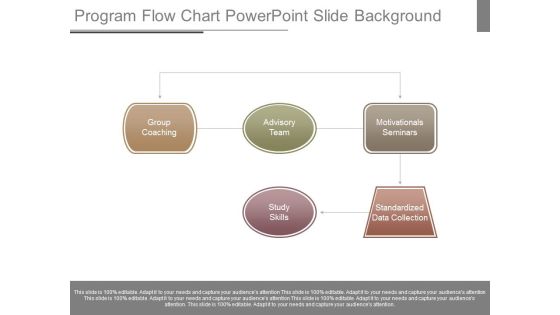
Program Flow Chart Powerpoint Slide Background
This is a program flow chart powerpoint slide background. This is a five stage process. The stages in this process are group coaching, advisory team, study skills, motivationals seminars, standardized data collection.

Six Sigma Strands Chart Ppt Examples Slides
This is a six sigma strands chart ppt examples slides. This is a six stage process. The stages in this process are bottom line, trained individuals, data driven approach, customer focused, project by project, engagement, benefits of six sigma.

Real Time Business Intelligence Diagram Powerpoint Slide Ideas
This is a real time business intelligence diagram powerpoint slide ideas. This is a seven stage process. The stages in this process are data warehousing, reporting, analytics, datamining, qap, epr, benchmarking.
Business Diagram Four Staged Vertical Text Box Diagram Presentation Template
This PPT slide contains the concept of business data analysis. This Power Point template slide has been designed with graphic of four staged vertical text boxes diagram. Use this PPT slide and build an innovative presentation for your viewers.

Key Elements Of Effective Ip Portfolio Management Powerpoint Ideas
This is a key elements of effective ip portfolio management powerpoint ideas. This is a three stage process. The stages in this process are communication, continuous improvement, ip analysis, ip database system, ip data mining.

Business Diagram Four Staged Semicircular Text Box Diagram PowerPoint Template
Four staged semicircular text boxes diagram has been used to design this power point template. This diagram template contains the concept of data and process flow. Use this PPT for your business and marketing related presentations.

Database Platform Powerpoint Slides Themes
This is a database platform powerpoint slides themes. This is a four stage process. The stages in this process are database platform, data warehouse platform, security and identity, development.
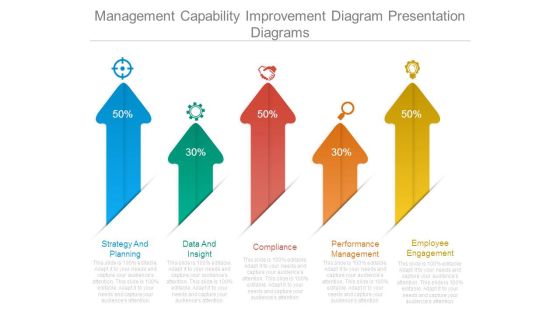
Management Capability Improvement Diagram Presentation Diagrams
This is a management capability improvement diagram presentation diagrams. This is a five stage process. The stages in this process are strategy and planning, data and insight, compliance, performance management, employee engagement.
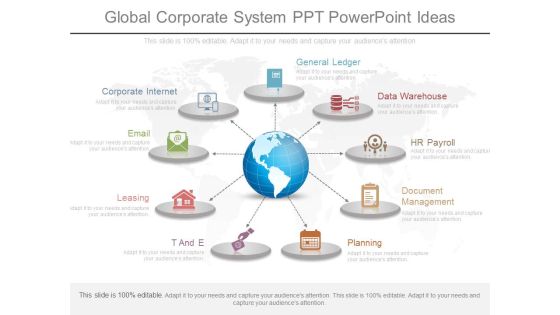
Global Corporate System Ppt Powerpoint Ideas
This is a global corporate system ppt powerpoint ideas. This is a nine stage process. The stages in this process are corporate internet, email, leasing, t and e, general ledger, data warehouse, hr payroll, document management, planning.

Business Diagram Three Staged Text Representation Diagram Presentation Template
Display the concept of data flow in any presentation with this unique power point template. This PPT contains the graphic of three staged text boxes. Use this PPT for your business and management related presentations.

Business Diagram Four Staged Infographics Arrow Diagram Presentation Template
Graphic of four staged info graphics arrow diagram has been used to craft this power point template diagram. This PPT diagram contains the concept of data and text representation. Use this PPT for marketing and business related presentations.

Competitive Analysis Template 6 Scatter Chart Ppt PowerPoint Presentation Slides
This is a competitive analysis template 6 scatter chart ppt powerpoint presentation slides. This is a eight stage process. The stages in this process are users interface, data import, example, pricing, support, update, tutorials, easy to use, table.

Competitive Analysis Template 7 Bubble Chart Ppt PowerPoint Presentation Deck
This is a competitive analysis template 7 bubble chart ppt powerpoint presentation deck. This is a six stage process. The stages in this process are users interface, data import, example, pricing, support, update, tutorials, easy to use, table.

Marketing Information System Example Ppt Slide Themes
This is a marketing information system example ppt slide themes. This is a six stage process. The stages in this process are government resources, customers, sales force, marketing research, data analytics, interactive marketing.

Competitive Analysis Template 6 Scatter Chart Ppt PowerPoint Presentation Shapes
This is a competitive analysis template 6 scatter chart ppt powerpoint presentation shapes. This is a one stage process. The stages in this process are users interface, data import, example, pricing, support update, tutorials, easy to use.

Competitive Analysis Scatter Chart Template 2 Ppt PowerPoint Presentation Files
This is a competitive analysis scatter chart template 2 ppt powerpoint presentation files. This is a nine stage process. The stages in this process are users interface, data import, example, pricing, support, update.

Business Diagram Four Thermometer For Entrepreneurship Statistics Presentation Template
Graphic of thermometers have been used to design this business diagram. Thermometers can be used to display entrepreneurship statistics. Use this diagram your data and information related topics in any presentation.

Circle Diagram For Business Marketing Mix Powerpoint Slides
This PowerPoint template has been designed with nine steps circle chart. This PPT slide can be used to prepare presentations for profit growth report and also for financial data analysis. You can download finance PowerPoint template to prepare awesome presentations.
