Comparison Chart
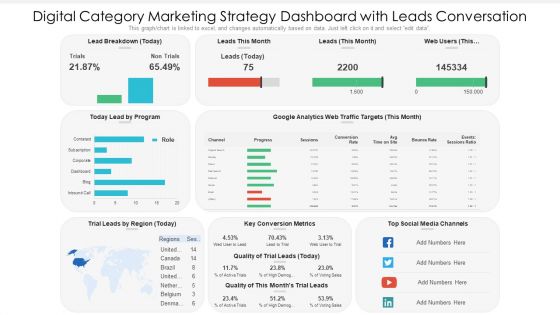
Digital Category Marketing Strategy Dashboard With Leads Conversation Ppt PowerPoint Presentation Slides Information PDF
This graph chart is linked to excel, and changes automatically based on data. Just left click on it and select edit data. Pitch your topic with ease and precision using this digital category marketing strategy dashboard with leads conversation ppt powerpoint presentation slides information pdf. This layout presents information on key conversion metrics, social media channels, lead by program. It is also available for immediate download and adjustment. So, changes can be made in the color, design, graphics or any other component to create a unique layout.

Recruitment Requisition Departmental Performance Report Sheet Demonstration PDF
Following slide illustrates hiring performance chart utilized by organizations to identify planned and spent budget along with time to fill requisitions. This slide provides data regarding various departments, planned and filled requisitions, salary budget, average days, etc. Pitch your topic with ease and precision using this Recruitment Requisition Departmental Performance Report Sheet Demonstration PDF. This layout presents information on Recruitment Requisition, Departmental Performance, Report Sheet. It is also available for immediate download and adjustment. So, changes can be made in the color, design, graphics or any other component to create a unique layout.
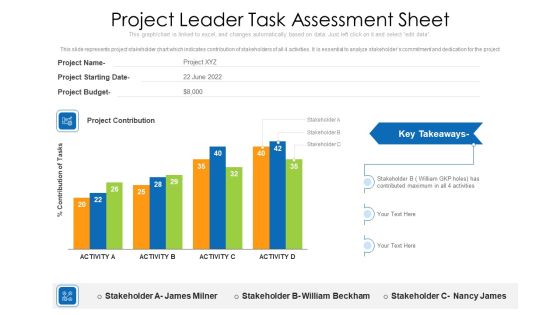
Project Leader Task Assessment Sheet Ppt PowerPoint Presentation Gallery Outline PDF
This slide represents project stakeholder chart which indicates contribution of stakeholders of all 4 activities. It is essential to analyze stakeholders commitment and dedication for the project. Pitch your topic with ease and precision using this project leader task assessment sheet ppt powerpoint presentation gallery outline pdf. This layout presents information on project leader task assessment sheet. It is also available for immediate download and adjustment. So, changes can be made in the color, design, graphics or any other component to create a unique layout.

Client Helpline Dashboard At Valet Information Dsk Ppt Gallery Slide Portrait PDF
This graph or chart is linked to excel, and changes automatically based on data. Just left click on it and select Edit Data. Pitch your topic with ease and precision using this Client Helpline Dashboard At Valet Information Dsk Ppt Gallery Slide Portrait PDF. This layout presents information on Valet Damage Claims, Valet Wait Times, Information Desk. It is also available for immediate download and adjustment. So, changes can be made in the color, design, graphics or any other component to create a unique layout.

Client Helpline Dashboard With Retention Rate Ppt Gallery Ideas PDF
This graph or chart is linked to excel, and changes automatically based on data. Just left click on it and select Edit Data. Pitch your topic with ease and precision using this Client Helpline Dashboard With Retention Rate Ppt Gallery Ideas PDF. This layout presents information on Cost per Support 2022, Total Requests, Total Revenue 2022, Avg Requests Answered. It is also available for immediate download and adjustment. So, changes can be made in the color, design, graphics or any other component to create a unique layout.

Firm KPI Dashboard With Average Click Through Rate Ppt Inspiration Sample PDF
This graph or chart is linked to excel, and changes automatically based on data. Just left click on it and select Edit Data. Pitch your topic with ease and precision using this Firm KPI Dashboard With Average Click Through Rate Ppt Inspiration Sample PDF. This layout presents information on Total Clicks, Total Impressive, Average CTR, Average Position. It is also available for immediate download and adjustment. So, changes can be made in the color, design, graphics or any other component to create a unique layout.

Service Level Agreement KPI Dashboard With Current Risk Statistics Topics PDF
This graph or chart is linked to excel, and changes automatically based on data. Just left click on it and select Edit Data. Pitch your topic with ease and precision using this Service Level Agreement KPI Dashboard With Current Risk Statistics Topics PDF. This layout presents information on Current Risk SLAS, Current Breached Slas, Personal Active SLA It is also available for immediate download and adjustment. So, changes can be made in the color, design, graphics or any other component to create a unique layout.

Company Financial Performance Indicators Dashboard With Liquidity And Turnover Ratios Formats PDF
This graph or chart is linked to excel, and changes automatically based on data. Just left click on it and select Edit Data. Pitch your topic with ease and precision using this Company Financial Performance Indicators Dashboard With Liquidity And Turnover Ratios Formats PDF. This layout presents information on Cash Balance, Days Inventory Outstanding, Days Payable Outstanding. It is also available for immediate download and adjustment. So, changes can be made in the color, design, graphics or any other component to create a unique layout.
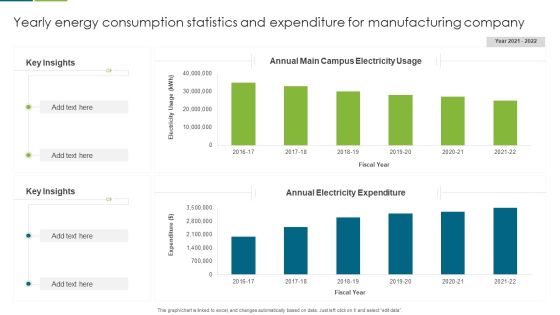
Yearly Energy Consumption Statistics And Expenditure For Manufacturing Company Guidelines PDF
This graph or chart is linked to excel, and changes automatically based on data. Just left click on it and select edit data. Pitch your topic with ease and precision using this Yearly Energy Consumption Statistics And Expenditure For Manufacturing Company Guidelines PDF. This layout presents information on Key Insights, Annual Electricity Expenditure, Annual Main Campus, Electricity Usage. It is also available for immediate download and adjustment. So, changes can be made in the color, design, graphics or any other component to create a unique layout.

SLA KPL Dashboard Illustrating Risk And Active Services Ppt Portfolio Design Inspiration PDF
This graph or chart is linked to excel, and changes automatically based on data. Just left click on it and select Edit Data. Pitch your topic with ease and precision using this SLA KPL Dashboard Illustrating Risk And Active Services Ppt Portfolio Design Inspiration PDF. This layout presents information on My Active SLAs, Database Group, Priority. It is also available for immediate download and adjustment. So, changes can be made in the color, design, graphics or any other component to create a unique layout.

Kanban Structure To Track Proposed Active And Completed Activities Ppt Outline Slide Portrait PDF
This graph or chart is linked to excel, and changes automatically based on data. Just left click on it and select Edit Data. Pitch your topic with ease and precision using this Kanban Structure To Track Proposed Active And Completed Activities Ppt Outline Slide Portrait PDF. This layout presents information on Project Lead Time, Cycle Time, Completed. It is also available for immediate download and adjustment. So, changes can be made in the color, design, graphics or any other component to create a unique layout.

Kanban Structure With Task Count And Cycle Time Ppt Layouts Background Designs PDF
This graph or chart is linked to excel, and changes automatically based on data. Just left click on it and select Edit Data. Pitch your topic with ease and precision using this Kanban Structure With Task Count And Cycle Time Ppt Layouts Background Designs PDF. This layout presents information on Required Project Design, Project Design Approval, Construct. It is also available for immediate download and adjustment. So, changes can be made in the color, design, graphics or any other component to create a unique layout.
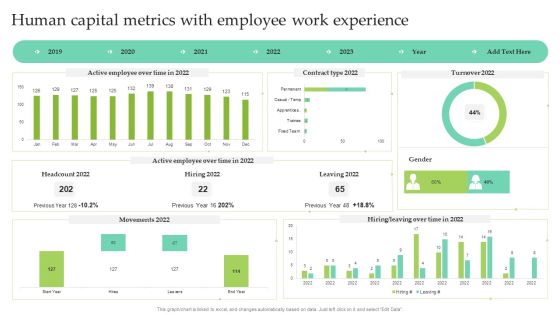
Human Capital Metrics With Employee Work Experience Ppt Show Images PDF
This graph or chart is linked to excel, and changes automatically based on data. Just left click on it and select Edit Data. Pitch your topic with ease and precision using this Human Capital Metrics With Employee Work Experience Ppt Show Images PDF. This layout presents information on Active Employee, Over Time, Contract Type 2022, Leaving 2022. It is also available for immediate download and adjustment. So, changes can be made in the color, design, graphics or any other component to create a unique layout.

Software Development Project Weekly Status Update Summary Document Inspiration PDF
This slide represents a dashboard showing the weekly status of the software development projects of the IT department. It represents pie chart showing failed login rate, status of projects and aborted connects. Pitch your topic with ease and precision using this Software Development Project Weekly Status Update Summary Document Inspiration PDF. This layout presents information on High Failed, Login Rate, Abort Connects, Failed Login. It is also available for immediate download and adjustment. So, changes can be made in the color, design, graphics or any other component to create a unique layout.

Evaluation Of Risk Factor Influencing Sales Performance Inspiration PDF
This slide depicts the major factors that influences the sales performance of a company. It includes pie chart with weightage showing initial risks like shortage of raw material, increase in price. Pitch your topic with ease and precision using this Evaluation Of Risk Factor Influencing Sales Performance Inspiration PDF. This layout presents information on Production Cost, Customer Shift, Risk Influencing. It is also available for immediate download and adjustment. So, changes can be made in the color, design, graphics or any other component to create a unique layout.

Car Types Used In Usa Stacked Percentage Graph Sample PDF
This slide shows car use percentage chart in USA to compare vehicle buying decisions. It includes types of cars and car use percentage. Pitch your topic with ease and precision using this Car Types Used In Usa Stacked Percentage Graph Sample PDF. This layout presents information on Limited Space In City, Less Parking Space, Easy To Commute. It is also available for immediate download and adjustment. So, changes can be made in the color, design, graphics or any other component to create a unique layout.

Monthly KPI Work Performance Monitoring By Category Microsoft PDF
This slide shows the monthly key performance indicators report on various categories with a line chart . the categories includes financial, customer success , new business activities, HR and other metrics. Pitch your topic with ease and precision using this Monthly KPI Work Performance Monitoring By Category Microsoft PDF. This layout presents information on Metrics, Financial, Customer Success. It is also available for immediate download and adjustment. So, changes can be made in the color, design, graphics or any other component to create a unique layout.

Support Center Report With Activity And Statistics Guidelines PDF
This slide signifies the report on call centre with activities and statistics. It includes agent activity sum, pie chart based on group calls, abandonment rate, service level and average queue time. Pitch your topic with ease and precision using this Support Center Report With Activity And Statistics Guidelines PDF. This layout presents information on Support Center Report, Activity And Statistics. It is also available for immediate download and adjustment. So, changes can be made in the color, design, graphics or any other component to create a unique layout.

Competitive Analysis Of Sales And Revenue Performance Ppt Introduction PDF
The following slide showcases the competitive assessment of organizations sales and revenues to evaluate the gap and compare metrics. It includes pie chart representing performance along with key insights etc. This modern and well arranged Competitive Analysis Of Sales And Revenue Performance Ppt Introduction PDF provides lots of creative possibilities. It is very simple to customize and edit with the Powerpoint Software. Just drag and drop your pictures into the shapes. All facets of this template can be edited with Powerpoint no extra software is necessary. Add your own material, put your images in the places assigned for them, adjust the colors, and then you can show your slides to the world, with an animated slide included.
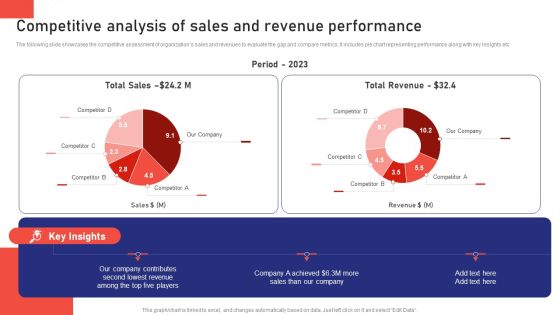
Sales Risk Assessment For Profit Maximization Competitive Analysis Of Sales And Revenue Performance Introduction PDF
The following slide showcases the competitive assessment of organizations sales and revenues to evaluate the gap and compare metrics. It includes pie chart representing performance along with key insights etc. Slidegeeks is one of the best resources for PowerPoint templates. You can download easily and regulate Sales Risk Assessment For Profit Maximization Competitive Analysis Of Sales And Revenue Performance Introduction PDF for your personal presentations from our wonderful collection. A few clicks is all it takes to discover and get the most relevant and appropriate templates. Use our Templates to add a unique zing and appeal to your presentation and meetings. All the slides are easy to edit and you can use them even for advertisement purposes.
Collection Of Interrelated Tasks 10 Issues Ppt Business Plan PowerPoint Templates
We present our collection of interrelated tasks 10 issues ppt business plan PowerPoint templates.Present our Flow Charts PowerPoint Templates because Our PowerPoint Templates and Slides will let you Illuminate the road ahead to Pinpoint the important landmarks along the way. Present our Business PowerPoint Templates because Our PowerPoint Templates and Slides will generate and maintain the level of interest you desire. They will create the impression you want to imprint on your audience. Use our Flow Charts PowerPoint Templates because our PowerPoint Templates and Slides will give your ideas the shape. Download our Shapes PowerPoint Templates because Our PowerPoint Templates and Slides offer you the needful to organise your thoughts. Use them to list out your views in a logical sequence. Download our Marketing PowerPoint Templates because Our PowerPoint Templates and Slides will steer your racing mind. Hit the right buttons and spur on your audience.Use these PowerPoint slides for presentations relating to Flow, network, platform, diagram, connection, connect, business, flowchart, function, organization, coordinates, molecular, square, plan, interrelations, scheme, graphic, technology, graph, molecule, arrangement, comparison, scientific, variable, project, relationships, lines,attached, segments, interconnected, solution, organize, device, analyze, draft, pattern, construction, structure. The prominent colors used in the PowerPoint template are Green, White, Gray.

Social Media Visibility Comparative Analysis Brochure PDF
The slide illustrates a comparative analysis survey to evaluate the presence of various companies on social media. Various social media platforms included are Facebook, Instagram and Twitter Pitch your topic with ease and precision using this Social Media Visibility Comparative Analysis Brochure PDF. This layout presents information on YYYYYYYYYYYYYYYYYYYYYYYYYYYYYYYYYYYYYYYYY. It is also available for immediate download and adjustment. So, changes can be made in the color, design, graphics or any other component to create a unique layout.

Brand Awareness Plan Ineffective Product Marketing Impact On Customer Acquisition Slides PDF
This graph or chart is linked to excel, and changes automatically based on data. Just left click on it and select Edit Data. Are you searching for a Brand Awareness Plan Ineffective Product Marketing Impact On Customer Acquisition Slides PDF that is uncluttered, straightforward, and original Its easy to edit, and you can change the colors to suit your personal or business branding. For a presentation that expresses how much effort youve put in, this template is ideal With all of its features, including tables, diagrams, statistics, and lists, its perfect for a business plan presentation. Make your ideas more appealing with these professional slides. Download Brand Awareness Plan Ineffective Product Marketing Impact On Customer Acquisition Slides PDF from Slidegeeks today.

Adopting IMC Technique To Boost Brand Recognition Monthly Advertising Costs Budget Allocation Microsoft PDF
The following slide depicts advertising costs pie chart to monitor expenses and control promotional activities accordingly. It includes elements such as print materials, search advertising, social media, online ads etc. along with key takeaways. This Adopting IMC Technique To Boost Brand Recognition Monthly Advertising Costs Budget Allocation Microsoft PDF is perfect for any presentation, be it in front of clients or colleagues. It is a versatile and stylish solution for organizing your meetings. The Adopting IMC Technique To Boost Brand Recognition Monthly Advertising Costs Budget Allocation Microsoft PDF features a modern design for your presentation meetings. The adjustable and customizable slides provide unlimited possibilities for acing up your presentation. Slidegeeks has done all the homework before launching the product for you. So, do not wait, grab the presentation templates today
Collection Of Interrelated Tasks 10 Issues Ppt Business Planning Guide PowerPoint Templates
We present our collection of interrelated tasks 10 issues ppt business planning guide PowerPoint templates.Use our Process and Flows PowerPoint Templates because Our PowerPoint Templates and Slides will give good value for money. They also have respect for the value of your time. Use our Flow Charts PowerPoint Templates because You aspire to touch the sky with glory. Let our PowerPoint Templates and Slides provide the fuel for your ascent. Download and present our Business PowerPoint Templates because You canTake a leap off the starting blocks with our PowerPoint Templates and Slides. They will put you ahead of the competition in quick time. Download and present our Marketing PowerPoint Templates because It will Raise the bar of your Thoughts. They are programmed to take you to the next level. Present our Shapes PowerPoint Templates because Our PowerPoint Templates and Slides have the Brilliant backdrops. Guaranteed to illuminate the minds of your audience.Use these PowerPoint slides for presentations relating to Flow, network, platform, diagram, connection, connect, business, flowchart, function, organization, coordinates, molecular, square, plan, interrelations, scheme, graphic, technology, graph, molecule, arrangement, comparison, scientific, variable, project, relationships, lines,attached, segments, interconnected, solution, organize, device, analyze, draft, pattern, construction, structure. The prominent colors used in the PowerPoint template are White, Green dark , Gray.
Collection Of Interrelated Tasks 10 Issues Ppt How To Business Plan PowerPoint Templates
We present our collection of interrelated tasks 10 issues ppt how to business plan PowerPoint templates.Download our Flow Charts PowerPoint Templates because Our PowerPoint Templates and Slides will give you great value for your money. Be assured of finding the best projection to highlight your words. Use our Business PowerPoint Templates because They will bring a lot to the table. Their alluring flavours will make your audience salivate. Use our Process and Flows PowerPoint Templates because It can Conjure up grand ideas with our magical PowerPoint Templates and Slides. Leave everyone awestruck by the end of your presentation. Use our Marketing PowerPoint Templates because you should once Tap the ingenuity of our PowerPoint Templates and Slides. They are programmed to succeed. Use our Shapes PowerPoint Templates because Our PowerPoint Templates and Slides are created with admirable insight. Use them and give your group a sense of your logical mind.Use these PowerPoint slides for presentations relating to Flow, network, platform, diagram, connection, connect, business, flowchart, function, organization, coordinates, molecular, square, plan, interrelations, scheme, graphic, technology, graph, molecule, arrangement, comparison, scientific, variable, project, relationships, lines,attached, segments, interconnected, solution, organize, device, analyze, draft, pattern, construction, structure. The prominent colors used in the PowerPoint template are White, Green dark , Gray.

Achieve Business Outcome 8 Stages Real Estate Plan Sample PowerPoint Templates
We present our achieve business outcome 8 stages real estate plan sample PowerPoint templates.Use our Circle Charts PowerPoint Templates because Our PowerPoint Templates and Slides will embellish your thoughts. See them provide the desired motivation to your team. Download our Process and Flows PowerPoint Templates because You aspire to touch the sky with glory. Let our PowerPoint Templates and Slides provide the fuel for your ascent. Download and present our Business PowerPoint Templates because Our PowerPoint Templates and Slides are truly out of this world. Even the MIB duo has been keeping tabs on our team. Use our Communication PowerPoint Templates because you should Whip up a frenzy with our PowerPoint Templates and Slides. They will fuel the excitement of your team. Present our Shapes PowerPoint Templates because Our PowerPoint Templates and Slides will embellish your thoughts. See them provide the desired motivation to your team.Use these PowerPoint slides for presentations relating to Circle, flow, network, platform, diagram, connection, connect, business, flowchart, function, organization, coordinates, molecular, table, square, plan, interrelations, tech, scheme, graphic, technology, graph, molecule, arrangement, comparison, scientific, variable, solve, project, relationships, lines,attached, segments, interconnected, solution, organize, device, analyze, draft, pattern, construction, structure. The prominent colors used in the PowerPoint template are Gray, Blue, Black.
Collection Of Interrelated Tasks 10 Issues Ppt Business Plan Free PowerPoint Templates
We present our collection of interrelated tasks 10 issues ppt business plan free PowerPoint templates.Download our Flow Charts PowerPoint Templates because It will let you Set new benchmarks with our PowerPoint Templates and Slides. They will keep your prospects well above par. Present our Process and Flows PowerPoint Templates because our PowerPoint Templates and Slides will give your ideas the shape. Download and present our Business PowerPoint Templates because Our PowerPoint Templates and Slides will let you Hit the right notes. Watch your audience start singing to your tune. Use our Marketing PowerPoint Templates because It can Conjure up grand ideas with our magical PowerPoint Templates and Slides. Leave everyone awestruck by the end of your presentation. Present our Shapes PowerPoint Templates because You can Stir your ideas in the cauldron of our PowerPoint Templates and Slides. Cast a magic spell on your audience.Use these PowerPoint slides for presentations relating to Flow, network, platform, diagram, connection, connect, business, flowchart, function, organization, coordinates, molecular, square, plan, interrelations, scheme, graphic, technology, graph, molecule, arrangement, comparison, scientific, variable, project, relationships, lines,attached, segments, interconnected, solution, organize, device, analyze, draft, pattern, construction, structure. The prominent colors used in the PowerPoint template are Green dark , White, Gray.

Achieve Business Outcome 8 Stages How Formulate Plan PowerPoint Templates
We present our achieve business outcome 8 stages how formulate plan PowerPoint templates.Download our Communication PowerPoint Templates because You can safely bank on our PowerPoint Templates and Slides. They will provide a growth factor to your valuable thoughts. Use our Circle Charts PowerPoint Templates because Your ideas provide food for thought. Our PowerPoint Templates and Slides will help you create a dish to tickle the most discerning palate. Download and present our Process and Flows PowerPoint Templates because Our PowerPoint Templates and Slides will let you meet your Deadlines. Use our Business PowerPoint Templates because our PowerPoint Templates and Slides are the string of your bow. Fire of your ideas and conquer the podium. Present our Shapes PowerPoint Templates because Our PowerPoint Templates and Slides are truly out of this world. Even the MIB duo has been keeping tabs on our team.Use these PowerPoint slides for presentations relating to Circle, flow, network, platform, diagram, connection, connect, business, flowchart, function, organization, coordinates, molecular, table, square, plan, interrelations, tech, scheme, graphic, technology, graph, molecule, arrangement, comparison, scientific, variable, solve, project, relationships, lines,attached, segments, interconnected, solution, organize, device, analyze, draft, pattern, construction, structure. The prominent colors used in the PowerPoint template are Blue, Black, Gray.

Concentric Data Flow Process 9 Stages Business Plan PowerPoint Templates
We present our concentric data flow process 9 stages business plan PowerPoint templates.Download and present our Process and Flows PowerPoint Templates because Our PowerPoint Templates and Slides will let Your superior ideas hit the target always and everytime. Download our Flow Charts PowerPoint Templates because You can safely bank on our PowerPoint Templates and Slides. They will provide a growth factor to your valuable thoughts. Download and present our Success PowerPoint Templates because It will get your audience in sync. Download and present our Marketing PowerPoint Templates because Our PowerPoint Templates and Slides will provide the perfect balance. Your weighty ideas will get the ideal impetus. Download our Business PowerPoint Templates because Your success is our commitment. Our PowerPoint Templates and Slides will ensure you reach your goal.Use these PowerPoint slides for presentations relating to Flow, network, platform, diagram, connection, connect, business, flowchart, function, organization, coordinates, molecular, square, plan, interrelations, scheme, graphic, technology, graph, molecule, arrangement, comparison, scientific, variable, project, relationships, lines,attached, segments, interconnected, solution, organize, device, analyze, draft, pattern, construction, structure, nine, steps. The prominent colors used in the PowerPoint template are Blue, White, Gray.
Concentric Data Flow Process 9 Stages Ppt Easy Business Plan Template PowerPoint Slides
We present our concentric data flow process 9 stages ppt easy business plan template PowerPoint Slides.Use our Process and Flows PowerPoint Templates because Our PowerPoint Templates and Slides will effectively help you save your valuable time. They are readymade to fit into any presentation structure. Download our Flow Charts PowerPoint Templates because You can Zap them with our PowerPoint Templates and Slides. See them reel under the impact. Download and present our Business PowerPoint Templates because You aspire to touch the sky with glory. Let our PowerPoint Templates and Slides provide the fuel for your ascent. Present our Shapes PowerPoint Templates because Our PowerPoint Templates and Slides are topically designed to provide an attractive backdrop to any subject. Download and present our Success PowerPoint Templates because Our PowerPoint Templates and Slides offer you the widest possible range of options.Use these PowerPoint slides for presentations relating to Flow, network, platform, diagram, connection, connect, business, flowchart, function, organization, coordinates, molecular, square, plan, interrelations, scheme, graphic, technology, graph, molecule, arrangement, comparison, scientific, variable, project, relationships, lines,attached, segments, interconnected, solution, organize, device, analyze, draft, pattern, construction, structure, nine, steps. The prominent colors used in the PowerPoint template are Blue light, White, Gray.

Concentric Data Flow Process 9 Stages Business Plans For PowerPoint Templates
We present our concentric data flow process 9 stages business plans for PowerPoint templates.Download and present our Flow Charts PowerPoint Templates because They will Put the wind in your sails. Skim smoothly over the choppy waters of the market. Use our Business PowerPoint Templates because You can Hit the nail on the head with our PowerPoint Templates and Slides. Embed your ideas in the minds of your audience. Download our Marketing PowerPoint Templates because Our PowerPoint Templates and Slides help you meet the demand of the Market. Just browse and pick the slides that appeal to your intuitive senses. Download our Process and Flow PowerPoint Templates because Our PowerPoint Templates and Slides will let Your superior ideas hit the target always and everytime. Present our Shapes PowerPoint Templates because Our PowerPoint Templates and Slides will let you Illuminate the road ahead to Pinpoint the important landmarks along the way.Use these PowerPoint slides for presentations relating to Flow, network, platform, diagram, connection, connect, business, flowchart, function, organization, coordinates, molecular, square, plan, interrelations, scheme, graphic, technology, graph, molecule, arrangement, comparison, scientific, variable, project, relationships, lines,attached, segments, interconnected, solution, organize, device, analyze, draft, pattern, construction, structure, nine, steps. The prominent colors used in the PowerPoint template are Gray, Blue, White.

Concentric Data Flow Process 9 Stages Ppt Template For Business Plan PowerPoint Slides
We present our concentric data flow process 9 stages ppt template for business plan PowerPoint Slides.Download our Process and Flows PowerPoint Templates because Our PowerPoint Templates and Slides are designed to help you succeed. They have all the ingredients you need. Download and present our Flow Charts PowerPoint Templates because Our PowerPoint Templates and Slides will weave a web of your great ideas. They are gauranteed to attract even the most critical of your colleagues. Use our Business PowerPoint Templates because Our PowerPoint Templates and Slides will provide you a launch platform. Give a lift off to your ideas and send them into orbit. Download and present our Shapes PowerPoint Templates because You will get more than you ever bargained for. Use our Success PowerPoint Templates because you should Experience excellence with our PowerPoint Templates and Slides. They will take your breath away.Use these PowerPoint slides for presentations relating to Flow, network, platform, diagram, connection, connect, business, flowchart, function, organization, coordinates, molecular, square, plan, interrelations, scheme, graphic, technology, graph, molecule, arrangement, comparison, scientific, variable, project, relationships, lines,attached, segments, interconnected, solution, organize, device, analyze, draft, pattern, construction, structure, nine, steps. The prominent colors used in the PowerPoint template are Blue light, White, Gray.

Concentric Data Flow Process 9 Stages Ppt Business Plan PowerPoint Templates
We present our concentric data flow process 9 stages ppt business plan PowerPoint templates.Download our Business PowerPoint Templates because It will get your audience in sync. Present our Flow Charts PowerPoint Templates because Watching this your Audience will Grab their eyeballs, they wont even blink. Use our Process and Flows PowerPoint Templates because Our PowerPoint Templates and Slides will fulfill your every need. Use them and effectively satisfy the desires of your audience. Download and present our Marketing PowerPoint Templates because Our PowerPoint Templates and Slides will let you meet your Deadlines. Use our Shapes PowerPoint Templates because Our PowerPoint Templates and Slides will bullet point your ideas. See them fall into place one by one.Use these PowerPoint slides for presentations relating to Flow, network, platform, diagram, connection, connect, business, flowchart, function, organization, coordinates, molecular, square, plan, interrelations, scheme, graphic, technology, graph, molecule, arrangement, comparison, scientific, variable, project, relationships, lines,attached, segments, interconnected, solution, organize, device, analyze, draft, pattern, construction, structure, nine, steps. The prominent colors used in the PowerPoint template are White, Gray, Blue.
Collection Of Interrelated Tasks 10 Issues Ppt Fashion Business Plan PowerPoint Slides
We present our collection of interrelated tasks 10 issues ppt fashion business plan PowerPoint Slides.Present our Process and Flows PowerPoint Templates because you can Add colour to your speech with our PowerPoint Templates and Slides. Your presentation will leave your audience speechless. Present our Flow Charts PowerPoint Templates because You should Throw the gauntlet with our PowerPoint Templates and Slides. They are created to take up any challenge. Download our Marketing PowerPoint Templates because You can Create a matrix with our PowerPoint Templates and Slides. Feel the strength of your ideas click into place. Download and present our Shapes PowerPoint Templates because Our PowerPoint Templates and Slides will let you Leave a lasting impression to your audiences. They possess an inherent longstanding recall factor. Use our Business PowerPoint Templates because Our PowerPoint Templates and Slides ensures Effective communication. They help you put across your views with precision and clarity.Use these PowerPoint slides for presentations relating to Flow, network, platform, diagram, connection, connect, business, flowchart, function, organization, coordinates, molecular, square, plan, interrelations, scheme, graphic, technology, graph, molecule, arrangement, comparison, scientific, variable, project, relationships, lines,attached, segments, interconnected, solution, organize, device, analyze, draft, pattern, construction, structure. The prominent colors used in the PowerPoint template are Green, Gray, White.
Concentric Data Flow Process 9 Stages Ppt Business Plan PowerPoint Slides
We present our concentric data flow process 9 stages ppt business plan PowerPoint Slides.Download our Flow Charts PowerPoint Templates because our PowerPoint Templates and Slides are the string of your bow. Fire of your ideas and conquer the podium. Use our Process and Flows PowerPoint Templates because You should Kick up a storm with our PowerPoint Templates and Slides. The heads of your listeners will swirl with your ideas. Download our Marketing PowerPoint Templates because You are working at that stage with an air of royalty. Let our PowerPoint Templates and Slides be the jewels in your crown. Download our Business PowerPoint Templates because You should Bet on your luck with our PowerPoint Templates and Slides. Be assured that you will hit the jackpot. Present our Shapes PowerPoint Templates because You have the co-ordinates for your destination of success. Let our PowerPoint Templates and Slides map out your journey.Use these PowerPoint slides for presentations relating to Flow, network, platform, diagram, connection, connect, business, flowchart, function, organization, coordinates, molecular, square, plan, interrelations, scheme, graphic, technology, graph, molecule, arrangement, comparison, scientific, variable, project, relationships, lines,attached, segments, interconnected, solution, organize, device, analyze, draft, pattern, construction, structure, nine, steps. The prominent colors used in the PowerPoint template are Blue light, White, Gray.
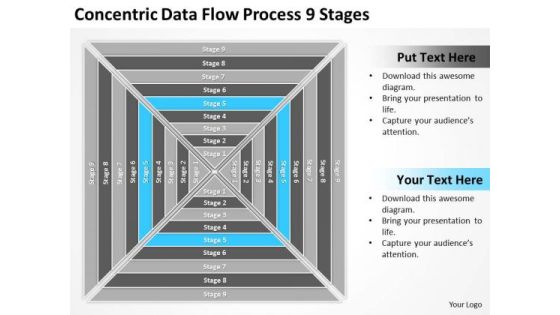
Concentric Data Flow Process 9 Stages Business Plan PowerPoint Slide
We present our concentric data flow process 9 stages business plan PowerPoint Slide.Download and present our Flow Charts PowerPoint Templates because Our PowerPoint Templates and Slides offer you the needful to organise your thoughts. Use them to list out your views in a logical sequence. Use our Process and Flows PowerPoint Templates because Our PowerPoint Templates and Slides will Activate the energies of your audience. Get their creative juices flowing with your words. Download and present our Business PowerPoint Templates because They will Put your wonderful verbal artistry on display. Our PowerPoint Templates and Slides will provide you the necessary glam and glitter. Download our Shapes PowerPoint Templates because It will mark the footprints of your journey. Illustrate how they will lead you to your desired destination. Download our Success PowerPoint Templates because It will mark the footprints of your journey. Illustrate how they will lead you to your desired destination.Use these PowerPoint slides for presentations relating to Flow, network, platform, diagram, connection, connect, business, flowchart, function, organization, coordinates, molecular, square, plan, interrelations, scheme, graphic, technology, graph, molecule, arrangement, comparison, scientific, variable, project, relationships, lines,attached, segments, interconnected, solution, organize, device, analyze, draft, pattern, construction, structure, nine, steps. The prominent colors used in the PowerPoint template are Gray, Blue light, White.
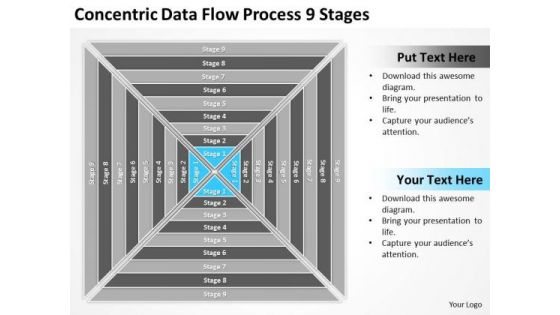
Concentric Data Flow Process 9 Stages Ppt Plans PowerPoint Slides
We present our concentric data flow process 9 stages ppt plans PowerPoint Slides.Download and present our Process and Flows PowerPoint Templates because Our PowerPoint Templates and Slides are topically designed to provide an attractive backdrop to any subject. Download our Flow Charts PowerPoint Templates because Our PowerPoint Templates and Slides offer you the widest possible range of options. Use our Business PowerPoint Templates because Our PowerPoint Templates and Slides offer you the widest possible range of options. Present our Shapes PowerPoint Templates because Our PowerPoint Templates and Slides will let you Hit the right notes. Watch your audience start singing to your tune. Download our Success PowerPoint Templates because Our PowerPoint Templates and Slides will Embellish your thoughts. They will help you illustrate the brilliance of your ideas.Use these PowerPoint slides for presentations relating to Flow, network, platform, diagram, connection, connect, business, flowchart, function, organization, coordinates, molecular, square, plan, interrelations, scheme, graphic, technology, graph, molecule, arrangement, comparison, scientific, variable, project, relationships, lines,attached, segments, interconnected, solution, organize, device, analyze, draft, pattern, construction, structure, nine, steps. The prominent colors used in the PowerPoint template are Gray, Blue light, White.
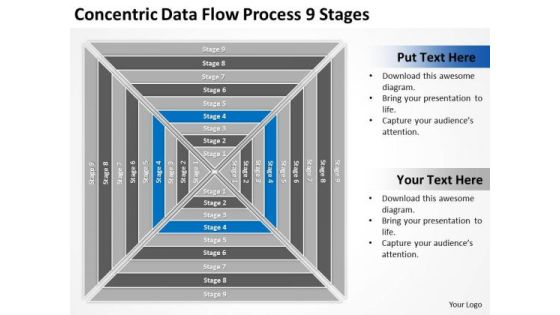
Concentric Data Flow Process 9 Stages Business Plans PowerPoint Slides
We present our concentric data flow process 9 stages business plans PowerPoint Slides.Use our Process and Flows PowerPoint Templates because Our PowerPoint Templates and Slides will provide the perfect balance. Your weighty ideas will get the ideal impetus. Use our Marketing PowerPoint Templates because Our PowerPoint Templates and Slides will provide you a launch platform. Give a lift off to your ideas and send them into orbit. Download and present our Flow Charts PowerPoint Templates because You will get more than you ever bargained for. Download and present our Shapes PowerPoint Templates because You will get more than you ever bargained for. Present our Success PowerPoint Templates because Our PowerPoint Templates and Slides come in all colours, shades and hues. They help highlight every nuance of your views.Use these PowerPoint slides for presentations relating to Flow, network, platform, diagram, connection, connect, business, flowchart, function, organization, coordinates, molecular, square, plan, interrelations, scheme, graphic, technology, graph, molecule, arrangement, comparison, scientific, variable, project, relationships, lines,attached, segments, interconnected, solution, organize, device, analyze, draft, pattern, construction, structure, nine, steps. The prominent colors used in the PowerPoint template are Blue, White, Gray.

Collection Of Interrelated Tasks 10 Issues Ppt Business Plan PowerPoint Slide
We present our collection of interrelated tasks 10 issues ppt business plan PowerPoint Slide.Use our Flow Charts PowerPoint Templates because It will let you Set new benchmarks with our PowerPoint Templates and Slides. They will keep your prospects well above par. Use our Process and Flows PowerPoint Templates because Our PowerPoint Templates and Slides are created with admirable insight. Use them and give your group a sense of your logical mind. Present our Business PowerPoint Templates because Our PowerPoint Templates and Slides will effectively help you save your valuable time. They are readymade to fit into any presentation structure. Download and present our Marketing PowerPoint Templates because Our PowerPoint Templates and Slides are aesthetically designed to attract attention. We gaurantee that they will grab all the eyeballs you need. Download and present our Shapes PowerPoint Templates because You can Channelise the thoughts of your team with our PowerPoint Templates and Slides. Urge them to focus on the goals you have set.Use these PowerPoint slides for presentations relating to Flow, network, platform, diagram, connection, connect, business, flowchart, function, organization, coordinates, molecular, square, plan, interrelations, scheme, graphic, technology, graph, molecule, arrangement, comparison, scientific, variable, project, relationships, lines,attached, segments, interconnected, solution, organize, device, analyze, draft, pattern, construction, structure. The prominent colors used in the PowerPoint template are Green lime, White, Gray.

Collection Of Interrelated Tasks 10 Issues How To Prepare Business Plan PowerPoint Slides
We present our collection of interrelated tasks 10 issues how to prepare business plan PowerPoint Slides.Present our Flow Charts PowerPoint Templates because Our PowerPoint Templates and Slides are created by a hardworking bunch of busybees. Always flitting around with solutions gauranteed to please. Present our Process and Flows PowerPoint Templates because It will Give impetus to the hopes of your colleagues. Our PowerPoint Templates and Slides will aid you in winning their trust. Download and present our Business PowerPoint Templates because It will mark the footprints of your journey. Illustrate how they will lead you to your desired destination. Download our Marketing PowerPoint Templates because Our PowerPoint Templates and Slides will provide you a launch platform. Give a lift off to your ideas and send them into orbit. Download and present our Shapes PowerPoint Templates because Our PowerPoint Templates and Slides will let you Hit the target. Go the full distance with ease and elan.Use these PowerPoint slides for presentations relating to Flow, network, platform, diagram, connection, connect, business, flowchart, function, organization, coordinates, molecular, square, plan, interrelations, scheme, graphic, technology, graph, molecule, arrangement, comparison, scientific, variable, project, relationships, lines,attached, segments, interconnected, solution, organize, device, analyze, draft, pattern, construction, structure. The prominent colors used in the PowerPoint template are Green dark , White, Gray.
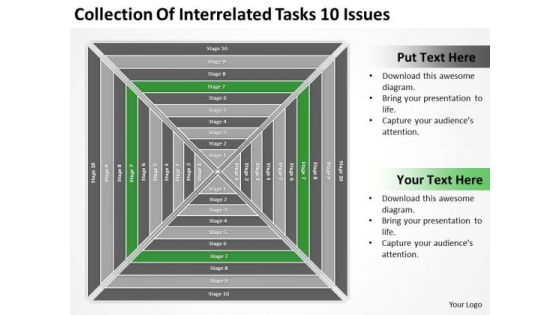
Collection Of Interrelated Tasks 10 Issues Ppt Create Business Plan PowerPoint Slides
We present our collection of interrelated tasks 10 issues ppt create business plan PowerPoint Slides.Present our Flow Charts PowerPoint Templates because They will Put the wind in your sails. Skim smoothly over the choppy waters of the market. Use our Process and Flows PowerPoint Templates because You can Raise a toast with our PowerPoint Templates and Slides. Spread good cheer amongst your audience. Download our Shapes PowerPoint Templates because Our PowerPoint Templates and Slides ensures Effective communication. They help you put across your views with precision and clarity. Download and present our Business PowerPoint Templates because Our PowerPoint Templates and Slides will Embellish your thoughts. They will help you illustrate the brilliance of your ideas. Download and present our Marketing PowerPoint Templates because It can Leverage your style with our PowerPoint Templates and Slides. Charm your audience with your ability.Use these PowerPoint slides for presentations relating to Flow, network, platform, diagram, connection, connect, business, flowchart, function, organization, coordinates, molecular, square, plan, interrelations, scheme, graphic, technology, graph, molecule, arrangement, comparison, scientific, variable, project, relationships, lines,attached, segments, interconnected, solution, organize, device, analyze, draft, pattern, construction, structure. The prominent colors used in the PowerPoint template are Gray, White, Green.
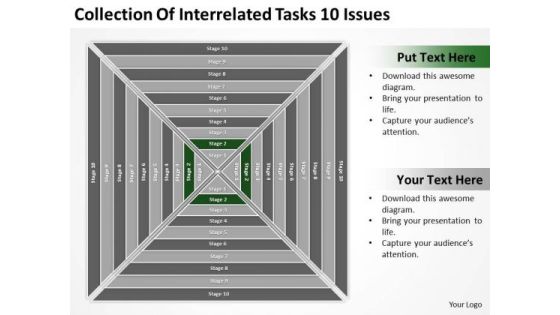
Collection Of Interrelated Tasks 10 Issues Ppt Business Plan PowerPoint Slides
We present our collection of interrelated tasks 10 issues ppt business plan PowerPoint Slides.Use our Process and Flows PowerPoint Templates because Our PowerPoint Templates and Slides help you pinpoint your timelines. Highlight the reasons for your deadlines with their use. Download and present our Flow Charts PowerPoint Templates because It can Bubble and burst with your ideas. Use our Shapes PowerPoint Templates because Our PowerPoint Templates and Slides will embellish your thoughts. See them provide the desired motivation to your team. Use our Business PowerPoint Templates because You are well armed with penetrative ideas. Our PowerPoint Templates and Slides will provide the gunpowder you need. Download our Marketing PowerPoint Templates because They will Put the wind in your sails. Skim smoothly over the choppy waters of the market.Use these PowerPoint slides for presentations relating to Flow, network, platform, diagram, connection, connect, business, flowchart, function, organization, coordinates, molecular, square, plan, interrelations, scheme, graphic, technology, graph, molecule, arrangement, comparison, scientific, variable, project, relationships, lines,attached, segments, interconnected, solution, organize, device, analyze, draft, pattern, construction, structure. The prominent colors used in the PowerPoint template are White, Gray, Green dark .
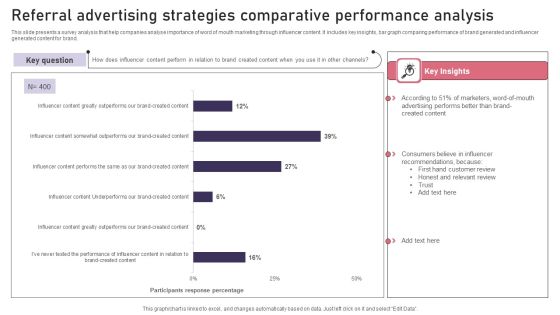
Referral Advertising Strategies Comparative Performance Analysis Diagrams PDF
This slide presents a survey analysis that help companies analyse importance of word of mouth marketing through influencer content. It includes key insights, bar graph comparing performance of brand generated and influencer generated content for brand. Showcasing this set of slides titled Referral Advertising Strategies Comparative Performance Analysis Diagrams PDF. The topics addressed in these templates are Referral Advertising, Strategies Comparative, Performance Analysis. All the content presented in this PPT design is completely editable. Download it and make adjustments in color, background, font etc. as per your unique business setting.

Comparative Analysis Survey For Aggressive Marketing Techniques Themes PDF
The slide illustrates a survey to compare various aggressive marketing strategies used by companies for engaging customers with the brand. Various techniques involved are use emotions, distribute flyers, public interaction, etc. Showcasing this set of slides titled Comparative Analysis Survey For Aggressive Marketing Techniques Themes PDF. The topics addressed in these templates are Comparative Analysis, Aggressive Marketing, Techniques. All the content presented in this PPT design is completely editable. Download it and make adjustments in color, background, font etc. as per your unique business setting.

Comparative Analysis Of Cash Earn And Burn Rate By Retail Companies Slides PDF
The following slide compares the runway of companies in retail merchandising followed by reasons of concern . The slide compares earn and burn rate . Pitch your topic with ease and precision using this Comparative Analysis Of Cash Earn And Burn Rate By Retail Companies Slides PDF. This layout presents information on Key Insights, Companies, Company. It is also available for immediate download and adjustment. So, changes can be made in the color, design, graphics or any other component to create a unique layout.

Comparative Analysis Of Bonuses And Performance Linked Incentives Of Different Companies Demonstration PDF
This slide illustrates graphical representation of statistics related to performance linked bonuses of different companies. It includes salary hike and performance bonus etc. Showcasing this set of slides titled Comparative Analysis Of Bonuses And Performance Linked Incentives Of Different Companies Demonstration PDF. The topics addressed in these templates are Comparative, Companies, Performance. All the content presented in this PPT design is completely editable. Download it and make adjustments in color, background, font etc. as per your unique business setting.

Coffee Cafe Company Profile Comparative Assessment Of Coffee Business Market Share Mockup PDF
Following slide demonstrates comparative analysis of global coffee shops market share to determine highest revenue-earning business. It includes market share if Starbucks, Dunkin Donuts, Costa coffee, McCafe, Tim Horton, etc. If you are looking for a format to display your unique thoughts, then the professionally designed Coffee Cafe Company Profile Comparative Assessment Of Coffee Business Market Share Mockup PDF is the one for you. You can use it as a Google Slides template or a PowerPoint template. Incorporate impressive visuals, symbols, images, and other charts. Modify or reorganize the text boxes as you desire. Experiment with shade schemes and font pairings. Alter, share or cooperate with other people on your work. Download Coffee Cafe Company Profile Comparative Assessment Of Coffee Business Market Share Mockup PDF and find out how to give a successful presentation. Present a perfect display to your team and make your presentation unforgettable.

Coffee Cafe Company Profile Competitors Comparative Analysis On Annual Sales Structure PDF
Following slide showcases comparative assessment of different coffee business revenue to determine best sellers. It includes key businesses such as Starbucks, Dunkin donuts, Costa coffee, McCafe, and Tim Hortons. Crafting an eye catching presentation has never been more straightforward. Let your presentation shine with this tasteful yet straightforward Coffee Cafe Company Profile Competitors Comparative Analysis On Annual Sales Structure PDF template. It offers a minimalistic and classy look that is great for making a statement. The colors have been employed intelligently to add a bit of playfulness while still remaining professional. Construct the ideal Coffee Cafe Company Profile Competitors Comparative Analysis On Annual Sales Structure PDF that effortlessly grabs the attention of your audience. Begin now and be certain to wow your customers.
Project Tracking And Evaluation Dashboard Portrait PDF
This slide illustrates graphical representation and facts and figures relating to project management data. It includes budget by employee, overdue tasks, workload charts etc. Pitch your topic with ease and precision using this Project Tracking And Evaluation Dashboard Portrait PDF. This layout presents information on Employee Budget, Target, Design, Development. It is also available for immediate download and adjustment. So, changes can be made in the color, design, graphics or any other component to create a unique layout.
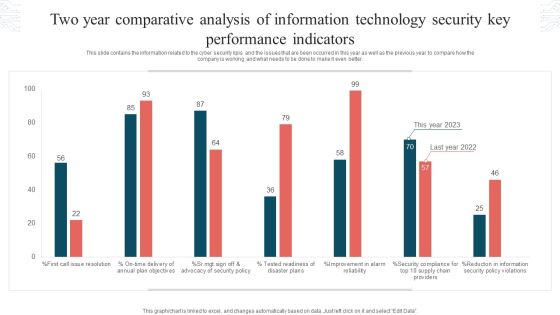
Two Year Comparative Analysis Of Information Technology Security Key Performance Indicators Graphics PDF
This slide contains the information related to the cyber security kpis and the issues that are been occurred in this year as well as the previous year to compare how the company is working and what needs to be done to make it even better. Showcasing this set of slides titled Two Year Comparative Analysis Of Information Technology Security Key Performance Indicators Graphics PDF. The topics addressed in these templates are Tested Readiness, Disaster Plans, Security Policy Violations. All the content presented in this PPT design is completely editable. Download it and make adjustments in color, background, font etc. as per your unique business setting.

KPMG Revenue Growth Comparative Analysis With Top Accounting Firms Topics PDF
This slide covers analysis of KPMG with big accounting firms based on revenue earned by them. The purpose of this template is to provide overview of revenue earned by top companies such as Deloittte, PwC, EY and KPMG along with key insights. Formulating a presentation can take up a lot of effort and time, so the content and message should always be the primary focus. The visuals of the PowerPoint can enhance the presenters message, so our KPMG Revenue Growth Comparative Analysis With Top Accounting Firms Topics PDF was created to help save time. Instead of worrying about the design, the presenter can concentrate on the message while our designers work on creating the ideal templates for whatever situation is needed. Slidegeeks has experts for everything from amazing designs to valuable content, we have put everything into KPMG Revenue Growth Comparative Analysis With Top Accounting Firms Topics PDF
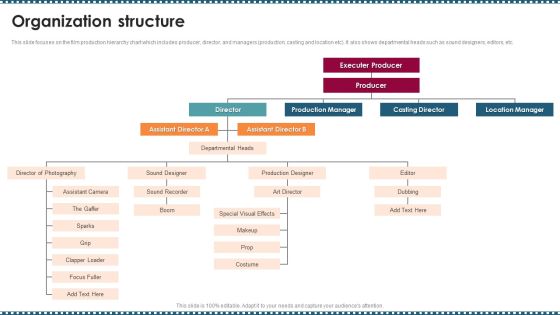
Feature Film Production Company Profile Organization Structure Information PDF
This slide focuses on the film production hierarchy chart which includes producer, director, and managers production, casting and location etc. It also shows departmental heads such as sound designers, editors, etc.This is a Feature Film Production Company Profile Organization Structure Information PDF template with various stages. Focus and dispense information on three stages using this creative set, that comes with editable features. It contains large content boxes to add your information on topics like Assistant Director, Production Manager, Casting Director You can also showcase facts, figures, and other relevant content using this PPT layout. Grab it now.
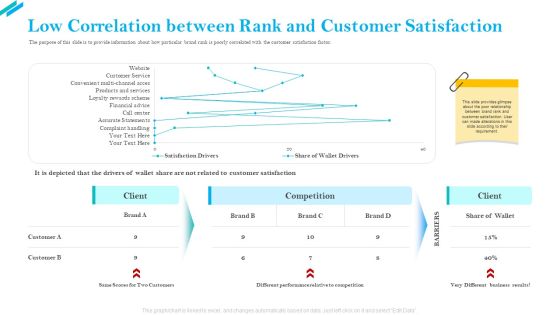
SCR For Market Low Correlation Between Rank And Customer Satisfaction Rules PDF
The purpose of this slide is to provide information about how particular brand rank is poorly correlated with the customer satisfaction factor. Deliver and pitch your topic in the best possible manner with this SCR for market low correlation between rank and customer satisfaction rules pdf. Use them to share invaluable insights on low correlation between rank and customer satisfaction, same scores for two customers, different performance relative to competition, very different business results and impress your audience. This template can be altered and modified as per your expectations. So, grab it now.

Market Share By Category Low Correlation Between Rank And Customer Satisfaction Ppt Inspiration Outfit PDF
The purpose of this slide is to provide information about how particular brand rank is poorly correlated with the customer satisfaction factor. Deliver an awe inspiring pitch with this creative market share by category low correlation between rank and customer satisfaction ppt inspiration outfit pdf bundle. Topics like client, competition, performance, business can be discussed with this completely editable template. It is available for immediate download depending on the needs and requirements of the user.

Comparative Analysis Of Traditional Vs Cloud Computing Comparative Sample PDF
This slide depicts the main difference between the two type of software testing that are traditional and cloud testing. It compare them on the basis of functionality, integration, cost of testing and time invested. Showcasing this set of slides titled Comparative Analysis Of Traditional Vs Cloud Computing Comparative Sample PDF. The topics addressed in these templates are Market Value, Center Decreased, Market Share Around. All the content presented in this PPT design is completely editable. Download it and make adjustments in color, background, font etc. as per your unique business setting.
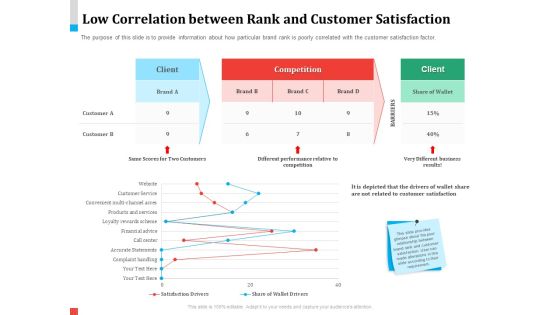
Product Share In Customer Wallet Low Correlation Between Rank And Customer Satisfaction Designs PDF
Deliver an awe inspiring pitch with this creative product share in customer wallet low correlation between rank and customer satisfaction designs pdf bundle. Topics like client, competition, performance, business can be discussed with this completely editable template. It is available for immediate download depending on the needs and requirements of the user.
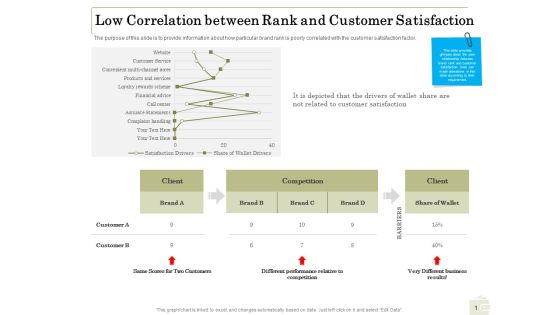
Percentage Share Customer Expenditure Low Correlation Between Rank And Customer Satisfaction Portrait PDF
Presenting this set of slides with name percentage share customer expenditure low correlation between rank and customer satisfaction portrait pdf. The topics discussed in these slides are client, competition, performance, business. This is a completely editable PowerPoint presentation and is available for immediate download. Download now and impress your audience.
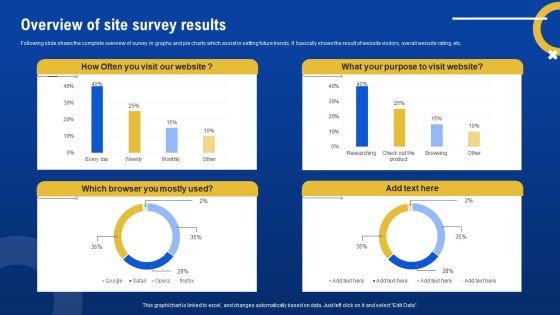
Overview Of Site Survey Results Survey SS
Following slide shows the complete overview of survey in graphs and pie charts which assist in setting future trends. It basically shows the result of website visitors, overall website rating, etc. Pitch your topic with ease and precision using this Overview Of Site Survey Results Survey SS. This layout presents information on Overview, Site Survey Results. It is also available for immediate download and adjustment. So, changes can be made in the color, design, graphics or any other component to create a unique layout.

Monthly Cost Comparative Analysis Of Advertising Expenditure Introduction PDF
This slide represents the bar graph on marketing monthly cost comparative analysis for increasing organisation revenue. It includes methods like online, catalogues, conventions, trade shows, print, radio and magazines Pitch your topic with ease and precision using this Monthly Cost Comparative Analysis Of Advertising Expenditure Introduction PDF This layout presents information on Monthly Cost Comparative Analysis Of Advertising Expenditure It is also available for immediate download and adjustment. So, changes can be made in the color, design, graphics or any other component to create a unique layout.

 Home
Home