Comparison Chart
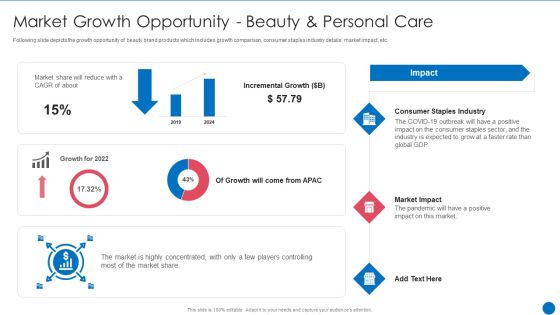
Beauty Care Firm Market Growth Opportunity Beauty And Personal Care Ppt Model Backgrounds PDF
Following slide depicts the growth opportunity of beauty brand products which includes growth comparison, consumer staples industry details, market impact, etc. Deliver an awe inspiring pitch with this creative Beauty Care Firm Market Growth Opportunity Beauty And Personal Care Ppt Model Backgrounds PDF bundle. Topics like Incremental Growth, Market Share, Consumer Staples Industry, Market Impact can be discussed with this completely editable template. It is available for immediate download depending on the needs and requirements of the user.
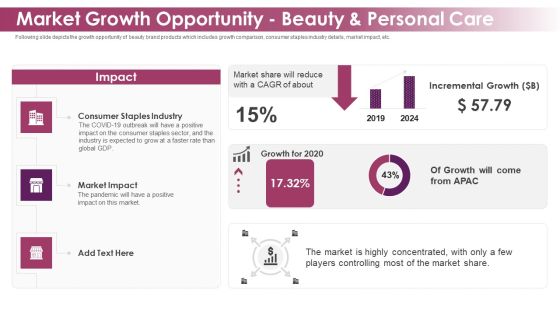
Makeup And Skincare Brand Market Growth Opportunity Beauty And Personal Care Download PDF
Following slide depicts the growth opportunity of beauty brand products which includes growth comparison, consumer staples industry details, market impact, etc. Deliver an awe inspiring pitch with this creative Makeup And Skincare Brand Market Growth Opportunity Beauty And Personal Care Download PDF bundle. Topics like Consumer Staples, Industry Market can be discussed with this completely editable template. It is available for immediate download depending on the needs and requirements of the user.
Fixed Asset Management Dashboard For Tracking Equipment Performance Inspiration PDF
This slide represents fixed asset management dashboard for tracking equipment performance. It includes work management, downtime, work orders etc.Deliver an awe inspiring pitch with this creative Fixed Asset Management Dashboard For Tracking Equipment Performance Inspiration PDF bundle. Topics like Asset Comparison, Labour Analysis, Purchasing Spend can be discussed with this completely editable template. It is available for immediate download depending on the needs and requirements of the user.
Fixed Asset Management Dashboard For Implementing Fixed Asset Tracking Solution Topics PDF
This slide represents fixed asset management dashboard for tracking equipment performance. It includes work management, downtime, work orders etc.Deliver an awe inspiring pitch with this creative Fixed Asset Management Dashboard For Implementing Fixed Asset Tracking Solution Topics PDF bundle. Topics like Asset Comparison, Review Labor, Purchasing Spend can be discussed with this completely editable template. It is available for immediate download depending on the needs and requirements of the user.

Monthly Production Summary Monitoring And Analysis Dashboard Guidelines PDF
The slide shows the monitoring and analysis dashboard of monthly production. The slide covers run-time and down time comparison, production cost of last 12 months, and overall equipment effectiveness. Showcasing this set of slides titled Monthly Production Summary Monitoring And Analysis Dashboard Guidelines PDF. The topics addressed in these templates are Availability, Rework Quantity, Manufacturing Cost. All the content presented in this PPT design is completely editable. Download it and make adjustments in color, background, font etc. as per your unique business setting.
Insurance Claim Procedure Tracking Dashboard Ppt PowerPoint Presentation Show Samples PDF
This slide showcases the insurance claim process tracking dashboard. It includes elements such as claim amount, payout and denied claims and status analysis.Pitch your topic with ease and precision using this Insurance Claim Procedure Tracking Dashboard Ppt PowerPoint Presentation Show Samples PDF. This layout presents information on Amount Comparison, Claim Expense, Assured Amount. It is also available for immediate download and adjustment. So, changes can be made in the color, design, graphics or any other component to create a unique layout.
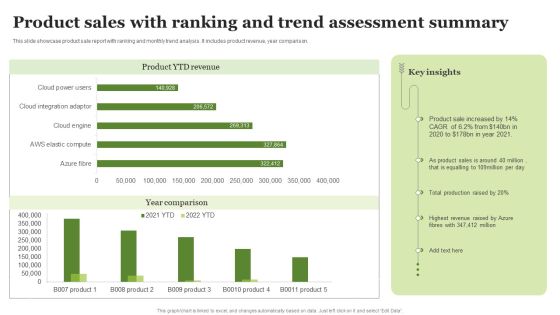
Product Sales With Ranking And Trend Assessment Summary Ppt PowerPoint Presentation Portfolio Images PDF
This slide showcase product sale report with ranking and monthly trend analysis. It includes product revenue, year comparison.Pitch your topic with ease and precision using this Product Sales With Ranking And Trend Assessment Summary Ppt PowerPoint Presentation Portfolio Images PDF. This layout presents information on Highest Revenue, Total Production, Product Sales. It is also available for immediate download and adjustment. So, changes can be made in the color, design, graphics or any other component to create a unique layout.
PowerPoint Themes Diagram Circular Process Ppt Theme
PowerPoint Themes Diagram Circular Process PPT Theme-Highlight the key components of your entire manufacturing/ business process. Illustrate how each element flows seamlessly onto the next stage. Emphasise on any critical or key factors within them. Demonstrate how they all combine to form the final product.-PowerPoint Themes Diagram Circular Process PPT Theme

PowerPoint Template Business Circular Ppt Themes
PowerPoint Template Business Circular PPT Themes-Highlight the key components of your entire manufacturing/ business process. Illustrate how each element flows seamlessly onto the next stage. Emphasise on any critical or key factors within them. Demonstrate how they all combine to form the final product.-PowerPoint Template Business Circular PPT Themes

PowerPoint Templates Leadership Cycle Process Ppt Themes
PowerPoint Templates Leadership Cycle Process PPT Themes-In a cycle diagram, you can explain the main events in the cycle, how they interact, and how the cycle repeats. These Diagrams can be used to interact visually and logically with audiences. Use this graphic to represent a continuing sequence of stages, tasks, or events in a circular flow and emphasize the connection between all components.-PowerPoint Templates Leadership Cycle Process PPT Themes

Ppt Oval 3d Arrows PowerPoint 7 Points Templates
PPT oval 3d arrows powerpoint 7 points Templates-This PowerPoint Diagram consists of seven colorful Arrows forming a circle. It is useful to explain seven different components required in any Business. It signifies constituent, factor, fixings, ingredient, item, making, makings, peripheral, piece, plug-in, segment, unit etc.-PPT oval 3d arrows powerpoint 7 points Templates-Arrow, Business, Circle, Circular, Concept, Cycle, Flow, Four, Graphic, Icon, Illustration, Part, Presentation, Process, Red, Repeat, Repetitive, Round, Symbol, Vector
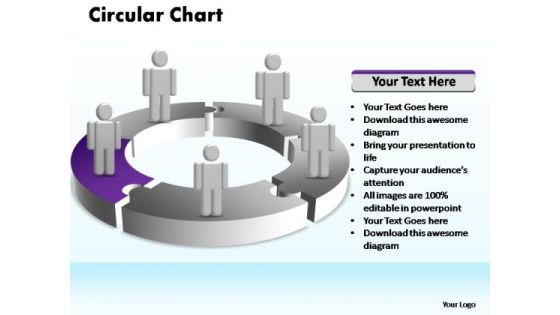
PowerPoint Theme Leadership Circular Ppt Theme
PowerPoint Theme Leadership Circular PPT Theme-Highlight the key components of your entire manufacturing/ business process. Illustrate how each element flows seamlessly onto the next stage. Emphasise on any critical or key factors within them. Demonstrate how they all combine to form the final product.-PowerPoint Theme Leadership Circular PPT Theme

PowerPoint Theme Editable Circular Process Ppt Backgrounds
PowerPoint Theme Editable Circular Process PPT Backgrounds-Highlight the key components of your entire manufacturing/ business process. Illustrate how each element flows seamlessly onto the next stage. Emphasise on any critical or key factors within them. Demonstrate how they all combine to form the final product.-PowerPoint Theme Editable Circular Process PPT Backgrounds

PowerPoint Theme Growth Circular Process Ppt Slide
PowerPoint Theme Growth Circular Process PPT Slide-Highlight the key components of your entire manufacturing/ business process. Illustrate how each element flows seamlessly onto the next stage. Emphasise on any critical or key factors within them. Demonstrate how they all combine to form the final product.-PowerPoint Theme Growth Circular Process PPT Slide

PowerPoint Theme Leadership Circular Process Ppt Layout
PowerPoint Theme Leadership Circular Process PPT Layout-Highlight the key components of your entire manufacturing/ business process. Illustrate how each element flows seamlessly onto the next stage. Emphasise on any critical or key factors within them. Demonstrate how they all combine to form the final product.-PowerPoint Theme Leadership Circular Process PPT Layout
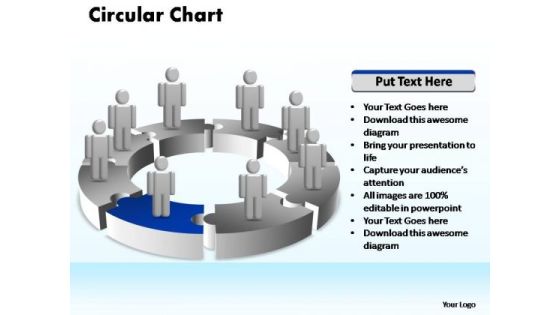
PowerPoint Template Business Circular Ppt Slide Designs
PowerPoint Template Business Circular PPT Slide Designs-Highlight the key components of your entire manufacturing/ business process. Illustrate how each element flows seamlessly onto the next stage. Emphasise on any critical or key factors within them. Demonstrate how they all combine to form the final product.-PowerPoint Template Business Circular PPT Slide Designs

PowerPoint Template Leadership Circular Ppt Presentation
PowerPoint Template Leadership Circular PPT Presentation-Highlight the key components of your entire manufacturing/ business process. Illustrate how each element flows seamlessly onto the next stage. Emphasise on any critical or key factors within them. Demonstrate how they all combine to form the final product.-PowerPoint Template Leadership Circular PPT Presentation

Ppt Blue Quadrant Circular Nursing Process PowerPoint Presentation Templates
PPT blue quadrant circular nursing process powerpoint presentation Templates-Use this graphic to represent a continuing sequence of stages, tasks, or events in a circular flow and emphasize the connection between all components. You can apply other 3D Styles and shapes to the slide to enhance your presentations.-PPT blue quadrant circular nursing process powerpoint presentation Templates-adhesive, advertisement, advertising, background, blue, buttons, circle, colorful, corner, curl, cutout, design, element, glossy, green, illustration, information, label, marketing, paper, peeled, prices, promotional, quadrant, red, round, star, sticker, sticky, symbols, tags, up, vector

PowerPoint Slides Company Circular Ppt Slide Layout
PowerPoint Slides Company Circular PPT Slide layout-Highlight the key components of your entire manufacturing/ business process. Illustrate how each element flows seamlessly onto the next stage. Emphasise on any critical or key factors within them. Demonstrate how they all combine to form the final product.-PowerPoint Slides Company Circular PPT Slide layout
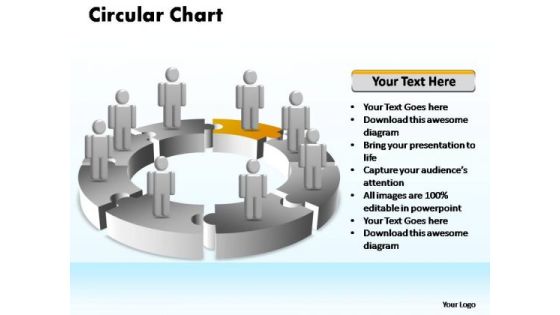
PowerPoint Slides Leadership Circular Ppt Slide Designs
PowerPoint Slides Leadership Circular PPT Slide Designs-Highlight the key components of your entire manufacturing/ business process. Illustrate how each element flows seamlessly onto the next stage. Emphasise on any critical or key factors within them. Demonstrate how they all combine to form the final product.-PowerPoint Slides Leadership Circular PPT Slide Designs

PowerPoint Slides Sales Circular Ppt Presentation
PowerPoint Slides Sales Circular PPT Presentation-Highlight the key components of your entire manufacturing/ business process. Illustrate how each element flows seamlessly onto the next stage. Emphasise on any critical or key factors within them. Demonstrate how they all combine to form the final product.-PowerPoint Slides Sales Circular PPT Presentation

PowerPoint Slides Sales Circular Ppt Slide Layout
PowerPoint Slides Sales Circular PPT Slide layout-Highlight the key components of your entire manufacturing/ business process. Illustrate how each element flows seamlessly onto the next stage. Emphasise on any critical or key factors within them. Demonstrate how they all combine to form the final product.-PowerPoint Slides Sales Circular PPT Slide layout
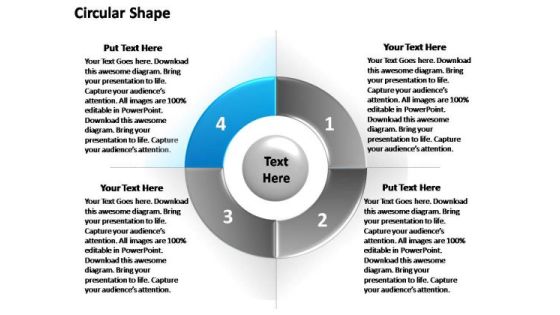
PowerPoint Process Graphic Circular Ppt Slides
PowerPoint Process Graphic Circular PPT Slides-Highlight the key components of your entire manufacturing/ business process. Illustrate how each element flows seamlessly onto the next stage. Emphasise on any critical or key factors within them. Demonstrate how they all combine to form the final product.-PowerPoint Process Graphic Circular PPT Slides

PowerPoint Slides Teamwork Cycle Process Ppt Slide Designs
PowerPoint Slides Teamwork Cycle Process PPT Slide Designs-In a cycle diagram, you can explain the main events in the cycle, how they interact, and how the cycle repeats. These Diagrams can be used to interact visually and logically with audiences. Use this graphic to represent a continuing sequence of stages, tasks, or events in a circular flow and emphasize the connection between all components.-PowerPoint Slides Teamwork Cycle Process PPT Slide Designs

PowerPoint Slide Designs Success Business Cycle Ppt Design
PowerPoint Slide Designs Success Business Cycle PPT Design-In a cycle diagram, you can explain the main events in the cycle, how they interact, and how the cycle repeats. These Diagrams can be used to interact visually and logically with audiences. Use this graphic to represent a continuing sequence of stages, tasks, or events in a circular flow and emphasize the connection between all components.-PowerPoint Slide Designs Success Business Cycle PPT Design

PowerPoint Slide Growth Business Cycle Ppt Design
PowerPoint Slide Growth Business Cycle PPT Design-In a cycle diagram, you can explain the main events in the cycle, how they interact, and how the cycle repeats. These Diagrams can be used to interact visually and logically with audiences. Use this graphic to represent a continuing sequence of stages, tasks, or events in a circular flow and emphasize the connection between all components.-PowerPoint Slide Growth Business Cycle PPT Design
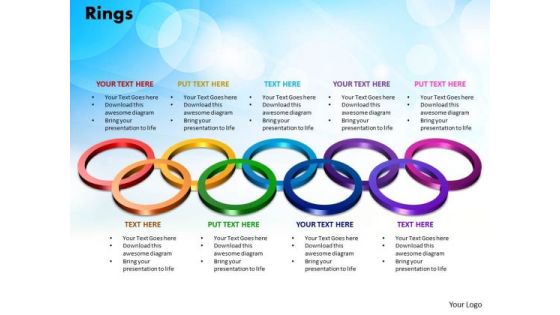
PowerPoint Slides Rings Business Ppt Slides
PowerPoint Slides Rings Business PPT Slides-This brilliant PowerPoint Diagram will help your students become more familiar with the Olympic rings logo and the association with physical exercise, participation, and working together. A series of PowerPoint master slides for preparing presentations with an Olympics theme - the Olympic rings feature in these slides which can be used by teachers or students when preparing presentations.-PowerPoint Slides Rings Business PPT Slides

Solution Monitoring Verification Solution Assessment Risk Severity Matrix Themes PDF
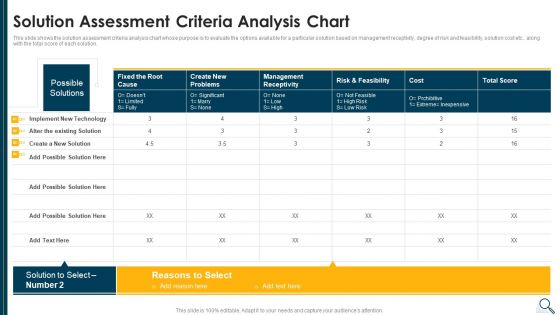
This slide shows the solution assessment criteria analysis chart whose purpose is to evaluate the options available for a particular solution based on management receptivity, degree of risk and feasibility, solution cost etc.. along with the total score of each solution. Deliver and pitch your topic in the best possible manner with this solution monitoring verification solution assessment risk severity matrix themes pdf. Use them to share invaluable insights on solution assessment criteria analysis chart and impress your audience. This template can be altered and modified as per your expectations. So, grab it now.
Solution Evaluation Criteria Assessment And Threat Impact Matrix Solution Assessment Criteria Themes PDF
This slide shows the solution assessment criteria analysis chart whose purpose is to evaluate the options available for a particular solution based on management receptivity, degree of risk and feasibility, solution cost etc. along with the total score of each solution. Deliver an awe inspiring pitch with this creative solution evaluation criteria assessment and threat impact matrix solution assessment criteria themes pdf bundle. Topics like solution assessment criteria analysis chart can be discussed with this completely editable template. It is available for immediate download depending on the needs and requirements of the user.
New Brand Introduction Plan Choose Brand Personality Traits Summary PDF
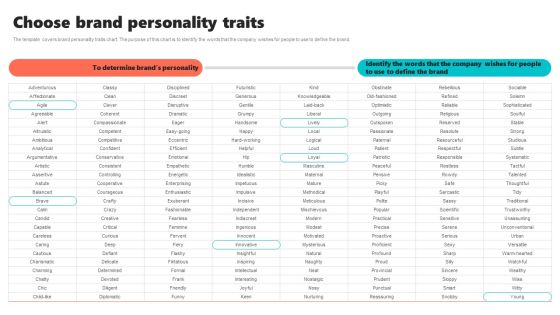
The template covers brand personality traits chart. The purpose of this chart is to Identify the words that the company wishes for people to use to define the brand.Want to ace your presentation in front of a live audience Our New Brand Introduction Plan Choose Brand Personality Traits Summary PDF can help you do that by engaging all the users towards you. Slidegeeks experts have put their efforts and expertise into creating these impeccable powerpoint presentations so that you can communicate your ideas clearly. Moreover, all the templates are customizable, and easy-to-edit and downloadable. Use these for both personal and commercial use.
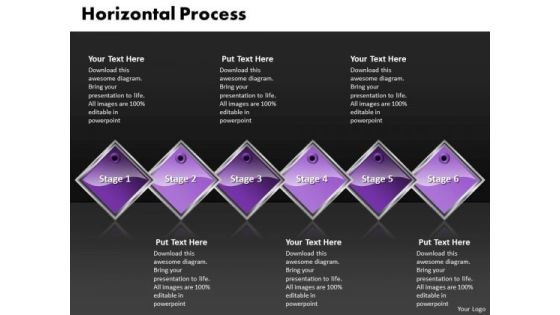
Ppt Purple Diamond Horizontal Flow 6 Create PowerPoint Macro Templates
PPT purple diamond horizontal flow 6 create powerpoint macro Templates-Use this Diamond based Chart Diagram to explore six stages of a Linear Process. This chart visualize the process steps, reoccurrences and components or of your company structure or product features. Adjust the above image in your PPT presentations to visually support your content in your Business, Process and Financial PPT slideshows. Deliver amazing presentations to mesmerize your audience with this Diagram.-PPT purple diamond horizontal flow 6 create powerpoint macro Templates-Advertise, Advertisement, Badge, Box, Business, Card, Collection, Column, Corporate, Costing, Counting, Design, Discount, Element, Featured, Finance, Grid, Hosting, Information, List, Message, Placard, Plan, Price, Pricing, Rectangle, Report, Round
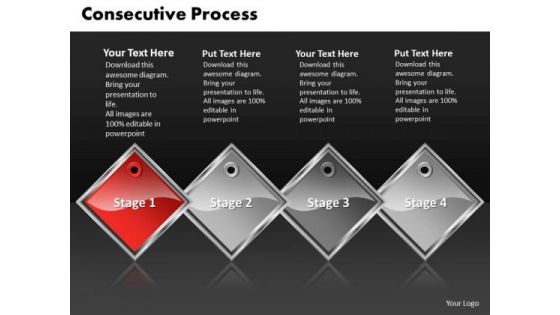
Ppt Red Diamond Consecutive Action 4 Create PowerPoint Macro Templates
PPT red diamond consecutive action 4 create powerpoint macro Templates-Use this Diamond based Operation Chart Diagram to explore four stages of a Linear Process. This chart visualize the process steps, reoccurrences and components or of your company structure or product features. Deliver amazing presentations to mesmerize your audience with this Diagram.-PPT red diamond consecutive action 4 create powerpoint macro Templates-Advertise, Advertisement, Badge, Box, Business, Card, Collection, Column, Corporate, Costing, Counting, Design, Discount, Element, Featured, Finance, Grid, Hosting, Information, List, Message, Placard, Plan, Price, Pricing, Rectangle, Report, Round
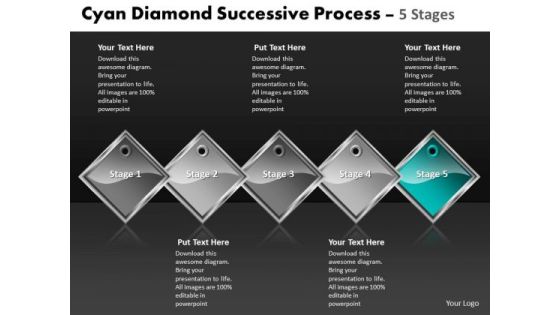
Ppt Cyan Diamond Successive Forging Process PowerPoint Slides 5 Stages Business Templates
PPT cyan diamond successive forging process powerpoint slides 5 stages Business Templates-Use this Diamond based Operation Chart Diagram to explore five stages of a Linear Process. This chart visualize the process steps, reoccurrences and components or of your company structure or product features. Deliver amazing presentations to mesmerize your audience with this Diagram.-PPT cyan diamond successive forging process powerpoint slides 5 stages Business Templates-Advertise, Advertisement, Badge, Box, Business, Card, Collection, Column, Corporate, Costing, Counting, Design, Discount, Element, Featured, Finance, Grid, Hosting, Information, List, Message, Placard, Plan, Price, Pricing, Rectangle, Report, Round
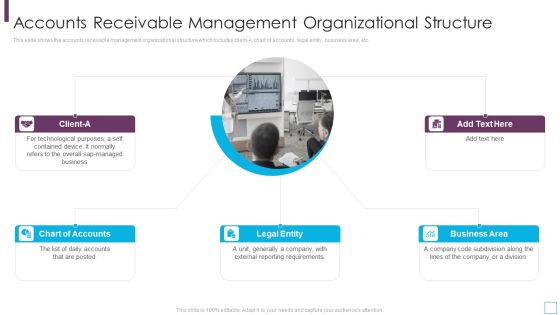
Key Strategies For Account Receivable Management Organizational Structure Infographics PDF
This slide shows the accounts receivable management organizational structure which includes client-A, chart of accounts, legal entity, business area, etc.This is a key strategies for account receivable management organizational structure infographics pdf template with various stages. Focus and dispense information on five stages using this creative set, that comes with editable features. It contains large content boxes to add your information on topics like chart of accounts, business area, external reporting requirements You can also showcase facts, figures, and other relevant content using this PPT layout. Grab it now.
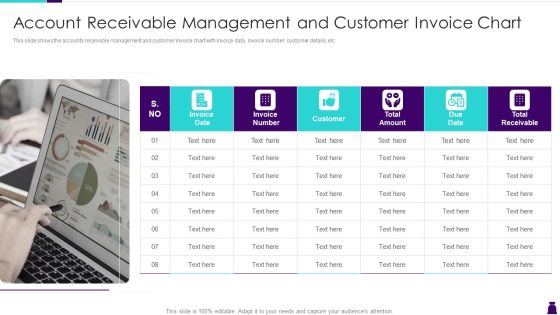
Managing Accounts Receivables For Positive Cash Flow Account Receivable Management Summary PDF
This slide shows the accounts receivable management and customer invoice chart with invoice data, invoice number, customer details, etc.This is a managing accounts receivables for positive cash flow account receivable management summary pdf template with various stages. Focus and dispense information on one stage using this creative set, that comes with editable features. It contains large content boxes to add your information on topics like account receivable management and customer invoice chart You can also showcase facts, figures, and other relevant content using this PPT layout. Grab it now.

Managing Accounts Receivables For Positive Cash Flow Accounts Receivable Management Inspiration PDF
This slide shows the accounts receivable management organizational structure which includes client-A, chart of accounts, legal entity, business area, etc.This is a managing accounts receivables for positive cash flow accounts receivable management inspiration pdf template with various stages. Focus and dispense information on five stages using this creative set, that comes with editable features. It contains large content boxes to add your information on topics like chart of accounts, business area, legal entity You can also showcase facts, figures, and other relevant content using this PPT layout. Grab it now.

6 Year Revenue Declining Graph Ppt PowerPoint Presentation Outline Sample PDF
This slide shows the revenues of the company over the last years to have a clear idea of organization growth and financial status . It includes the 6 year 2017 to 2022 revenue earned by the company.Showcasing this set of slides titled 6 Year Revenue Declining Graph Ppt PowerPoint Presentation Outline Sample PDF. The topics addressed in these templates are Revenue Company, Highest Comparison, Conditions Restrictions. All the content presented in this PPT design is completely editable. Download it and make adjustments in color, background, font etc. as per your unique business setting.

Shareholder Governance Enhance Comprehensive Corporate Performance Shareholder Information Dividend Introduction PDF
This slide shows the shareholder information of the company that provides information on shareholding sizes and geographical concentration. Also, this slide provides information on the dividend criteria of the company. Deliver and pitch your topic in the best possible manner with this shareholder governance enhance comprehensive corporate performance shareholder information dividend introduction pdf. Use them to share invaluable insights on shareholding, concentration, comparison, payment, progressive and impress your audience. This template can be altered and modified as per your expectations. So, grab it now.

Action Plan To Enhance Customer Engagement Analytical Dashboard Elements PDF
This slide shows customer engagement analytical dashboard that covers total sales, total transaction, email received, links clicked, unique customer sales, sales comparison, customers name, product list. Present like a pro with Action Plan To Enhance Customer Engagement Analytical Dashboard Elements PDF Create beautiful presentations together with your team, using our easy-to-use presentation slides. Share your ideas in real-time and make changes on the fly by downloading our templates. So whether youre in the office, on the go, or in a remote location, you can stay in sync with your team and present your ideas with confidence. With Slidegeeks presentation got a whole lot easier. Grab these presentations today.
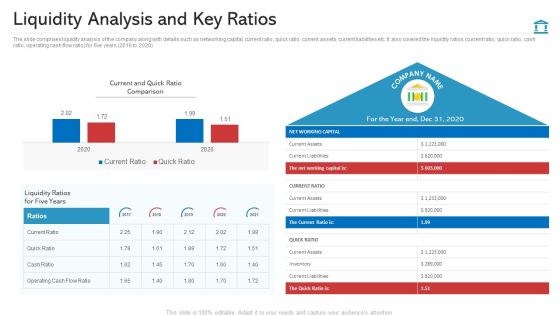
Liquidity Analysis And Key Ratios Structure PDF
The slide comprises liquidity analysis of the company along with details such as networking capital, current ratio, quick ratio, current assets, current liabilities etc. It also covered the liquidity ratios current ratio, quick ratio, cash ratio, operating cash flow ratio for five years 2016 to 2020 Deliver and pitch your topic in the best possible manner with this liquidity analysis and key ratios structure pdf. Use them to share invaluable insights on net working capital, current and quick ratio comparison, current liabilities and impress your audience. This template can be altered and modified as per your expectations. So, grab it now.
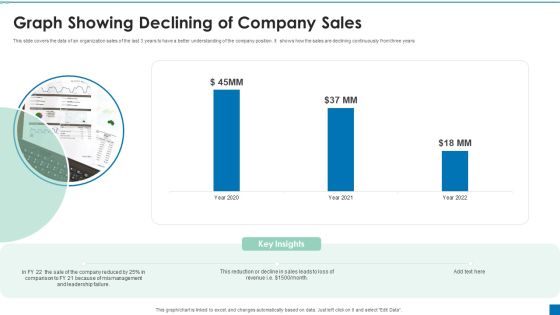
Graph Showing Declining Of Company Sales Ppt PowerPoint Presentation Portfolio Graphics Example PDF
This slide covers the data of an organization sales of the last 3 years to have a better understanding of the company position. It shows how the sales are declining continuously from three years.Pitch your topic with ease and precision using this Graph Showing Declining Of Company Sales Ppt PowerPoint Presentation Portfolio Graphics Example PDF. This layout presents information on Reduction Decline, Comparison, Mismanagement. It is also available for immediate download and adjustment. So, changes can be made in the color, design, graphics or any other component to create a unique layout.
Sales Performance Monthly Strategy Dashboard Icons PDF
Below slide showcases the monthly dashboard of sales performance . Company can measure and evaluate their monthly sales performance using key factors that are sales comparison, monthly sales, planned vs actual sales and gross margin by Pitch your topic with ease and precision using this sales performance monthly strategy dashboard icons pdf. This layout presents information on sales performance monthly strategy dashboard. It is also available for immediate download and adjustment. So, changes can be made in the color, design, graphics or any other component to create a unique layout.
Performance Analysis Of New Product Development Product Performance Dashboards Icons PDF
The following slide displays the dashboard which highlights the performance of the product, multiple metrics such as Revenues, New customer, gross profit, customer satisfaction and global sales breakdown. Deliver and pitch your topic in the best possible manner with this performance analysis of new product development product performance dashboards icons pdf. Use them to share invaluable insights on revenue, sales comparison, customer satisfaction, gross profit, new customers, sale by product category and impress your audience. This template can be altered and modified as per your expectations. So, grab it now.

Dual Branding Campaign To Boost Sales Of Product Or Services Dashboard For Dual Branding Campaign Performance Infographics PDF
This slide showcases dashboard that can help organization to measure performance after launching dual branding campaign. Its key components are sales comparison, revenue by client, revenue by source and new customers by source. The best PPT templates are a great way to save time, energy, and resources. Slidegeeks have 100 percent editable powerpoint slides making them incredibly versatile. With these quality presentation templates, you can create a captivating and memorable presentation by combining visually appealing slides and effectively communicating your message. Download Dual Branding Campaign To Boost Sales Of Product Or Services Dashboard For Dual Branding Campaign Performance Infographics PDF from Slidegeeks and deliver a wonderful presentation.

Inspecting Sales Optimization Areas Sales Analysis Dashboard To Measure Performance Demonstration PDF
This slide showcases a dashboard presenting various metrics to measure and analyze sales performance for revenue growth. It includes key components such as number of annual new customer, sales revenue, customer satisfaction, customer acquisition cost, product wise sales, month wise sales and sales comparison. From laying roadmaps to briefing everything in detail, our templates are perfect for you. You can set the stage with your presentation slides. All you have to do is download these easy-to-edit and customizable templates. Inspecting Sales Optimization Areas Sales Analysis Dashboard To Measure Performance Demonstration PDF will help you deliver an outstanding performance that everyone would remember and praise you for. Do download this presentation today.
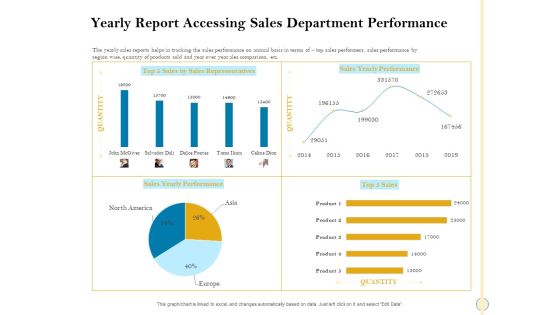
Sales Optimization Best Practices To Close More Deals Yearly Report Accessing Sales Department Performance Download PDF
The yearly sales reports helps in tracking the sales performance on annual basis in terms of top sales performers, sales performance by region wise, quantity of products sold and year over year ales comparison, etc. Deliver an awe inspiring pitch with this creative sales optimization best practices to close more deals yearly report accessing sales department performance download pdf bundle. Topics like yearly report accessing sales department performance can be discussed with this completely editable template. It is available for immediate download depending on the needs and requirements of the user.

Sales Assistance Boost Overall Efficiency Yearly Report Accessing Sales Department Performance Rules PDF
The yearly sales reports helps in tracking the sales performance on annual basis in terms of top sales performers, sales performance by region wise, quantity of products sold and year over year ales comparison, etc. Deliver an awe-inspiring pitch with this creative sales assistance boost overall efficiency yearly report accessing sales department performance rules pdf bundle. Topics like yearly report accessing sales department performance can be discussed with this completely editable template. It is available for immediate download depending on the needs and requirements of the user.
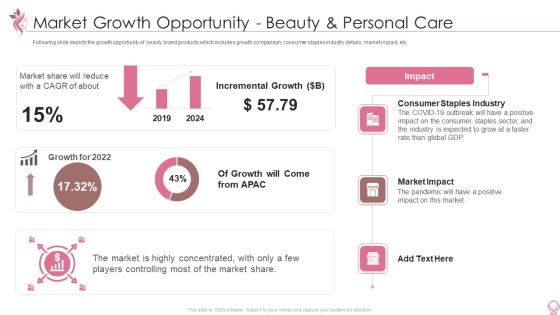
Cosmetics And Personal Care Venture Startup Market Growth Opportunity Beauty And Personal Care Download PDF Brochure PDF
Following slide depicts the growth opportunity of beauty brand products which includes growth comparison, consumer staples industry details, market impact, etc. Deliver and pitch your topic in the best possible manner with this cosmetics and personal care venture startup market growth opportunity beauty and personal care download pdf brochure pdf. Use them to share invaluable insights on market share, growth for 2022, consumer staples industry, market impact, incremental growth and impress your audience. This template can be altered and modified as per your expectations. So, grab it now.
Developing Significant Business Product And Customer Performance Tracking Clipart PDF
This slide provides information regarding dashboard utilized by firm to monitor performance of products offered and customer associated. The performance is tracked through revenues generated, new customer acquired, customer satisfaction, sales comparison, etc. Deliver and pitch your topic in the best possible manner with this Developing Significant Business Product And Customer Performance Tracking Clipart PDF. Use them to share invaluable insights on Revenue, New Customer, Revenue and impress your audience. This template can be altered and modified as per your expectations. So, grab it now.

Employee Payroll Compensation And Salary Dashboard With Expenses Professional PDF
The following slide showcases payroll and compensation dashboard to assist HR team analyze and track important KPIs. The dashboard depicts expenses , items processed and compensation comparison. Showcasing this set of slides titled Employee Payroll Compensation And Salary Dashboard With Expenses Professional PDF. The topics addressed in these templates are Employee Payroll Compensation, Salary Dashboard With Expenses. All the content presented in this PPT design is completely editable. Download it and make adjustments in color, background, font etc. as per your unique business setting.
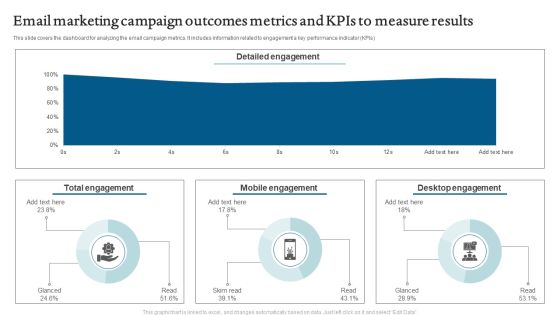
Email Marketing Campaign Outcomes Metrics And Kpis To Measure Results Rules PDF
This slide depicts the dashboard for analyzing the results of email campaign and social media marketing. It includes information related to the comparison, statistics, usage, etc. Showcasing this set of slides titled Email Marketing Campaign Outcomes Metrics And Kpis To Measure Results Rules PDF. The topics addressed in these templates are Detailed Engagement, Mobile Engagement, Desktop Engagement. All the content presented in this PPT design is completely editable. Download it and make adjustments in color, background, font etc. as per your unique business setting.

Kpi Dashboard To Track Progress Of Tactics To Launch New Product Infographics PDF
Mentioned slide showcases KPI dashboard to monitor impact of product launch strategy on increasing business market share. It includes elements such as revenue, new customers, lead generation rate, customer satisfaction rate, revenue by customers, revenue and lead generation by marketing platform. Showcasing this set of slides titled Kpi Dashboard To Track Progress Of Tactics To Launch New Product Infographics PDF. The topics addressed in these templates are Quarterly Sales Comparison, Revenue Marketing, Revenue Customers. All the content presented in this PPT design is completely editable. Download it and make adjustments in color, background, font etc. as per your unique business setting.
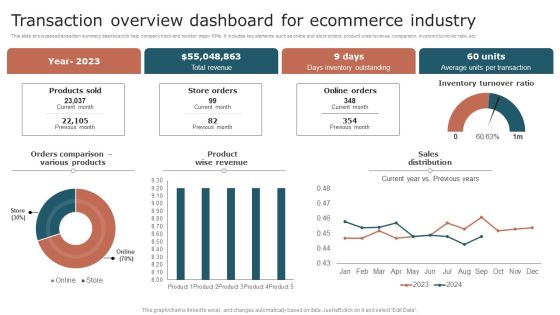
Transaction Overview Dashboard For Ecommerce Industry Summary PDF
This slide showcases transaction summary dashboard to help company track and monitor major KPIs. It includes key elements such as online and store orders, product wise revenue, comparison, inventory turnover ratio, etc. Pitch your topic with ease and precision using this Transaction Overview Dashboard For Ecommerce Industry Summary PDF. This layout presents information on Revenue, Inventory Outstanding, Transaction. It is also available for immediate download and adjustment. So, changes can be made in the color, design, graphics or any other component to create a unique layout.
Online Shopping Survey Outcome In Percentage Icons PDF
The slide showcases percentage results to analyze experience of online shopping to identify areas for enhancing shopping experience. It includes key elements such as reasons for online shopping, elements considered by customers and shopping platforms. Pitch your topic with ease and precision using this Online Shopping Survey Outcome In Percentage Icons PDF. This layout presents information on Price Comparison, Product Information, Online Reviews. It is also available for immediate download and adjustment. So, changes can be made in the color, design, graphics or any other component to create a unique layout.

Business Unit Valuation And Development Dashboard Ppt Professional Graphic Tips PDF
This slide shows key performance indicators dashboard which represents number of assets along with their stages of development. It also includes estimated development cost and production index comparison. Pitch your topic with ease and precision using this Business Unit Valuation And Development Dashboard Ppt Professional Graphic Tips PDF. This layout presents information on Estimated Development Cost, Production Index, Development Stage. It is also available for immediate download and adjustment. So, changes can be made in the color, design, graphics or any other component to create a unique layout.

Email Marketing Campaign Outcomes And Social Media Marketing Result Analysis Dashboard Mockup PDF
This slide depicts the dashboard for analyzing the results of email campaign and social media marketing. It includes information related to the comparison, statistics, usage, etc. Pitch your topic with ease and precision using this Email Marketing Campaign Outcomes And Social Media Marketing Result Analysis Dashboard Mockup PDF. This layout presents information on Email Marketing Campaign, Outcomes And Social Media, Marketing Result, Analysis Dashboard. It is also available for immediate download and adjustment. So, changes can be made in the color, design, graphics or any other component to create a unique layout.
Product And Customer Performance Tracking Dashboard Summary PDF
This slide provides information regarding dashboard utilized by firm to monitor performance of products offered and customer associated. The performance is tracked through revenues generated, new customer acquired, customer satisfaction, sales comparison, etc. If you are looking for a format to display your unique thoughts, then the professionally designed Product And Customer Performance Tracking Dashboard Summary PDF is the one for you. You can use it as a Google Slides template or a PowerPoint template. Incorporate impressive visuals, symbols, images, and other charts. Modify or reorganize the text boxes as you desire. Experiment with shade schemes and font pairings. Alter, share or cooperate with other people on your work. Download Product And Customer Performance Tracking Dashboard Summary PDF and find out how to give a successful presentation. Present a perfect display to your team and make your presentation unforgettable.

Dashboard For Dual Branding Campaign Performance Dual Branding Marketing Campaign Diagrams PDF
This slide showcases dashboard that can help organization to measure performance after launching dual branding campaign. Its key components are sales comparison, revenue by client, revenue by source and new customers by source. Here you can discover an assortment of the finest PowerPoint and Google Slides templates. With these templates, you can create presentations for a variety of purposes while simultaneously providing your audience with an eye-catching visual experience. Download Dashboard For Dual Branding Campaign Performance Dual Branding Marketing Campaign Diagrams PDF to deliver an impeccable presentation. These templates will make your job of preparing presentations much quicker, yet still, maintain a high level of quality. Slidegeeks has experienced researchers who prepare these templates and write high-quality content for you. Later on, you can personalize the content by editing the Dashboard For Dual Branding Campaign Performance Dual Branding Marketing Campaign Diagrams PDF.
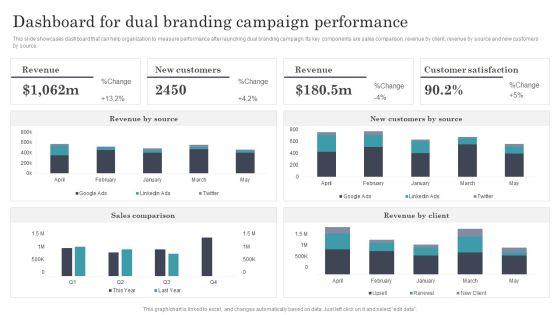
Developing Dual Branding Campaign For Brand Marketing Dashboard For Dual Branding Campaign Performance Ideas PDF
This slide showcases dashboard that can help organization to measure performance after launching dual branding campaign. Its key components are sales comparison, revenue by client, revenue by source and new customers by source. Boost your pitch with our creative Developing Dual Branding Campaign For Brand Marketing Dashboard For Dual Branding Campaign Performance Ideas PDF. Deliver an awe inspiring pitch that will mesmerize everyone. Using these presentation templates you will surely catch everyones attention. You can browse the ppts collection on our website. We have researchers who are experts at creating the right content for the templates. So you do not have to invest time in any additional work. Just grab the template now and use them.

Dashboard For Dual Branding Campaign Performance Dual Branding Campaign For Product Promotion Portrait PDF
This slide showcases dashboard that can help organization to measure performance after launching dual branding campaign. Its key components are sales comparison, revenue by client, revenue by source and new customers by source.Slidegeeks is here to make your presentations a breeze with Dashboard For Dual Branding Campaign Performance Dual Branding Campaign For Product Promotion Portrait PDF With our easy-to-use and customizable templates, you can focus on delivering your ideas rather than worrying about formatting. With a variety of designs to choose from, you are sure to find one that suits your needs. And with animations and unique photos, illustrations, and fonts, you can make your presentation pop. So whether you are giving a sales pitch or presenting to the board, make sure to check out Slidegeeks first.

 Home
Home