Comparison Chart
Product And Customer Performance Tracking Dashboard Techniques For Crafting Killer Background PDF
This slide provides information regarding dashboard utilized by firm to monitor performance of products offered and customer associated. The performance is tracked through revenues generated, new customer acquired, customer satisfaction, sales comparison, etc. This Product And Customer Performance Tracking Dashboard Techniques For Crafting Killer Background PDF is perfect for any presentation, be it in front of clients or colleagues. It is a versatile and stylish solution for organizing your meetings. The Product And Customer Performance Tracking Dashboard Techniques For Crafting Killer Background PDF features a modern design for your presentation meetings. The adjustable and customizable slides provide unlimited possibilities for acing up your presentation. Slidegeeks has done all the homework before launching the product for you. So, do not wait, grab the presentation templates today
Implementing Effective Strategy Product And Customer Performance Tracking Sample PDF
This slide provides information regarding dashboard utilized by firm to monitor performance of products offered and customer associated. The performance is tracked through revenues generated, new customer acquired, customer satisfaction, sales comparison, etc. This Implementing Effective Strategy Product And Customer Performance Tracking Sample PDF from Slidegeeks makes it easy to present information on your topic with precision. It provides customization options, so you can make changes to the colors, design, graphics, or any other component to create a unique layout. It is also available for immediate download, so you can begin using it right away. Slidegeeks has done good research to ensure that you have everything you need to make your presentation stand out. Make a name out there for a brilliant performance.
Product And Customer Performance Tracking Dashboard Portrait PDF
This slide provides information regarding dashboard utilized by firm to monitor performance of products offered and customer associated. The performance is tracked through revenues generated, new customer acquired, customer satisfaction, sales comparison, etc. Do you have an important presentation coming up Are you looking for something that will make your presentation stand out from the rest Look no further than Product And Customer Performance Tracking Dashboard Portrait PDF. With our professional designs, you can trust that your presentation will pop and make delivering it a smooth process. And with Slidegeeks, you can trust that your presentation will be unique and memorable. So why wait Grab Product And Customer Performance Tracking Dashboard Portrait PDF today and make your presentation stand out from the rest.

Critical Initiatives To Deploy Product And Customer Performance Tracking Dashboard Guidelines PDF
This slide provides information regarding dashboard utilized by firm to monitor performance of products offered and customer associated. The performance is tracked through revenues generated, new customer acquired, customer satisfaction, sales comparison, etc. Do you have an important presentation coming up Are you looking for something that will make your presentation stand out from the rest Look no further than Critical Initiatives To Deploy Product And Customer Performance Tracking Dashboard Guidelines PDF. With our professional designs, you can trust that your presentation will pop and make delivering it a smooth process. And with Slidegeeks, you can trust that your presentation will be unique and memorable. So why wait Grab Critical Initiatives To Deploy Product And Customer Performance Tracking Dashboard Guidelines PDF today and make your presentation stand out from the rest.

IOT Industry Assessment Competitor Analysis By Features Ppt Professional Gallery PDF
Mentioned radar chart shows competitor analysis based on features, user interface and support offered by own company and competitors. Deliver and pitch your topic in the best possible manner with this iot industry assessment competitor analysis by features ppt professional gallery pdf. Use them to share invaluable insights on features, user interface, support and impress your audience. This template can be altered and modified as per your expectations. So, grab it now.

Components Of Integrated Solid Waste Administration In Municipal Corporation Structure PDF
This slide shows the pie chart representing the elements of management of solid waste in municipal corporation. It includes waste in the form of glass, rags, plastic, metals etc. Showcasing this set of slides titled Components Of Integrated Solid Waste Administration In Municipal Corporation Structure PDF. The topics addressed in these templates are Integrated, Administration, Corporation. All the content presented in this PPT design is completely editable. Download it and make adjustments in color, background, font etc. as per your unique business setting.
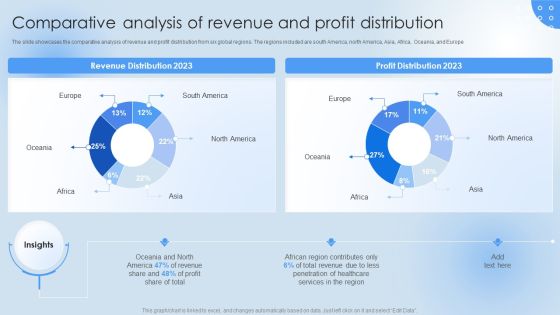
Pharmaceutical Company Financial Summary Comparative Analysis Of Revenue Elements PDF
The slide showcases the comparative analysis of revenue and profit distribution from six global regions. The regions included are south America, north America, Asia, Africa, Oceania, and Europe. The Pharmaceutical Company Financial Summary Comparative Analysis Of Revenue Elements PDF is a compilation of the most recent design trends as a series of slides. It is suitable for any subject or industry presentation, containing attractive visuals and photo spots for businesses to clearly express their messages. This template contains a variety of slides for the user to input data, such as structures to contrast two elements, bullet points, and slides for written information. Slidegeeks is prepared to create an impression.
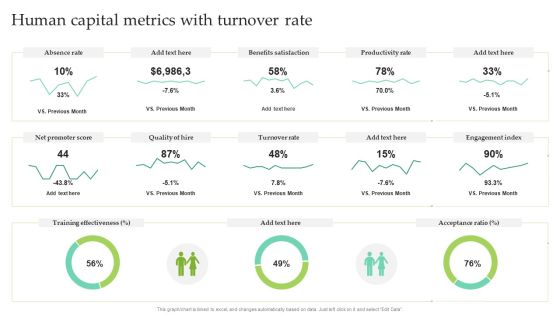
Human Capital Metrics With Turnover Rate Ppt Pictures Outline PDF
This graph or chart is linked to excel, and changes automatically based on data. Just left click on it and select Edit Data. Pitch your topic with ease and precision using this Human Capital Metrics With Turnover Rate Ppt Pictures Outline PDF. This layout presents information on Absence Rate, Benefits Satisfaction, Productivity Rate. It is also available for immediate download and adjustment. So, changes can be made in the color, design, graphics or any other component to create a unique layout.

Manufacturing Productivity Analysis Bar Graph Introduction PDF
This slide illustrates the productivity chart of manufacturing of a company. It includes quantity produced in million units against the time period. Pitch your topic with ease and precision using this Manufacturing Productivity Analysis Bar Graph Introduction PDF. This layout presents information on Manufacturing Productivity, Production Decreased, Closure Of Companies. It is also available for immediate download and adjustment. So, changes can be made in the color, design, graphics or any other component to create a unique layout.

Carbon Emissions Of Countries Bar Graph Professional PDF
This slide depicts emissions chart of various countries to avoid the worst impacts of climate change. It includes countries and carbon emissions in million metric tons. Pitch your topic with ease and precision using this Carbon Emissions Of Countries Bar Graph Professional PDF. This layout presents information on Maximum Production, Consumer Goods, Carbon Emissions. It is also available for immediate download and adjustment. So, changes can be made in the color, design, graphics or any other component to create a unique layout.
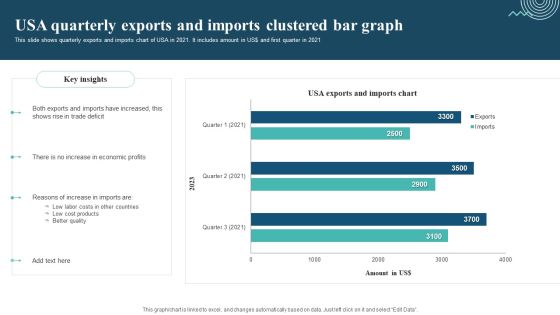
Usa Quarterly Exports And Imports Clustered Bar Graph Designs PDF
This slide shows quarterly exports and imports chart of USA in 2021. It includes amount in US dollar and first quarter in 2021. Pitch your topic with ease and precision using this Usa Quarterly Exports And Imports Clustered Bar Graph Designs PDF. This layout presents information on Exports And Imports, Trade Deficit, Economic Profits. It is also available for immediate download and adjustment. So, changes can be made in the color, design, graphics or any other component to create a unique layout.
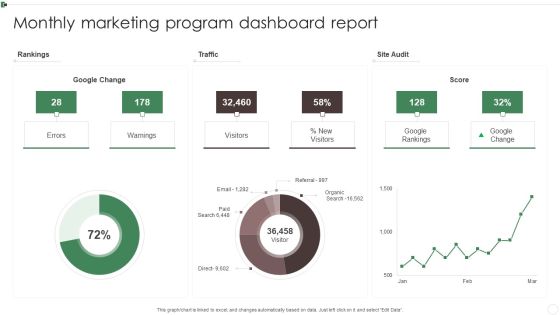
Monthly Marketing Program Dashboard Report Ppt Inspiration Information PDF
This graph or chart is linked to excel, and changes automatically based on data. Just left click on it and select Edit Data. Pitch your topic with ease and precision using this Monthly Marketing Program Dashboard Report Ppt Inspiration Information PDF. This layout presents information on Rankings, Traffic, Site Audit, Warnings. It is also available for immediate download and adjustment. So, changes can be made in the color, design, graphics or any other component to create a unique layout.
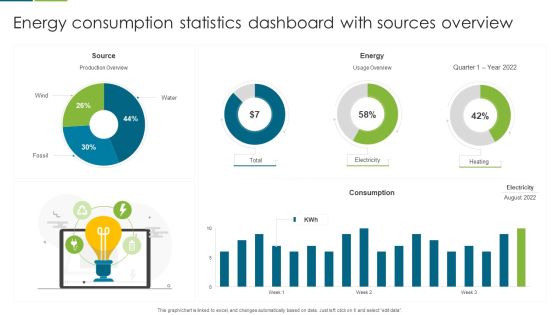
Energy Consumption Statistics Dashboard With Sources Overview Template PDF
This graph or chart is linked to excel, and changes automatically based on data. Just left click on it and select edit data. Pitch your topic with ease and precision using this Energy Consumption Statistics Dashboard With Sources Overview Template PDF. This layout presents information on Source, Energy, Consumption. It is also available for immediate download and adjustment. So, changes can be made in the color, design, graphics or any other component to create a unique layout.
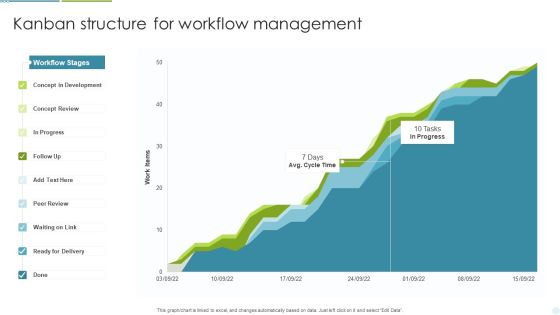
Kanban Structure For Workflow Management Ppt Inspiration Template PDF
This graph or chart is linked to excel, and changes automatically based on data. Just left click on it and select Edit Data. Pitch your topic with ease and precision using this Kanban Structure For Workflow Management Ppt Inspiration Template PDF. This layout presents information on Concept Development, Concept Review, Ready For Delivery. It is also available for immediate download and adjustment. So, changes can be made in the color, design, graphics or any other component to create a unique layout.
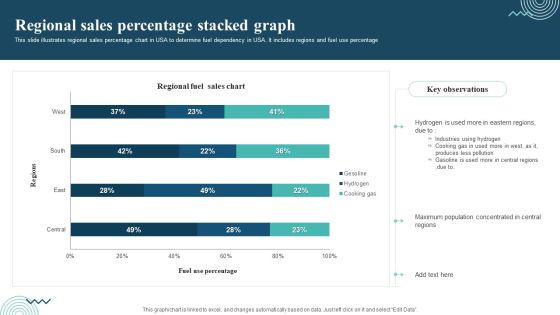
Regional Sales Percentage Stacked Graph Themes PDF
This slide illustrates regional sales percentage chart in USA to determine fuel dependency in USA. It includes regions and fuel use percentage. Pitch your topic with ease and precision using this Regional Sales Percentage Stacked Graph Themes PDF. This layout presents information on Regional Sales, Industries Using Hydrogen, Cooking Gas. It is also available for immediate download and adjustment. So, changes can be made in the color, design, graphics or any other component to create a unique layout.

Product Performance Highlights With Key Growth Drivers Ppt Pictures Design Templates PDF
This graph or chart is linked to excel, and changes automatically based on data. Just left click on it and select Edit Data. Pitch your topic with ease and precision using this Product Performance Highlights With Key Growth Drivers Ppt Pictures Design Templates PDF. This layout presents information on Product Performance, Key Growth, Projected Growth. It is also available for immediate download and adjustment. So, changes can be made in the color, design, graphics or any other component to create a unique layout.

Client Helpline Dashboard With Product Customer Satisfaction Ppt Slides Graphics Template PDF
This graph or chart is linked to excel, and changes automatically based on data. Just left click on it and select Edit Data. Pitch your topic with ease and precision using this Client Helpline Dashboard With Product Customer Satisfaction Ppt Slides Graphics Template PDF. This layout presents information on Customer Satisfaction, Product, Compare. It is also available for immediate download and adjustment. So, changes can be made in the color, design, graphics or any other component to create a unique layout.

Human Capital Metrics With Absenteeism Rate Ppt Infographic Template Ideas PDF
This graph or chart is linked to excel, and changes automatically based on data. Just left click on it and select Edit Data. Pitch your topic with ease and precision using this Human Capital Metrics With Absenteeism Rate Ppt Infographic Template Ideas PDF. This layout presents information on Overall Labor Effectiveness, OLE Department, Absenteeism. It is also available for immediate download and adjustment. So, changes can be made in the color, design, graphics or any other component to create a unique layout.
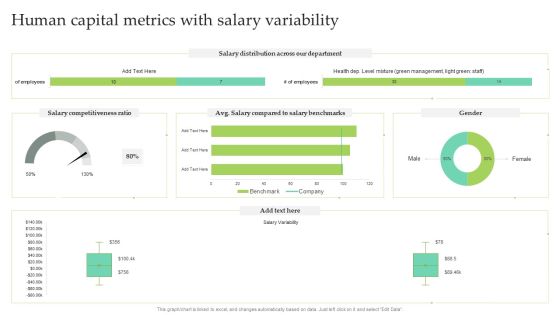
Human Capital Metrics With Salary Variability Ppt Infographic Template Designs PDF
This graph or chart is linked to excel, and changes automatically based on data. Just left click on it and select Edit Data. Pitch your topic with ease and precision using this Human Capital Metrics With Salary Variability Ppt Infographic Template Designs PDF. This layout presents information on Salary Distribution, Salary Competitiveness Ratio, Male. It is also available for immediate download and adjustment. So, changes can be made in the color, design, graphics or any other component to create a unique layout.
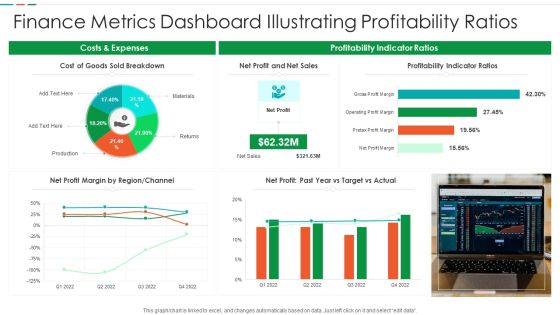
Finance Metrics Dashboard Illustrating Profitability Ratios Diagrams PDF
This graph or chart is linked to excel, and changes automatically based on data. Just left click on it and select edit data. Pitch your topic with ease and precision using this Finance Metrics Dashboard Illustrating Profitability Ratios Diagrams PDF. This layout presents information on Cost Goods Sold, Net Profit Net, Sales Profitability Indicator. It is also available for immediate download and adjustment. So, changes can be made in the color, design, graphics or any other component to create a unique layout.
Cash Performance Highlights With Turnover Rate Ppt Ideas Icon PDF
This graph or chart is linked to excel, and changes automatically based on data. Just left click on it and select Edit Data. Pitch your topic with ease and precision using this Cash Performance Highlights With Turnover Rate Ppt Ideas Icon PDF. This layout presents information on Working Capital, Cash Balance, Current Ratio. It is also available for immediate download and adjustment. So, changes can be made in the color, design, graphics or any other component to create a unique layout.
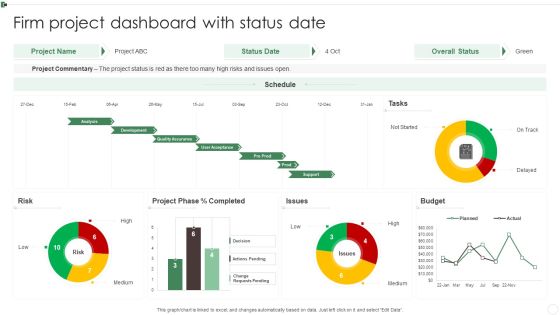
Firm Project Dashboard With Status Date Ppt Infographics Slides PDF
This graph or chart is linked to excel, and changes automatically based on data. Just left click on it and select Edit Data. Pitch your topic with ease and precision using this Firm Project Dashboard With Status Date Ppt Infographics Slides PDF. This layout presents information on Project Commentary, Budget, Project Phase, Risk. It is also available for immediate download and adjustment. So, changes can be made in the color, design, graphics or any other component to create a unique layout.

Finance Metrics Dashboard Indicating Portfolio Performance Microsoft PDF
This graph or chart is linked to excel, and changes automatically based on data. Just left click on it and select edit data. Pitch your topic with ease and precision using this Finance Metrics Dashboard Indicating Portfolio Performance Microsoft PDF. This layout presents information on Portfolio Performance Portfolio, Asset Management Manager, Top 10 Assets. It is also available for immediate download and adjustment. So, changes can be made in the color, design, graphics or any other component to create a unique layout.

Finance Metrics Dashboard Indicating Short Term Assets Download PDF
This graph or chart is linked to excel, and changes automatically based on data. Just left click on it and select edit data. Pitch your topic with ease and precision using this Finance Metrics Dashboard Indicating Short Term Assets Download PDF. This layout presents information on Short Term Assets, Global Financial Performance, Revenue YTD 2022. It is also available for immediate download and adjustment. So, changes can be made in the color, design, graphics or any other component to create a unique layout.
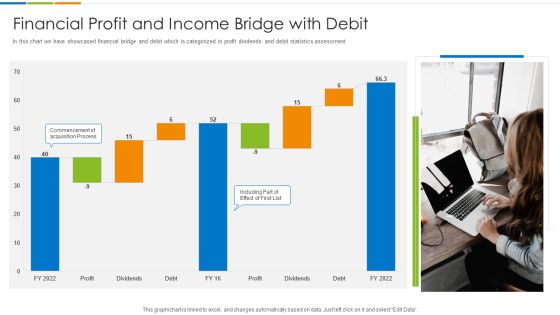
Financial Profit And Income Bridge With Debit Ppt PowerPoint Presentation File Outline PDF
In this chart we have showcased financial bridge and debit which is categorized in profit dividends and debit statistics assessment. Pitch your topic with ease and precision using this Financial Profit And Income Bridge With Debit Ppt PowerPoint Presentation File Outline PDF. This layout presents information on Profit Dividends, Debt Commencement, Acquisition Process. It is also available for immediate download and adjustment. So, changes can be made in the color, design, graphics or any other component to create a unique layout.

Financial Performance Highlights With Net Profit Margin Ppt Model Ideas PDF
This graph or chart is linked to excel, and changes automatically based on data. Just left click on it and select Edit Data. Pitch your topic with ease and precision using this Financial Performance Highlights With Net Profit Margin Ppt Model Ideas PDF. This layout presents information on Net Profit, Accounts Receivable, Accounts Payable. It is also available for immediate download and adjustment. So, changes can be made in the color, design, graphics or any other component to create a unique layout.

Weekly Sales Performance Highlights With Product Share Ppt File Information PDF
This graph or chart is linked to excel, and changes automatically based on data. Just left click on it and select Edit Data. Pitch your topic with ease and precision using this Weekly Sales Performance Highlights With Product Share Ppt File Information PDF. This layout presents information on Dashboard Summary, Weekly Sale, Product Share. It is also available for immediate download and adjustment. So, changes can be made in the color, design, graphics or any other component to create a unique layout.

Client Helpline Dashboard Performance Key Metrics Ppt Outline Deck PDF
This graph or chart is linked to excel, and changes automatically based on data. Just left click on it and select Edit Data. Pitch your topic with ease and precision using this Client Helpline Dashboard Performance Key Metrics Ppt Outline Deck PDF. This layout presents information on Key Metrics, Trend, Compare. It is also available for immediate download and adjustment. So, changes can be made in the color, design, graphics or any other component to create a unique layout.

Client Helpline Dashboard With Ticket Resolution Ppt Model Graphics Design PDF
This graph or chart is linked to excel, and changes automatically based on data. Just left click on it and select Edit Data. Pitch your topic with ease and precision using this Client Helpline Dashboard With Ticket Resolution Ppt Model Graphics Design PDF. This layout presents information on Ticket Due Times, Sourcewise Tickets, Open Tickets. It is also available for immediate download and adjustment. So, changes can be made in the color, design, graphics or any other component to create a unique layout.
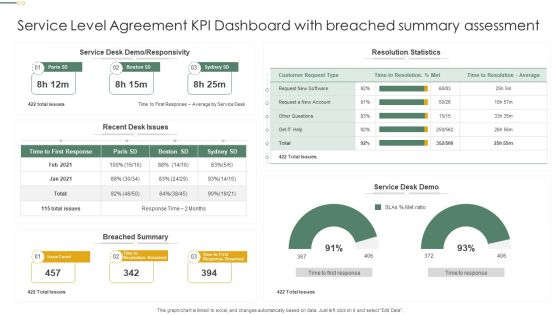
Service Level Agreement KPI Dashboard With Breached Summary Assessment Professional PDF
This graph or chart is linked to excel, and changes automatically based on data. Just left click on it and select Edit Data. Pitch your topic with ease and precision using this Service Level Agreement KPI Dashboard With Breached Summary Assessment Professional PDF. This layout presents information on Resolution Statistics, Service Desk Demo, Breached Summary. It is also available for immediate download and adjustment. So, changes can be made in the color, design, graphics or any other component to create a unique layout.
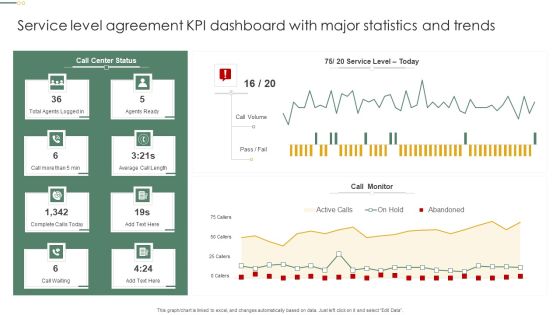
Service Level Agreement KPI Dashboard With Major Statistics And Trends Pictures PDF
This graph or chart is linked to excel, and changes automatically based on data. Just left click on it and select Edit Data. Pitch your topic with ease and precision using this Service Level Agreement KPI Dashboard With Major Statistics And Trends Pictures PDF. This layout presents information on Call Monitor, Call Volume, Agents Ready. It is also available for immediate download and adjustment. So, changes can be made in the color, design, graphics or any other component to create a unique layout.
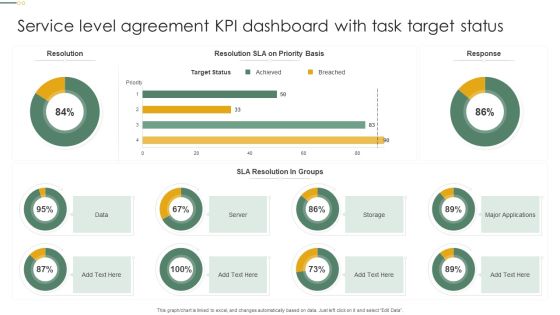
Service Level Agreement KPI Dashboard With Task Target Status Microsoft PDF
This graph or chart is linked to excel, and changes automatically based on data. Just left click on it and select Edit Data. Pitch your topic with ease and precision using this Service Level Agreement KPI Dashboard With Task Target Status Microsoft PDF. This layout presents information on Target Status, Sla Resolution, Groups, Server. It is also available for immediate download and adjustment. So, changes can be made in the color, design, graphics or any other component to create a unique layout.

Company Group Members Demographics Dashboard Overview Clipart PDF
This graph or chart is linked to excel, and changes automatically based on data. Just left click on it and select Edit Data. Pitch your topic with ease and precision using this Company Group Members Demographics Dashboard Overview Clipart PDF. This layout presents information on Headcount Office, Headcount Tenure Range, Headcount Age Range. It is also available for immediate download and adjustment. So, changes can be made in the color, design, graphics or any other component to create a unique layout.

Service SLA KPL Changes And Incidents Dashboard Ppt Inspiration Infographics PDF
This graph or chart is linked to excel, and changes automatically based on data. Just left click on it and select Edit Data. Pitch your topic with ease and precision using this Service SLA KPL Changes And Incidents Dashboard Ppt Inspiration Infographics PDF. This layout presents information on Time Spent Department, Incidents Closed, Operator Group. It is also available for immediate download and adjustment. So, changes can be made in the color, design, graphics or any other component to create a unique layout.
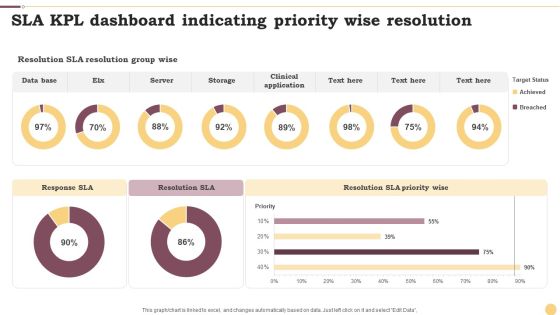
SLA KPL Dashboard Indicating Priority Wise Resolution Ppt Infographics Example File PDF
This graph or chart is linked to excel, and changes automatically based on data. Just left click on it and select Edit Data. Pitch your topic with ease and precision using this SLA KPL Dashboard Indicating Priority Wise Resolution Ppt Infographics Example File PDF. This layout presents information on Data Base, Server, Storage. It is also available for immediate download and adjustment. So, changes can be made in the color, design, graphics or any other component to create a unique layout.

SLA KPL Overview Dashboard Depicting Service Targets Ppt Slides Maker PDF
This graph or chart is linked to excel, and changes automatically based on data. Just left click on it and select Edit Data. Pitch your topic with ease and precision using this SLA KPL Overview Dashboard Depicting Service Targets Ppt Slides Maker PDF. This layout presents information on Monthly Trend, Service Target, Quarterly Trend. It is also available for immediate download and adjustment. So, changes can be made in the color, design, graphics or any other component to create a unique layout.

Doughnut Graph Depicting ROI From Multiple Marketing Activities Rules PDF
This graph or chart is linked to excel, and changes automatically based on data. Just left click on it and select Edit Data. Pitch your topic with ease and precision using this Doughnut Graph Depicting ROI From Multiple Marketing Activities Rules PDF. This layout presents information on Total ROI, Field Campaigns, Print Media, Display Ads. It is also available for immediate download and adjustment. So, changes can be made in the color, design, graphics or any other component to create a unique layout.

Doughnut Graph With Online Employee Recruitment Via Multiple Portals Mockup PDF
This graph or chart is linked to excel, and changes automatically based on data. Just left click on it and select Edit Data. Pitch your topic with ease and precision using this Doughnut Graph With Online Employee Recruitment Via Multiple Portals Mockup PDF. This layout presents information on ABC Employment, Multiple Portals, 2020 To 2022. It is also available for immediate download and adjustment. So, changes can be made in the color, design, graphics or any other component to create a unique layout.
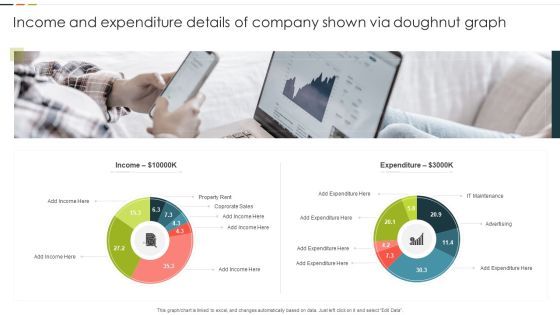
Income And Expenditure Details Of Company Shown Via Doughnut Graph Graphics PDF
This graph or chart is linked to excel, and changes automatically based on data. Just left click on it and select Edit Data. Pitch your topic with ease and precision using this Income And Expenditure Details Of Company Shown Via Doughnut Graph Graphics PDF. This layout presents information on Property Rent, Corporate Sales, Expenditure. It is also available for immediate download and adjustment. So, changes can be made in the color, design, graphics or any other component to create a unique layout.

Kanban Structure For Product Quality Assurance Ppt Portfolio Deck PDF
This graph or chart is linked to excel, and changes automatically based on data. Just left click on it and select Edit Data. Pitch your topic with ease and precision using this Kanban Structure For Product Quality Assurance Ppt Portfolio Deck PDF. This layout presents information on Product Deployment, Quality Assurance, Product, Designing And Development. It is also available for immediate download and adjustment. So, changes can be made in the color, design, graphics or any other component to create a unique layout.

Kanban Structure To Manage Weekly Work Activities Ppt Professional Aids PDF
This graph or chart is linked to excel, and changes automatically based on data. Just left click on it and select Edit Data. Pitch your topic with ease and precision using this Kanban Structure To Manage Weekly Work Activities Ppt Professional Aids PDF. This layout presents information on Legend, Ready To Start, In Progress. It is also available for immediate download and adjustment. So, changes can be made in the color, design, graphics or any other component to create a unique layout.

Human Capital Metrics For New Hire Ppt Pictures Brochure PDF
This graph or chart is linked to excel, and changes automatically based on data. Just left click on it and select Edit Data. Pitch your topic with ease and precision using this Human Capital Metrics For New Hire Ppt Pictures Brochure PDF. This layout presents information on Active Employee Count, New Hire Count, New Hire. It is also available for immediate download and adjustment. So, changes can be made in the color, design, graphics or any other component to create a unique layout.
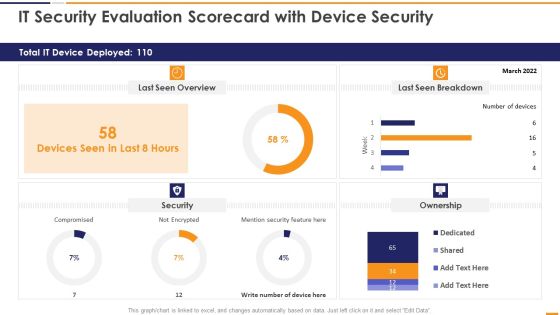
IT Security Evaluation Scorecard With Device Security Ppt Slides Good PDF
This graph or chart is linked to excel, and changes automatically based on data. Just left click on it and select Edit Data. Deliver an awe inspiring pitch with this creative IT Security Evaluation Scorecard With Device Security Ppt Slides Good PDF bundle. Topics like Total IT Device, Last Seen Overview, Last Seen Breakdown, Mention Security Feature can be discussed with this completely editable template. It is available for immediate download depending on the needs and requirements of the user.

Competitive Analysis Of Sales And Revenue Performance Information PDF
The following slide showcases the competitive assessment of organizations sales and revenues to evaluate the gap and compare metrics. It includes pie chart representing performance along with key insights etc. Slidegeeks is one of the best resources for PowerPoint templates. You can download easily and regulate Competitive Analysis Of Sales And Revenue Performance Information PDF for your personal presentations from our wonderful collection. A few clicks is all it takes to discover and get the most relevant and appropriate templates. Use our Templates to add a unique zing and appeal to your presentation and meetings. All the slides are easy to edit and you can use them even for advertisement purposes.

Competitive Analysis Of Sales And Revenue Performance Elements PDF
The following slide showcases the competitive assessment of organizations sales and revenues to evaluate the gap and compare metrics. It includes pie chart representing performance along with key insights etc. Take your projects to the next level with our ultimate collection of Competitive Analysis Of Sales And Revenue Performance Elements PDF. Slidegeeks has designed a range of layouts that are perfect for representing task or activity duration, keeping track of all your deadlines at a glance. Tailor these designs to your exact needs and give them a truly corporate look with your own brand colors they will make your projects stand out from the rest.

Competitive Analysis Of Sales And Revenue Performance Designs PDF
The following slide showcases the competitive assessment of organizations sales and revenues to evaluate the gap and compare metrics. It includes pie chart representing performance along with key insights etc. Take your projects to the next level with our ultimate collection of Competitive Analysis Of Sales And Revenue Performance Designs PDF. Slidegeeks has designed a range of layouts that are perfect for representing task or activity duration, keeping track of all your deadlines at a glance. Tailor these designs to your exact needs and give them a truly corporate look with your own brand colors they will make your projects stand out from the rest.
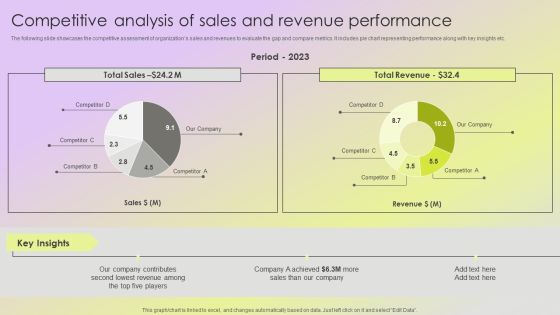
Mitigating Sales Risks With Strategic Action Planning Competitive Analysis Of Sales And Revenue Performance Slides PDF
The following slide showcases the competitive assessment of organizations sales and revenues to evaluate the gap and compare metrics. It includes pie chart representing performance along with key insights etc. Find a pre designed and impeccable Mitigating Sales Risks With Strategic Action Planning Competitive Analysis Of Sales And Revenue Performance Slides PDF. The templates can ace your presentation without additional effort. You can download these easy to edit presentation templates to make your presentation stand out from others. So, what are you waiting for Download the template from Slidegeeks today and give a unique touch to your presentation.
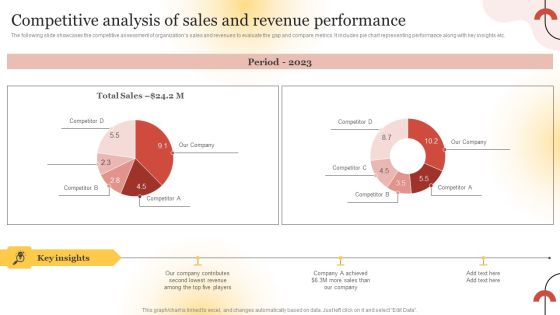
Executing Sales Risk Reduction Plan Competitive Analysis Of Sales And Revenue Performance Diagrams PDF
The following slide showcases the competitive assessment of organizations sales and revenues to evaluate the gap and compare metrics. It includes pie chart representing performance along with key insights etc. Take your projects to the next level with our ultimate collection of Executing Sales Risk Reduction Plan Competitive Analysis Of Sales And Revenue Performance Diagrams PDF. Slidegeeks has designed a range of layouts that are perfect for representing task or activity duration, keeping track of all your deadlines at a glance. Tailor these designs to your exact needs and give them a truly corporate look with your own brand colors they will make your projects stand out from the rest.
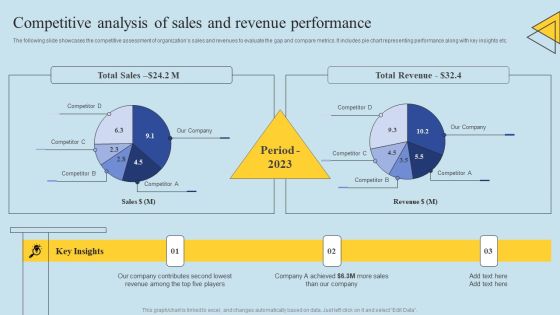
Determining Risks In Sales Administration Procedure Competitive Analysis Of Sales And Revenue Introduction PDF
The following slide showcases the competitive assessment of organizations sales and revenues to evaluate the gap and compare metrics. It includes pie chart representing performance along with key insights etc. Make sure to capture your audiences attention in your business displays with our gratis customizable Determining Risks In Sales Administration Procedure Competitive Analysis Of Sales And Revenue Introduction PDF. These are great for business strategies, office conferences, capital raising or task suggestions. If you desire to acquire more customers for your tech business and ensure they stay satisfied, create your own sales presentation with these plain slides.
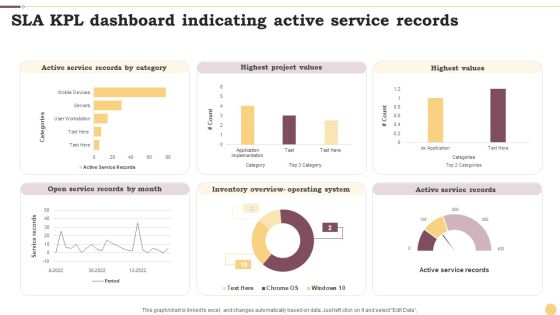
SLA KPL Dashboard Indicating Active Service Records Ppt Professional Graphics Example PDF
This graph or chart is linked to excel, and changes automatically based on data. Just left click on it and select Edit Data. Pitch your topic with ease and precision using this SLA KPL Dashboard Indicating Active Service Records Ppt Professional Graphics Example PDF. This layout presents information on Active Service Records, Highest Project Values, Highest Values. It is also available for immediate download and adjustment. So, changes can be made in the color, design, graphics or any other component to create a unique layout.

Insurance Policy Usage Stacked Percentage Graph Template PDF
This slide illustrates use of insurance policy types percentage chart in USA to determine total number of insurances taken. It includes cities and insurance policy percentage. Pitch your topic with ease and precision using this Insurance Policy Usage Stacked Percentage Graph Template PDF. This layout presents information on Motor Vehicle Policies, More Population, Migration Of People. It is also available for immediate download and adjustment. So, changes can be made in the color, design, graphics or any other component to create a unique layout.

Firm KPI Dashboard With Schedule Performance Index Ppt Visual Aids PDF
This graph or chart is linked to excel, and changes automatically based on data. Just left click on it and select Edit Data. Pitch your topic with ease and precision using this Firm KPI Dashboard With Schedule Performance Index Ppt Visual Aids PDF. This layout presents information on Project Cost Performance, Project Planning Stage, Monitor And Control. It is also available for immediate download and adjustment. So, changes can be made in the color, design, graphics or any other component to create a unique layout.
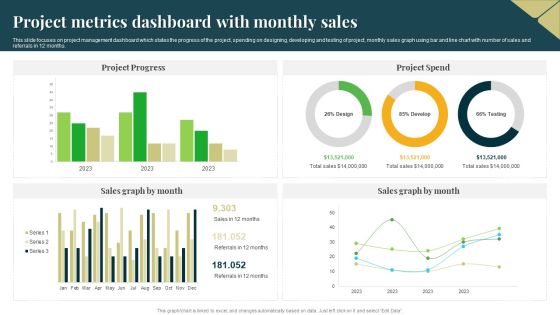
Project Metrics Dashboard With Monthly Sales Professional PDF
This slide focuses on project management dashboard which states the progress of the project, spending on designing, developing and testing of project, monthly sales graph using bar and line chart with number of sales and referrals in 12 months. Pitch your topic with ease and precision using this Project Metrics Dashboard With Monthly Sales Professional PDF. This layout presents information on Project Progress, Project Spend, Sales Graph. It is also available for immediate download and adjustment. So, changes can be made in the color, design, graphics or any other component to create a unique layout.

Finance Metrics Dashboard Illustrating Income And Cash Flow Template PDF
This graph or chart is linked to excel, and changes automatically based on data. Just left click on it and select edit data. Pitch your topic with ease and precision using this Finance Metrics Dashboard Illustrating Income And Cash Flow Template PDF. This layout presents information on Current Accounts Receivable, Current Account Payable, Cash End Period, Account Receivable Account. It is also available for immediate download and adjustment. So, changes can be made in the color, design, graphics or any other component to create a unique layout.
Project Error Tracking KPI Dashboard Themes PDF
This slide illustrates the dashboard for the project issue tracking and management. It includes the column chart for issues assignee, incomplete issues by priority and project, monthly percentage increase in issues created and closed, etc. Pitch your topic with ease and precision using this Project Error Tracking KPI Dashboard Themes PDF. This layout presents information on Issues Assignee, Issue Status, Incomplete Issues. It is also available for immediate download and adjustment. So, changes can be made in the color, design, graphics or any other component to create a unique layout.
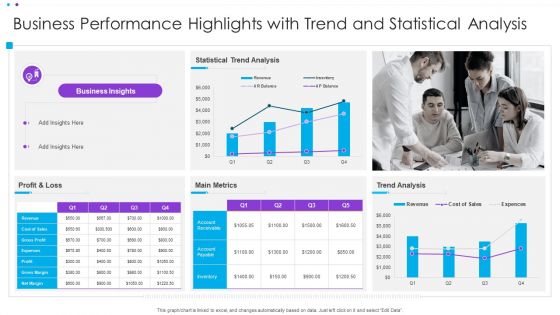
Business Performance Highlights With Trend And Statistical Analysis Ppt Infographic Template Display PDF
This graph or chart is linked to excel, and changes automatically based on data. Just left click on it and select Edit Data. Pitch your topic with ease and precision using this Business Performance Highlights With Trend And Statistical Analysis Ppt Infographic Template Display PDF. This layout presents information on Statistical Trend Analysis, Main Metrics, Profit And Loss. It is also available for immediate download and adjustment. So, changes can be made in the color, design, graphics or any other component to create a unique layout.
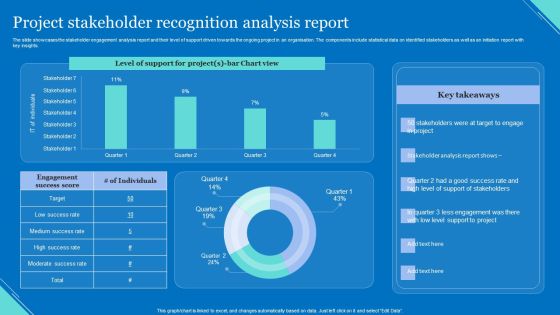
Project Stakeholder Recognition Analysis Report Elements PDF
The slide showcases the stakeholder engagement analysis report and their level of support driven towards the ongoing project in an organisation. The components include statistical data on identified stakeholders as well as an initiation report with key insights. Showcasing this set of slides titled Project Stakeholder Recognition Analysis Report Elements PDF. The topics addressed in these templates are Level Support, Chart View, Support Stakeholders. All the content presented in this PPT design is completely editable. Download it and make adjustments in color, background, font etc. as per your unique business setting.

Customer Service Request Tickets Administration Dashboard Icons PDF
This slide covers division of tickets into different groups. It also includes a pie chart dividing tickets in multiple categories such as status, tech groups, alert level, request type and alert condition. Pitch your topic with ease and precision using this Customer Service Request Tickets Administration Dashboard Icons PDF. This layout presents information on Tickets Activity, Tickets Alert Level, Tickets Teach Group. It is also available for immediate download and adjustment. So, changes can be made in the color, design, graphics or any other component to create a unique layout.
Finance Metrics Dashboard Illustrating Account Payables Icons PDF
This graph or chart is linked to excel, and changes automatically based on data. Just left click on it and select edit data. Pitch your topic with ease and precision using this Total Income Budget, Total Expenses Balance, Net Profit Quick, Ratio Current Ratio. This layout presents information on Account Payable Age, Average Creditor Days, Cash On Hand. It is also available for immediate download and adjustment. So, changes can be made in the color, design, graphics or any other component to create a unique layout.

Support Center Report On Customer Executive Performance Evaluation Background PDF
This slide signifies the call center KPI dashboard on customer support executive performance. It includes daily and weekly volume, CSAT score, pie chart on service level agreement. Pitch your topic with ease and precision using this Support Center Report On Customer Executive Performance Evaluation Background PDF. This layout presents information on Weekly Call Volume, Response Time, Service Level Agreement. It is also available for immediate download and adjustment. So, changes can be made in the color, design, graphics or any other component to create a unique layout.

 Home
Home