Comparison Chart
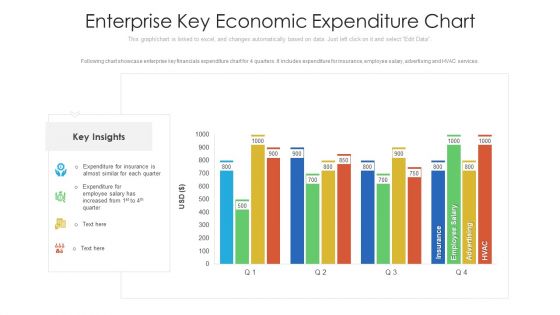
Enterprise Key Economic Expenditure Chart Ppt PowerPoint Presentation File Designs Download PDF
Following chart showcase enterprise key financials expenditure chart for 4 quarters. It includes expenditure for insurance, employee salary, advertising and HVAC services. Pitch your topic with ease and precision using this enterprise key economic expenditure chart ppt powerpoint presentation file designs download pdf. This layout presents information on enterprise key economic expenditure chart. It is also available for immediate download and adjustment. So, changes can be made in the color, design, graphics or any other component to create a unique layout.
Bar Graph And Line Chart For Comparative Analysis Icon Ppt PowerPoint Presentation Gallery Infographics PDF
Showcasing this set of slides titled bar graph and line chart for comparative analysis icon ppt powerpoint presentation gallery infographics pdf. The topics addressed in these templates are bar graph and line chart for comparative analysis icon. All the content presented in this PPT design is completely editable. Download it and make adjustments in color, background, font etc. as per your unique business setting.
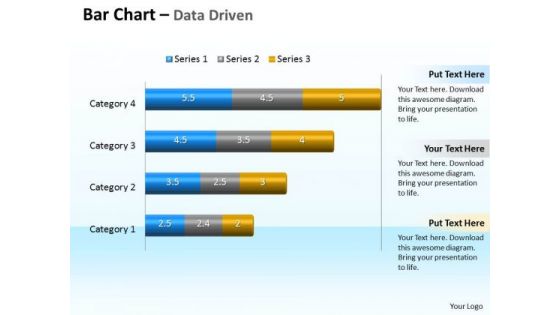
Data Analysis Programs 3d Bar Chart To Compare Categories PowerPoint Templates
Discover Decisive Moments With Our data analysis programs 3d bar chart to compare categories Powerpoint Templates . They Help Make That Crucial Difference.
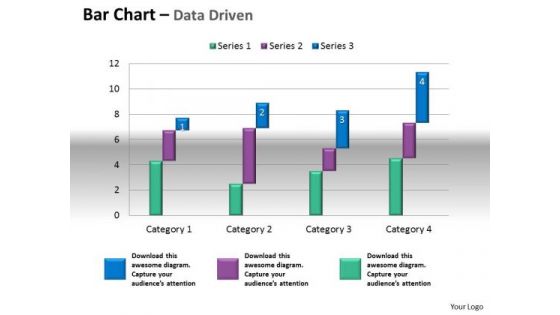
Microsoft Excel Data Analysis Bar Chart To Compare Quantities PowerPoint Templates
Our microsoft excel data analysis bar chart to compare quantities Powerpoint Templates Leave No One In Doubt. Provide A Certainty To Your Views.
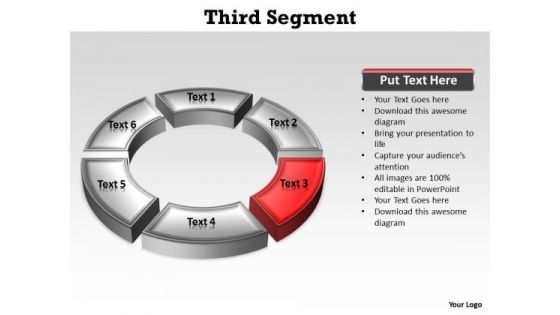
Ppt Red Quadrant On Circular Free Pie PowerPoint Template Chart Ks2 Templates
PPT red quadrant on circular free pie powerpoint template chart ks2 Templates-Use this layout to define the outcome and the multiple possibilities in a way that is used in calculation of probabilities, genetics and strategic reasoning. This chart visualize the of process steps, reoccurrences and components or of your company structure or product features.-PPT red quadrant on circular free pie powerpoint template chart ks2 Templates-3 arrow, art, background, business, chart, circle, clip, colorful, design, diagram, flow, fourth, graph, graphic, half, icon, illustration, management, point, process, progress, project, round, segment, set, slide, stage, successful business, third, transparent
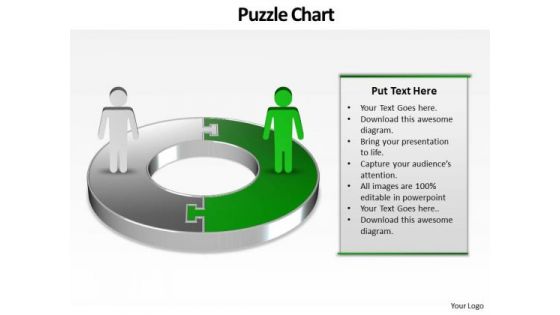
Ppt Green PowerPoint Slide Man On Circular Gantt Chart Template Templates
PPT green powerpoint slide man on circular gantt chart template Templates-This PowerPoint Diagram shows you the Circular way to represent Business components or losses in Business related Activities. This PowerPoint Diagram can be use in Investor presentations for Initial Public Offerings, Annual general meetings and financial seminars.-PPT green powerpoint slide man on circular gantt chart template Templates-abstract, accounting, background, business, businessman, chart, company, connection, corporate, diagram, earnings, finance, forecast, graph, growth, investment, management, network, people, profit, progress, puzzle, shapes, team, technology, vector, wealth

Ppt Red World Business Layouts People Stand On Circular Chart PowerPoint Templates
PPT red world business layouts people stand on circular chart PowerPoint Templates-This 3D PowerPoint Diagram shows the Three interconnected stages represented by first Red Quadrant. It signifies the concept of aspect, attribute, bearing, complexion, component, differentia, disposition, distinction, earmark, essence, essential etc.-PPT red world business layouts people stand on circular chart PowerPoint Templates-abstract, accounting, background, business, businessman, chart, company, connection, corporate, diagram, earnings, finance, forecast, graph, growth, investment, management, network, people, profit, progress, puzzle, shapes, team, technology, vector, wealth
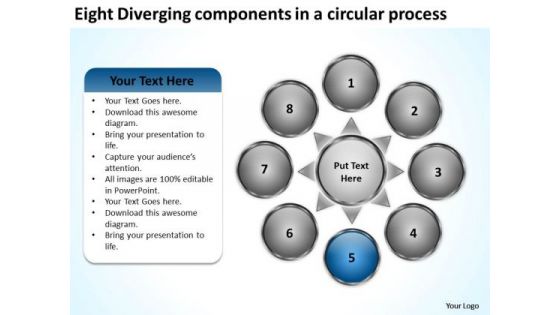
Eight Diverging Components A Circular Process Business Pie Chart PowerPoint Slides
We present our eight diverging components a circular process business Pie Chart PowerPoint Slides.Present our Business PowerPoint Templates because everybody knows The world over it is a priority for many. Along with it there are so many oppurtunities waiting to be utilised. Download and present our Circle Charts PowerPoint Templates because our ready backdrops leave a lasting impression. Present our Arrows PowerPoint Templates because you can Show them how to churn out fresh ideas. Use our Shapes PowerPoint Templates because watching them will strengthen your companys sinews. Use our Flow charts PowerPoint Templates because you can get advantage to prioritise your ideas.Use these PowerPoint slides for presentations relating to Arrows, blank, business, central, centralized, chart, circle, circular, circulation concept, conceptual, converging, design, diagram, empty, executive, icon, idea illustration, management, map, mapping, moa, model, numbers, organization outwards, pointing, procedure, process, radial, radiating, relationship, resource sequence, sequential, seven, square, strategy, template. The prominent colors used in the PowerPoint template are Blue, Gray, White. Presenters tell us our eight diverging components a circular process business Pie Chart PowerPoint Slides are Efficacious. Presenters tell us our centralized PowerPoint templates and PPT Slides are Handsome. PowerPoint presentation experts tell us our eight diverging components a circular process business Pie Chart PowerPoint Slides are Awesome. We assure you our business PowerPoint templates and PPT Slides are Delightful. Customers tell us our eight diverging components a circular process business Pie Chart PowerPoint Slides are Functional. People tell us our central PowerPoint templates and PPT Slides are Delightful.

Examples Of Data Analysis Market Driven Radar Chart To Compare PowerPoint Slides Templates
Rely On Our examples of data analysis market driven radar chart to compare powerpoint slides Templates In Any Duel. They Will Drive Home Your Point.

Eight Diverging Components A Circular Process Circular Pie Chart PowerPoint Slides
We present our eight diverging components a circular process Circular Pie Chart PowerPoint Slides.Use our Business PowerPoint Templates because you can Flutter your wings and enchant the world. Impress them with the innate attractiveness of your thoughts and words. Use our Circle Charts PowerPoint Templates because you are the star of your enlightened team. Download and present our Arrows PowerPoint Templates because the key criteria for necessary infrastructure are at your finger tips. Radiate this knowledge to the group and see their eyes light up. Use our Shapes PowerPoint Templates because the structure of our templates allows you to effectively highlight the key issues concerning the growth of your business. Use our Flow charts PowerPoint Templates because this template contains the material to highlight the key issues of your presentation.Use these PowerPoint slides for presentations relating to Arrows, blank, business, central, centralized, chart, circle, circular, circulation concept, conceptual, converging, design, diagram, empty, executive, icon, idea illustration, management, map, mapping, moa, model, numbers, organization outwards, pointing, procedure, process, radial, radiating, relationship, resource sequence, sequential, seven, square, strategy, template. The prominent colors used in the PowerPoint template are Blue, Gray, White. Presenters tell us our eight diverging components a circular process Circular Pie Chart PowerPoint Slides are Breathtaking. Presenters tell us our business PowerPoint templates and PPT Slides have awesome images to get your point across. PowerPoint presentation experts tell us our eight diverging components a circular process Circular Pie Chart PowerPoint Slides are Adorable. We assure you our chart PowerPoint templates and PPT Slides are Excellent. Customers tell us our eight diverging components a circular process Circular Pie Chart PowerPoint Slides are Fabulous. People tell us our chart PowerPoint templates and PPT Slides are effectively colour coded to prioritise your plans They automatically highlight the sequence of events you desire.

11 Stages Representing Diverging Circular Flow Chart Ppt Cycle Process PowerPoint Templates
We present our 11 stages representing diverging circular flow chart ppt Cycle Process PowerPoint templates.Present our Circle Charts PowerPoint Templates because they will Amplify your basic corporate concept and forefront the benefits of overlapping processes to arrive at common goals. Download and present our Arrows PowerPoint Templates because this slide is an excellent backdrop for you to enlighten your audience on the process you have gone through and the vision you have for the future. Use our Ring Charts PowerPoint Templates because your listeners do not have to put on their thinking caps. Download and present our Business PowerPoint Templates because it helps you to project your enthusiasm and single mindedness to your colleagues. Use our Flow Charts PowerPoint Templates because you have examined every element down to the finest detail.Use these PowerPoint slides for presentations relating to arrows, business, chart, circle, company, concept, continuity, continuous, cycle, dependency, diagram, direction, dynamic, endless, feeds, graph, iteration, iterative, method, path, phase, presentation, process, production, progress, progression, report, rotation, sequence, succession, vector. The prominent colors used in the PowerPoint template are Green, Blue, Gray. Presenters tell us our 11 stages representing diverging circular flow chart ppt Cycle Process PowerPoint templates are Pleasant. You can be sure our cycle PowerPoint templates and PPT Slides will get their audience's attention. Professionals tell us our 11 stages representing diverging circular flow chart ppt Cycle Process PowerPoint templates are Flirty. People tell us our circle PowerPoint templates and PPT Slides will save the presenter time. People tell us our 11 stages representing diverging circular flow chart ppt Cycle Process PowerPoint templates are aesthetically designed to attract attention. We guarantee that they will grab all the eyeballs you need. Professionals tell us our circle PowerPoint templates and PPT Slides are Playful.
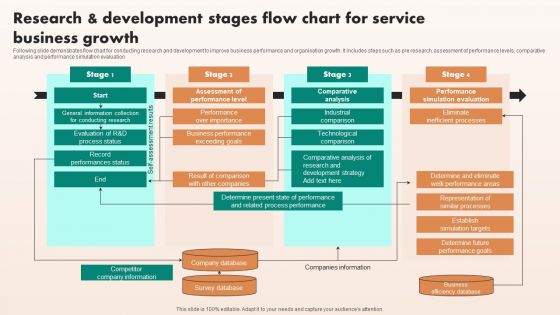
Research And Development Stages Flow Chart For Service Business Growth Sample PDF
Following slide demonstrates flow chart for conducting research and development to improve business performance and organisation growth. It includes steps such as pre research, assessment of performance levels, comparative analysis and performance simulation evaluation. Presenting Research And Development Stages Flow Chart For Service Business Growth Sample PDF to dispense important information. This template comprises four stages. It also presents valuable insights into the topics including Business Efficiency Database, Company Database, Survey Database. This is a completely customizable PowerPoint theme that can be put to use immediately. So, download it and address the topic impactfully.

Ppt Team Work Person Presentation Standing Orange Piece Of Chart PowerPoint Templates
PPT team work person presentation standing orange piece of chart PowerPoint Templates-Use this graphical approach to represent global business issues such as financial data, stock market Exchange, increase in sales, corporate presentations and more. Create captivating presentations to deliver comparative and weighted arguments.-PPT team work person presentation standing orange piece of chart PowerPoint Templates-arrow, bar, business, businessman, candidate, cartoon, character, chart, circle, circular, client, communication, company, concept, diagram, finance, financial, flow, growth, human, illustration, increase, information, iteration, man, market, marketing, process, processing, profit, sales, statistics, stats, success, target
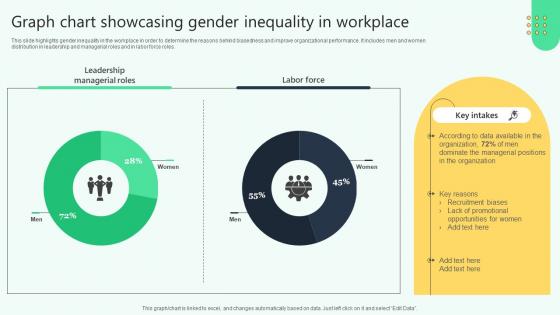
Graph Chart Showcasing Gender Inequality In Workplace Analysing Hr Data For Effective Decision Making
This slide highlights gender inequality in the workplace in order to determine the reasons behind biasedness and improve organizational performance. It includes men and women distribution in leadership and managerial roles and in labor force roles. This Graph Chart Showcasing Gender Inequality In Workplace Analysing Hr Data For Effective Decision Making is perfect for any presentation, be it in front of clients or colleagues. It is a versatile and stylish solution for organizing your meetings. The Graph Chart Showcasing Gender Inequality In Workplace Analysing Hr Data For Effective Decision Making features a modern design for your presentation meetings. The adjustable and customizable slides provide unlimited possibilities for acing up your presentation. Slidegeeks has done all the homework before launching the product for you. So, do not wait, grab the presentation templates today

Ppt Cyan Circular Arrow Business PowerPoint Slide Text Download Process Chart Templates
PPT cyan circular arrow business powerpoint slide text download process chart Templates-This mechanical and industrial Diagram for PowerPoint features a 3D representation of interconnected Curved Arrows. Includes several predesigned layouts. Use this successive PowerPoint diagram to represent a series of interconnected ideas.-PPT cyan circular arrow business powerpoint slide text download process chart Templates-abstract, algorithm, arrow, arrow chart, block, block diagram, business, chart, connection, design, development, diagram, direction, element, flow, flowchart, graph, linear, management, organization, plan, process, program, section, segment, set, sign, solution, strategy, symbol, vector
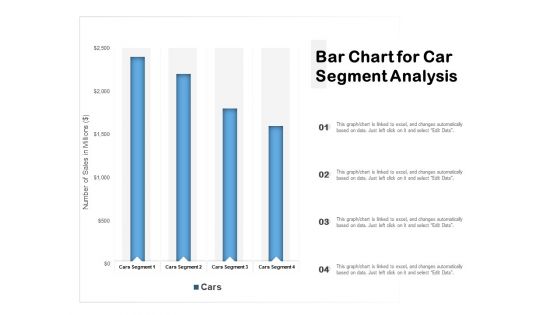
Bar Chart For Car Segment Analysis Ppt PowerPoint Presentation Show Templates PDF
Pitch your topic with ease and precision using this bar chart for car segment analysis ppt powerpoint presentation show templates pdf. This layout presents information on bar chart for car segment analysis. It is also available for immediate download and adjustment. So, changes can be made in the color, design, graphics or any other component to create a unique layout.

Horizontal Bar Chart Representing Consumer Review On Three Scale Ppt Gallery Diagrams PDF
Pitch your topic with ease and precision using this horizontal bar chart representing consumer review on three scale ppt gallery diagrams pdf. This layout presents information on horizontal bar chart representing consumer review on three scale. It is also available for immediate download and adjustment. So, changes can be made in the color, design, graphics or any other component to create a unique layout.
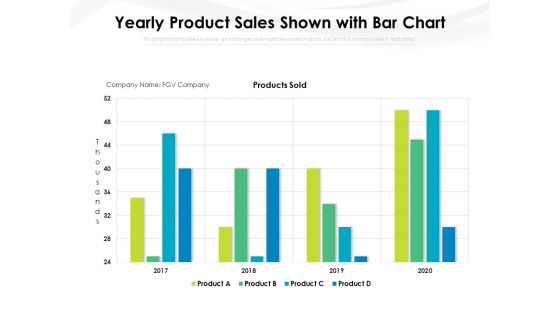
Yearly Product Sales Shown With Bar Chart Ppt PowerPoint Presentation File Gridlines PDF
Pitch your topic with ease and precision using this yearly product sales shown with bar chart ppt powerpoint presentation file gridlines pdf. This layout presents information on yearly product sales shown with bar chart. It is also available for immediate download and adjustment. So, changes can be made in the color, design, graphics or any other component to create a unique layout.

Stacked Bar Chart In Different Colors Ppt PowerPoint Presentation Gallery Maker PDF
Pitch your topic with ease and precision using this stacked bar chart in different colors ppt powerpoint presentation gallery maker pdf. This layout presents information on stacked bar chart in different colors. It is also available for immediate download and adjustment. So, changes can be made in the color, design, graphics or any other component to create a unique layout.

Bar Chart With Percentage Representing Annual Variance Ppt PowerPoint Presentation Gallery Portfolio PDF
Pitch your topic with ease and precision using this bar chart with percentage representing annual variance ppt powerpoint presentation gallery portfolio pdf. This layout presents information on bar chart with percentage representing annual variance. It is also available for immediate download and adjustment. So, changes can be made in the color, design, graphics or any other component to create a unique layout.

Bar Chart With Percentage Representing Inventory Ppt PowerPoint Presentation File Outfit PDF
Pitch your topic with ease and precision using this bar chart with percentage representing inventory ppt powerpoint presentation file outfit pdf. This layout presents information on bar chart with percentage representing inventory. It is also available for immediate download and adjustment. So, changes can be made in the color, design, graphics or any other component to create a unique layout.
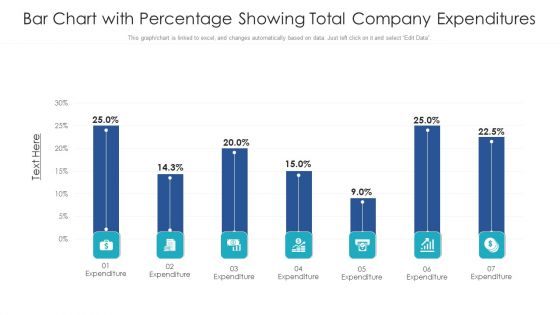
Bar Chart With Percentage Showing Total Company Expenditures Ppt PowerPoint Presentation File Background PDF
Pitch your topic with ease and precision using this bar chart with percentage showing total company expenditures ppt powerpoint presentation file background pdf. This layout presents information on bar chart with percentage showing total company expenditures. It is also available for immediate download and adjustment. So, changes can be made in the color, design, graphics or any other component to create a unique layout.
Annual Two Product Performance Analysis Chart Ppt PowerPoint Presentation Icon Design Templates PDF
Pitch your topic with ease and precision using this annual two product performance analysis chart ppt powerpoint presentation icon design templates pdf. This layout presents information on annual, two product performance, analysis chart. It is also available for immediate download and adjustment. So, changes can be made in the color, design, graphics or any other component to create a unique layout.
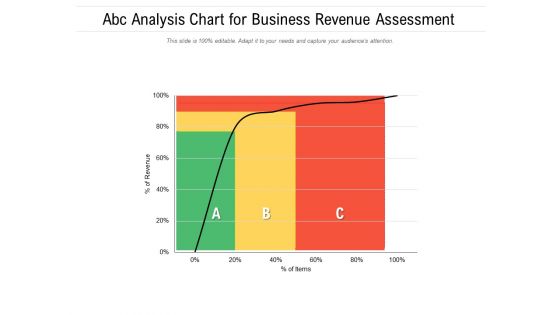
ABC Analysis Chart For Business Revenue Assessment Ppt PowerPoint Presentation Model Template PDF
Pitch your topic with ease and precision using this abc analysis chart for business revenue assessment ppt powerpoint presentation model template pdf. This layout presents information on abc analysis chart for business revenue assessment. It is also available for immediate download and adjustment. So, changes can be made in the color, design, graphics or any other component to create a unique layout.
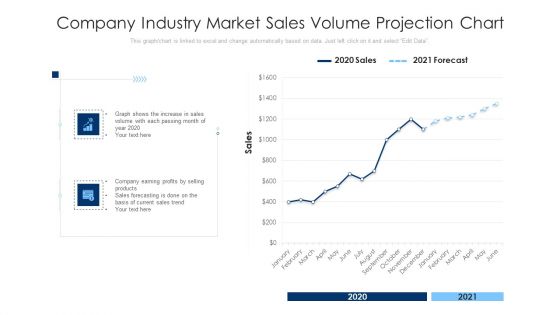
Company Industry Market Sales Volume Projection Chart Ppt PowerPoint Presentation Infographic Template Clipart PDF
Pitch your topic with ease and precision using this company industry market sales volume projection chart ppt powerpoint presentation infographic template clipart pdf. This layout presents information on company industry market sales volume projection chart. It is also available for immediate download and adjustment. So, changes can be made in the color, design, graphics or any other component to create a unique layout.
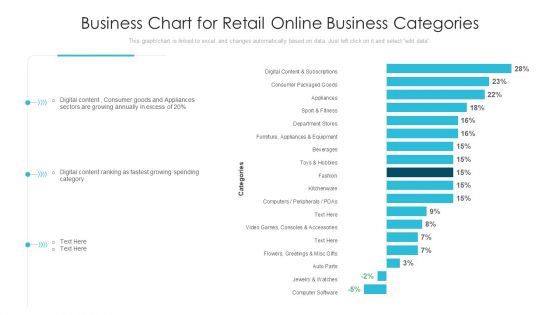
Business Chart For Retail Online Business Categories Ppt PowerPoint Presentation Infographics Diagrams PDF
Pitch your topic with ease and precision using this business chart for retail online business categories ppt powerpoint presentation infographics diagrams pdf. This layout presents information on business chart for retail online business categories. It is also available for immediate download and adjustment. So, changes can be made in the color, design, graphics or any other component to create a unique layout.
Business Statistic Chart With Expansion And Reduction Icon Ppt Visual Aids Ideas PDF
Pitch your topic with ease and precision using this business statistic chart with expansion and reduction icon ppt visual aids ideas pdf. This layout presents information on business statistic chart with expansion and reduction icon. It is also available for immediate download and adjustment. So, changes can be made in the color, design, graphics or any other component to create a unique layout.
Line Chart Showing Four Products Performance Ppt PowerPoint Presentation Icon Slideshow PDF
Pitch your topic with ease and precision using this line chart showing four products performance ppt powerpoint presentation icon slideshow pdf. This layout presents information on line chart showing four products performance. It is also available for immediate download and adjustment. So, changes can be made in the color, design, graphics or any other component to create a unique layout.
Pie Chart Showing Online Business Sales Analysis Ppt PowerPoint Presentation File Icons PDF
Pitch your topic with ease and precision using this pie chart showing online business sales analysis ppt powerpoint presentation file icons pdf. This layout presents information on pie chart showing online business sales analysis. It is also available for immediate download and adjustment. So, changes can be made in the color, design, graphics or any other component to create a unique layout.
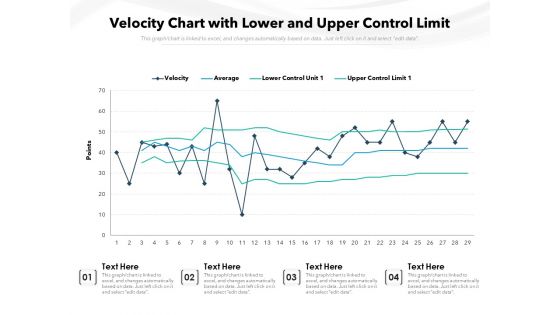
Velocity Chart With Lower And Upper Control Limit Ppt PowerPoint Presentation Gallery Infographics PDF
Pitch your topic with ease and precision using this velocity chart with lower and upper control limit ppt powerpoint presentation gallery infographics pdf. This layout presents information on velocity chart with lower and upper control limit. It is also available for immediate download and adjustment. So, changes can be made in the color, design, graphics or any other component to create a unique layout.

Line Chart Of Business Tasks Analysis Ppt PowerPoint Presentation Layouts Skills PDF
Pitch your topic with ease and precision using this line chart of business tasks analysis ppt powerpoint presentation layouts skills pdf. This layout presents information on line chart of business tasks analysis. It is also available for immediate download and adjustment. So, changes can be made in the color, design, graphics or any other component to create a unique layout.
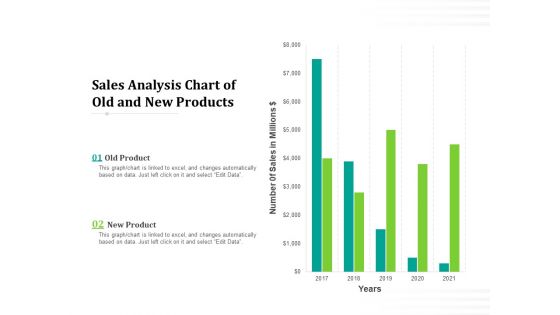
Sales Analysis Chart Of Old And New Products Ppt PowerPoint Presentation Professional Influencers PDF
Pitch your topic with ease and precision using this sales analysis chart of old and new products ppt powerpoint presentation professional influencers pdf. This layout presents information on sales analysis chart of old and new products. It is also available for immediate download and adjustment. So, changes can be made in the color, design, graphics or any other component to create a unique layout.
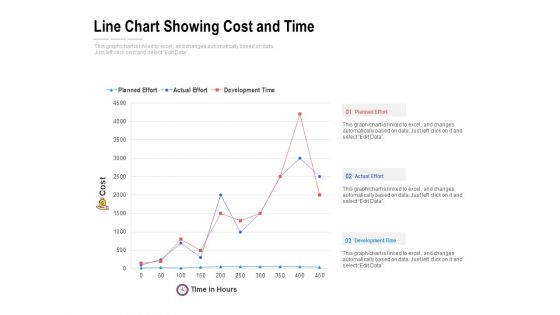
Line Chart Showing Cost And Time Ppt PowerPoint Presentation File Example Topics PDF
Pitch your topic with ease and precision using this line chart showing cost and time ppt powerpoint presentation file example topics pdf. This layout presents information on line chart showing cost and time. It is also available for immediate download and adjustment. So, changes can be made in the color, design, graphics or any other component to create a unique layout.
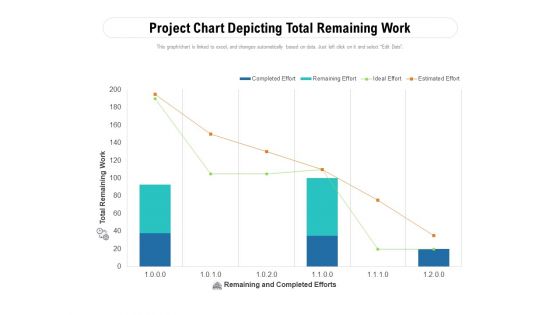
Project Chart Depicting Total Remaining Work Ppt PowerPoint Presentation File Slides PDF
Pitch your topic with ease and precision using this project chart depicting total remaining work ppt powerpoint presentation file slides pdf. This layout presents information on project chart depicting total remaining work. It is also available for immediate download and adjustment. So, changes can be made in the color, design, graphics or any other component to create a unique layout.
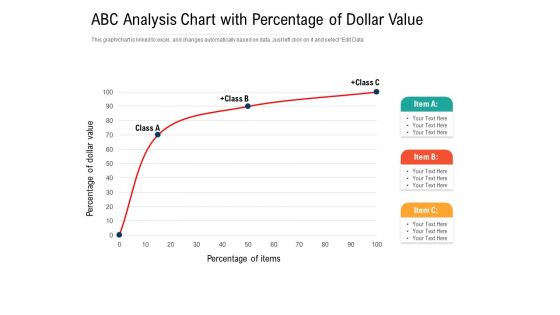
ABC Analysis Chart With Percentage Of Dollar Value Ppt PowerPoint Presentation Gallery Portfolio PDF
Pitch your topic with ease and precision using this abc analysis chart with percentage of dollar value ppt powerpoint presentation gallery portfolio pdf. This layout presents information on abc analysis chart with percentage of dollar value. It is also available for immediate download and adjustment. So, changes can be made in the color, design, graphics or any other component to create a unique layout.
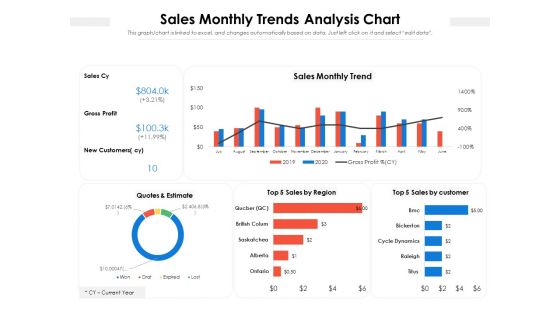
Sales Monthly Trends Analysis Chart Ppt Powerpoint Presentation Gallery Objects Pdf
Pitch your topic with ease and precision using this sales monthly trends analysis chart ppt powerpoint presentation gallery objects pdf. This layout presents information on sales monthly trends analysis chart. It is also available for immediate download and adjustment. So, changes can be made in the color, design, graphics or any other component to create a unique layout.
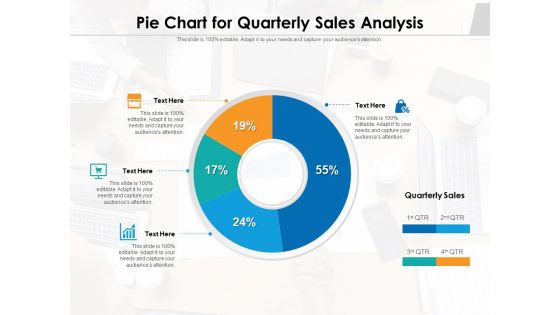
Pie Chart For Quarterly Sales Analysis Ppt PowerPoint Presentation File Outfit PDF
Pitch your topic with ease and precision using this pie chart for quarterly sales analysis ppt powerpoint presentation file outfit pdf. This layout presents information on pie chart for quarterly sales analysis. It is also available for immediate download and adjustment. So, changes can be made in the color, design, graphics or any other component to create a unique layout.

Pie Chart For Regional Analysis Ppt PowerPoint Presentation Gallery Example PDF
Pitch your topic with ease and precision using this pie chart for regional analysis ppt powerpoint presentation gallery example pdf. This layout presents information on pie chart for regional analysis. It is also available for immediate download and adjustment. So, changes can be made in the color, design, graphics or any other component to create a unique layout.

Chart Illustrating Active Truck Fleet Utilization Ratio Ppt PowerPoint Presentation Styles Graphics Pictures PDF
Pitch your topic with ease and precision using this chart illustrating active truck fleet utilization ratio ppt powerpoint presentation styles graphics pictures pdf. This layout presents information on chart illustrating active truck fleet utilization ratio. It is also available for immediate download and adjustment. So, changes can be made in the color, design, graphics or any other component to create a unique layout.
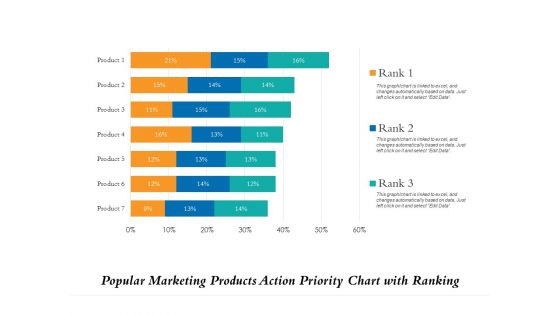
Popular Marketing Products Action Priority Chart With Ranking Ppt PowerPoint Presentation File Demonstration PDF
Pitch your topic with ease and precision using this popular marketing products action priority chart with ranking ppt powerpoint presentation file demonstration pdf. This layout presents information on popular marketing products action priority chart with ranking. It is also available for immediate download and adjustment. So, changes can be made in the color, design, graphics or any other component to create a unique layout.

Business Analytics Chart With Insights Ppt PowerPoint Presentation Slides Guidelines PDF
Pitch your topic with ease and precision using this business analytics chart with insights ppt powerpoint presentation slides guidelines pdf. This layout presents information on business analytics chart with insights. It is also available for immediate download and adjustment. So, changes can be made in the color, design, graphics or any other component to create a unique layout.

Chart Showing Monthly Sales Staff Productivity Ppt PowerPoint Presentation File Images PDF
Pitch your topic with ease and precision using this chart showing monthly sales staff productivity ppt powerpoint presentation file images pdf. This layout presents information on chart showing monthly sales staff productivity. It is also available for immediate download and adjustment. So, changes can be made in the color, design, graphics or any other component to create a unique layout.

Product Sales And Profit Increase And Decrease Chart Ppt Show PDF
Pitch your topic with ease and precision using this product sales and profit increase and decrease chart ppt show pdf. This layout presents information on product sales and profit increase and decrease chart. It is also available for immediate download and adjustment. So, changes can be made in the color, design, graphics or any other component to create a unique layout.
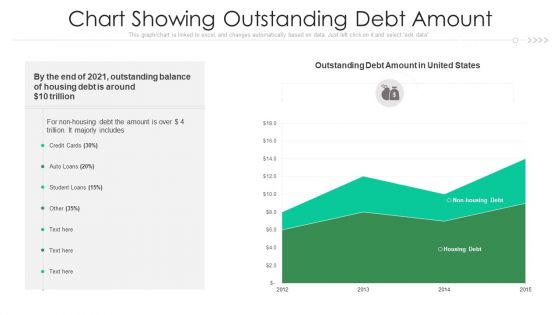
Chart Showing Outstanding Debt Amount Ppt PowerPoint Presentation Outline Background PDF
Pitch your topic with ease and precision using this chart showing outstanding debt amount ppt powerpoint presentation outline background pdf. This layout presents information on chart showing outstanding debt amount. It is also available for immediate download and adjustment. So, changes can be made in the color, design, graphics or any other component to create a unique layout.

Chart Showing Market Share Percentage Of Financial Sector Ppt PowerPoint Presentation Show Guide PDF
Pitch your topic with ease and precision using this chart showing market share percentage of financial sector ppt powerpoint presentation show guide pdf. This layout presents information on chart showing market share percentage of financial sector. It is also available for immediate download and adjustment. So, changes can be made in the color, design, graphics or any other component to create a unique layout.
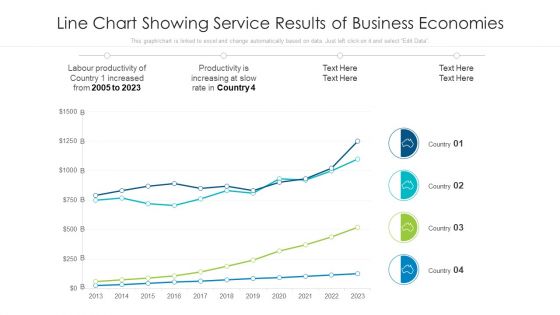
Line Chart Showing Service Results Of Business Economies Ppt PowerPoint Presentation Model Tips PDF
Pitch your topic with ease and precision using this line chart showing service results of business economies ppt powerpoint presentation model tips pdf. This layout presents information on line chart showing service results of business economies. It is also available for immediate download and adjustment. So, changes can be made in the color, design, graphics or any other component to create a unique layout.

Various Banking Contribution Chart With Percentage Values Ppt PowerPoint Presentation Visual Aids Deck PDF
Pitch your topic with ease and precision using this various banking contribution chart with percentage values ppt powerpoint presentation visual aids deck pdf This layout presents information on various banking contribution chart with percentage values. It is also available for immediate download and adjustment. So, changes can be made in the color, design, graphics or any other component to create a unique layout.

Chart Representing Consumer Review For Various Sources And Years Ppt Summary Background PDF
Pitch your topic with ease and precision using this chart representing consumer review for various sources and years ppt summary background pdf. This layout presents information on chart representing consumer review for various sources and years. It is also available for immediate download and adjustment. So, changes can be made in the color, design, graphics or any other component to create a unique layout.
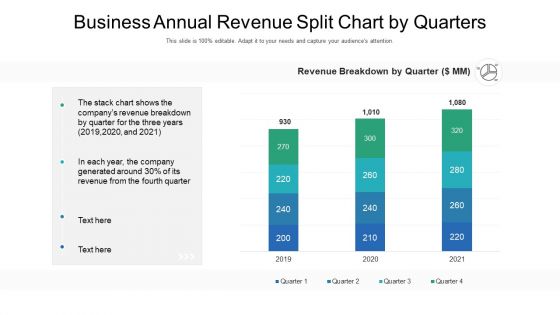
Business Annual Revenue Split Chart By Quarters Ppt PowerPoint Presentation Background Image PDF
Pitch your topic with ease and precision using this business annual revenue split chart by quarters ppt powerpoint presentation background image pdf. This layout presents information on business annual revenue split chart by quarters. It is also available for immediate download and adjustment. So, changes can be made in the color, design, graphics or any other component to create a unique layout.
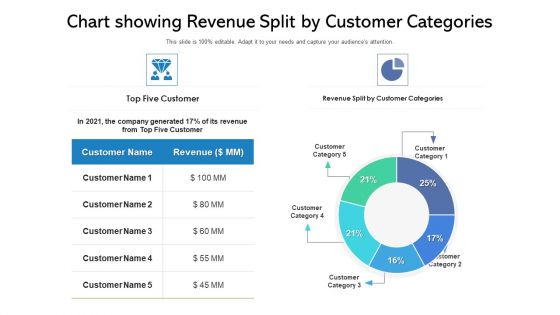
Chart Showing Revenue Split By Customer Categories Ppt PowerPoint Presentation Show Smartart PDF
Pitch your topic with ease and precision using this chart showing revenue split by customer categories ppt powerpoint presentation show smartart pdf. This layout presents information on chart showing revenue split by customer categories. It is also available for immediate download and adjustment. So, changes can be made in the color, design, graphics or any other component to create a unique layout.
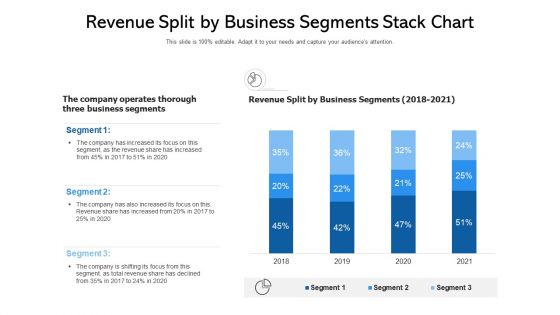
Revenue Split By Business Segments Stack Chart Ppt PowerPoint Presentation Ideas Sample PDF
Pitch your topic with ease and precision using this revenue split by business segments stack chart ppt powerpoint presentation ideas sample pdf. This layout presents information on revenue split by business segments stack chart. It is also available for immediate download and adjustment. So, changes can be made in the color, design, graphics or any other component to create a unique layout.
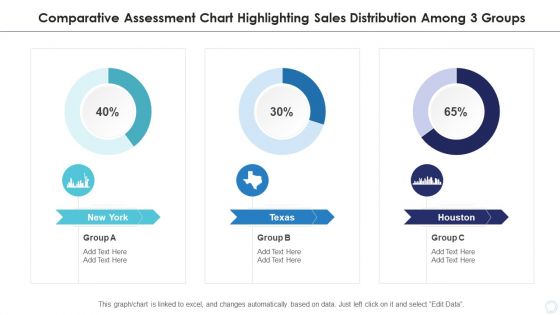
Comparative Assessment Chart Highlighting Sales Distribution Among 3 Groups Designs PDF
Pitch your topic with ease and precision using this comparative assessment chart highlighting sales distribution among 3 groups designs pdf. This layout presents information on comparative assessment chart highlighting sales distribution among 3 groups. It is also available for immediate download and adjustment. So, changes can be made in the color, design, graphics or any other component to create a unique layout.

Diminishing Graph And Chart Highlighting Pandemic Impact On GDP Sample PDF
Pitch your topic with ease and precision using this Diminishing Graph And Chart Highlighting Pandemic Impact On GDP Sample PDF. This layout presents information on Diminishing Graph, Chart Highlighting Pandemic. It is also available for immediate download and adjustment. So, changes can be made in the color, design, graphics or any other component to create a unique layout.
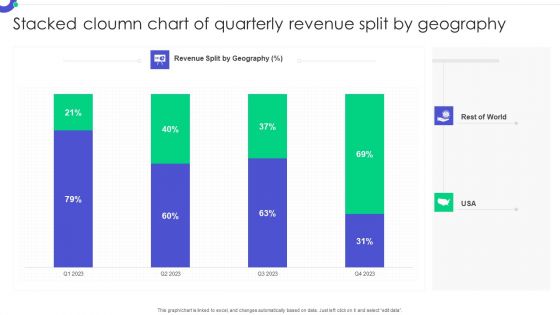
Stacked Cloumn Chart Of Quarterly Revenue Split By Geography Pictures PDF
Pitch your topic with ease and precision using this Stacked Cloumn Chart Of Quarterly Revenue Split By Geography Pictures PDF. This layout presents information on Stacked Column, Chart Quarterly, Revenue Split. It is also available for immediate download and adjustment. So, changes can be made in the color, design, graphics or any other component to create a unique layout.

Stacked Column Chart Of Vehicle Sold In Different Cities Formats PDF
Pitch your topic with ease and precision using this Stacked Column Chart Of Vehicle Sold In Different Cities Formats PDF. This layout presents information on Stacked Column, Chart Vehicle, Sold Different Cities. It is also available for immediate download and adjustment. So, changes can be made in the color, design, graphics or any other component to create a unique layout.
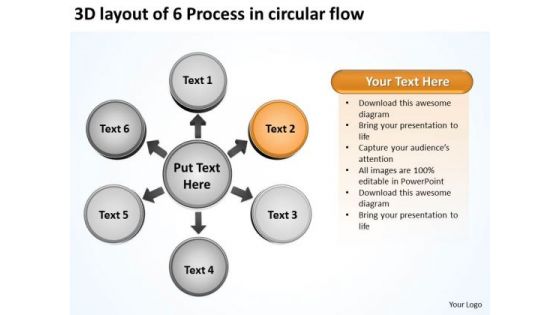
Layout Of 6 Process In Circular Flow Relative Arrow Chart PowerPoint Templates
We present our layout of 6 process in circular flow Relative Arrow Chart PowerPoint templates.Present our Circle Charts PowerPoint Templates because individual components well researched and understood in their place. Download our Business PowerPoint Templates because profit levels have been steady over the recent past. Spread your heightened excitement to others in the room. Download and present our Arrows PowerPoint Templates because your ideas are fundamentally stable with a broad base of workable possibilities. Download and present our Shapes PowerPoint Templates because educate your staff on the means to provide the required support for speedy recovery. Use our Flow Charts PowerPoint Templates because you can Show them how you can save the day.Use these PowerPoint slides for presentations relating to 3d, Arrow, Business, Chart, Circle, Circular, Circulation, Collection, Concept, Connection, Continuity, Cycle, Cyclic, Diagram, Direction, Dynamic, Flow, Flowchart, Form, Green, Group, Illustration, Loop, Motion, Movement, Moving, Presentation, Process, Progress, Recycle, Recycling, Refresh, Reload, Render, Rendering, Renew, Repeat, Repetition, Repetitive, Return, Reuse, Rotation, Round, Shape, Sign, Spin, Symbol, Turn, Update, White. The prominent colors used in the PowerPoint template are Orange, Gray, Black. We assure you our layout of 6 process in circular flow Relative Arrow Chart PowerPoint templates provide great value for your money. Be assured of finding the best projection to highlight your words. We assure you our Circulation PowerPoint templates and PPT Slides are Attractive. Customers tell us our layout of 6 process in circular flow Relative Arrow Chart PowerPoint templates are Swanky. Presenters tell us our Chart PowerPoint templates and PPT Slides are Majestic. You can be sure our layout of 6 process in circular flow Relative Arrow Chart PowerPoint templates are Magical. The feedback we get is that our Circulation PowerPoint templates and PPT Slides are No-nonsense.
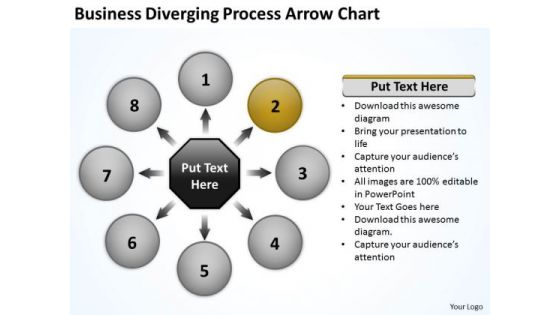
Download Diverging Process Arrow Chart Ppt Relative Circular Flow PowerPoint Slides
We present our download diverging process arrow chart ppt Relative Circular Flow PowerPoint Slides.Download and present our Circle Charts PowerPoint Templates because visual appeal is a priority for us. Download and present our Arrows PowerPoint Templates because you can Lead your flock steadily to greater heights. Look around at the vast potential of achievement around you. Download our Business PowerPoint Templates because the fruits of your labour are beginning to show.Enlighten them on the great plans you have for their enjoyment. Download and present our Shapes PowerPoint Templates because generation of sales is the core of any business. Use our Flow Charts PowerPoint Templates because this slide demonstrates how they contribute to the larger melting pot.Use these PowerPoint slides for presentations relating to Analysis, Background, Blank, Business, Center, Central, Chart, Component, Concept, Diagram, Disperse, Distribute, Expand, Flow, Gist, Group, Industry, Process, Strategy, Support, Surround, Template, Transfer. The prominent colors used in the PowerPoint template are White, Brown, Gray. People tell us our download diverging process arrow chart ppt Relative Circular Flow PowerPoint Slides are Attractive. Professionals tell us our Business PowerPoint templates and PPT Slides are Elegant. Customers tell us our download diverging process arrow chart ppt Relative Circular Flow PowerPoint Slides are specially created by a professional team with vast experience. They diligently strive to come up with the right vehicle for your brilliant Ideas. Use our Chart PowerPoint templates and PPT Slides are Luxuriant. We assure you our download diverging process arrow chart ppt Relative Circular Flow PowerPoint Slides are the best it can get when it comes to presenting. Professionals tell us our Blank PowerPoint templates and PPT Slides are Beautiful.
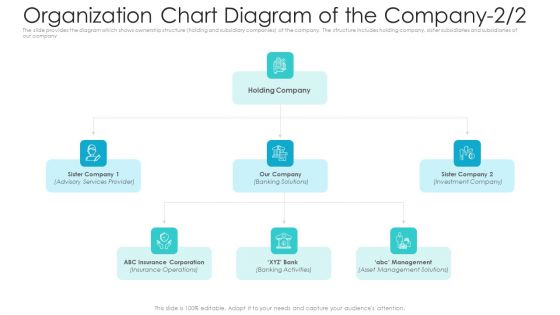
Private Equity Fundraising Pitch Deck Organization Chart Diagram Of The Company Services Themes PDF
The slide provides the diagram which shows ownership structure holding and subsidiary companies of the company. The structure includes holding company, sister subsidiaries and subsidiaries of our company. This is a private equity fundraising pitch deck organization chart diagram of the company services themes pdf template with various stages. Focus and dispense information on three stages using this creative set, that comes with editable features. It contains large content boxes to add your information on topics like organization chart diagram of the company, services provider, asset management solutions. You can also showcase facts, figures, and other relevant content using this PPT layout. Grab it now.

Research And Development Stages Flow Chart For Customer Centric Product Development Mockup PDF
Following slide showcases flow chart for customer requirement based product research and development to increase customer satisfaction. It includes key components such as customers, customer support service team and production team. Persuade your audience using this Research And Development Stages Flow Chart For Customer Centric Product Development Mockup PDF. This PPT design covers three stages, thus making it a great tool to use. It also caters to a variety of topics including Customer, Customer Support Service Team, Production Team. Download this PPT design now to present a convincing pitch that not only emphasizes the topic but also showcases your presentation skills.

For A Free Business PowerPoint Templates Flow Chart Circular Process Slides
We present our for a free business powerpoint templates flow chart Circular Process Slides.Download our Ring Charts PowerPoint Templates because it is inspired by the indelible Olympic logo this graphic exemplifies the benefits of teamwork. Use our Shapes PowerPoint Templates because this slide demonstrates how they contribute to the larger melting pot. Download and present our Circle Charts PowerPoint Templates because it unravels the process layer by layer and exposes their relevance to the core issue. Download our Business PowerPoint Templates because you are sure you have the right people for your plans. Download our Process and Flows PowerPoint Templates because it unravels the process layer by layer and exposes their relevance to the core issue.Use these PowerPoint slides for presentations relating to Business,chart, circle, colors, concept,contemporary, corporate, cycle, data,design, detail, development, diagram, engineering, graphic, ideas,illustration, implement, implementation,management, model, modern,organization, phase, plan, process,product, professional, project, quality,schema, set, software, stack, stage, steps, strategy, success, system, tag, team. The prominent colors used in the PowerPoint template are Purple, Gray, Black. Customers tell us our for a free business powerpoint templates flow chart Circular Process Slides are Excellent. Customers tell us our data PowerPoint templates and PPT Slides are the best it can get when it comes to presenting. Customers tell us our for a free business powerpoint templates flow chart Circular Process Slides are Fashionable. People tell us our data PowerPoint templates and PPT Slides are Radiant. Customers tell us our for a free business powerpoint templates flow chart Circular Process Slides are Youthful. Customers tell us our colors PowerPoint templates and PPT Slides will save the presenter time.

10 Diverging Stages Planning Process Diagram Ppt Circular Flow Spoke Chart PowerPoint Slides
We present our 10 diverging stages planning process diagram ppt Circular Flow Spoke Chart PowerPoint Slides.Download and present our Arrows PowerPoint Templates because individual components well researched and understood in their place. Download and present our Flow charts PowerPoint Templates because the foundation stones of many a life. Use our Business PowerPoint Templates because you have secured a name for yourself in the domestic market. Now the time is right to spread your reach to other countries. Present our Process and Flows PowerPoint Templates because you can see In any endeavour people matter most. Download and present our Circle charts PowerPoint Templates because you can blaze a brilliant trail from point to point.Use these PowerPoint slides for presentations relating to Business, catalog, chart, circle, concept, conceptual, conference, connection, corporate, description, design, development, diagram, goal, graphic, idea, illustration, item, management, marketing, mind, mind map, model, navigation, organization, parts, plans, presentation, process, reports, solutions, strategy, success, target. The prominent colors used in the PowerPoint template are Yellow, Black, Gray. You can be sure our 10 diverging stages planning process diagram ppt Circular Flow Spoke Chart PowerPoint Slides are Versatile. Presenters tell us our corporate PowerPoint templates and PPT Slides are effectively colour coded to prioritise your plans They automatically highlight the sequence of events you desire. We assure you our 10 diverging stages planning process diagram ppt Circular Flow Spoke Chart PowerPoint Slides are Chic. Customers tell us our connection PowerPoint templates and PPT Slides are Spiffy. Presenters tell us our 10 diverging stages planning process diagram ppt Circular Flow Spoke Chart PowerPoint Slides will impress their bosses and teams. You can be sure our conference PowerPoint templates and PPT Slides are Fun.
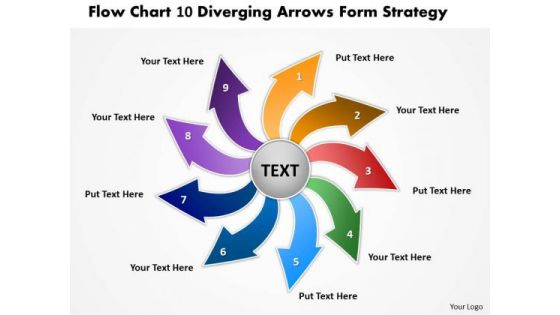
Flow Chart 10 Diverging Arrows Form Strategy Ppt Cycle Diagram PowerPoint Slides
We present our flow chart 10 diverging arrows form strategy ppt Cycle Diagram PowerPoint Slides.Download and present our Arrows PowerPoint Templates because your ideas are fundamentally stable with a broad base of workable possibilities. Present our Circle Charts PowerPoint Templates because you should Demonstrate how you think out of the box. Download and present our Shapes PowerPoint Templates because it gives a core idea about various enveloping layers. Download and present our Business PowerPoint Templates because you are ready to flap your wings and launch off. All poised are you to touch the sky with glory. Download our Flow Charts PowerPoint Templates because you can Highlight the key components of your entire manufacturing/ business process.Use these PowerPoint slides for presentations relating to achievement, aim, around, arrow, blue, center, chart, circle, circular, connection, cursor, cycle, cyclic, decisions, direction, flow, graph, graphic, group, icon, illustration, isolated, loop, motion, movement, point, pointer, recycle, recycling, reuse, ring, rotation, round, sign, spin, symbol, target, team, teamwork, technology, turn, wheel, white. The prominent colors used in the PowerPoint template are Brown, Red, Green. Presenters tell us our flow chart 10 diverging arrows form strategy ppt Cycle Diagram PowerPoint Slides are Luxuriant. You can be sure our circular PowerPoint templates and PPT Slides are Great. Professionals tell us our flow chart 10 diverging arrows form strategy ppt Cycle Diagram PowerPoint Slides are Appealing. People tell us our circle PowerPoint templates and PPT Slides are Luxurious. People tell us our flow chart 10 diverging arrows form strategy ppt Cycle Diagram PowerPoint Slides are Fashionable. Professionals tell us our around PowerPoint templates and PPT Slides are Lush.

Bar Chart With Percentage Of Healthcare Expenses In Different Countries Ppt PowerPoint Presentation Gallery Tips PDF
Pitch your topic with ease and precision using this bar chart with percentage of healthcare expenses in different countries ppt powerpoint presentation gallery tips pdf. This layout presents information on bar chart with percentage of healthcare expenses in different countries. It is also available for immediate download and adjustment. So, changes can be made in the color, design, graphics or any other component to create a unique layout.
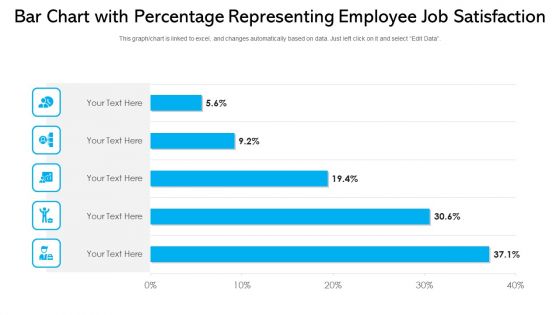
Bar Chart With Percentage Representing Employee Job Satisfaction Ppt PowerPoint Presentation File Slide Download PDF
Pitch your topic with ease and precision using this bar chart with percentage representing employee job satisfaction ppt powerpoint presentation file slide download pdf. This layout presents information on bar chart with percentage representing employee job satisfaction. It is also available for immediate download and adjustment. So, changes can be made in the color, design, graphics or any other component to create a unique layout.

Ppt Flower Petal Chart Convert Pdf To Editable PowerPoint Free Templates
PPT flower petal chart convert pdf to editable powerpoint free Templates-This PowerPoint diagram provides an overview of the interactions of different factors in a company. This diagram is suitable for business and technical professionals who need to quickly and easily visualize, explore, and communicate information. The ideas and plans are on your fingertips. Now imprint them on the minds of your audience via our slides. -PPT flower petal chart convert pdf to editable powerpoint free Templates-Abstract, Analysis, Arrows, Banner, Blank, Brochure, Business, Button, Catalog, Chart, Circular, Combination, Combine, Communication, Company, Competition, Components, Concept, Diagram, Different, Targets

Ppt Display Of 3d Pie Org Chart PowerPoint 2010 With Standing Busines Men Templates
PPT display of 3d pie org chart powerpoint 2010 with standing busines men Templates-This is a professional-look process steps diagram. This Process steps diagram is widely used to show sequence of actions. Use this linear process diagram to emphasize direction of movement and interconnections of stages in a flow. It is useful to explain components involved as well as the factors included in Process. -PPT display of 3d pie org chart powerpoint 2010 with standing busines men Templates-Adult, Art, Background, Business, Career, Chart, Communication, Concept, Conference, Corporate, Creative, Design, Economy, Executive, Finance, Group, Growth, Idea, Illustration, Leadership, Meeting, New, Occupation, Office, People, Person, Progress, Silhouette, Space, Speaking, Standing, Success
Vendor Analysis Chart Based On Quality Features Ppt PowerPoint Presentation Icon Smartart
Pitch your topic with ease and precision using this vendor analysis chart based on quality features ppt powerpoint presentation icon smartart. This layout presents information on average, customer service, ontime delivery, service quality, product quality. It is also available for immediate download and adjustment. So, changes can be made in the color, design, graphics or any other component to create a unique layout.
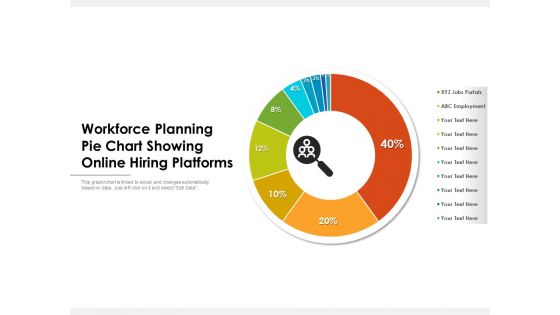
Workforce Planning Pie Chart Showing Online Hiring Platforms Ppt PowerPoint Presentation Inspiration Background Designs PDF
Pitch your topic with ease and precision using this workforce planning pie chart showing online hiring platforms ppt powerpoint presentation inspiration background designs pdf. This layout presents information on workforce planning pie chart showing online hiring platforms. It is also available for immediate download and adjustment. So, changes can be made in the color, design, graphics or any other component to create a unique layout.
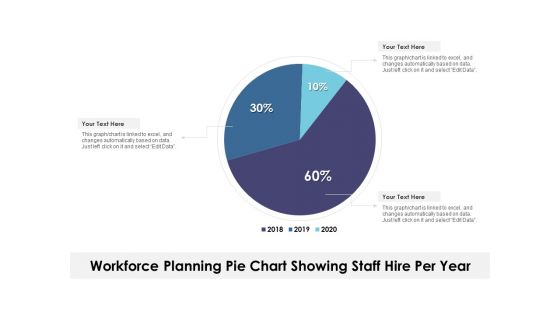
Workforce Planning Pie Chart Showing Staff Hire Per Year Ppt PowerPoint Presentation Show Demonstration PDF
Pitch your topic with ease and precision using this workforce planning pie chart showing staff hire per year ppt powerpoint presentation show demonstration pdf. This layout presents information on workforce planning pie chart showing staff hire per year. It is also available for immediate download and adjustment. So, changes can be made in the color, design, graphics or any other component to create a unique layout.
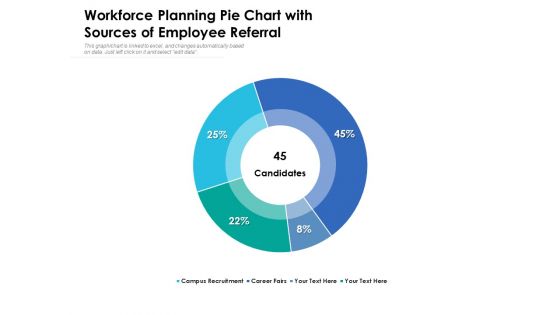
Workforce Planning Pie Chart With Sources Of Employee Referral Ppt PowerPoint Presentation Layouts Picture PDF
Pitch your topic with ease and precision using this workforce planning pie chart with sources of employee referral ppt powerpoint presentation layouts picture pdf. This layout presents information on workforce planning pie chart with sources of employee referral. It is also available for immediate download and adjustment. So, changes can be made in the color, design, graphics or any other component to create a unique layout.
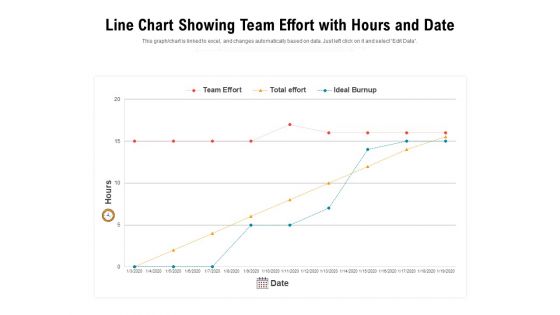
Line Chart Showing Team Effort With Hours And Date Ppt PowerPoint Presentation File Graphic Tips PDF
Pitch your topic with ease and precision using this line chart showing team effort with hours and date ppt powerpoint presentation file graphic tips pdf. This layout presents information on line chart showing team effort with hours and date. It is also available for immediate download and adjustment. So, changes can be made in the color, design, graphics or any other component to create a unique layout.

Chart Depicting New Emerging Markets Share With Advanced Economies Ppt PowerPoint Presentation Gallery Design Ideas PDF
Pitch your topic with ease and precision using this chart depicting new emerging markets share with advanced economies ppt powerpoint presentation gallery design ideas pdf. This layout presents information on chart depicting new emerging markets share with advanced economies. It is also available for immediate download and adjustment. So, changes can be made in the color, design, graphics or any other component to create a unique layout.

Chart Showing Yearly United States Coast Guard Crew Fatalities Ppt PowerPoint Presentation Inspiration Structure PDF
Pitch your topic with ease and precision using this chart showing yearly united states coast guard crew fatalities ppt powerpoint presentation inspiration structure pdf. This layout presents information on chart showing yearly united states coast guard crew fatalities. It is also available for immediate download and adjustment. So, changes can be made in the color, design, graphics or any other component to create a unique layout.

Revenue Chart By The Top Medical Services Of An Organization Ppt PowerPoint Presentation File Slide PDF
Pitch your topic with ease and precision using this revenue chart by the top medical services of an organization ppt powerpoint presentation file slide pdf. This layout presents information on revenue chart by the top medical services of an organization. It is also available for immediate download and adjustment. So, changes can be made in the color, design, graphics or any other component to create a unique layout.
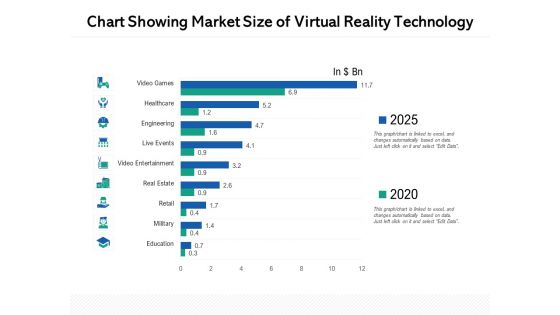
Chart Showing Market Size Of Virtual Reality Technology Ppt PowerPoint Presentation Layouts Graphics Example PDF
Pitch your topic with ease and precision using this chart showing market size of virtual reality technology ppt powerpoint presentation layouts graphics example pdf. This layout presents information on chart showing market size of virtual reality technology. It is also available for immediate download and adjustment. So, changes can be made in the colour, design, graphics or any other component to create a unique layout.
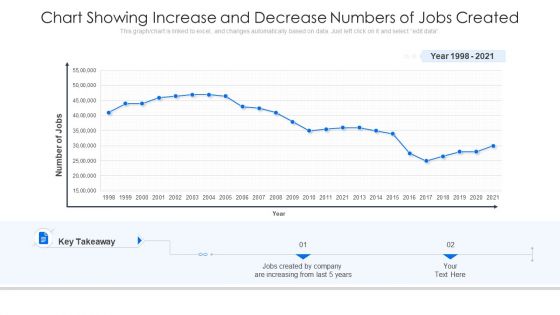
Chart Showing Increase And Decrease Numbers Of Jobs Created Ppt Visual Aids Model PDF
Pitch your topic with ease and precision using this chart showing increase and decrease numbers of jobs created ppt visual aids model pdf. This layout presents information on chart showing increase and decrease numbers of jobs created. It is also available for immediate download and adjustment. So, changes can be made in the color, design, graphics or any other component to create a unique layout.
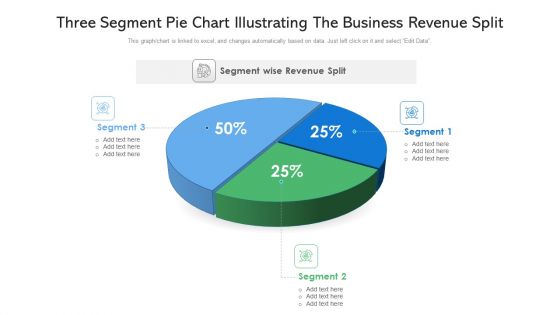
Three Segment Pie Chart Illustrating The Business Revenue Split Ppt PowerPoint Presentation Gallery Summary PDF
Pitch your topic with ease and precision using this three segment pie chart illustrating the business revenue split ppt powerpoint presentation gallery summary pdf. This layout presents information on three segment pie chart illustrating the business revenue split. It is also available for immediate download and adjustment. So, changes can be made in the color, design, graphics or any other component to create a unique layout.

Chart Illustrating Consumer Journey With Lifetime Value Ppt PowerPoint Presentation File Background Images PDF
The following slide illustrates the graph of customer lifecycle value and customer lifetime with monthly data. Pitch your topic with ease and precision using this chart illustrating consumer journey with lifetime value ppt powerpoint presentation file background images pdf. This layout presents information on chart illustrating consumer journey with lifetime value. It is also available for immediate download and adjustment. So, changes can be made in the color, design, graphics or any other component to create a unique layout.

Nutritious Diet Chart With Balanced Food Intake Alternatives Ppt PowerPoint Presentation Portfolio Layout Ideas PDF
Pitch your topic with ease and precision using this nutritious diet chart with balanced food intake alternatives ppt powerpoint presentation portfolio layout ideas pdf. This layout presents information on nutritious diet chart with balanced food intake alternatives. It is also available for immediate download and adjustment. So, changes can be made in the color, design, graphics or any other component to create a unique layout.
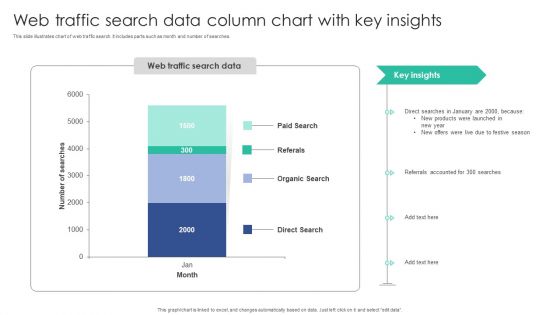
Web Traffic Search Data Column Chart With Key Insights Inspiration PDF
This slide illustrates chart of web traffic search. It includes parts such as month and number of searches.Pitch your topic with ease and precision using this Web Traffic Search Data Column Chart With Key Insights Inspiration PDF. This layout presents information on Organic Search, Referrals Accounted, Products Launched. It is also available for immediate download and adjustment. So, changes can be made in the color, design, graphics or any other component to create a unique layout.
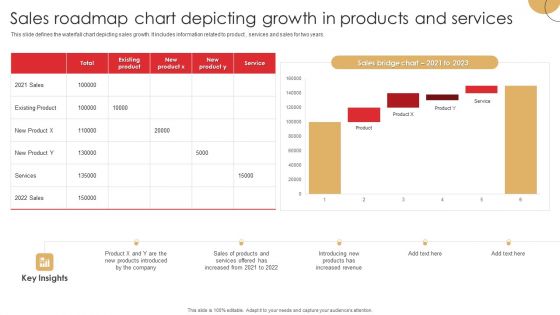
Sales Roadmap Chart Depicting Growth In Products And Services Ideas PDF
This slide defines the waterfall chart depicting sales growth. It includes information related to product , services and sales for two years.Pitch your topic with ease and precision using this Sales Roadmap Chart Depicting Growth In Products And Services Ideas PDF. This layout presents information on Products Introduced, Increased Revenue, Services Offered. It is also available for immediate download and adjustment. So, changes can be made in the color, design, graphics or any other component to create a unique layout.

break even sales and cost analysis chart ppt powerpoint presentation gallery master slide
This is a break even sales and cost analysis chart ppt powerpoint presentation gallery master slide. This is a three stage process. The stages in this process are break even point,break even analysis,break even level.

sales volume analysis chart with total sales and total cost ppt powerpoint presentation slide
This is a sales volume analysis chart with total sales and total cost ppt powerpoint presentation slide. This is a ten stage process. The stages in this process are break even point,break even analysis,break even level.
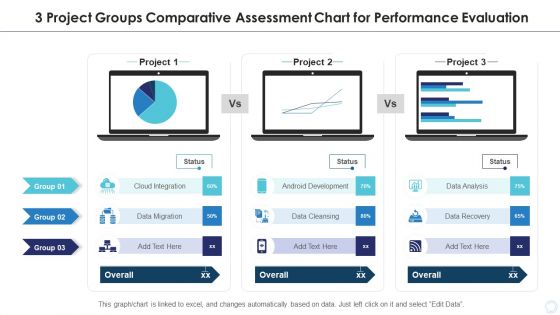
3 Project Groups Comparative Assessment Chart For Performance Evaluation Background PDF
Showcasing this set of slides titled 3 project groups comparative assessment chart for performance evaluation background pdf. The topics addressed in these templates are data analysis, data recovery, android development. All the content presented in this PPT design is completely editable. Download it and make adjustments in color, background, font etc. as per your unique business setting.
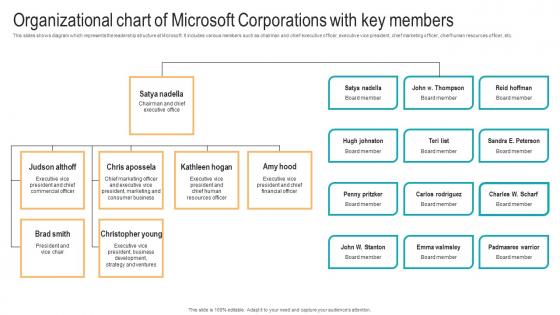
Organizational Chart Of Microsoft Corporations With Strategic Advancements By Microsofts Structure Pdf
This slides shows diagram which represents the leadership structure at Microsoft. It includes various members such as chairman and chief executive officer, executive vice president, chief marketing officer, chief human resources officer, etc. This Organizational Chart Of Microsoft Corporations With Strategic Advancements By Microsofts Structure Pdf from Slidegeeks makes it easy to present information on your topic with precision. It provides customization options, so you can make changes to the colors, design, graphics, or any other component to create a unique layout. It is also available for immediate download, so you can begin using it right away. Slidegeeks has done good research to ensure that you have everything you need to make your presentation stand out. Make a name out there for a brilliant performance.

Quality Assurance Templates Set 2 Sample Gantt Chart For Project Management Portrait PDF
Mentioned slide portrays sample Gantt chart that can be used by the companies for managing multiple projects. The chart can also be used to assign task-based responsibilities to team members. Deliver an awe inspiring pitch with this creative quality assurance templates set 2 sample gantt chart for project management portrait pdf bundle. Topics like sample gantt chart for project management can be discussed with this completely editable template. It is available for immediate download depending on the needs and requirements of the user.

Monthly Company Sales And Expenses Column Chart With Key Insights Mockup PDF
This slide depicts monthly comparative column chart of sales and expenses in a company to analyze organizational profits. It includes aspects such as months vs. revenue generatedPitch your topic with ease and precision using this Monthly Company Sales And Expenses Column Chart With Key Insights Mockup PDF. This layout presents information on Sales Channels, Counterproductive Policies, Sales Commission. It is also available for immediate download and adjustment. So, changes can be made in the color, design, graphics or any other component to create a unique layout.

Brand Comparative Analysis Chart With Market Size And Pricing Model Pictures PDF
This slide illustrates comparative analysis of brands of XYZ product. It includes their market size, key features of these brands.Showcasing this set of slides titled Brand Comparative Analysis Chart With Market Size And Pricing Model Pictures PDF. The topics addressed in these templates are Pricing Model, Competitive Pricing, Market Size. All the content presented in this PPT design is completely editable. Download it and make adjustments in color, background, font etc. as per your unique business setting.

break even chart showing contribution margin ppt powerpoint presentation professional templates
This is a break even chart showing contribution margin ppt powerpoint presentation professional templates. This is a two stage process. The stages in this process are break even point,break even analysis,break even level.
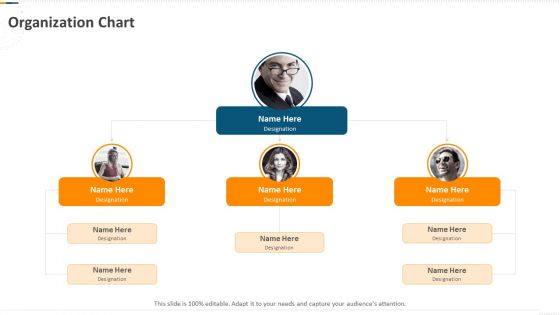
Developing Action Plan For Gaining Market Advantage Organization Chart Ppt PowerPoint Presentation Model File Formats PDF
This is a developing action plan for gaining market advantage organization chart ppt powerpoint presentation model file formats pdf template with various stages. Focus and dispense information on four stages using this creative set, that comes with editable features. It contains large content boxes to add your information on topics like organization chart. You can also showcase facts, figures, and other relevant content using this PPT layout. Grab it now.
Value Creation Initiatives Organization Chart Ppt Infographic Template Graphics Download PDF
This is a value creation initiatives organization chart ppt infographic template graphics download pdf template with various stages. Focus and dispense information on three stages using this creative set, that comes with editable features. It contains large content boxes to add your information on topics like organization chart. You can also showcase facts, figures, and other relevant content using this PPT layout. Grab it now.
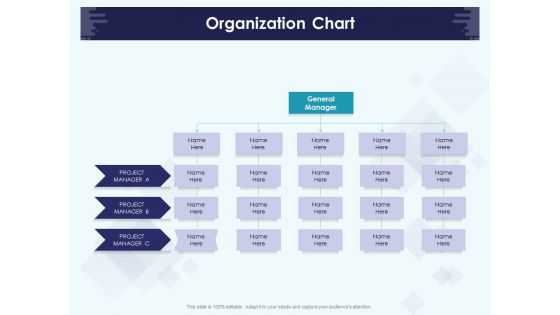
Role Of Human Resource In Workplace Culture Organization Chart Information PDF
This is a role of human resource in workplace culture organization chart information pdf template with various stages. Focus and dispense information on five stages using this creative set, that comes with editable features. It contains large content boxes to add your information on topics like organization chart. You can also showcase facts, figures, and other relevant content using this PPT layout. Grab it now.

Organizational Building Blocks Organization Chart Ppt PowerPoint Presentation Portfolio Background Designs PDF
this is a organizational building blocks organization chart ppt powerpoint presentation portfolio background designs pdf template with various stages. focus and dispense information on ten stages using this creative set, that comes with editable features. it contains large content boxes to add your information on topics like organization chart. you can also showcase facts, figures, and other relevant content using this ppt layout. grab it now.
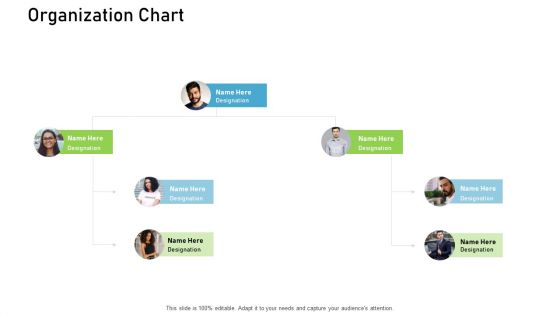
Proven Ways Of Quickly Growing A Small Business Organization Chart Ppt Visual Aids Ideas PDF
This is a proven ways of quickly growing a small business organization chart ppt visual aids ideas pdf template with various stages. Focus and dispense information on four stages using this creative set, that comes with editable features. It contains large content boxes to add your information on topics like organization chart. You can also showcase facts, figures, and other relevant content using this PPT layout. Grab it now.
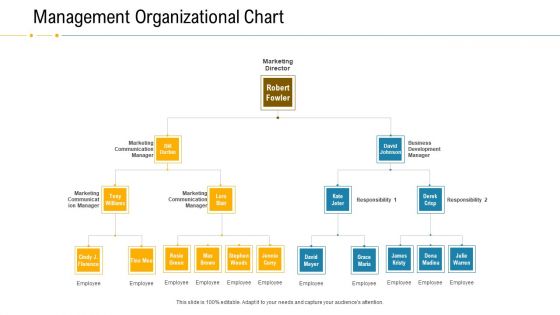
Financial Due Diligence For Business Organization Management Organizational Chart Professional PDF
This is a financial due diligence for business organization management organizational chart professional pdf template with various stages. Focus and dispense information on six stages using this creative set, that comes with editable features. It contains large content boxes to add your information on topics like management organizational chart. You can also showcase facts, figures, and other relevant content using this PPT layout. Grab it now.
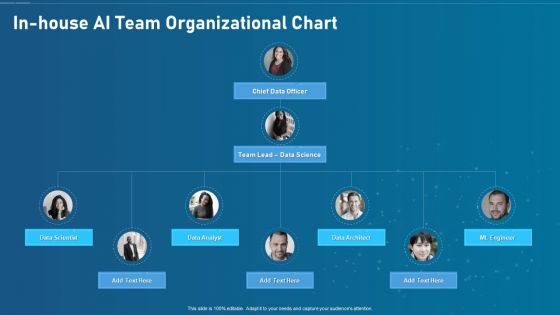
Artificial Intelligence Transformation Playbook In House Ai Team Organizational Chart Structure PDF
This is a artificial intelligence transformation playbook in house ai team organizational chart structure pdf template with various stages. Focus and dispense information on three stages using this creative set, that comes with editable features. It contains large content boxes to add your information on topics like in house ai team organizational chart. You can also showcase facts, figures, and other relevant content using this PPT layout. Grab it now.
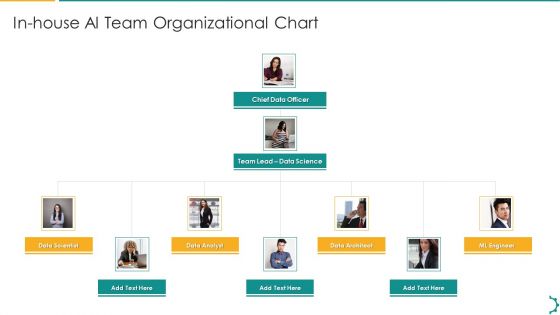
Artificial Intelligence Playbook In House Ai Team Organizational Chart Infographics PDF
This is a artificial intelligence playbook in house ai team organizational chart infographics pdf template with various stages. Focus and dispense information on four stages using this creative set, that comes with editable features. It contains large content boxes to add your information on topics like ai team, organizational chart. You can also showcase facts, figures, and other relevant content using this PPT layout. Grab it now.
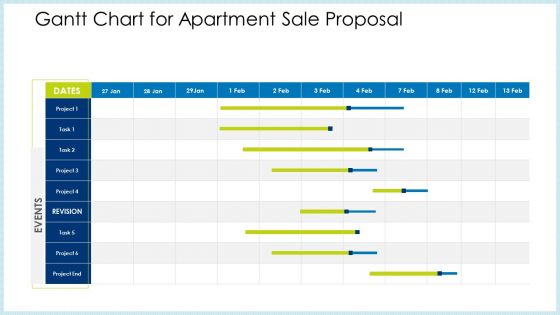
Technology Innovation Human Resource System Gantt Chart For Apartment Sale Proposal Template PDF
Elucidate your project plan using our technology innovation human resource system gantt chart for apartment sale proposal template pdf. Capture the timeframe for every release by outlining crucial details like project beginning and end date, status, and assigned team. Establish coordination with other team members share your product plans, and discuss the project progress with the executives using this template. Furthermore, this task management chart helps you align your activities efficiently. Utilize the versatile nature of this template to initiate high-level resource planning and implement it flexibly for the benefit of your business. The slide is easy-to-edit so download it and schedule your projects resourcefully.
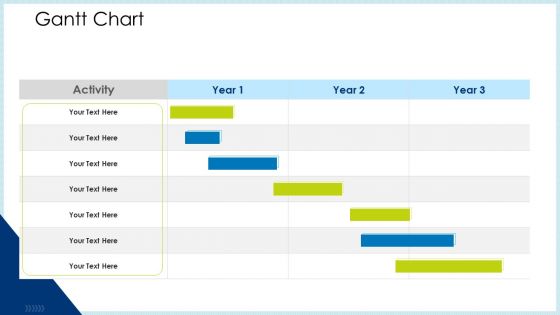
Technology Innovation Human Resource System Gantt Chart Ppt Show Deck PDF
Elucidate your project plan using our technology innovation human resource system gantt chart ppt show deck pdf. Capture the timeframe for every release by outlining crucial details like project beginning and end date, status, and assigned team. Establish coordination with other team members share your product plans, and discuss the project progress with the executives using this template. Furthermore, this task management chart helps you align your activities efficiently. Utilize the versatile nature of this template to initiate high-level resource planning and implement it flexibly for the benefit of your business. The slide is easy-to-edit so download it and schedule your projects resourcefully.

Flow Chart 4 Stages Free Business PowerPoint Templates 1 Circular Process Slides
We present our flow chart 4 stages free business powerpoint templates 1 Circular Process Slides.Use our Marketing PowerPoint Templates because our templates illustrates your ability. Download and present our Arrows PowerPoint Templates because you should Demonstrate how you think out of the box. Download and present our Flow charts PowerPoint Templates because it shows them how to persistently hit bullseye. Present our Shapes PowerPoint Templates because our cleverly selected background hues are guaranteed to achieve this aim. Use our Business PowerPoint Templates because like the famed William Tell, they put aside all emotions and concentrate on the target.Use these PowerPoint slides for presentations relating to Analysis, analyze, background, blank, business, businessman, center, central, chart component, concept, connect, core, decentralize, deploy, diagram, disperse disseminate, distribute, diverge, diverse, diversify, divide, education, element, empty expand, extend, flow, gist, group, industry, link, man, management, manager, part people, person, plan, process, scatter, separate, spread, strategy, support, surround teacher, template, transfer. The prominent colors used in the PowerPoint template are Black, Gray, White. Presenters tell us our flow chart 4 stages free business powerpoint templates 1 Circular Process Slides are Enchanting. Presenters tell us our center PowerPoint templates and PPT Slides are Quaint. PowerPoint presentation experts tell us our flow chart 4 stages free business powerpoint templates 1 Circular Process Slides are Liberated. We assure you our background PowerPoint templates and PPT Slides are Clever. Customers tell us our flow chart 4 stages free business powerpoint templates 1 Circular Process Slides are Graceful. People tell us our chart PowerPoint templates and PPT Slides effectively help you save your valuable time.

Strategic Promotional Guide For Restaurant Business Advertising Clustered Column Chart Infographics PDF
Presenting this PowerPoint presentation, titled Strategic Promotional Guide For Restaurant Business Advertising Clustered Column Chart Infographics PDF, with topics curated by our researchers after extensive research. This editable presentation is available for immediate download and provides attractive features when used. Download now and captivate your audience. Presenting this Strategic Promotional Guide For Restaurant Business Advertising Clustered Column Chart Infographics PDF. Our researchers have carefully researched and created these slides with all aspects taken into consideration. This is a completely customizable Strategic Promotional Guide For Restaurant Business Advertising Clustered Column Chart Infographics PDF that is available for immediate downloading. Download now and make an impact on your audience. Highlight the attractive features available with our PPTs.

Bar Chart Representing Success Rate Of Linkedin Promotion Strategy Rules PDF
This slide shows graphical representation of LinkedIn marketing strategy in terms of success percentage by companies such as B2C, B2B software , B2B business services, etc. which reflects effectiveness of strategies in business Pitch your topic with ease and precision using this bar chart representing success rate of linkedin promotion strategy rules pdf. This layout presents information on bar chart representing success rate of linkedin promotion strategy. It is also available for immediate download and adjustment. So, changes can be made in the color, design, graphics or any other component to create a unique layout.

Coca Cola Emotional Marketing Strategy Bar Chart Ppt Professional Picture PDF
This Coca Cola Emotional Marketing Strategy Bar Chart Ppt Professional Picture PDF is perfect for any presentation, be it in front of clients or colleagues. It is a versatile and stylish solution for organizing your meetings. The Coca Cola Emotional Marketing Strategy Bar Chart Ppt Professional Picture PDF features a modern design for your presentation meetings. The adjustable and customizable slides provide unlimited possibilities for acing up your presentation. Slidegeeks has done all the homework before launching the product for you. So, dont wait, grab the presentation templates today

Pie Chart Representing Managing Time By Organization Manager Ppt PowerPoint Presentation Gallery Template PDF
This slide represents the percentage of time taken by an organization manager to perform various activities in the form of pie chart. It shows how effectively time is managed by him in performing various tasks like people management, planning, goal setting, employee monitoring, staff motivation etc. Pitch your topic with ease and precision using this pie chart representing managing time by organization manager ppt powerpoint presentation gallery template pdf. This layout presents information on staff motivation, personal time, travel training of fresher, administration. It is also available for immediate download and adjustment. So, changes can be made in the color, design, graphics or any other component to create a unique layout.

Column Chart Strategies For Acquiring Consumers With Customer Acquisition Budget Microsoft PDF
Are you searching for a Column Chart Strategies For Acquiring Consumers With Customer Acquisition Budget Microsoft PDF that is uncluttered, straightforward, and original It is easy to edit, and you can change the colors to suit your personal or business branding. For a presentation that expresses how much effort you have put in, this template is ideal With all of its features, including tables, diagrams, statistics, and lists, it is perfect for a business plan presentation. Make your ideas more appealing with these professional slides. Download Column Chart Strategies For Acquiring Consumers With Customer Acquisition Budget Microsoft PDF from Slidegeeks today.

Pareto Chart Tools For Project Quality Management Tools And Techniques For Process Improvement Elements PDF
This slide focuses on pareto chart tool for project quality management which shows reasons such as inadequate planning and documentation, lack of supervision, multiple errors, ineffective quality system, etc. Pitch your topic with ease and precision using this pareto chart tools for project quality management tools and techniques for process improvement elements pdf. This layout presents information on frequency, reasons behind low project quality, frequency of errors, planning. It is also available for immediate download and adjustment. So, changes can be made in the color, design, graphics or any other component to create a unique layout.

Pie Chart Indicating Funding Request For Key Business Areas Ppt Show Topics PDF
This slide showcases circular chart depicting funding ask for key business areas. It provides information about capital expenditure, marketing and sales, product development, personnel, etc. Pitch your topic with ease and precision using this pie chart indicating funding request for key business areas ppt show topics pdf. This layout presents information on product development, capex, marketing and sales, personnel. It is also available for immediate download and adjustment. So, changes can be made in the color, design, graphics or any other component to create a unique layout.

Control Chart Tools For Project Quality Management Tools And Techniques For Process Improvement Topics PDF
This slide shows the control chart tools for project quality management which includes upper and lower control limit, positive and negative sigma, average, etc. that shows with the passage of time, number of defects gets fluctuated that means the level of controlling process. Pitch your topic with ease and precision using this control chart tools for project quality management tools and techniques for process improvement topics pdf. This layout presents information on time, upper control limit, lower control limit. It is also available for immediate download and adjustment. So, changes can be made in the color, design, graphics or any other component to create a unique layout.

Weighted Average Cost Of Capital Of Capital And Enterprise Valuation Chart With Key Takeaways Inspiration PDF
The following slide highlights the weighted average cost of capital and enterprise valuation chart with key takeaways illustrating key headings which includes wacc, enterprise value, leverage and key takeaways. Pitch your topic with ease and precision using this Weighted Average Cost Of Capital Of Capital And Enterprise Valuation Chart With Key Takeaways Inspiration PDF. This layout presents information on Enterprise Value, Weighted Average, Capital Is Minimized. It is also available for immediate download and adjustment. So, changes can be made in the color, design, graphics or any other component to create a unique layout.
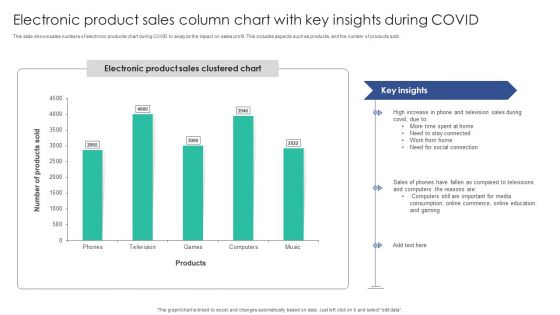
Electronic Product Sales Column Chart With Key Insights During COVID Microsoft PDF
This slide shows sales numbers of electronic products chart during COVID to analyze the impact on sales profit. This includes aspects such as products, and the number of products sold. Pitch your topic with ease and precision using this Electronic Product Sales Column Chart With Key Insights During COVID Microsoft PDF. This layout presents information on Stay Connected, Social Connection, Compared Televisions. It is also available for immediate download and adjustment. So, changes can be made in the color, design, graphics or any other component to create a unique layout.

People Travelling Reasons 2022 Survey Column Chart With Key Insights Sample PDF
This slide depicts survey chart for people traveling in 2022 to understand post covid travelling preferences. It includes parts such as reasons and travelling percentage rate.Pitch your topic with ease and precision using this People Travelling Reasons 2022 Survey Column Chart With Key Insights Sample PDF. This layout presents information on Visits Relatives, Leisure Trips, Personal Business. It is also available for immediate download and adjustment. So, changes can be made in the color, design, graphics or any other component to create a unique layout.
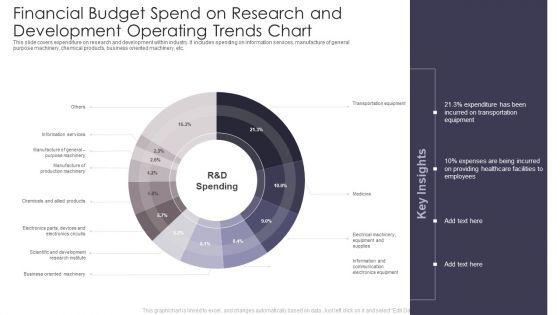
Financial Budget Spend On Research And Development Operating Trends Chart Professional PDF
This slide covers expenditure on research and development within industry. It includes spending on information services, manufacture of general purpose machinery, chemical products, business oriented machinery, etc. Pitch your topic with ease and precision using this Financial Budget Spend On Research And Development Operating Trends Chart Professional PDF. This layout presents information on Transportation Equipment, Healthcare Facilities, Trends Chart. It is also available for immediate download and adjustment. So, changes can be made in the color, design, graphics or any other component to create a unique layout.
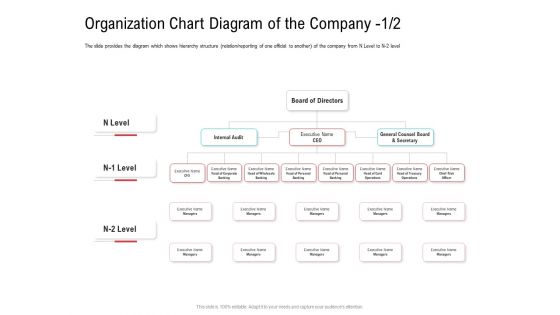
Investor Pitch Deck Collect Funding Spot Market Organization Chart Diagram Of The Company Designs PDF
The slide provides the diagram which shows hierarchy structure relation or reporting of one official to another of the company from N Level to N 2 level. This is a investor pitch deck collect funding spot market organization chart diagram of the company designs pdf template with various stages. Focus and dispense information on four stages using this creative set, that comes with editable features. It contains large content boxes to add your information on topics like executive name head of wholesale banking, executive name head of personal banking, executive name head of corporate banking. You can also showcase facts, figures, and other relevant content using this PPT layout. Grab it now.

Decision Making Flow Chart For Construction A Building Ppt Outline Background Designs PDF
This slide covers the information related to the construction project for making a building with the decisions taking by them for the same. It includes various steps through which an employee has to go through before finalizing his decision. Presenting Decision Making Flow Chart For Construction A Building Ppt Outline Background Designs PDF to dispense important information. This template comprises one stages. It also presents valuable insights into the topics including Specific Features, Project, Preferred Alternative. This is a completely customizable PowerPoint theme that can be put to use immediately. So, download it and address the topic impactfully.

Nine Stages Diverging Factors Flow Chart Cycle Circular Spoke PowerPoint Templates
We present our nine stages diverging factors flow chart cycle Circular Spoke PowerPoint templates.Download our Arrows PowerPoint Templates because you understand the ailment and how to fight it. Present our Signs PowerPoint Templates because your business and plans for its growth consist of processes that are highly co-related. Download our Process and Flows PowerPoint Templates because you have the ideas to develop the teams vision of where they need to be in the future. Download our Business PowerPoint Templates because this layout helps you to bring some important aspects of your business process to the notice of all concerned. Streamline the flow of information across the board. Use our Flow charts PowerPoint Templates because with the help of our Slides you can Illustrate your plans on using the many social media modes available to inform soceity at large of the benefits of your product.Use these PowerPoint slides for presentations relating to Arrow, background, board, business,chart, circle, circular, circulation, color,colorful, concept, curving, cycle,description, design, diagram, diagram,chart, diagramcircle, diagramelements,diagramvector, direction, element, flow,flowchart, fresh, graphic, illustration,loop, message, motion, phase, present,presentation, process, process,flow,ring, rotation, round, rounddiagram,section, segment, set, shape, sign, step,success, symbol. The prominent colors used in the PowerPoint template are Green, Black, Black. People tell us our nine stages diverging factors flow chart cycle Circular Spoke PowerPoint templates are Exuberant. Customers tell us our circle PowerPoint templates and PPT Slides are Spectacular. Professionals tell us our nine stages diverging factors flow chart cycle Circular Spoke PowerPoint templates are Tranquil. Presenters tell us our business PowerPoint templates and PPT Slides will generate and maintain the level of interest you desire. They will create the impression you want to imprint on your audience. Use our nine stages diverging factors flow chart cycle Circular Spoke PowerPoint templates are Whimsical. Presenters tell us our circulation PowerPoint templates and PPT Slides provide you with a vast range of viable options. Select the appropriate ones and just fill in your text.

4 Diverging Steps Of A Logical Sequence Ppt Cycle Chart PowerPoint Templates
We present our 4 diverging steps of a logical sequence ppt Cycle Chart PowerPoint templates.Download our Success PowerPoint Templates because iT outlines the entire thought process for the benefit of others. Tell it to the world with your characteristic aplomb. Download our Business PowerPoint Templates because your product has established a foothold in the market. Customers are happy with the value it brings to their lives. Use our Arrows PowerPoint Templates because Our PowerPoint Templates and Slides will let you Clearly mark the path for others to follow. Use our Flow Charts PowerPoint Templates because your brain is always churning out ideas like cogs in a wheel. Download our Shapes PowerPoint Templates because Our PowerPoint Templates and Slides will weave a web of your great ideas. They are gauranteed to attract even the most critical of your colleagues.Use these PowerPoint slides for presentations relating to Arrow, Brochure, Business, Chart, Circle, Cyclic, Data, Diagram, Financial, Goal, Graph, Illustration, Info, Information, Investment, Manage, Marketing, Model, Option, Part, Pie, Presentation, Process, Result, Sphere, Statistics, Stock, Strategy, Template, Wheel. The prominent colors used in the PowerPoint template are Blue light, Gray, White. People tell us our 4 diverging steps of a logical sequence ppt Cycle Chart PowerPoint templates are Reminiscent. Customers tell us our Cyclic PowerPoint templates and PPT Slides effectively help you save your valuable time. People tell us our 4 diverging steps of a logical sequence ppt Cycle Chart PowerPoint templates are Luxurious. Professionals tell us our Business PowerPoint templates and PPT Slides are effectively colour coded to prioritise your plans They automatically highlight the sequence of events you desire. Customers tell us our 4 diverging steps of a logical sequence ppt Cycle Chart PowerPoint templates are Dazzling. Use our Business PowerPoint templates and PPT Slides are Quaint.

Annual Product Sales Analysis With Three Column Bar Chart Ppt PowerPoint Presentation Inspiration Layouts PDF
Pitch your topic with ease and precision using this annual product sales analysis with three column bar chart ppt powerpoint presentation inspiration layouts pdf. This layout presents information on product sales, 2017 to 2020. It is also available for immediate download and adjustment. So, changes can be made in the color, design, graphics or any other component to create a unique layout.
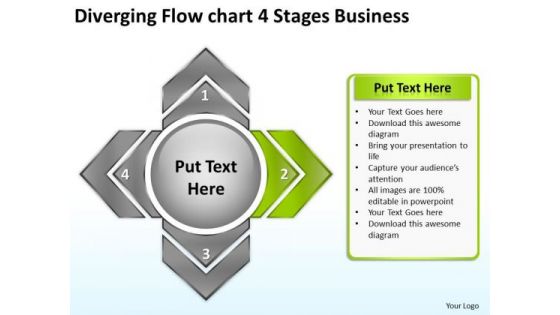
Flow Chart 4 Stages World Business PowerPoint Templates Radial Diagram Slides
We present our flow chart 4 stages world business powerpoint templates Radial Diagram Slides.Present our Arrows PowerPoint Templates because they are Designed to attract the attention of your audience. Use our Business PowerPoint Templates because it helps you to project your enthusiasm and single mindedness to your colleagues. Download and present our Flow Charts PowerPoint Templates because this is an excellent slide to detail and highlight your thought process, your views and your positive expectations.. Download our Shapes PowerPoint Templates because it helps to churn the mixture to the right degree and pound home your views and expectations in a spectacularly grand and virtuoso fluid performance. Download and present our Signs PowerPoint Templates because this diagram helps you to develop your marketing strategy and communicate your enthusiasm and motivation to raise the bar.Use these PowerPoint slides for presentations relating to Analysis, Analyze, Background, Blank, Business, Businessman, Center, Central, Chart, Component, Concept, Connect, Core, Decentralize, Deploy, Diagram, Disperse, Disseminate, Distribute, Diverge, Diverse, Diversify, Divide, Education, Element, Empty, Expand, Extend, Flow, Gist, Group, Industry, Link, Man, Management, Manager, Part, People, Person, Plan, Process, Scatter, Separate, Spread, Strategy, Support, Surround, Teacher, Template, Transfer. The prominent colors used in the PowerPoint template are Black, Green, Gray. We assure you our flow chart 4 stages world business powerpoint templates Radial Diagram Slides are Stunning. We assure you our Blank PowerPoint templates and PPT Slides are Versatile. Customers tell us our flow chart 4 stages world business powerpoint templates Radial Diagram Slides are Tasteful. Presenters tell us our Businessman PowerPoint templates and PPT Slides are Romantic. You can be sure our flow chart 4 stages world business powerpoint templates Radial Diagram Slides are aesthetically designed to attract attention. We guarantee that they will grab all the eyeballs you need. The feedback we get is that our Center PowerPoint templates and PPT Slides help you meet deadlines which are an element of today's workplace. Just browse and pick the slides that appeal to your intuitive senses.

Improvement Of Safety Performance At Construction Site Organizational Chart For Construction Slides PDF
The purpose of the following slide is to showcase the organizational chart for the construction site safety department of the company. It includes information regarding each employees name and associated designation. This Improvement Of Safety Performance At Construction Site Organizational Chart For Construction Slides PDF is perfect for any presentation, be it in front of clients or colleagues. It is a versatile and stylish solution for organizing your meetings. The Improvement Of Safety Performance At Construction Site Organizational Chart For Construction Slides PDF features a modern design for your presentation meetings. The adjustable and customizable slides provide unlimited possibilities for acing up your presentation. Slidegeeks has done all the homework before launching the product for you. So, dont wait, grab the presentation templates today
Budget Pie Chart Illustrating Promotional Costs Ppt PowerPoint Presentation Infographic Template Icon PDF
Pitch your topic with ease and precision using this budget pie chart illustrating promotional costs ppt powerpoint presentation infographic template icon pdf. This layout presents information on total budget allocated, online advertising, promotional items. It is also available for immediate download and adjustment. So, changes can be made in the color, design, graphics or any other component to create a unique layout.

 Home
Home