Comparison Chart

Digitalization Flow Chart Of Commercial Lending Process Slides Pdf
This slide includes digital transformation of commercial lending process for providing quick services to customers. It includes steps such as customer capturing, credit rating review, documentation, loan servicing and portfolio management Pitch your topic with ease and precision using this Digitalization Flow Chart Of Commercial Lending Process Slides Pdf. This layout presents information on Customer Capturing, Credit Rating Review, Documentation. It is also available for immediate download and adjustment. So, changes can be made in the color, design, graphics or any other component to create a unique layout.
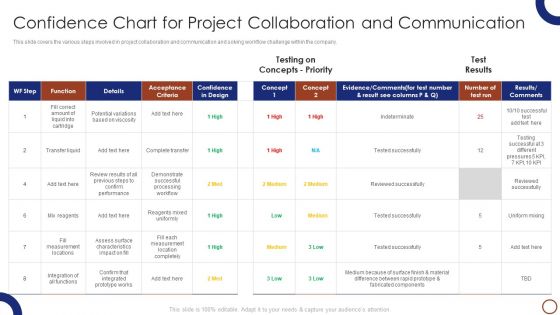
Teams Collaboration Confidence Chart For Project Collaboration Formats PDF
This slide covers the various steps involved in project collaboration and communication and solving workflow challenge within the company.Deliver and pitch your topic in the best possible manner with this Teams Collaboration Confidence Chart For Project Collaboration Formats PDF. Use them to share invaluable insights on Acceptance Criteria, Confirm Performance, Surface Characteristics and impress your audience. This template can be altered and modified as per your expectations. So, grab it now.
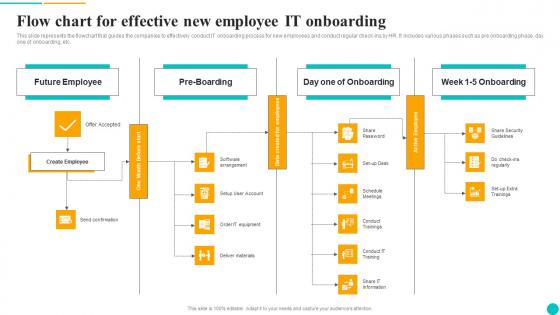
Flow Chart For Effective New Employee It Onboarding Guidelines Pdf
This slide represents the flowchart that guides the companies to effectively conduct IT onboarding process for new employees and conduct regular check-ins by HR. It includes various phases such as pre onboarding phase, day one of onboarding, etc. Pitch your topic with ease and precision using this Flow Chart For Effective New Employee It Onboarding Guidelines Pdf. This layout presents information on Future Employee, Pre Boarding, Day One Of Onboarding. It is also available for immediate download and adjustment. So, changes can be made in the color, design, graphics or any other component to create a unique layout.
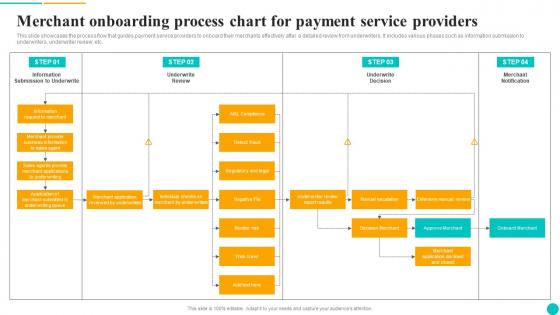
Merchant Onboarding Process Chart For Payment Service Providers Template Pdf
This slide showcases the process flow that guides payment service providers to onboard their merchants effectively after a detailed review from underwriters. It includes various phases such as information submission to underwriters, underwriter review, etc. Pitch your topic with ease and precision using this Merchant Onboarding Process Chart For Payment Service Providers Template Pdf. This layout presents information on Information Submission To Underwrite, Underwrite Review, Underwrite Decision. It is also available for immediate download and adjustment. So, changes can be made in the color, design, graphics or any other component to create a unique layout.

Flow Chart For Human Resource Management Process Microsoft Pdf
Following slide depicts the process flow diagram for human resources which will assist in create hiring plans to attract the best candidates to their firm. It starts with vacant seat in organization and ends with finally recruiting the employee either internally or externally. Pitch your topic with ease and precision using this Flow Chart For Human Resource Management Process Microsoft Pdf. This layout presents information on Recruit New Employee, Employ Staff, Contractor. It is also available for immediate download and adjustment. So, changes can be made in the color, design, graphics or any other component to create a unique layout.
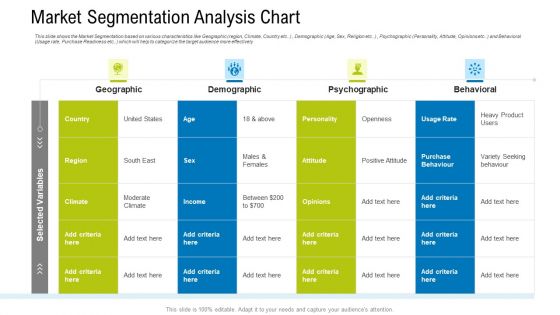
Market Segmentation Analysis Chart Ppt Infographic Template Graphic Tips PDF
This slide shows the Market Segmentation based on various characteristics like Geographic region, Climate, Country etc. , Demographic Age, Sex, Religion etc., Psychographic Personality, Attitude, Opinions etc. and Behavioral Usage rate, Purchase Readiness etc. which will help to categorize the target audience more effectively Deliver and pitch your topic in the best possible manner with this market segmentation analysis chart ppt infographic template graphic tips pdf. Use them to share invaluable insights on geographic, demographic, psychographic, behavioral and impress your audience. This template can be altered and modified as per your expectations. So, grab it now.
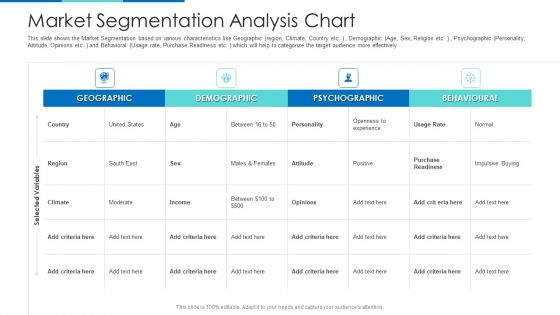
Market Segmentation Analysis Chart Ppt Show Designs PDF
This slide shows the Market Segmentation based on various characteristics like Geographic region, Climate, Country etc. Demographic Age, Sex, Religion etc. Psychographic Personality, Attitude, Opinions etc. and Behavioral Usage rate, Purchase Readiness etc which will help to categorize the target audience more effectively Deliver an awe-inspiring pitch with this creative market segmentation analysis chart ppt show designs pdf. bundle. Topics like geographic, demographic, psychographic, behavioural can be discussed with this completely editable template. It is available for immediate download depending on the needs and requirements of the user.

Market Segmentation Analysis Chart For Implementing Sales Strategy Clipart PDF
This slide shows the Market Segmentation based on various characteristics like Geographic region, Climate, Country etc , Demographic Age, Sex, Religion etc , Psychographic Personality, Attitude, Opinions etc and Behavioral Usage Rate, Purchase Readiness etc which will help to categorize the target audience more effectively and implement the sales strategy. Deliver an awe-inspiring pitch with this creative market segmentation analysis chart for implementing sales strategy clipart pdf. bundle. Topics like geographic, psychographic, selected variables, behavioral, selected variables, demographic can be discussed with this completely editable template. It is available for immediate download depending on the needs and requirements of the user.
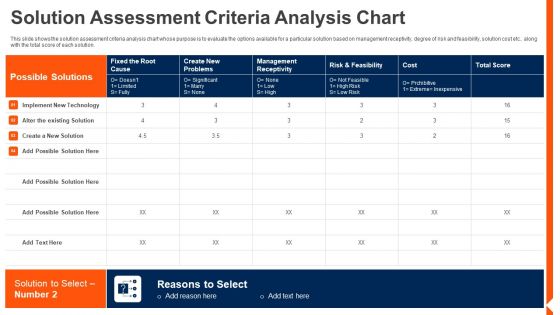
Solution Monitoring Verification Solution Assessment Criteria Analysis Chart Template PDF
This slide shows the overview and some details of the fifth task in solution assessment and validation process i.e. Validate Solution such as purpose of validating solution, process inputs and output description, elements, stakeholder details and validate solution model. Deliver an awe inspiring pitch with this creative solution monitoring verification solution assessment criteria analysis chart template pdf bundle. Topics like process, output, elements can be discussed with this completely editable template. It is available for immediate download depending on the needs and requirements of the user.
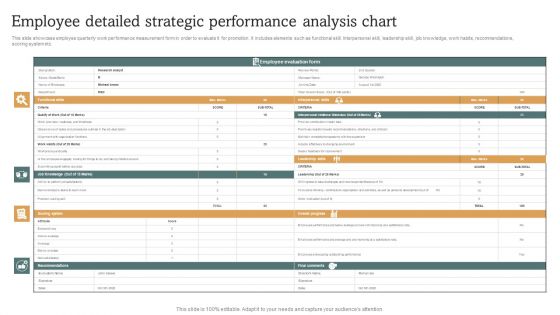
Employee Detailed Strategic Performance Analysis Chart Elements PDF
This slide showcase employee quarterly work performance measurement form in order to evaluate it for promotion. It includes elements such as functional skill. Interpersonal skill, leadership skill, job knowledge, work habits, recommendations, scoring system etc. Showcasing this set of slides titled Employee Detailed Strategic Performance Analysis Chart Elements PDF. The topics addressed in these templates are Employee Evaluation, Interpersonal Skills, Leadership Skills. All the content presented in this PPT design is completely editable. Download it and make adjustments in color, background, font etc. as per your unique business setting.

Company Product Sales Forecast Chart Ppt Gallery Design Templates PDF
This slide shows the Product sales forecast table with Product names along with price per unit and total units sold for the current as well as the projected period till the year 2023. Deliver and pitch your topic in the best possible manner with this company product sales forecast chart ppt gallery design templates pdf. Use them to share invaluable insights on active sports wear, gaming consoles, deodorants, product and impress your audience. This template can be altered and modified as per your expectations. So, grab it now.
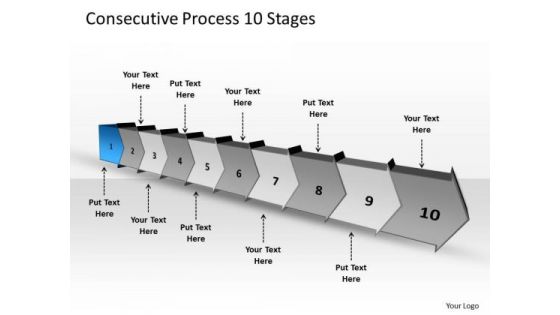
Consecutive Process 10 Stages Business Plan Flow Chart PowerPoint Templates
We present our consecutive process 10 stages business plan flow chart PowerPoint templates. Use our Arrows PowerPoint Templates because; amplify on this basic corporate concept and forefront the benefits of overlapping processes to arrive at common goals. Use our Business PowerPoint Templates because, Marketing Strategy Business Template:- Maximizing sales of your product is the intended destination. Use our Shapes PowerPoint Templates because; Outline your targets to your team. Use our Finance PowerPoint Templates because, Ideas roll along in your mind like billiard balls. Use our Process and Flows PowerPoint Templates because, are the seeds of many of our successes. Use these PowerPoint slides for presentations relating to abstract arrow blank business chart circular circulation concept conceptual consecutive design diagram executive flow icon idea illustration management model numbers organization procedure process. The prominent colors used in the PowerPoint template are Blue, Gray, and Black

Arrow Illustration 8 Stages Flow Chart Slides PowerPoint
We present our arrow illustration 8 stages flow chart Slides PowerPoint. Use our Arrows PowerPoint Templates because, getting it done in time is the key to success. Use our Business PowerPoint Templates because; illustrate your plans on using the many social media modes available to inform society at large of the benefits of your product. Use our Shapes PowerPoint Templates because, our ready backdrops leave a lasting impression. Use our Finance PowerPoint Templates because, Present your views using our innovative slides and be assured of leaving a lasting impression. Use our Process and Flows PowerPoint Templates because, and keep you group steady in the top bracket. Use these PowerPoint slides for presentations relating to 3d arrow background bullet business chart checkmark chevron diagram drop eps10 financial five glass graphic gray icon illustration management point process project reflection set shadow stage text transparency vector white. The prominent colors used in the PowerPoint template are Purple, Gray, and Black

Delivery Inspection Standard Procedures Workflow Chart Introduction PDF
This slide illustrates Standard Operating Procedures SOP guidelines for delivery inspection process. It includes checking incoming deliveries roster, check master schedule, etc. Pitch your topic with ease and precision using this Delivery Inspection Standard Procedures Workflow Chart Introduction PDF. This layout presents information on Logistics Operations Officer, Logistics, Manager, End. It is also available for immediate download and adjustment. So, changes can be made in the color, design, graphics or any other component to create a unique layout.
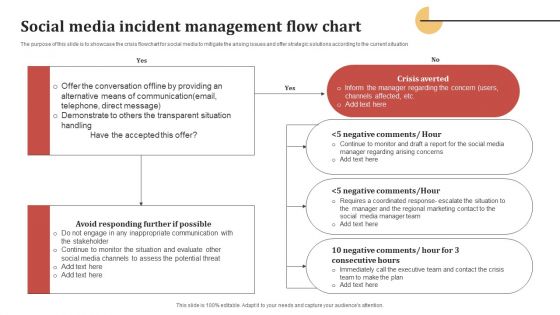
Social Media Incident Management Flow Chart Themes PDF
The purpose of this slide is to showcase the crisis flowchart for social media to mitigate the arising issues and offer strategic solutions according to the current situation. Pitch your topic with ease and precision using this Social Media Incident Management Flow Chart Themes PDF. This layout presents information on Regional Marketing, Team, Potential. It is also available for immediate download and adjustment. So, changes can be made in the color, design, graphics or any other component to create a unique layout.

Agenda For Organization Chart And Corporate Model Transformation Background PDF
This is a agenda for organization chart and corporate model transformation background pdf template with various stages. Focus and dispense information on three stages using this creative set, that comes with editable features. It contains large content boxes to add your information on topics like communication, decision making process, organizational hierarchy, management. You can also showcase facts, figures, and other relevant content using this PPT layout. Grab it now.
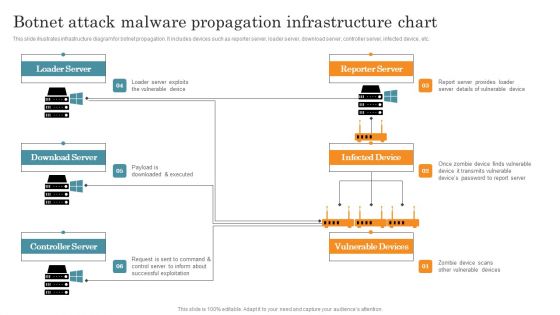
Botnet Attack Malware Propagation Infrastructure Chart Graphics PDF
This slide illustrates infrastructure diagram for botnet propagation. It includes devices such as reporter server, loader server, download server, controller server, infected device, etc. Pitch your topic with ease and precision using this Botnet Attack Malware Propagation Infrastructure Chart Graphics PDF. This layout presents information on Loader Server, Download Server, Controller Server. It is also available for immediate download and adjustment. So, changes can be made in the color, design, graphics or any other component to create a unique layout.
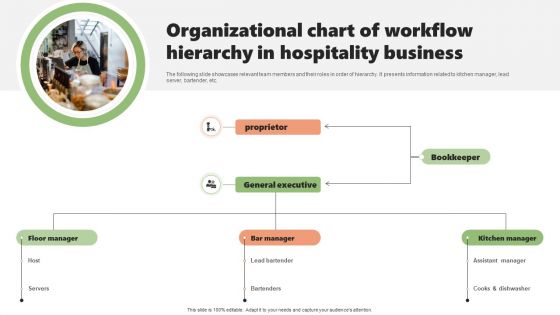
Organizational Chart Of Workflow Hierarchy In Hospitality Business Demonstration PDF
The following slide showcases relevant team members and their roles in order of hierarchy. It presents information related to kitchen manager, lead server, bartender, etc. Pitch your topic with ease and precision using this Organizational Chart Of Workflow Hierarchy In Hospitality Business Demonstration PDF. This layout presents information on Proprietor, General Executive, Bookkeeper. It is also available for immediate download and adjustment. So, changes can be made in the color, design, graphics or any other component to create a unique layout.

Employees Wellness And Benefits Plans Chart Clipart PDF
This slide illustrates consumerization of employee wellbeing and benefits plan. It includes retirement plans, health plans, education plans, transportation plans etc. Pitch your topic with ease and precision using this Employees Wellness And Benefits Plans Chart Clipart PDF. This layout presents information on Plans, Expenses, Organization. It is also available for immediate download and adjustment. So, changes can be made in the color, design, graphics or any other component to create a unique layout.
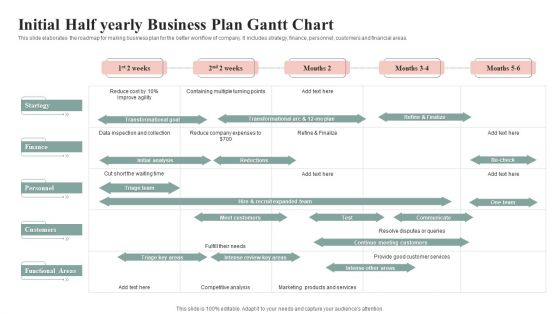
Initial Half Yearly Business Plan Gantt Chart Graphics PDF
This slide elaborates the roadmap for making business plan for the better workflow of company. It includes strategy, finance, personnel, customers and financial areas. Pitch your topic with ease and precision using this Initial Half Yearly Business Plan Gantt Chart Graphics PDF. This layout presents information on Finance, Startegy, Customers. It is also available for immediate download and adjustment. So, changes can be made in the color, design, graphics or any other component to create a unique layout.

Colorful Illustration Using Arrows Flow Chart Business Plan PowerPoint Templates
We present our colorful illustration using arrows flow chart business plan PowerPoint templates.Use our Arrows PowerPoint Templates because,You are the Champion of your team shall anoint. Use our Shapes PowerPoint Templates because, This will helps you to explore the minutest detail of each concept and follow the trail to its conclusion. Use our Signs PowerPoint Templates because,You can take it along a sure fire road to good profit. Use our Business PowerPoint Templates because, Spell out your advertising plans to increase market share. The feedback has been positive and productive Use our Process and Flows PowerPoint Templates because,They will Amplify your basic corporate concept and forefront the benefits of overlapping processes to arrive at common goals.Use these PowerPoint slides for presentations relating to 3d, background, colorful, communication, computing, concept, connection, data, database, design, development, digital, download, glossy, graphic, illustration, information, internet, isolated, network, networking, online, orange, plastic, security, segment, server, store, symbol, system, technology, upload, website,. The prominent colors used in the PowerPoint template are Green, Red, Black. People tell us our colorful illustration using arrows flow chart business plan PowerPoint templates are Spiffy. The feedback we get is that our data PowerPoint templates and PPT Slides are Versatile. People tell us our colorful illustration using arrows flow chart business plan PowerPoint templates are designed by a team of presentation professionals. Presenters tell us our concept PowerPoint templates and PPT Slides are Appealing. The feedback we get is that our colorful illustration using arrows flow chart business plan PowerPoint templates are Tranquil. Professionals tell us our concept PowerPoint templates and PPT Slides are Gorgeous.

Cyber Security Incident Response Process Flow Chart Download PDF
This slide represents the flow chart representing the detection and reaction to cyber security incidents, determination of their scope and risk and reduction of likelihood of incident from reoccurring. It starts with incident declaration and ends with system recovery. This Cyber Security Incident Response Process Flow Chart Download PDF from Slidegeeks makes it easy to present information on your topic with precision. It provides customization options, so you can make changes to the colors, design, graphics, or any other component to create a unique layout. It is also available for immediate download, so you can begin using it right away. Slidegeeks has done good research to ensure that you have everything you need to make your presentation stand out. Make a name out there for a brilliant performance.
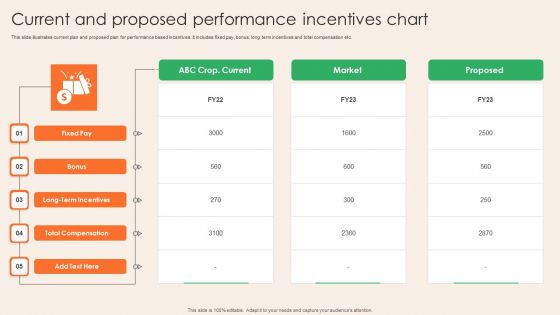
Current And Proposed Performance Incentives Chart Rules PDF
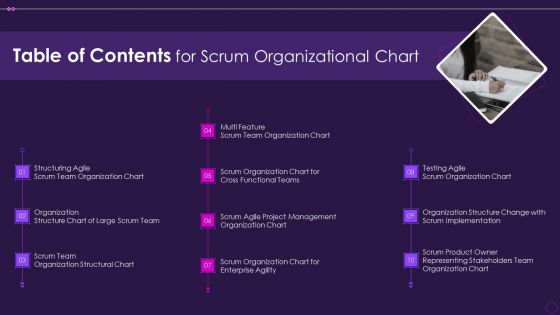
Table Of Contents For Scrum Organizational Chart Rules PDF
This is a table of contents for scrum organizational chart rules pdf template with various stages. Focus and dispense information on ten stages using this creative set, that comes with editable features. It contains large content boxes to add your information on topics like organization, management, teams, implementation. You can also showcase facts, figures, and other relevant content using this PPT layout. Grab it now.

New Staff Onboarding Process Task Assignment Chart Designs PDF
This slide displays the task appointment sheet, which helps determine departmental accountability. It also includes the status report for each employee onboarding process task. Pitch your topic with ease and precision using this New Staff Onboarding Process Task Assignment Chart Designs PDF. This layout presents information on Applications, Required Items, Information. It is also available for immediate download and adjustment. So, changes can be made in the color, design, graphics or any other component to create a unique layout.
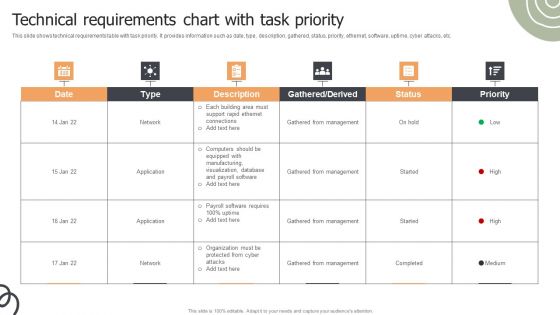
Technical Requirements Chart With Task Priority Ppt Infographics Styles PDF
This slide shows technical requirements table with task priority. It provides information such as date, type, description, gathered, status, priority, ethernet, software, uptime, cyber attacks, etc. Pitch your topic with ease and precision using this Technical Requirements Chart With Task Priority Ppt Infographics Styles PDF. This layout presents information on Gathered From Management, Network, Application. It is also available for immediate download and adjustment. So, changes can be made in the color, design, graphics or any other component to create a unique layout.

Business Value Gap Assessment Grid Chart Ppt Layouts Maker PDF
This is a business value gap assessment grid chart ppt layouts maker pdf template with various stages. Focus and dispense information on four stages using this creative set, that comes with editable features. It contains large content boxes to add your information on topics like strengths, weaknesses, opportunities, threats. You can also showcase facts, figures, and other relevant content using this PPT layout. Grab it now.

Scrum Organizational Chart 30 60 90 Days Plan Template PDF
This is a scrum organizational chart 30 60 90 days plan template pdf template with various stages. Focus and dispense information on three stages using this creative set, that comes with editable features. It contains large content boxes to add your information on topics like 30 60 90 days plan. You can also showcase facts, figures, and other relevant content using this PPT layout. Grab it now.
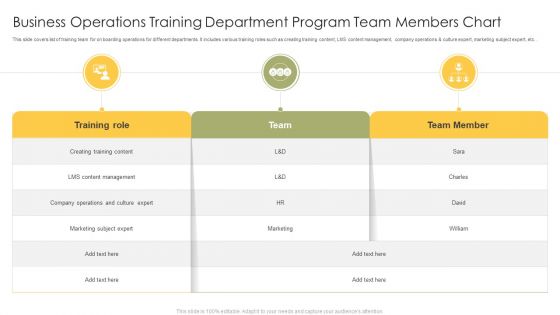
Business Operations Training Department Program Team Members Chart Mockup PDF
This slide covers list of training team for on boarding operations for different departments. It includes various training roles such as creating training content, LMS content management, company operations and culture expert, marketing subject expert, etc. Pitch your topic with ease and precision using this Business Operations Training Department Program Team Members Chart Mockup PDF. This layout presents information on Training Role, Team, LMS Content Management. It is also available for immediate download and adjustment. So, changes can be made in the color, design, graphics or any other component to create a unique layout.
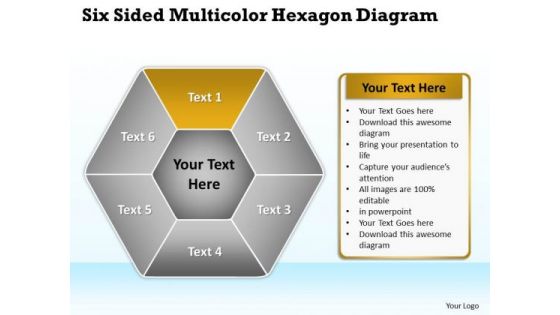
Business Diagram Chart Hexagon PowerPoint Templates Backgrounds For Slides
We present our business diagram chart hexagon PowerPoint templates backgrounds for slides.Use our Hexagon PowerPoint Templates because Our Template designs are State of the Art. Download our Business PowerPoint Templates because you have secured a name for yourself in the domestic market. Now the time is right to spread your reach to other countries. Present our Marketing PowerPoint Templates because The marketplace is the merger of your dreams and your ability. Download our Process and Flows PowerPoint Templates because it shows the pyramid which is a symbol of the desire to reach the top in a steady manner. Use our Shapes PowerPoint Templates because you have good reasons to back up the strength of your belief.Use these PowerPoint slides for presentations relating to Attached, Backgrounds, Blue, Cell, Color, Component, Connect, Connection, Diagram, Elements, Geometric, Graphic, Group, Hexagon, Honeycomb, Icon, Illustration, Intricacy, Lines, Link, Map, Mesh, Model, Network, Science, Shape, Shiny, Strategy, Structure, Symbol, Teamwork, Technology. The prominent colors used in the PowerPoint template are Yellow, White, Gray. PowerPoint presentation experts tell us our business diagram chart hexagon PowerPoint templates backgrounds for slides are Elegant. Professionals tell us our Cell PowerPoint templates and PPT Slides are effectively colour coded to prioritise your plans They automatically highlight the sequence of events you desire. People tell us our business diagram chart hexagon PowerPoint templates backgrounds for slides have awesome images to get your point across. We assure you our Blue PowerPoint templates and PPT Slides are Fancy. PowerPoint presentation experts tell us our business diagram chart hexagon PowerPoint templates backgrounds for slides are Endearing. Professionals tell us our Blue PowerPoint templates and PPT Slides are Liberated.

Organization Chart And Corporate Model Transformation Timeline Download PDF
This is a organization chart and corporate model transformation timeline download pdf template with various stages. Focus and dispense information on five stages using this creative set, that comes with editable features. It contains large content boxes to add your information on topics like timeline, 2018 to 2022. You can also showcase facts, figures, and other relevant content using this PPT layout. Grab it now.

Gantt Chart For Media Agency Services Proposal Template PDF
Take your presentations to the next level with our Gantt Chart For Media Agency Services Proposal Template PDF template. With its sleek design and seamless editing features, this single-slide PPT template is a game-changer for professionals who want to make an impact. Impress your audience with stunning visuals and engaging content that will capture their attention from start to finish. Get your hands on our template and elevate your presentations to new heights.
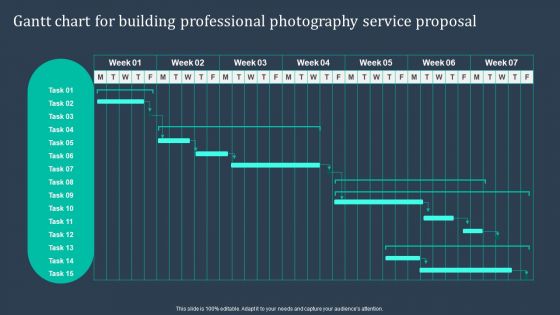
Gantt Chart For Building Professional Photography Service Proposal Rules PDF
Take your presentations to the next level with our Gantt Chart For Building Professional Photography Service Proposal Rules PDF template. With its sleek design and seamless editing features, this single-slide PPT template is a game-changer for professionals who want to make an impact. Impress your audience with stunning visuals and engaging content that will capture their attention from start to finish. Get your hands on our template and elevate your presentations to new heights.
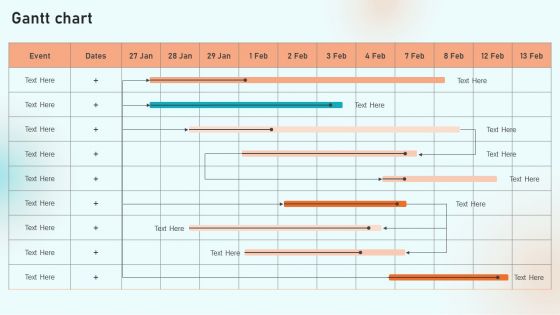
Gantt Chart Loan Currency Services Proposal Ppt Infographics Demonstration PDF
Take your presentations to the next level with our Gantt Chart Loan Currency Services Proposal Ppt Infographics Demonstration PDF template. With its sleek design and seamless editing features, this single-slide PPT template is a game-changer for professionals who want to make an impact. Impress your audience with stunning visuals and engaging content that will capture their attention from start to finish. Get your hands on our template and elevate your presentations to new heights.
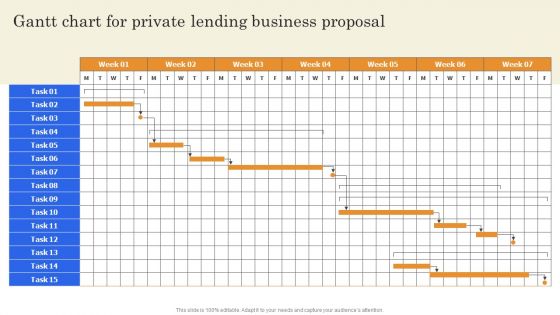
Gantt Chart For Private Lending Business Proposal Infographics PDF
Take your presentations to the next level with our Gantt Chart For Private Lending Business Proposal Infographics PDF template. With its sleek design and seamless editing features, this single-slide PPT template is a game-changer for professionals who want to make an impact. Impress your audience with stunning visuals and engaging content that will capture their attention from start to finish. Get your hands on our template and elevate your presentations to new heights.
4 Phase Marketing Campaign Tracking Chart Ppt Slides Icons PDF
This slide covers the marketing campaign analysis sheet. It includes campaign stages such as planning, preparation, deployment, and follow-up. It includes campaign details such as phases, time, duration, due date, completion, partner, owner, etc. Find a pre-designed and impeccable 4 Phase Marketing Campaign Tracking Chart Ppt Slides Icons PDF. The templates can ace your presentation without additional effort. You can download these easy-to-edit presentation templates to make your presentation stand out from others. So, what are you waiting for Download the template from Slidegeeks today and give a unique touch to your presentation.
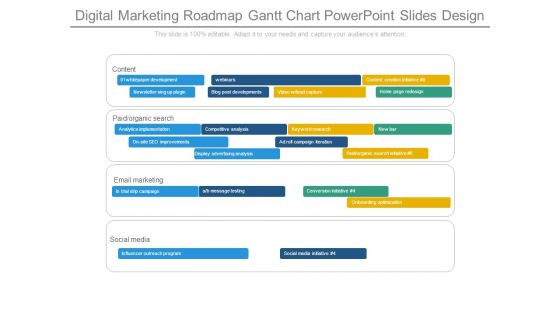
Digital Marketing Roadmap Gantt Chart Powerpoint Slides Design
This is a digital marketing roadmap gantt chart powerpoint slides design. This is a four stage process. The stages in this process are content, whitepaper development, webinars, content creation initiative, newsletter sing up plugin, blog post developments, video lead capture, home page redesign, paid organic search, analytics implementation, competitive analysis, keyword research, new bar, on site seo improvements, ad roll campaign iteration, display advertising analysis, paid organic search initiative, email marketing, trial drip campaign, a b message testing, conversion initiative, onboarding optimization, social media, influencer outreach program , social media initiative.
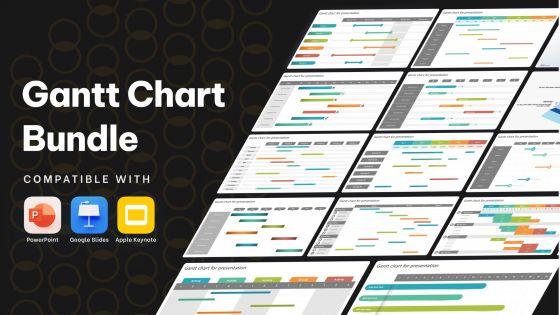
Gantt Chart Bundle Powerpoint Ppt Templates And Slides

Flow Chart Showing Mobile Payments Comprehensive Smartphone Banking Elements Pdf
This slide shows details which can be used to understand how near field communication technology works in mobile payments. It includes various components such as mobile phone, payment app, bank, card issuer, card reader, etc.Coming up with a presentation necessitates that the majority of the effort goes into the content and the message you intend to convey. The visuals of a PowerPoint presentation can only be effective if it supplements and supports the story that is being told. Keeping this in mind our experts created Flow Chart Showing Mobile Payments Comprehensive Smartphone Banking Elements Pdf to reduce the time that goes into designing the presentation. This way, you can concentrate on the message while our designers take care of providing you with the right template for the situation.

QA Process Framework Flow Chart For Healthcare Firm Diagrams PDF
Following slide showcases quality assurance process which can be used by healthcare business to improve patient service practices. It includes key components such as quality assurance guide, customer service quality management, employee training, and general guidelines of quality assurance, etc. Pitch your topic with ease and precision using this QA Process Framework Flow Chart For Healthcare Firm Diagrams PDF. This layout presents information on Customer Service Quality Management, Quality Assurance, Health Care Research Department. It is also available for immediate download and adjustment. So, changes can be made in the color, design, graphics or any other component to create a unique layout.

Gantt Chart For Project Software Development Management Themes PDF
This slide depicts software development project planning illustrating phases such as project research, designing, environmental setup and sprint planning that enables managers to track and follow project progress. Pitch your topic with ease and precision using this Gantt Chart For Project Software Development Management Themes PDF. This layout presents information on Design, Finalization Of Scope, Staging Environment. It is also available for immediate download and adjustment. So, changes can be made in the color, design, graphics or any other component to create a unique layout.
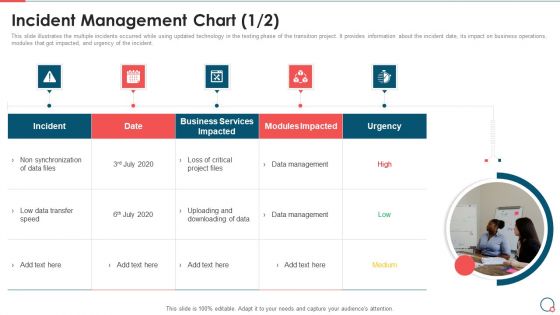
Information Technology Change Implementation Plan Incident Management Chart Inspiration PDF
This slide illustrates the multiple incidents occurred while using updated technology in the testing phase of the transition project. It provides information about the incident date, its impact on business operations, modules that got impacted, and urgency of the incident. This is a Information Technology Change Implementation Plan Incident Management Chart Inspiration PDF template with various stages. Focus and dispense information on five stages using this creative set, that comes with editable features. It contains large content boxes to add your information on topics like Incident, Business Services Impacted, Modules Impacted, High, Low, Medium. You can also showcase facts, figures, and other relevant content using this PPT layout. Grab it now.

Recruitment Process Half Yearly Gantt Chart Mockup PDF
This slide contains the monthly break up of tasks for the recruitment or hiring process of employees by the human resources for a successful onboarding. It includes job requirement and description, HR strategy, promotion, interview, onboarding , etc. Pitch your topic with ease and precision using this Recruitment Process Half Yearly Gantt Chart Mockup PDF. This layout presents information on Recruitment Strategy, Human Resources, Organisation. It is also available for immediate download and adjustment. So, changes can be made in the color, design, graphics or any other component to create a unique layout.
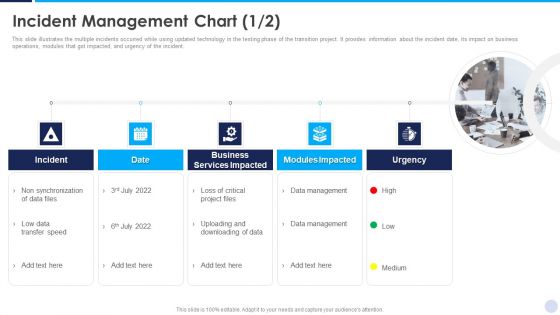
Implementation Strategy For Project Solution Incident Management Chart Pictures PDF
This slide illustrates the multiple incidents occurred while using updated technology in the testing phase of the transition project. It provides information about the incident date, its impact on business operations, modules that got impacted, and urgency of the incident. This is a Implementation Strategy For Project Solution Incident Management Chart Pictures PDF template with various stages. Focus and dispense information on five stages using this creative set, that comes with editable features. It contains large content boxes to add your information on topics like Business Services Impacted, Modules Impacted, Data management. You can also showcase facts, figures, and other relevant content using this PPT layout. Grab it now.
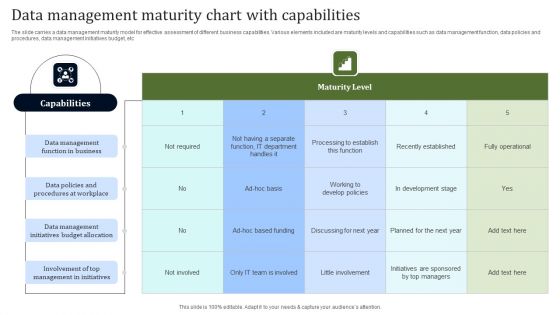
Data Management Maturity Chart With Capabilities Topics PDF
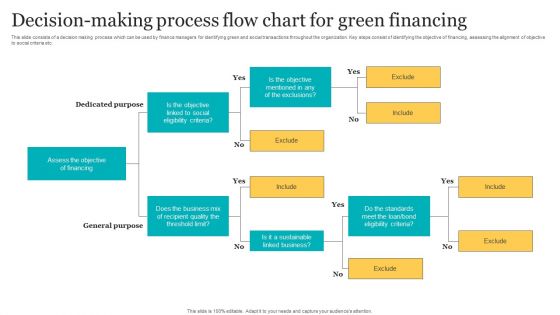
Decision Making Process Flow Chart For Green Financing Guidelines PDF
This slide consists of a decision making process which can be used by finance managers for identifying green and social transactions throughout the organization. Key steps consist of identifying the objective of financing, assessing the alignment of objective to social criteria etc. Pitch your topic with ease and precision using this Decision Making Process Flow Chart For Green Financing Guidelines PDF. This layout presents information on Dedicated Purpose, General Purpose, Financing. It is also available for immediate download and adjustment. So, changes can be made in the color, design, graphics or any other component to create a unique layout.

Business Operations Accounting Procedure Flow Chart Clipart PDF
This slide consists of a comprehensive representation of financial accounting process followed in the business organization. Key elements include transportation, human resource training, charitable events, accounting process, tasks, documents etc. Pitch your topic with ease and precision using this Business Operations Accounting Procedure Flow Chart Clipart PDF. This layout presents information on Accounting, Process Activities, Transportation . It is also available for immediate download and adjustment. So, changes can be made in the color, design, graphics or any other component to create a unique layout.
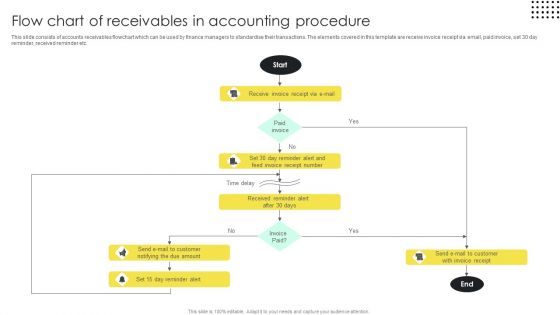
Flow Chart Of Receivables In Accounting Procedure Brochure PDF
This slide consists of accounts receivables flowchart which can be used by finance managers to standardise their transactions. The elements covered in this template are receive invoice receipt via email, paid invoice, set 30 day reminder, received reminder etc. Pitch your topic with ease and precision using this Flow Chart Of Receivables In Accounting Procedure Brochure PDF. This layout presents information on Reminder Alert, Invoice Receipt, Procedure. It is also available for immediate download and adjustment. So, changes can be made in the color, design, graphics or any other component to create a unique layout.

Automated Flow Chart With Collaborative Manufacturing Workflow Infographics PDF
Following slide demonstrates automated workflow of manufacturing process which can be used by business for timely product delivery. It includes key components such as client, sales department, manufacturing department, purchasing, and shipping department. Showcasing this set of slides titled Automated Flow Chart With Collaborative Manufacturing Workflow Infographics PDF. The topics addressed in these templates are Product Arrangement, Order Development, Download Invoice. All the content presented in this PPT design is completely editable. Download it and make adjustments in color, background, font etc. as per your unique business setting.
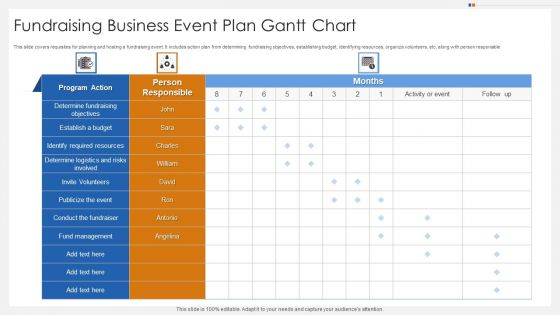
Fundraising Business Event Plan Gantt Chart Microsoft PDF
This slide covers requisites for planning and hosting a fundraising event. It includes action plan from determining fundraising objectives, establishing budget, identifying resources, organize volunteers, etc. along with person responsible. Pitch your topic with ease and precision using this Fundraising Business Event Plan Gantt Chart Microsoft PDF. This layout presents information on Establish A Budget, Fund Management, Identify Required Resources. It is also available for immediate download and adjustment. So, changes can be made in the color, design, graphics or any other component to create a unique layout.
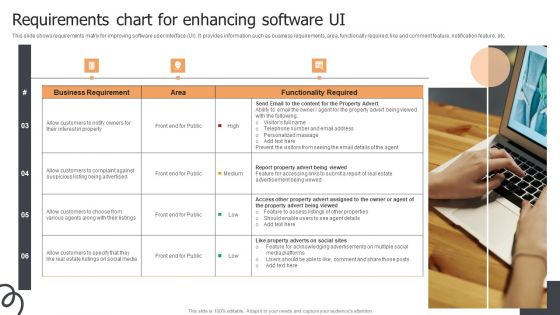
Requirements Chart For Enhancing Software UI Ppt Show Slide PDF
This slide shows requirements matrix for improving software user interface UI. It provides information such as business requirements, area, functionally required, like and comment feature, notification feature, etc. Presenting Requirements Chart For Enhancing Software UI Ppt Show Slide PDF to dispense important information. This template comprises three stages. It also presents valuable insights into the topics including Business Requirement, Area, Functionality Required. This is a completely customizable PowerPoint theme that can be put to use immediately. So, download it and address the topic impactfully.
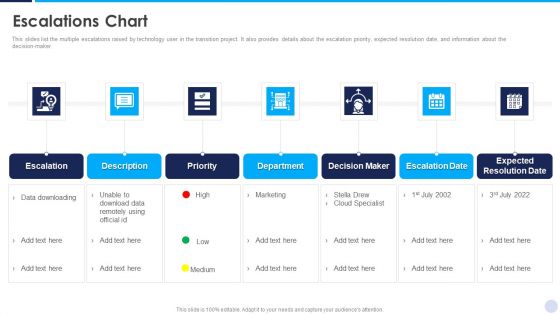
Implementation Strategy For Project Solution Escalations Chart Clipart PDF
This slides list the multiple escalations raised by technology user in the transition project. It also provides details about the escalation priority, expected resolution date, and information about the decision-maker. This is a Implementation Strategy For Project Solution Escalations Chart Clipart PDF template with various stages. Focus and dispense information on seven stages using this creative set, that comes with editable features. It contains large content boxes to add your information on topics like Decision Maker, Escalation Date, Expected Resolution. You can also showcase facts, figures, and other relevant content using this PPT layout. Grab it now.

3 Components Required In Process Flow Chart Free PowerPoint Templates
We present our 3 components required in process flow chart free PowerPoint templates. Use our Marketing PowerPoint Templates because, illustrate your ideas one by one and demonstrate how each is an important cog in running the entire wheel. Use our Business PowerPoint Templates because; Reaffirm to your team your faith in maintaining the highest ethical standards. Use our Shapes PowerPoint Templates because, hence this diagram has the unique ability to drive home your ideas and show how they mesh to guarantee success. Use our Process and Flows PowerPoint Templates because, you have the product you are very confident of and are very sure it will prove immensely popular with clients all over your target areas. Use our Arrows PowerPoint Templates because, To achieve sure shot success they need to come together at the right time, place and manner. Use these PowerPoint slides for presentations relating to Advertising, arrow, background, banner, bookmark, choice, concept, creative, design, direction, flow, illustration, instruction, label, layout, manual, marketing, modern, next, offer, options, order, pointer, process, product, promotion, sequence, simple, special, symbol, template, tutorial, two, vector, version, website. The prominent colors used in the PowerPoint template are Green, Gray, and White
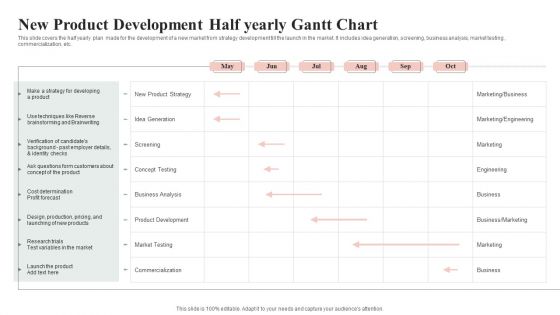
New Product Development Half Yearly Gantt Chart Summary PDF
This slide covers the half yearly plan made for the development of a new market from strategy development till the launch in the market. It includes idea generation, screening, business analysis, market testing , commercialization, etc. Pitch your topic with ease and precision using this New Product Development Half Yearly Gantt Chart Summary PDF. This layout presents information on New Product Strategy, Business Analysis, Product Development. It is also available for immediate download and adjustment. So, changes can be made in the color, design, graphics or any other component to create a unique layout.

Half Yearly Gantt Chart For Employee Training Download PDF
This slide contains the plan for training the employees of the organization for their own benefit. It includes some tasks that has to be followed to make this process a success. Pitch your topic with ease and precision using this Half Yearly Gantt Chart For Employee Training Download PDF. This layout presents information on Information, Employees, Business. It is also available for immediate download and adjustment. So, changes can be made in the color, design, graphics or any other component to create a unique layout.
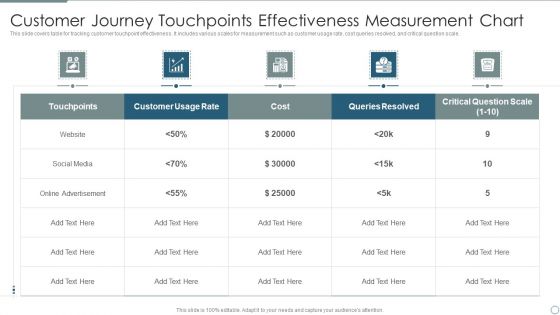
Customer Journey Touchpoints Effectiveness Measurement Chart Guidelines PDF
This slide covers table for tracking customer touchpoint effectiveness. It includes various scales for measurement such as customer usage rate, cost queries resolved, and critical question scale. Pitch your topic with ease and precision using this Customer Journey Touchpoints Effectiveness Measurement Chart Guidelines PDF. This layout presents information on Social Media, Online Advertisement, Customer Usage Rate. It is also available for immediate download and adjustment. So, changes can be made in the color, design, graphics or any other component to create a unique layout.

Contract Management Half Yearly Gantt Chart Mockup PDF
This slide covers the information on how to manage the process of research or what activities has to be done for getting the accurate results form our research. Pitch your topic with ease and precision using this Contract Management Half Yearly Gantt Chart Mockup PDF. This layout presents information on Recognize Requirements, Budget, Execute Field Evaluation. It is also available for immediate download and adjustment. So, changes can be made in the color, design, graphics or any other component to create a unique layout.

5 Year Selling Forecasts Conversion Rate Chart Microsoft PDF
This slide covers forecast for sales conversion rates. It includes elements such as units in pipeline, pipeline growth rate, sales conversion rate, annual units sold, price per unit, forecast on revenue generation, etc. Pitch your topic with ease and precision using this 5 Year Selling Forecasts Conversion Rate Chart Microsoft PDF. This layout presents information on Conversion Rate, Price Per Unit, Growth Rate. It is also available for immediate download and adjustment. So, changes can be made in the color, design, graphics or any other component to create a unique layout.
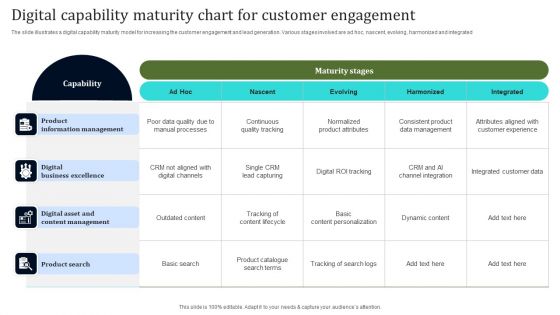
Digital Capability Maturity Chart For Customer Engagement Structure PDF
The slide illustrates a digital capability maturity model for increasing the customer engagement and lead generation. Various stages involved are ad hoc, nascent, evolving, harmonized and integrated. Pitch your topic with ease and precision using this Digital Capability Maturity Chart For Customer Engagement Structure PDF. This layout presents information on Digital Business Excellence, Product Search, Product Information Management. It is also available for immediate download and adjustment. So, changes can be made in the color, design, graphics or any other component to create a unique layout.
Organization Chart And Corporate Model Transformation Organization Restructuring Icons PDF
This is restructuring process, the sequence of steps or activities that a restructuring team will follow for restructuring organization. These are the basic steps of restructuring process such as initiate restructuring process, review by request board, planning, implementation, review and sustain. This is a organization chart and corporate model transformation organization restructuring icons pdf template with various stages. Focus and dispense information on six stages using this creative set, that comes with editable features. It contains large content boxes to add your information on topics like initiate restructuring process, review by request board, planning, implementation, review. You can also showcase facts, figures, and other relevant content using this PPT layout. Grab it now.
Line Chart Ppt PowerPoint Presentation Complete Deck With Slides
This Line Chart Ppt PowerPoint Presentation Complete Deck With Slides acts as backup support for your ideas, vision, thoughts, etc. Use it to present a thorough understanding of the topic. This PPT slideshow can be utilized for both in-house and outside presentations depending upon your needs and business demands. Entailing twelve slides with a consistent design and theme, this template will make a solid use case. As it is intuitively designed, it suits every business vertical and industry. All you have to do is make a few tweaks in the content or any other component to design unique presentations. The biggest advantage of this complete deck is that it can be personalized multiple times once downloaded. The color, design, shapes, and other elements are free to modify to add personal touches. You can also insert your logo design in this PPT layout. Therefore a well-thought and crafted presentation can be delivered with ease and precision by downloading this Line Chart Ppt PowerPoint Presentation Complete Deck With Slides PPT slideshow.
Stacked Bar Chart Ppt PowerPoint Presentation Complete Deck With Slides
This Stacked Bar Chart Ppt PowerPoint Presentation Complete Deck With Slides acts as backup support for your ideas, vision, thoughts, etc. Use it to present a thorough understanding of the topic. This PPT slideshow can be utilized for both in-house and outside presentations depending upon your needs and business demands. Entailing eleven slides with a consistent design and theme, this template will make a solid use case. As it is intuitively designed, it suits every business vertical and industry. All you have to do is make a few tweaks in the content or any other component to design unique presentations. The biggest advantage of this complete deck is that it can be personalized multiple times once downloaded. The color, design, shapes, and other elements are free to modify to add personal touches. You can also insert your logo design in this PPT layout. Therefore a well-thought and crafted presentation can be delivered with ease and precision by downloading this Stacked Bar Chart Ppt PowerPoint Presentation Complete Deck With Slides PPT slideshow.
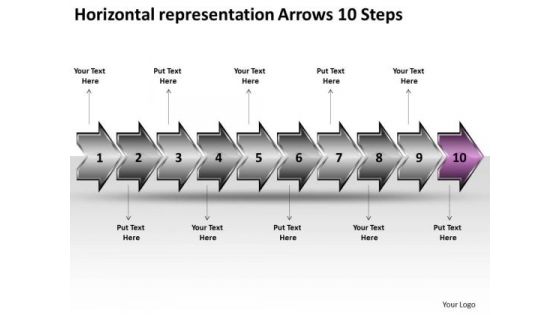
Horizontal Representation Arrows 10 Steps Documentation Flow Chart PowerPoint Templates
We present our horizontal representation arrows 10 steps documentation flow chart PowerPoint templates. Use our Design PowerPoint Templates because; represent the progress in our lives. Use our Arrows PowerPoint Templates because; now funnel your marketing strategies down the cone, stage by stage, refining as you go along. Use our Process and Flows PowerPoint Templates because, But you have an idea of which you are sure. Use our Shapes PowerPoint Templates because; amplify on this basic corporate concept and forefront the benefits of overlapping processes to arrive at common goals. Use our Business PowerPoint Templates because, Marketing Strategy Business Template:- Maximizing sales of your product is the intended destination. Use these PowerPoint slides for presentations relating to 3d ,abstract, around, arrows, business, center, circle, circular, concept, connections, curve, cycle, directions, distribution, illustration, management, middle, objects, plan, process, recycle, rounded, shadows, space, system. The prominent colors used in the PowerPoint template are Purple, White, and Gray

Incentive Programs Chart Ppt PowerPoint Presentation Complete With Slides
Boost your confidence and team morale with this well-structured Incentive Programs Chart Ppt PowerPoint Presentation Complete With Slides. This prefabricated set gives a voice to your presentation because of its well-researched content and graphics. Our experts have added all the components very carefully, thus helping you deliver great presentations with a single click. Not only that, it contains a set of forteen slides that are designed using the right visuals, graphics, etc. Various topics can be discussed, and effective brainstorming sessions can be conducted using the wide variety of slides added in this complete deck. Apart from this, our PPT design contains clear instructions to help you restructure your presentations and create multiple variations. The color, format, design anything can be modified as deemed fit by the user. Not only this, it is available for immediate download. So, grab it now.

Progress Chart Ppt PowerPoint Presentation Complete Deck With Slides
Boost your confidence and team morale with this well-structured Progress Chart Ppt PowerPoint Presentation Complete Deck With Slides. This prefabricated set gives a voice to your presentation because of its well-researched content and graphics. Our experts have added all the components very carefully, thus helping you deliver great presentations with a single click. Not only that, it contains a set of eleven slides that are designed using the right visuals, graphics, etc. Various topics can be discussed, and effective brainstorming sessions can be conducted using the wide variety of slides added in this complete deck. Apart from this, our PPT design contains clear instructions to help you restructure your presentations and create multiple variations. The color, format, design anything can be modified as deemed fit by the user. Not only this, it is available for immediate download. So, grab it now.

Maturity Chart Ppt PowerPoint Presentation Complete Deck With Slides
Boost your confidence and team morale with this well-structured Maturity Chart Ppt PowerPoint Presentation Complete Deck With Slides. This prefabricated set gives a voice to your presentation because of its well-researched content and graphics. Our experts have added all the components very carefully, thus helping you deliver great presentations with a single click. Not only that, it contains a set of twelve slides that are designed using the right visuals, graphics, etc. Various topics can be discussed, and effective brainstorming sessions can be conducted using the wide variety of slides added in this complete deck. Apart from this, our PPT design contains clear instructions to help you restructure your presentations and create multiple variations. The color, format, design anything can be modified as deemed fit by the user. Not only this, it is available for immediate download. So, grab it now.
Flow Chart Icon Strategy Development Ppt PowerPoint Presentation Complete Deck
Boost your confidence and team morale with this well-structured flow chart icon strategy development ppt powerpoint presentation complete deck. This prefabricated set gives a voice to your presentation because of its well-researched content and graphics. Our experts have added all the components very carefully, thus helping you deliver great presentations with a single click. Not only that, it contains a set of ten slides that are designed using the right visuals, graphics, etc. Various topics can be discussed, and effective brainstorming sessions can be conducted using the wide variety of slides added in this complete deck. Apart from this, our PPT design contains clear instructions to help you restructure your presentations and create multiple variations. The color, format, design anything can be modified as deemed fit by the user. Not only this, it is available for immediate download. So, grab it now.
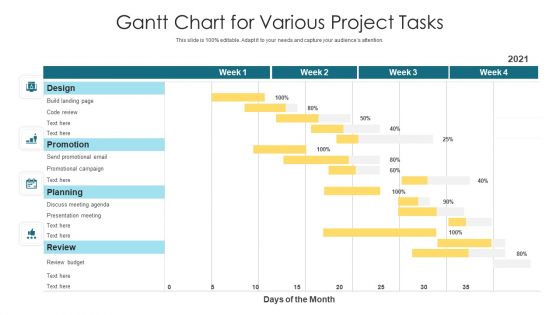
Gantt Chart For Various Project Tasks Formats PDF
Plan, track and synchronize the most important tasks of any project with this exemplary gantt chart for various project tasks formats pdf. This lucrative template can be used to manage the project efficiently. You can enter all the vital components of the project like the start date, duration, and status of each task to keep the owners accountability in check. Create a highly proficient scheduling plan and measure its progress with this elaborative layout. In addition, you can add your activities in the taskbar included in this template and edit it to handle your project effectively. This template is ideal for project management, business plans, student projects, and assignments. So download and captivate your audience.

Headline Footer Section Chart Table Ppt PowerPoint Presentation Complete Deck
Boost your confidence and team morale with this well-structured headline footer section chart table ppt powerpoint presentation complete deck. This prefabricated set gives a voice to your presentation because of its well-researched content and graphics. Our experts have added all the components very carefully, thus helping you deliver great presentations with a single click. Not only that, it contains a set of eleven slides that are designed using the right visuals, graphics, etc. Various topics can be discussed, and effective brainstorming sessions can be conducted using the wide variety of slides added in this complete deck. Apart from this, our PPT design contains clear instructions to help you restructure your presentations and create multiple variations. The color, format, design anything can be modified as deemed fit by the user. Not only this, it is available for immediate download. So, grab it now.

Spider Chart Business Management Ppt PowerPoint Presentation Complete Deck
Boost your confidence and team morale with this well-structured spider chart business management ppt powerpoint presentation complete deck. This prefabricated set gives a voice to your presentation because of its well-researched content and graphics. Our experts have added all the components very carefully, thus helping you deliver great presentations with a single click. Not only that, it contains a set of twelve slides that are designed using the right visuals, graphics, etc. Various topics can be discussed, and effective brainstorming sessions can be conducted using the wide variety of slides added in this complete deck. Apart from this, our PPT design contains clear instructions to help you restructure your presentations and create multiple variations. The color, format, design anything can be modified as deemed fit by the user. Not only this, it is available for immediate download. So, grab it now.
Procedure Chart Ppt PowerPoint Presentation Complete With Slides
Boost your confidence and team morale with this well-structured Procedure Chart Ppt PowerPoint Presentation Complete With Slides. This prefabricated set gives a voice to your presentation because of its well-researched content and graphics. Our experts have added all the components very carefully, thus helping you deliver great presentations with a single click. Not only that, it contains a set of twelve slides that are designed using the right visuals, graphics, etc. Various topics can be discussed, and effective brainstorming sessions can be conducted using the wide variety of slides added in this complete deck. Apart from this, our PPT design contains clear instructions to help you restructure your presentations and create multiple variations. The color, format, design anything can be modified as deemed fit by the user. Not only this, it is available for immediate download. So, grab it now.

Linear Chart Ppt PowerPoint Presentation Complete Deck With Slides
Boost your confidence and team morale with this well-structured Linear Chart Ppt PowerPoint Presentation Complete Deck With Slides. This prefabricated set gives a voice to your presentation because of its well-researched content and graphics. Our experts have added all the components very carefully, thus helping you deliver great presentations with a single click. Not only that, it contains a set of forteen slides that are designed using the right visuals, graphics, etc. Various topics can be discussed, and effective brainstorming sessions can be conducted using the wide variety of slides added in this complete deck. Apart from this, our PPT design contains clear instructions to help you restructure your presentations and create multiple variations. The color, format, design anything can be modified as deemed fit by the user. Not only this, it is available for immediate download. So, grab it now.
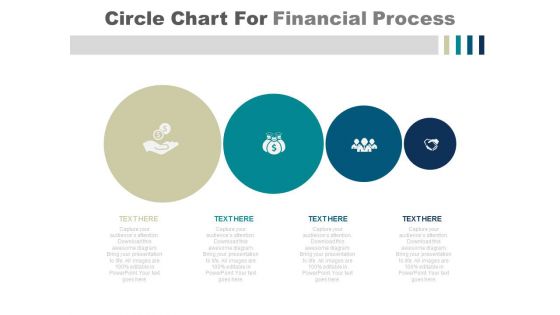
Circle Chart For Financial Planning Process PowerPoint Slides
This PowerPoint template has been created by professionals keeping in mind the need of light slides with more information. The slide uses minimalistic yet impactful visuals to explain a 4 step process. The reducing size of the circles can be creatively used to show that the process or the steps are getting an organization or a business firm closer to its targets or goals. There is ample space available to write text describe the steps involved in the process. This can be an ideal presentation for a company to show its financial plan or sales strategy to its investors or clients to gain their confidence. The icons and colors of the slide are customizable and can be edited to match the theme of the slide or the topic of the presentation.

Benefits Cost Analysis Chart Ppt Powerpoint Presentation Summary Visuals
This is a balance scale with cost and benefits ppt powerpoint presentation show. This is a two stage process. The stages in this process are business, finance, marketing, strategy, compare, management.

Pie Chart Infographic For Data Analysis PowerPoint Templates
This is one of the most downloaded PowerPoint template. This slide can be used for various purposes and to explain a number of processes. This can be included in your presentation to explain each step of a process and even include its relevance and importance in a single diagram. Using the uneven circular structure of the pie chart, the presenter can also explain random steps or highlight particular steps of process or parts of an organization or business that need special attention of any kind to the audience. Additionally, you can use this slide to show a transformation process or highlight key features of a product.

Strategic Chart Ppt PowerPoint Presentation Complete Deck With Slides
Induce strategic thinking by presenting this complete deck. Enthrall your audience by deploying this thought provoking PPT deck. It can be downloaded in both standard and widescreen aspect ratios, thus making it a complete package to use and deploy. Convey your thoughts and actions using the thirteen slides presented in this complete deck. Additionally, feel free to alter its components like color, graphics, design, etc, to create a great first impression. Grab it now by clicking on the download button below.
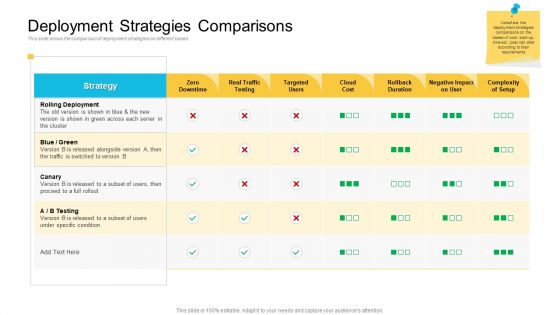
Implementations Deployment Strategies Comparisons Themes PDF
This slide shows the comparison of deployment strategies on different bases. Deliver an awe-inspiring pitch with this creative implementations deployment strategies comparisons themes pdf bundle. Topics like strategy, targeted users, cloud cost can be discussed with this completely editable template. It is available for immediate download depending on the needs and requirements of the user.
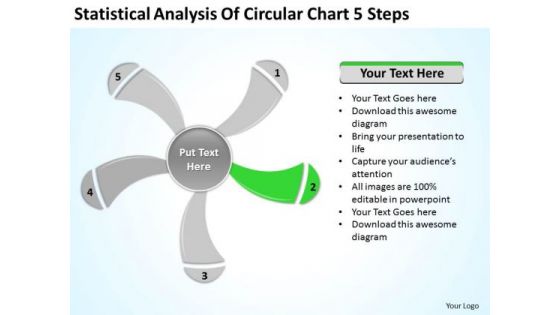
Statistical Analysis Of Circular Chart 5 Steps Ppt Business Plan PowerPoint Slide
We present our statistical analysis of circular chart 5 steps ppt business plan PowerPoint Slide.Download and present our Business PowerPoint Templates because Our PowerPoint Templates and Slides will definately Enhance the stature of your presentation. Adorn the beauty of your thoughts with their colourful backgrounds. Use our Signs PowerPoint Templates because Our PowerPoint Templates and Slides will give good value for money. They also have respect for the value of your time. Download our Shapes PowerPoint Templates because Our PowerPoint Templates and Slides team portray an attitude of elegance. Personify this quality by using them regularly. Use our Metaphors-Visual Concepts PowerPoint Templates because Our PowerPoint Templates and Slides will effectively help you save your valuable time. They are readymade to fit into any presentation structure. Use our Process and Flows PowerPoint Templates because our PowerPoint Templates and Slides are the string of your bow. Fire of your ideas and conquer the podium.Use these PowerPoint slides for presentations relating to graphically, graphic, vector, layout, business, computation, sign, infochart, visual, symbol, template, diagram, calculations, sector, data, revenue, schedule, element, analysis, drawing, report, technology, contour, classification, graph, modern, illustration, icon, comparison, object, chart, collection, science, color, growth, composition, professional, set, education, math, profits, information, symmetry, statistic, structure, infographics, button. The prominent colors used in the PowerPoint template are Green, Gray, White.
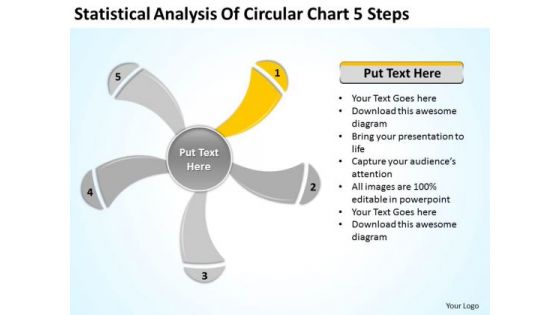
Statistical Analysis Of Circular Chart 5 Steps Ppt Business Plan PowerPoint Slides
We present our statistical analysis of circular chart 5 steps ppt business plan PowerPoint Slides.Download and present our Business PowerPoint Templates because Timeline crunches are a fact of life. Meet all deadlines using our PowerPoint Templates and Slides. Present our Signs PowerPoint Templates because You can Zap them with our PowerPoint Templates and Slides. See them reel under the impact. Use our Shapes PowerPoint Templates because It can Bubble and burst with your ideas. Download our Metaphors-Visual Concepts PowerPoint Templates because You can Create a matrix with our PowerPoint Templates and Slides. Feel the strength of your ideas click into place. Present our Process and Flows PowerPoint Templates because Our PowerPoint Templates and Slides has conjured up a web of all you need with the help of our great team. Use them to string together your glistening ideas.Use these PowerPoint slides for presentations relating to graphically, graphic, vector, layout, business, computation, sign, infochart, visual, symbol, template, diagram, calculations, sector, data, revenue, schedule, element, analysis, drawing, report, technology, contour, classification, graph, modern, illustration, icon, comparison, object, chart, collection, science, color, growth, composition, professional, set, education, math, profits, information, symmetry, statistic, structure, infographics, button. The prominent colors used in the PowerPoint template are Yellow, Gray, White.

Statistical Analysis Of Circular Chart 5 Steps Ppt Outline For Business Plan PowerPoint Slides
We present our statistical analysis of circular chart 5 steps ppt outline for business plan PowerPoint Slides.Present our Business PowerPoint Templates because Our PowerPoint Templates and Slides will definately Enhance the stature of your presentation. Adorn the beauty of your thoughts with their colourful backgrounds. Download our Signs PowerPoint Templates because They will Put the wind in your sails. Skim smoothly over the choppy waters of the market. Download our Shapes PowerPoint Templates because Our PowerPoint Templates and Slides come in all colours, shades and hues. They help highlight every nuance of your views. Download and present our Metaphors-Visual Concepts PowerPoint Templates because Our PowerPoint Templates and Slides will let your words and thoughts hit bullseye everytime. Download and present our Process and Flows PowerPoint Templates because Our PowerPoint Templates and Slides will help you be quick off the draw. Just enter your specific text and see your points hit home.Use these PowerPoint slides for presentations relating to graphically, graphic, vector, layout, business, computation, sign, infochart, visual, symbol, template, diagram, calculations, sector, data, revenue, schedule, element, analysis, drawing, report, technology, contour, classification, graph, modern, illustration, icon, comparison, object, chart, collection, science, color, growth, composition, professional, set, education, math, profits, information, symmetry, statistic, structure, infographics, button. The prominent colors used in the PowerPoint template are Pink, Gray, White.
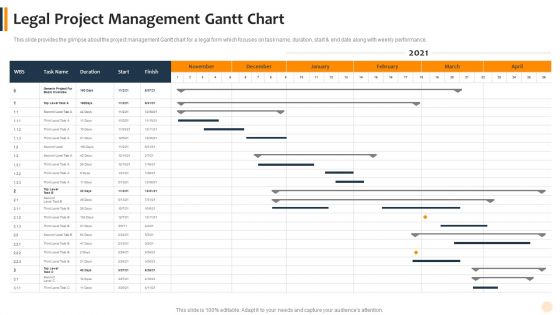
Agile Technique To Lawful Pitch And Proposals IT Legal Project Management Gantt Chart Slides PDF
Design a highly optimized project management report using this well-researched agile technique to lawful pitch and proposals it legal project management gantt chart slides pdf. This layout can be used to present the professional details of a task or activity. Showcase the activities allocated to the business executives with this Gantt Chart PowerPoint theme. List down the column tasks in various timeframes and allocate time for each. In addition, also monitor the actual time and make comparisons to interpret the final progress using this innovative Gantt Chart Template. Showcase the work breakdown structure to attract your audience. Download and share it using Google Slides, if it suits your requirement.

Implementing SEO Strategy To Enhance Business Performance Our SEO Activity Gantt Chart Sample PDF
Purpose of the following slide is to show the weekly gantt chart that provides an overview of the key activities that are to be performed during the process of SEO. The provided table highlights the key campaigns, their additional information and week wise activity. Design a highly optimized project management report using this well-researched Implementing SEO Strategy To Enhance Business Performance Our SEO Activity Gantt Chart Sample PDF. This layout can be used to present the professional details of a task or activity. Showcase the activities allocated to the business executives with this Gantt Chart PowerPoint theme. List down the column tasks in various timeframes and allocate time for each. In addition, also monitor the actual time and make comparisons to interpret the final progress using this innovative Gantt Chart Template. Showcase the work breakdown structure to attract your audience. Download and share it using Google Slides, if it suits your requirement.
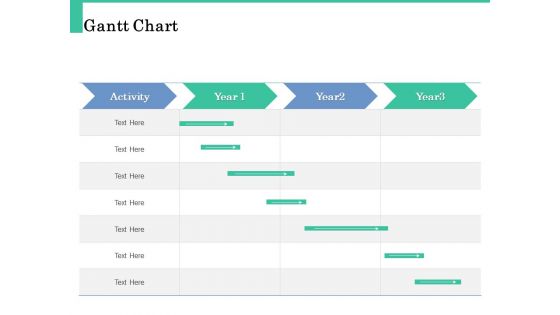
How A Corporate Life Coach Can Help Develop Your Company Gantt Chart Topics PDF
Make a highly optimized project management report using this content-ready Gantt Chart PPT Diagram. Effortless yet very clear, this layout proves a useful tool to present the professional details of a task or activity. Showcase the activities and allotted time to the business executives with this Gantt Chart PowerPoint theme. List down the column tasks in various timeframes and the activities associated with each of them here. Further, plot time allocation for various tasks, monitor their actual time and make comparisons to interpret the final progress with this well-structured Gantt Chart Excel Template. You can add all the significant details of a particular project in this chart and showcase it to all the project members so that they can participate in the overall development. Not only this but also our PPT template can help you showcase the work breakdown structure of your project.

Task Hourly Schedule Gantt Chart Ppt PowerPoint Presentation Portfolio Examples PDF
Make a highly optimized project management report using this content-ready Gantt Chart PPT Diagram. Effortless yet very clear, this layout proves a useful tool to present the professional details of a task or activity. Showcase the activities and allotted time to the business executives with this Gantt Chart PowerPoint theme. List down the column tasks in various timeframes and the activities associated with each of them here. Further, plot time allocation for various tasks, monitor their actual time and make comparisons to interpret the final progress with this well-structured Gantt Chart Excel Template. You can add all the significant details of a particular project in this chart and showcase it to all the project members so that they can participate in the overall development. Not only this but also our PPT template can help you showcase the work breakdown structure of your project.
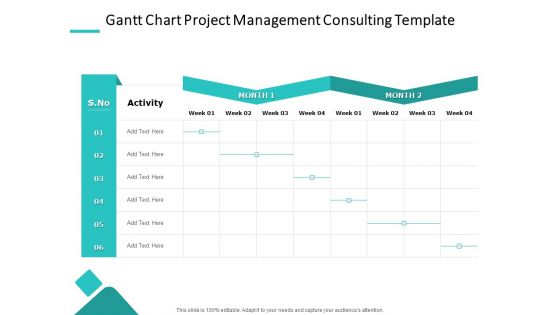
Gantt Chart Project Management Consulting Template Ppt PowerPoint Presentation Layouts Clipart Images PDF
Make a highly optimized project management report using this content-ready Gantt Chart PPT Diagram. Effortless yet very clear, this layout proves a useful tool to present the professional details of a task or activity. Showcase the activities and allotted time to the business executives with this Gantt Chart PowerPoint theme. List down the column tasks in various timeframes and the activities associated with each of them here. Further, plot time allocation for various tasks, monitor their actual time and make comparisons to interpret the final progress with this well-structured Gantt Chart Excel Template. You can add all the significant details of a particular project in this chart and showcase it to all the project members so that they can participate in the overall development. Not only this but also our PPT template can help you showcase the work breakdown structure of your project.
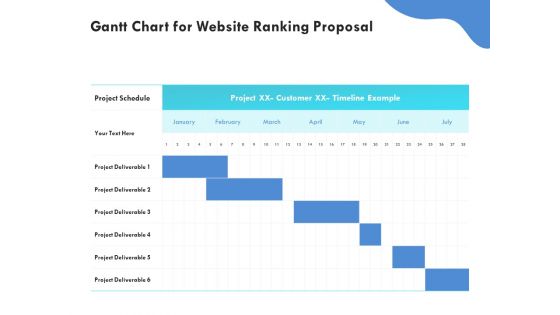
SEO Proposal Template Gantt Chart For Website Ranking Proposal Ppt PowerPoint Presentation File Layout PDF
Make a highly optimized project management report using this content-ready Gantt Chart PPT Diagram. Effortless yet very clear, this layout proves a useful tool to present the professional details of a task or activity. Showcase the activities and allotted time to the business executives with this Gantt Chart PowerPoint theme. List down the column tasks in various timeframes and the activities associated with each of them here. Further, plot time allocation for various tasks, monitor their actual time and make comparisons to interpret the final progress with this well-structured Gantt Chart Excel Template. You can add all the significant details of a particular project in this chart and showcase it to all the project members so that they can participate in the overall development. Not only this but also our PPT template can help you showcase the work breakdown structure of your project.
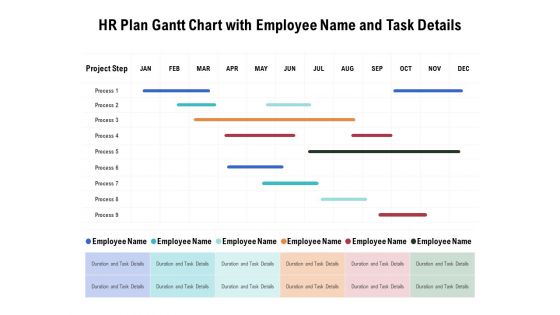
HR Plan Gantt Chart With Employee Name And Task Details Ppt PowerPoint Presentation Outline Graphics Pictures
Make a highly optimized project management report using this content-ready Gantt Chart PPT Diagram. Effortless yet very clear, this layout proves a useful tool to present the professional details of a task or activity. Showcase the activities and allotted time to the business executives with this Gantt Chart PowerPoint theme. List down the column tasks in various timeframes and the activities associated with each of them here. Further, plot time allocation for various tasks, monitor their actual time and make comparisons to interpret the final progress with this well-structured Gantt Chart Excel Template. You can add all the significant details of a particular project in this chart and showcase it to all the project members so that they can participate in the overall development. Not only this but also our PPT template can help you showcase the work breakdown structure of your project.
operating system application gantt chart for ios apps proposal ppt icon introduction pdf
Make a highly optimized project management report using this content-ready Gantt Chart PPT Diagram. Effortless yet very clear, this layout proves a useful tool to present the professional details of a task or activity. Showcase the activities and allotted time to the business executives with this Gantt Chart PowerPoint theme. List down the column tasks in various timeframes and the activities associated with each of them here. Further, plot time allocation for various tasks, monitor their actual time and make comparisons to interpret the final progress with this well-structured Gantt Chart Excel Template. You can add all the significant details of a particular project in this chart and showcase it to all the project members so that they can participate in the overall development. Not only this but also our PPT template can help you showcase the work breakdown structure of your project.
Heating Ventilation And Air Conditioning Installation Gantt Chart For HAVC Services Proposal Ppt Slides Icon PDF
Make a highly optimized project management report using this content-ready Gantt Chart PPT Diagram. Effortless yet very clear, this layout proves a useful tool to present the professional details of a task or activity. Showcase the activities and allotted time to the business executives with this Gantt Chart PowerPoint theme. List down the column tasks in various timeframes and the activities associated with each of them here. Further, plot time allocation for various tasks, monitor their actual time and make comparisons to interpret the final progress with this well-structured Gantt Chart Excel Template. You can add all the significant details of a particular project in this chart and showcase it to all the project members so that they can participate in the overall development. Not only this but also our PPT template can help you showcase the work breakdown structure of your project.

Gantt Chart For Pipeline Operator Proposal Ppt PowerPoint Presentation Styles Slide Portrait
Make a highly optimized project management report using this content-ready Gantt Chart PPT Diagram. Effortless yet very clear, this layout proves a useful tool to present the professional details of a task or activity. Showcase the activities and allotted time to the business executives with this Gantt Chart PowerPoint theme. List down the column tasks in various timeframes and the activities associated with each of them here. Further, plot time allocation for various tasks, monitor their actual time and make comparisons to interpret the final progress with this well-structured Gantt Chart Excel Template. You can add all the significant details of a particular project in this chart and showcase it to all the project members so that they can participate in the overall development. Not only this but also our PPT template can help you showcase the work breakdown structure of your project.

Gantt Chart Of Digital Advertising Agency For Business Growth Proposal Ppt PowerPoint Presentation Gallery Graphics
Make a highly optimized project management report using this content-ready Gantt Chart PPT Diagram. Effortless yet very clear, this layout proves a useful tool to present the professional details of a task or activity. Showcase the activities and allotted time to the business executives with this Gantt Chart PowerPoint theme. List down the column tasks in various timeframes and the activities associated with each of them here. Further, plot time allocation for various tasks, monitor their actual time and make comparisons to interpret the final progress with this well-structured Gantt Chart Excel Template. You can add all the significant details of a particular project in this chart and showcase it to all the project members so that they can participate in the overall development. Not only this but also our PPT template can help you showcase the work breakdown structure of your project.

Gantt Chart For HVAC Services Proposal Ppt PowerPoint Presentation Layouts Structure PDF
Make a highly optimized project management report using this content-ready Gantt Chart PPT Diagram. Effortless yet very clear, this layout proves a useful tool to present the professional details of a task or activity. Showcase the activities and allotted time to the business executives with this Gantt Chart PowerPoint theme. List down the column tasks in various timeframes and the activities associated with each of them here. Further, plot time allocation for various tasks, monitor their actual time and make comparisons to interpret the final progress with this well-structured Gantt Chart Excel Template. You can add all the significant details of a particular project in this chart and showcase it to all the project members so that they can participate in the overall development. Not only this but also our PPT template can help you showcase the work breakdown structure of your project.
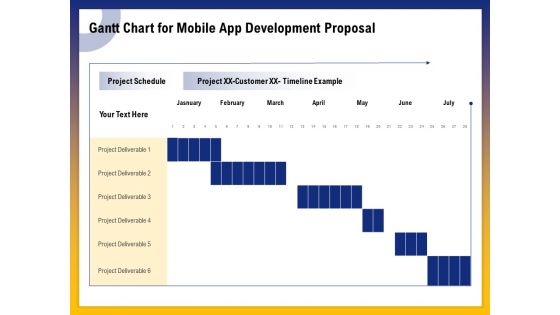
Phone Application Buildout Gantt Chart For Mobile App Development Proposal Ppt PowerPoint Presentation Gallery Vector PDF
Make a highly optimized project management report using this content-ready Gantt Chart PPT Diagram. Effortless yet very clear, this layout proves a useful tool to present the professional details of a task or activity. Showcase the activities and allotted time to the business executives with this Gantt Chart PowerPoint theme. List down the column tasks in various timeframes and the activities associated with each of them here. Further, plot time allocation for various tasks, monitor their actual time and make comparisons to interpret the final progress with this well-structured Gantt Chart Excel Template. You can add all the significant details of a particular project in this chart and showcase it to all the project members so that they can participate in the overall development. Not only this but also our PPT template can help you showcase the work breakdown structure of your project.
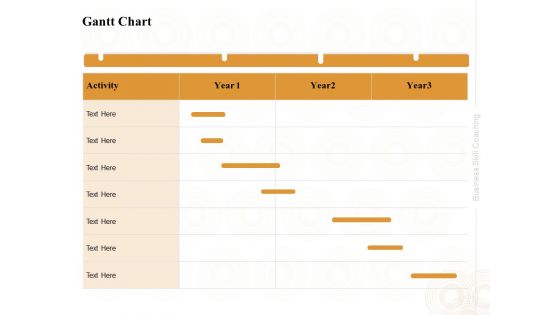
Enterprise Capabilities Training Gantt Chart Ppt PowerPoint Presentation Pictures Introduction PDF
Make a highly optimized project management report using this content-ready Gantt Chart PPT Diagram. Effortless yet very clear, this layout proves a useful tool to present the professional details of a task or activity. Showcase the activities and allotted time to the business executives with this Gantt Chart PowerPoint theme. List down the column tasks in various timeframes and the activities associated with each of them here. Further, plot time allocation for various tasks, monitor their actual time and make comparisons to interpret the final progress with this well-structured Gantt Chart Excel Template. You can add all the significant details of a particular project in this chart and showcase it to all the project members so that they can participate in the overall development. Not only this but also our PPT template can help you showcase the work breakdown structure of your project.

Primary Healthcare Implementation Service Gantt Chart For Implementing Primary Health Care Proposal Information PDF
Make a highly optimized project management report using this content-ready Gantt Chart PPT Diagram. Effortless yet very clear, this layout proves a useful tool to present the professional details of a task or activity. Showcase the activities and allotted time to the business executives with this Gantt Chart PowerPoint theme. List down the column tasks in various timeframes and the activities associated with each of them here. Further, plot time allocation for various tasks, monitor their actual time and make comparisons to interpret the final progress with this well-structured Gantt Chart Excel Template. You can add all the significant details of a particular project in this chart and showcase it to all the project members so that they can participate in the overall development. Not only this but also our PPT template can help you showcase the work breakdown structure of your project.
Stock Market Chart For Analyzing Investment Behavior Ppt Icon Summary PDF
This slides shows the amount invested in stock market in last six years. It includes the comparison of investment in equity and debentures. Showcasing this set of slides titled Stock Market Chart For Analyzing Investment Behavior Ppt Icon Summary PDF. The topics addressed in these templates are Investment Stocks, 2018 To 2023, Higher Returns. All the content presented in this PPT design is completely editable. Download it and make adjustments in color, background, font etc. as per your unique business setting.
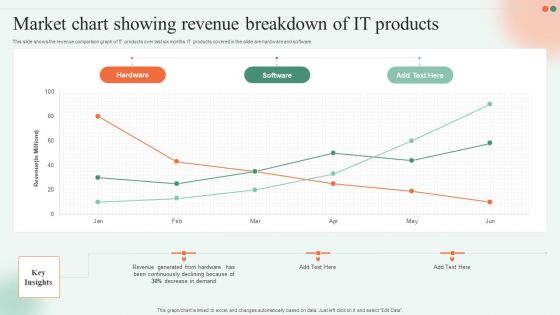
Market Chart Showing Revenue Breakdown Of IT Products Ppt File Elements PDF
This slide shows the revenue comparison graph of IT products over last six months. IT products covered in the slide are hardware and software. Pitch your topic with ease and precision using this Market Chart Showing Revenue Breakdown Of IT Products Ppt File Elements PDF. This layout presents information on Hardware, Software, Key Insights. It is also available for immediate download and adjustment. So, changes can be made in the color, design, graphics or any other component to create a unique layout.
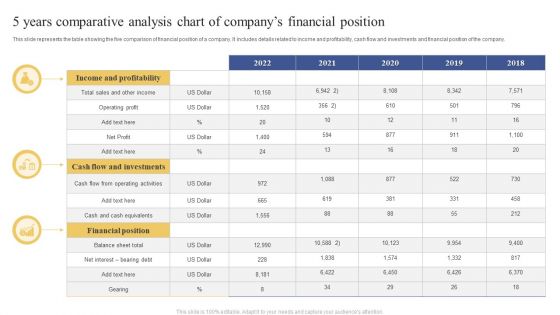
5 Years Comparative Analysis Chart Of Companys Financial Position Ppt Layouts Structure PDF
This slide represents the table showing the five comparison of financial position of a company. It includes details related to income and profitability, cash flow and investments and financial position of the company. Showcasing this set of slides titled 5 Years Comparative Analysis Chart Of Companys Financial Position Ppt Layouts Structure PDF. The topics addressed in these templates are Income And Profitability, Financial Position, Balance Sheet Total. All the content presented in this PPT design is completely editable. Download it and make adjustments in color, background, font etc. as per your unique business setting.

5 Years Attrition Rate Comparative Analysis Chart Of IT Company Ppt Layouts Examples PDF
This slide represents the table showing the comparison between attrition rates and no. of employees of an IT company over the five years. It includes details related to attrition rates and no. of employees during different years. Showcasing this set of slides titled 5 Years Attrition Rate Comparative Analysis Chart Of IT Company Ppt Layouts Examples PDF. The topics addressed in these templates are Attrition Rate, No Employees, 2018 To 2022. All the content presented in this PPT design is completely editable. Download it and make adjustments in color, background, font etc. as per your unique business setting.
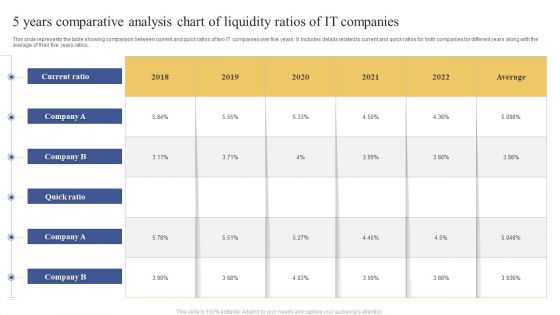
5 Years Comparative Analysis Chart Of Liquidity Ratios Of IT Companies Ppt Portfolio Visual Aids PDF
This slide represents the table showing comparison between current and quick ratios of two IT companies over five years. It includes details related to current and quick ratios for both companies for different years along with the average of their five years ratios. Pitch your topic with ease and precision using this 5 Years Comparative Analysis Chart Of Liquidity Ratios Of IT Companies Ppt Portfolio Visual Aids PDF. This layout presents information on Current Ratio, Average, 2018 To 2022. It is also available for immediate download and adjustment. So, changes can be made in the color, design, graphics or any other component to create a unique layout.
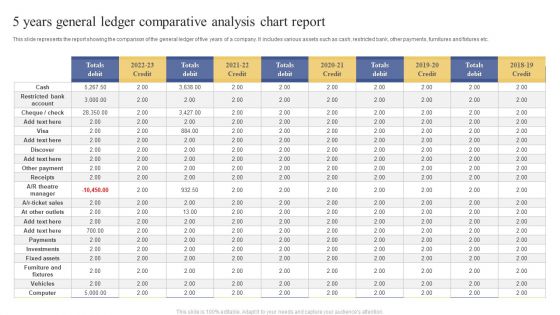
5 Years General Ledger Comparative Analysis Chart Report Ppt Model Slide PDF
This slide represents the report showing the comparison of the general ledger of five years of a company. It includes various assets such as cash, restricted bank, other payments, furnitures and fixtures etc. Showcasing this set of slides titled 5 Years General Ledger Comparative Analysis Chart Report Ppt Model Slide PDF. The topics addressed in these templates are Other Payment, Investments, Fixed Assets. All the content presented in this PPT design is completely editable. Download it and make adjustments in color, background, font etc. as per your unique business setting.
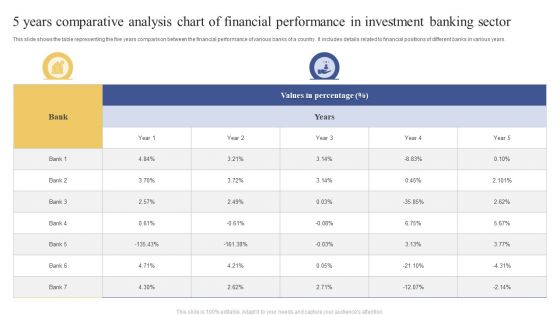
5 Years Comparative Analysis Chart Of Financial Performance In Investment Banking Sector Themes PDF
This slide shows the table representing the five years comparison between the financial performance of various banks of a country. It includes details related to financial positions of different banks in various years. Showcasing this set of slides titled 5 Years Comparative Analysis Chart Of Financial Performance In Investment Banking Sector Themes PDF. The topics addressed in these templates are Values Percentage, Bank, Year. All the content presented in this PPT design is completely editable. Download it and make adjustments in color, background, font etc. as per your unique business setting.
5 Years Profit And Loss Comparative Analysis Chart Of Enterprise Ppt Icon Graphics PDF
This slide represents the comparison of profit and loss of an organization for the five years. It includes details related to profit and loss from various accounts such as order fees, concession income, facility rental etc. Pitch your topic with ease and precision using this 5 Years Profit And Loss Comparative Analysis Chart Of Enterprise Ppt Icon Graphics PDF. This layout presents information on Account, 2018 To 2022, Exchange Fees. It is also available for immediate download and adjustment. So, changes can be made in the color, design, graphics or any other component to create a unique layout.

5 Years Net Income Comparative Analysis Chart Of Financial Institute Ppt Show Designs PDF
This slide represents the comparison of net income of financial institute for different years. It includes details related to total revenue, gross profit, operating income and net income and ratios of the institute for different years. Showcasing this set of slides titled 5 Years Net Income Comparative Analysis Chart Of Financial Institute Ppt Show Designs PDF. The topics addressed in these templates are Income Statement, 2018 To 2022, Ratios. All the content presented in this PPT design is completely editable. Download it and make adjustments in color, background, font etc. as per your unique business setting.
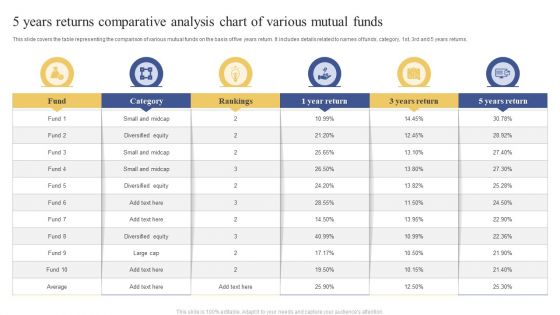
5 Years Returns Comparative Analysis Chart Of Various Mutual Funds Ppt Slides Microsoft PDF
This slide covers the table representing the comparison of various mutual funds on the basis of five years return. It includes details related to names of funds, category, 1st, 3rd and 5 years returns. Showcasing this set of slides titled 5 Years Returns Comparative Analysis Chart Of Various Mutual Funds Ppt Slides Microsoft PDF. The topics addressed in these templates are Diversified Equity, Small And Midcap, Diversified Equity. All the content presented in this PPT design is completely editable. Download it and make adjustments in color, background, font etc. as per your unique business setting.
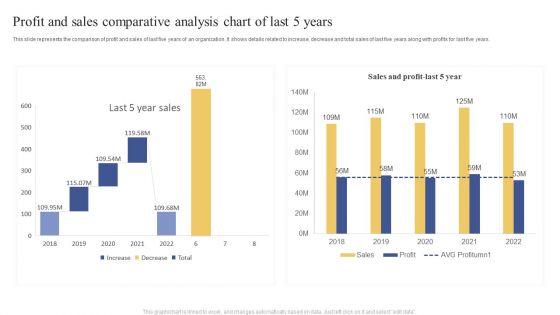
Profit And Sales Comparative Analysis Chart Of Last 5 Years Ppt Visual Aids Example 2015 PDF
This slide represents the comparison of profit and sales of last five years of an organization. It shows details related to increase, decrease and total sales of last five years along with profits for last five years. Showcasing this set of slides titled Profit And Sales Comparative Analysis Chart Of Last 5 Years Ppt Visual Aids Example 2015 PDF. The topics addressed in these templates are Last 5 Year, Sales, 2018 To 2022. All the content presented in this PPT design is completely editable. Download it and make adjustments in color, background, font etc. as per your unique business setting.
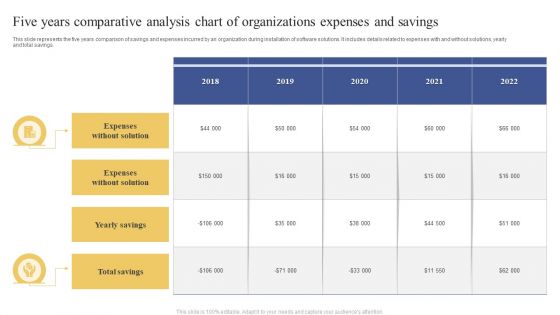
Five Years Comparative Analysis Chart Of Organizations Expenses And Savings Topics PDF
This slide represents the five years comparison of savings and expenses incurred by an organization during installation of software solutions. It includes details related to expenses with and without solutions, yearly and total savings. Showcasing this set of slides titled Five Years Comparative Analysis Chart Of Organizations Expenses And Savings Topics PDF. The topics addressed in these templates are Expenses Without Solution, Yearly Savings, Total Savings. All the content presented in this PPT design is completely editable. Download it and make adjustments in color, background, font etc. as per your unique business setting.

5 Years Price Comparative Analysis Chart Of Cloud Service Solutions Brochure PDF
This slide represents the table showing the five years comparison of prices incurred in installing cloud service solution in the organization. It includes details related to on-premises prices, cloud services price and savings for different years. Showcasing this set of slides titled 5 Years Price Comparative Analysis Chart Of Cloud Service Solutions Brochure PDF. The topics addressed in these templates are Cloud, Savings, 2018 To 2022. All the content presented in this PPT design is completely editable. Download it and make adjustments in color, background, font etc. as per your unique business setting.
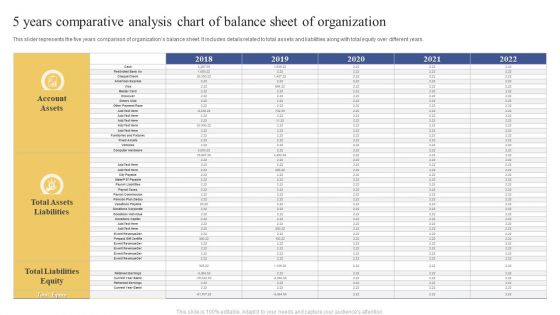
5 Years Comparative Analysis Chart Of Balance Sheet Of Organization Ppt Inspiration Slide PDF
This slider represents the five years comparison of organizations balance sheet. It includes details related to total assets and liabilities along with total equity over different years. Pitch your topic with ease and precision using this 5 Years Comparative Analysis Chart Of Balance Sheet Of Organization Ppt Inspiration Slide PDF. This layout presents information on Account Assets, Total Assets Liabilities, Total Liabilities Equity. It is also available for immediate download and adjustment. So, changes can be made in the color, design, graphics or any other component to create a unique layout.
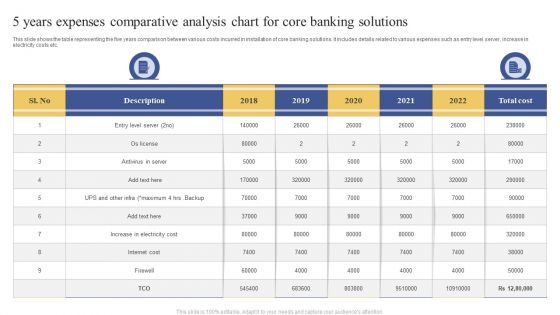
5 Years Expenses Comparative Analysis Chart For Core Banking Solutions Ppt Portfolio Clipart Images PDF
This slide shows the table representing the five years comparison between various costs incurred in installation of core banking solutions. It includes details related to various expenses such as entry level server, increase in electricity costs etc. Pitch your topic with ease and precision using this 5 Years Expenses Comparative Analysis Chart For Core Banking Solutions Ppt Portfolio Clipart Images PDF. This layout presents information on Entry Level Server, Antivirus Server, Increase Electricity Cost. It is also available for immediate download and adjustment. So, changes can be made in the color, design, graphics or any other component to create a unique layout.

5 Years Sales And Profit Growth Comparative Analysis Chart Of Private Banks Infographics PDF
This slide shows the table representing the comparison between sales and profit growth of five years of various private banks. It includes details related to names of private banks and their five years sales growth and profit growth. Pitch your topic with ease and precision using this 5 Years Sales And Profit Growth Comparative Analysis Chart Of Private Banks Infographics PDF. This layout presents information on Private Banks, Sales Growth, Profit Growth. It is also available for immediate download and adjustment. So, changes can be made in the color, design, graphics or any other component to create a unique layout.

5 Years Technological Comparative Analysis Chart Of Service Provisioning And Operational Costs Information PDF
This slide represents the five years technological and cost based comparison for use of passive optical network. It includes details related to ONT cost, service provisioning and operational costs for five years. Pitch your topic with ease and precision using this 5 Years Technological Comparative Analysis Chart Of Service Provisioning And Operational Costs Information PDF. This layout presents information on Optical Network Termination, Service Provisioning, Operational Cost. It is also available for immediate download and adjustment. So, changes can be made in the color, design, graphics or any other component to create a unique layout.

Chart To Compare Month To Month Change Ppt PowerPoint Presentation Infographic Template Slide Portrait
This is a chart to compare month to month change ppt powerpoint presentation infographic template slide portrait. The topics discussed in this diagram are monthly comparison, monthly compare, 30 days comparison. This is a completely editable PowerPoint presentation and is available for immediate download.

Medical And Healthcare Related Gantt Chart For Medical Service Proposal Ppt Introduction PDF
Introducing our medical and healthcare related gantt chart for medical service proposal ppt introduction pdf that is designed to showcase some of the vital components that will help you create timelines, roadmaps, and project plans. In addition, also communicate your project durations, milestones, tasks, subtasks, dependencies, and other attributes using this well-structured medical and healthcare related gantt chart for medical service proposal ppt introduction pdf template. You can also exhibit preeminence against time by deploying this easily adaptable slide to your business presentation. Our experts have designed this template in such a way that it is sure to impress your audience. Thus, download it and steer your project meetings, meetups, and conferences.

Transportation Company Profile Organization Chart Ppt PowerPoint Presentation Styles Graphics Tutorials PDF
This is a Transportation Company Profile Organization Chart Ppt PowerPoint Presentation Styles Graphics Tutorials PDF template with various stages. Focus and dispense information on one stage using this creative set, that comes with editable features. It contains large content boxes to add your information on topics like Customer Services, Global Communications, Transport Express. You can also showcase facts, figures, and other relevant content using this PPT layout. Grab it now.

Project Administration Bundle Project Gantt Chart With Completion Status Designs PDF
Introducing our Project Administration Bundle Project Gantt Chart With Completion Status Designs PDF that is designed to showcase some of the vital components that will help you create timelines, roadmaps, and project plans. In addition, also communicate your project durations, milestones, tasks, subtasks, dependencies, and other attributes using this well structured Project Administration Bundle Project Gantt Chart With Completion Status Designs PDF template. You can also exhibit preeminence against time by deploying this easily adaptable slide to your business presentation. Our experts have designed this template in such a way that it is sure to impress your audience. Thus, download it and steer your project meetings, meetups, and conferences.
Cash Market Investor Deck Organization Chart Diagram Of The Company Services Ppt Professional Icon PDF
The slide provides the diagram which shows ownership structure holding and subsidiary companies of the company. The structure includes holding company, sister subsidiaries and subsidiaries of our company. This is a cash market investor deck organization chart diagram of the company services ppt professional icon pdf template with various stages. Focus and dispense information on three stages using this creative set, that comes with editable features. It contains large content boxes to add your information on topics like services provider, investment company, asset management solutions, insurance operations. You can also showcase facts, figures, and other relevant content using this PPT layout. Grab it now.

Operations Workflow Chart Business Performance Optimization New Operations Strategy Sample Pdf
Presenting this PowerPoint presentation, titled Operations Workflow Chart Business Performance Optimization New Operations Strategy Sample Pdf, with topics curated by our researchers after extensive research. This editable presentation is available for immediate download and provides attractive features when used. Download now and captivate your audience. Presenting this Operations Workflow Chart Business Performance Optimization New Operations Strategy Sample Pdf. Our researchers have carefully researched and created these slides with all aspects taken into consideration. This is a completely customizable Operations Workflow Chart Business Performance Optimization New Operations Strategy Sample Pdf that is available for immediate downloading. Download now and make an impact on your audience. Highlight the attractive features available with our PPTs.

Project Change Management Team Org Chart Strategies For Success In Digital
This slide represents details related to org chart of project change management team. It includes details related to steering committee, sponsor, project security officer, etc. Presenting this PowerPoint presentation, titled Project Change Management Team Org Chart Strategies For Success In Digital, with topics curated by our researchers after extensive research. This editable presentation is available for immediate download and provides attractive features when used. Download now and captivate your audience. Presenting this Project Change Management Team Org Chart Strategies For Success In Digital. Our researchers have carefully researched and created these slides with all aspects taken into consideration. This is a completely customizable Project Change Management Team Org Chart Strategies For Success In Digital that is available for immediate downloading. Download now and make an impact on your audience. Highlight the attractive features available with our PPTs.

Business Diagram 3d Lock With Pie Chart And Text Boxes For Business PowerPoint Slide
This Power Point diagram has been crafted with pie chart in shape of lock. It contains diagram of lock pie chart to compare and present data in an effective manner. Use this diagram to build professional presentations for your viewers.

 Home
Home