Bar Graphics
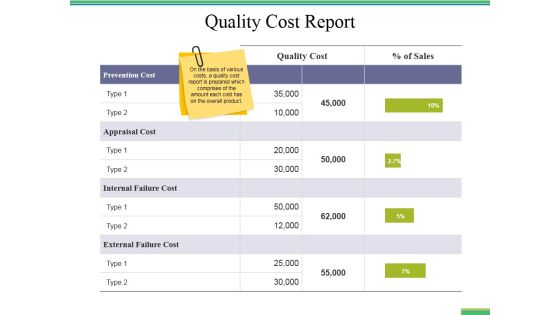
Quality Cost Report Ppt PowerPoint Presentation Styles Infographic Template
This is a quality cost report ppt powerpoint presentation styles infographic template. This is a five stage process. The stages in this process are business, finance, marketing, strategy, bar graph, analysis.

Competitors Average Price Product Ppt PowerPoint Presentation Inspiration Templates
This is a competitors average price product ppt powerpoint presentation inspiration templates. This is a five stage process. The stages in this process are business, finance, analysis, growth, investment, bar graph.

Competitor Revenue And Profit Ppt PowerPoint Presentation Outline Elements
This is a competitor revenue and profit ppt powerpoint presentation outline elements. This is a five stage process. The stages in this process are bar graph, marketing, strategy, finance, planning.

Competitors Average Price Product Ppt PowerPoint Presentation File Show
This is a competitors average price product ppt powerpoint presentation file show. This is a two stage process. The stages in this process are bar graph, marketing, strategy, finance, planning.

Social Media Analysis Ppt PowerPoint Presentation Model Portfolio
This is a social media analysis ppt powerpoint presentation model portfolio. This is a four stage process. The stages in this process are bar graph, marketing, strategy, finance, planning.

Competitor Revenue And Profit Ppt PowerPoint Presentation Layouts Vector
This is a competitor revenue and profit ppt powerpoint presentation layouts vector. This is a five stage process. The stages in this process are competitor, profit, revenue, bar graph, success.

Competitors Average Price Product Ppt PowerPoint Presentation Layouts Infographic Template
This is a competitors average price product ppt powerpoint presentation layouts infographic template. This is a five stage process. The stages in this process are company, bar graph, success, growth, business.

Stacked Column Ppt PowerPoint Presentation Layouts Example
This is a stacked column ppt powerpoint presentation layouts example. This is a two stage process. The stages in this process are product, stacked column, bar graph, growth, success.

Competitor Revenue And Profit Ppt PowerPoint Presentation Model Templates
This is a competitor revenue and profit ppt powerpoint presentation model templates. This is a five stage process. The stages in this process are revenue, profit, competitor, bar graph, business.

Competitors Average Price Product Ppt PowerPoint Presentation File Pictures
This is a competitors average price product ppt powerpoint presentation file pictures. This is a five stage process. The stages in this process are bar graph, business, marketing, finance, company.

Competitor Revenue And Profit Template 1 Ppt PowerPoint Presentation Layouts Display
This is a competitor revenue and profit template 1 ppt powerpoint presentation layouts display. This is a five stage process. The stages in this process are business, bar graph, finance, marketing, analysis.

Competitors Average Price Product Ppt PowerPoint Presentation Ideas Layouts
This is a competitors average price product ppt powerpoint presentation ideas layouts. This is a five stage process. The stages in this process are business, bar graph, finance, marketing, analysis.

Competitors Average Price Product Ppt PowerPoint Presentation Styles Ideas
This is a competitors average price product ppt powerpoint presentation styles ideas. This is a five stage process. The stages in this process are business, bar graph, finance, marketing, strategy, analysis.

Clustered Column Line Ppt PowerPoint Presentation Pictures Example
This is a clustered column line ppt powerpoint presentation pictures example. This is a three stage process. The stages in this process are product, in percentage, bar graph, growth, success.

Clustered Column Ppt PowerPoint Presentation Gallery Structure
This is a clustered column ppt powerpoint presentation gallery structure. This is a two stage process. The stages in this process are product, sales in percentage, financial year, bar graph, finance.

Clustered Column Line Ppt PowerPoint Presentation Infographic Template Pictures
This is a clustered column line ppt powerpoint presentation infographic template pictures. This is a three stage process. The stages in this process are product, in percentage, bar graph, growth, success.

Column Chart Ppt PowerPoint Presentation Gallery Slide Portrait
This is a column chart ppt powerpoint presentation gallery slide portrait. This is a two stage process. The stages in this process are sales in percentage, financial year, product, bar graph, growth.

Combo Chart Ppt PowerPoint Presentation Show Deck
This is a combo chart ppt powerpoint presentation show deck. This is a three stage process. The stages in this process are growth rate, market size, product, bar graph, growth.

Column Chart Ppt PowerPoint Presentation File Summary
This is a column chart ppt powerpoint presentation file summary. This is a two stage process. The stages in this process are product, dollars, in years, bar graph, growth.

Sales Performance Of Competitors Ppt PowerPoint Presentation Layouts Elements
This is a sales performance of competitors ppt powerpoint presentation layouts elements. This is a three stage process. The stages in this process are years, bar graph, finance, business, marketing.

High Low Close Chart Ppt PowerPoint Presentation Portfolio Topics
This is a high low close chart ppt powerpoint presentation portfolio topics. This is a three stage process. The stages in this process are product, market size, in years, success, bar graph.

Clustered Column Line Ppt PowerPoint Presentation Pictures Model
This is a clustered column line ppt powerpoint presentation pictures model. This is a three stage process. The stages in this process are bar graph, finance, marketing, strategy, business.

Clustered Column Line Ppt PowerPoint Presentation Topics
This is a clustered column line ppt powerpoint presentation topics. This is a three stage process. The stages in this process are product, in percentage, growth, bar graph, business.

Column Chart Ppt PowerPoint Presentation Infographics Guidelines
This is a column chart ppt powerpoint presentation infographics guidelines. This is a two stage process. The stages in this process are product, expenditure in, years, business, bar graph.
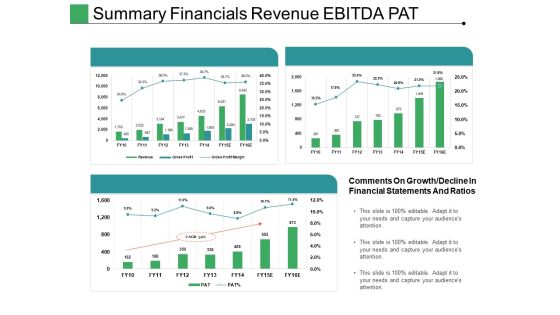
Summary Financials Revenue Ebitda Pat Ppt PowerPoint Presentation Ideas Tips
This is a summary financials revenue ebitda pat ppt powerpoint presentation ideas tips. This is a three stage process. The stages in this process are comments on growth, bar graph, growth, success, business.

Column Chart Ppt PowerPoint Presentation Layouts Vector
This is a column chart ppt powerpoint presentation layouts vector. This is a two stage process. The stages in this process are product, column chart, bar graph, percentage, finance.

Combo Chart Ppt PowerPoint Presentation Pictures Summary
This is a combo chart ppt powerpoint presentation pictures summary. This is a three stage process. The stages in this process are product, market size, growth rate, bar graph, success.

Stacked Area Clustered Column Ppt PowerPoint Presentation Gallery Gridlines
This is a stacked area clustered column ppt powerpoint presentation gallery gridlines. This is a three stage process. The stages in this process are bar graph, product, in percentage.

Actual Vs Target Sales Ppt PowerPoint Presentation Slides Template
This is a actual vs target sales ppt powerpoint presentation slides template. This is a seven stage process. The stages in this process are bar chart, marketing, strategy, finance, planning.

Clustered Column Ppt PowerPoint Presentation Icon Objects
This is a clustered column ppt powerpoint presentation icon objects. This is a two stage process. The stages in this process are clustered column, product, growth, finance, bar graph.

Stacked Area Clustered Column Ppt PowerPoint Presentation Summary Slides
This is a stacked area clustered column ppt powerpoint presentation summary slides. This is a three stage process. The stages in this process are product, in percentage, financial year, bar graph.
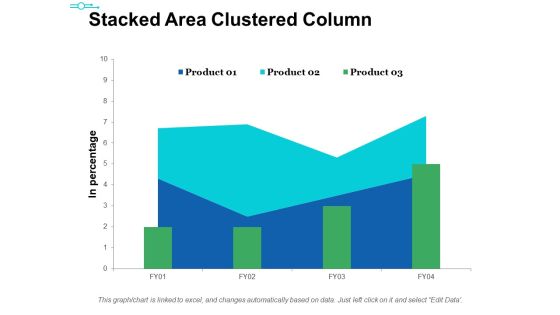
Stacked Area Clustered Column Ppt PowerPoint Presentation Ideas Themes
This is a stacked area clustered column ppt powerpoint presentation ideas themes. This is a three stage process. The stages in this process are product, in percentage, bar graph, area chart, growth.

Clustered Column Line Ppt PowerPoint Presentation Professional
This is a clustered column line ppt powerpoint presentation professional. This is a three stage process. The stages in this process are clustered column line, product, bar graph, marketing, finance.
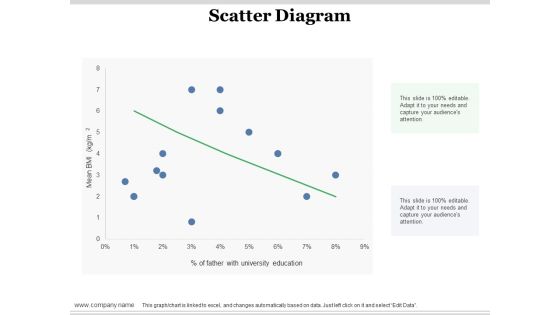
Scatter Diagram Ppt PowerPoint Presentation Infographic Template Design Ideas
This is a scatter diagram ppt powerpoint presentation infographic template design ideas. This is a one stage process. The stages in this process are scatter diagram, finance, in percentage, business, bar graph.

Column Chart Ppt PowerPoint Presentation Icon Show
This is a column chart ppt powerpoint presentation icon show. This is a two stage process. The stages in this process are column chart, product, years, bar graph, growth.
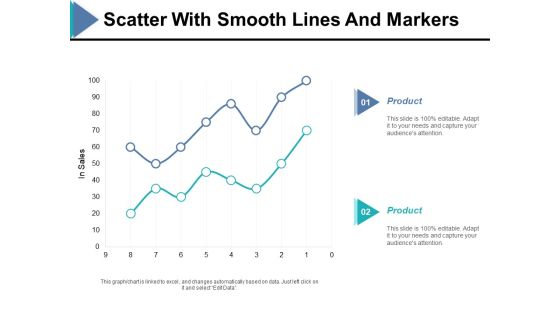
Scatter With Smooth Lines And Markers Ppt PowerPoint Presentation Ideas Example
This is a scatter with smooth lines and markers ppt powerpoint presentation ideas example. This is a two stage process. The stages in this process are in sales, finance, bar graph, product, business.

Key Market Drivers And Forecast Ppt PowerPoint Presentation Summary Templates
This is a key market drivers and forecast ppt powerpoint presentation summary templates. This is a two stage process. The stages in this process are key market drivers, forecast, growth, bar graph, business.

Barriers To Digital Transformation Ppt PowerPoint Presentation Professional Influencers
This is a barriers to digital transformation ppt powerpoint presentation professional influencers. This is a six stage process. The stages in this process are bar chart, finance, marketing, business, analysis.

Combo Chart Finance Ppt PowerPoint Presentation Outline Example
This is a combo chart finance ppt powerpoint presentation outline example. This is a three stage process. The stages in this process are bar chart, finance, marketing, business, analysis.
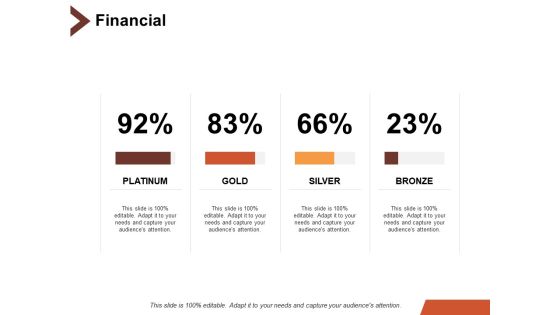
Financial Business Marketing Ppt PowerPoint Presentation Slides Aids
This is a financial business marketing ppt powerpoint presentation slides aids. This is a four stage process. The stages in this process are bar chart, finance, marketing, business, analysis.

Analysis Techniques Pareto Analysis Ppt PowerPoint Presentation Professional Icons
This is a analysis techniques pareto analysis ppt powerpoint presentation professional icons. This is a two stage process. The stages in this process are bar chart, finance, marketing, business, analysis.

Clustered Column Finance Ppt PowerPoint Presentation Pictures Inspiration
This is a clustered column finance ppt powerpoint presentation pictures inspiration. This is a two stage process. The stages in this process are bar chart, finance, marketing, business, analysis.

Data Collection Histograms Ppt PowerPoint Presentation Icon Slides
This is a data collection histograms ppt powerpoint presentation icon slides. This is a two stage process. The stages in this process are bar chart, finance, marketing, business, analysis.

Stacked Column Chart Ppt PowerPoint Presentation Professional Aids
This is a stacked column chart ppt powerpoint presentation professional aids. This is a three stage process. The stages in this process are bar chart, finance, marketing, business, analysis.

Analysis Techniques Pareto Analysis Ppt PowerPoint Presentation Example
This is a analysis techniques pareto analysis ppt powerpoint presentation example. This is a ten stage process. The stages in this process are business, strategy, bar graph, line graph, process.
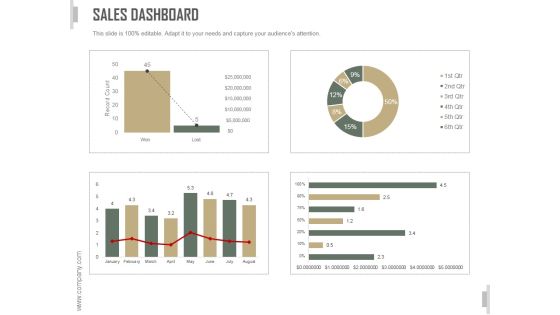
Sales Dashboard Slide Ppt PowerPoint Presentation Template
This is a sales dashboard slide ppt powerpoint presentation template. This is a three stage process. The stages in this process are business, strategy, marketing, analysis, bar graph, growth strategy.
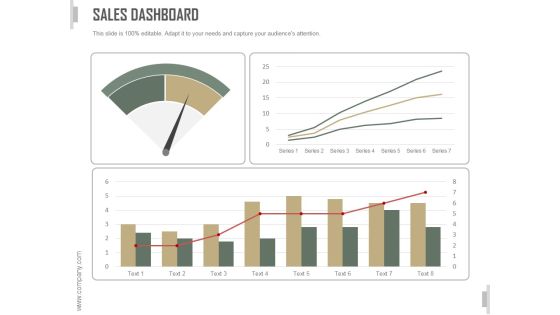
Sales Dashboard Ppt PowerPoint Presentation Design Templates
This is a sales dashboard ppt powerpoint presentation design templates. This is a four stage process. The stages in this process are business, strategy, marketing, analysis, bar graph, growth strategy.
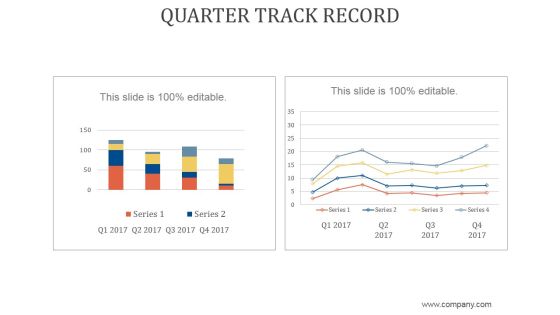
Quarter Track Record Ppt PowerPoint Presentation Samples
This is a quarter track record ppt powerpoint presentation samples. This is a two stage process. The stages in this process are business, strategy, marketing, analysis, growth strategy, bar graph.
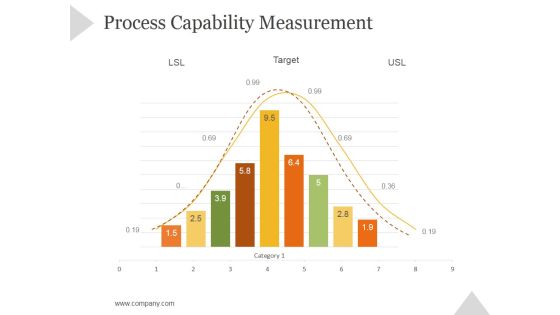
Process Capability Measurement Ppt PowerPoint Presentation Rules
This is a process capability measurement ppt powerpoint presentation rules. This is a nine stage process. The stages in this process are business, strategy, marketing, success, bar graph, growth strategy.

Budgeting Planned Actual Comparison Ppt PowerPoint Presentation Portfolio
This is a budgeting planned actual comparison ppt powerpoint presentation portfolio. This is a three stage process. The stages in this process are business, strategy, marketing, analysis, success, bar graph.

Clustered Column Template 1 Ppt PowerPoint Presentation Inspiration
This is a clustered column template 1 ppt powerpoint presentation inspiration. This is a twelve stage process. The stages in this process are bar graph, marketing, strategy, analysis, business, success.

Clustered Column Template 2 Ppt PowerPoint Presentation Icon
This is a clustered column template 2 ppt powerpoint presentation icon. This is a two stage process. The stages in this process are bar graph, marketing, strategy, analysis, business, success.

Customer Trends Template 1 Ppt PowerPoint Presentation Diagrams
This is a customer trends template 1 ppt powerpoint presentation diagrams. This is a five stage process. The stages in this process are business, marketing, bar graph, finance, management.

Annual Run Rate Ppt PowerPoint Presentation Designs Download
This is a annual run rate ppt powerpoint presentation designs download. This is a four stage process. The stages in this process are business, marketing, success, business plan, bar graph.
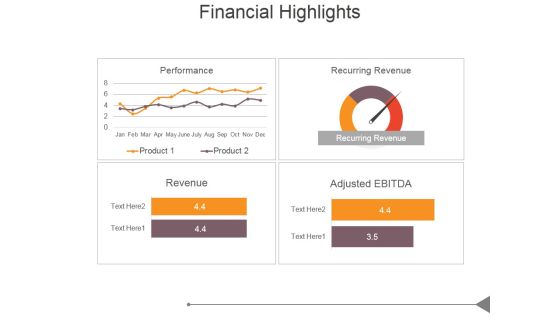
Financial Highlights Template 1 Ppt PowerPoint Presentation Model
This is a financial highlights template 1 ppt powerpoint presentation model. This is a four stage process. The stages in this process are business, marketing, success, business plan, bar graph.
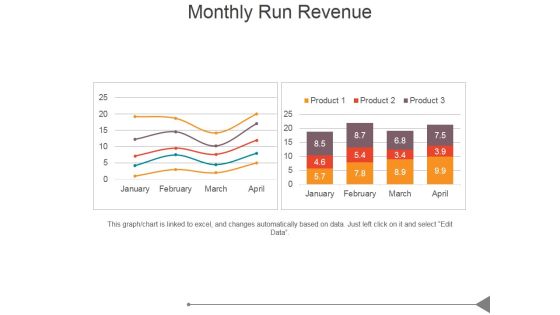
Monthly Run Revenue Ppt PowerPoint Presentation Design Ideas
This is a monthly run revenue ppt powerpoint presentation design ideas. This is a two stage process. The stages in this process are business, marketing, success, bar graph, growth.

Real Estate Home Price Index Ppt PowerPoint Presentation Example
This is a real estate home price index ppt powerpoint presentation example. This is a one stage process. The stages in this process are bar graph, business, marketing, success, management.

Real Estate Home Sales Ppt PowerPoint Presentation Pictures
This is a real estate home sales ppt powerpoint presentation pictures. This is a one stage process. The stages in this process are bar graph, business, marketing, success, management.

Real Estate Home Price Index Ppt PowerPoint Presentation Samples
This is a real estate home price index ppt powerpoint presentation samples. This is a one stage process. The stages in this process are in percentage, business, bar graph, marketing, success, management.

Combo Chart Ppt PowerPoint Presentation Shapes
This is a combo chart ppt powerpoint presentation shapes. This is a eight stage process. The stages in this process are combo chart, business, marketing, sales in percentage, bar graph.

 Home
Home