Bar Graphics
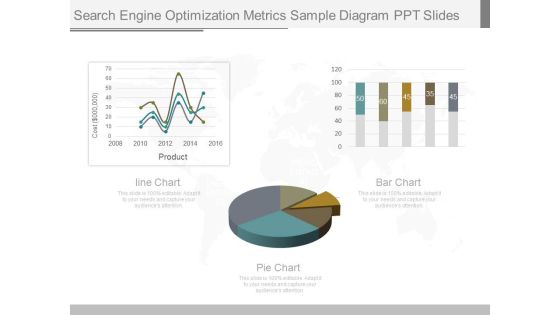
Search Engine Optimization Metrics Sample Diagram Ppt Slides
This is a search engine optimization metrics sample diagram ppt slides. This is a three stage process. The stages in this process are cost, product, line chart, bar chart, pie chart.
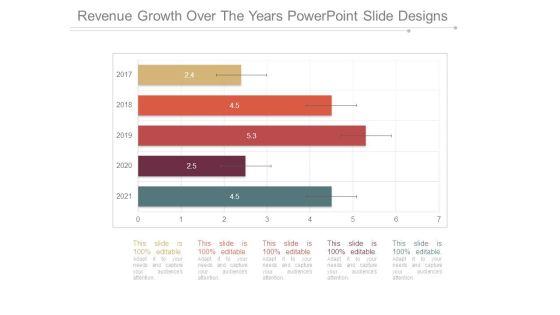
Revenue Growth Over The Years Powerpoint Slide Designs
This is a revenue growth over the years powerpoint slide designs. This is a five stage process. The stages in this process are bar graph, years, business, growth, marketing.
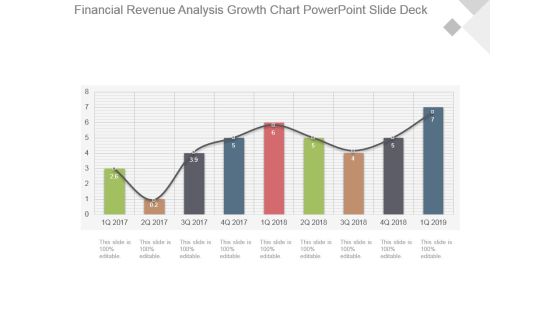
Financial Revenue Analysis Growth Chart Powerpoint Slide Deck
This is a financial revenue analysis growth chart powerpoint slide deck. This is a nine stage process. The stages in this process are growth, success, business, marketing, bar graph.
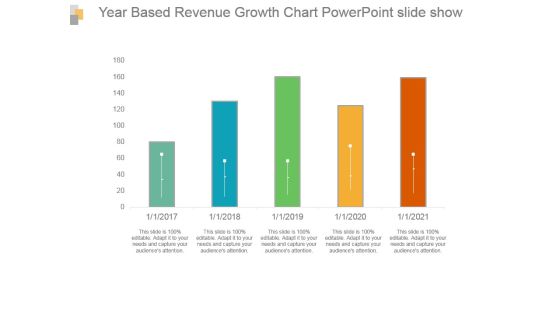
Year Based Revenue Growth Chart Powerpoint Slide Show
This is a year based revenue growth chart powerpoint slide show. This is a five stage process. The stages in this process are bar graph, growth, revenue, year, success.

Annual Customer Service Performance Review Example Of Ppt
This is a annual customer service performance review example of ppt. This is a twelve stage process. The stages in this process are bar graph, growth, data, customer, success.

Corporate Growth Over The Years Ppt PowerPoint Presentation Good
This is a corporate growth over the years ppt powerpoint presentation good. This is a five stage process. The stages in this process are business, strategy, marketing, growth, bar graph.

Cycle Time By Month Ppt PowerPoint Presentation Guidelines
This is a cycle time by month ppt powerpoint presentation guidelines. This is a twelve stage process. The stages in this process are business, strategy, marketing, process, arrow, finance, bar graph.

Data Collection And Analysis Control Chart Ppt PowerPoint Presentation Example File
This is a data collection and analysis control chart ppt powerpoint presentation example file. This is a four stage process. The stages in this process are business, strategy, marketing, bar graph, growth strategy.

Projected Sales Volume Ppt PowerPoint Presentation Pictures
This is a projected sales volume ppt powerpoint presentation pictures. This is a five stage process. The stages in this process are business, strategy, marketing, analysis, liner process, bar graph.

Gross Margin Improvement Ppt PowerPoint Presentation Guidelines
This is a gross margin improvement ppt powerpoint presentation guidelines. This is a two stage process. The stages in this process are business, bar graph, investment, marketing, strategy, success.

Lead Scoring Template Ppt PowerPoint Presentation Model
This is a lead scoring template ppt powerpoint presentation model. This is a four stage process. The stages in this process are business, marketing, success, bar graph, lead scoring.
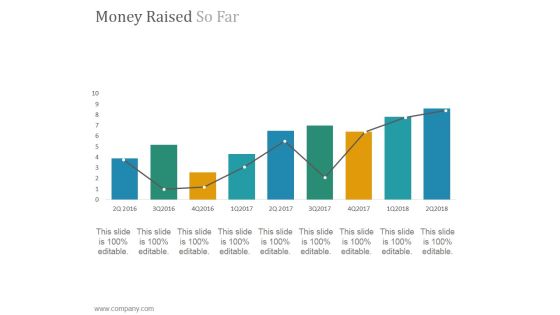
Money Raised So Far Ppt PowerPoint Presentation Layout
This is a money raised so far ppt powerpoint presentation layout. This is a nine stage process. The stages in this process are chart, bar graph, success, growth, marketing.
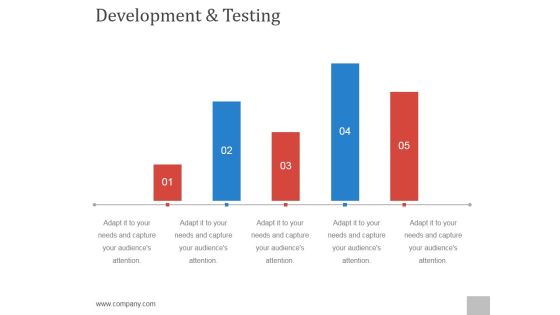
Development And Testing Ppt PowerPoint Presentation Background Designs
This is a development and testing ppt powerpoint presentation background designs. This is a five stage process. The stages in this process are step, business, growth, success, bar graph.
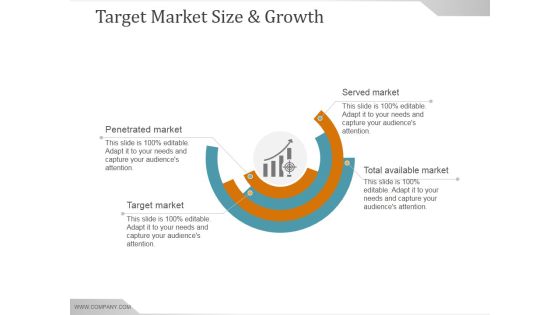
Target Market Size And Growth Ppt PowerPoint Presentation Slide Download
This is a target market size and growth ppt powerpoint presentation slide download. This is a eight stage process. The stages in this process are business, marketing, success, planning, bar graph.

Column Chart Ppt PowerPoint Presentation Background Designs
This is a column chart ppt powerpoint presentation background designs. This is a two stage process. The stages in this process are bar graph, finance, marketing, strategy, analysis, business.

Combo Chart Ppt PowerPoint Presentation Infographics Infographics
This is a combo chart ppt powerpoint presentation infographics infographics. This is a three stage process. The stages in this process are bar graph, growth, finance, marketing, strategy, business.

Crm Dashboard Deals By Expected Close Date Ppt PowerPoint Presentation Portfolio Icons
This is a crm dashboard deals by expected close date ppt powerpoint presentation portfolio icons. This is a three stage process. The stages in this process are bar graph, finance, marketing, strategy, business, analysis, growth.

Crm Dashboard Top Customers Ppt PowerPoint Presentation Styles Designs
This is a crm dashboard top customers ppt powerpoint presentation styles designs. This is a ten stage process. The stages in this process are business, customer, finance, bar graph, marketing, strategy, analysis.

Advertising Spent On Different Mediums Ppt PowerPoint Presentation Infographics Show
This is a advertising spent on different mediums ppt powerpoint presentation infographics show. This is a five stage process. The stages in this process are business, finance, marketing, strategy, bar graph, growth.
Revenue Split By Product Segment Template 1 Ppt PowerPoint Presentation Ideas Icons
This is a revenue split by product segment template 1 ppt powerpoint presentation ideas icons. This is a four stage process. The stages in this process are business, marketing, success, bar graph, product.
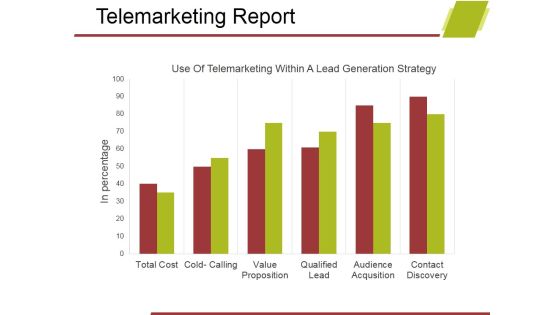
Telemarketing Report Template 1 Ppt PowerPoint Presentation Show Design Ideas
This is a telemarketing report template 1 ppt powerpoint presentation show design ideas. This is a six stage process. The stages in this process are business, bar graph, marketing, analysis, growth, strategy.

Clustered Column Line Ppt PowerPoint Presentation Summary Styles
This is a clustered column line ppt powerpoint presentation summary styles. This is a four stage process. The stages in this process are bar graph, business, marketing, growth, success.

Gap Between Current And Required Staff Ppt PowerPoint Presentation Infographic Template Microsoft
This is a gap between current and required staff ppt powerpoint presentation infographic template microsoft. This is a five stage process. The stages in this process are business, bar graph, finance, marketing, strategy, analysis.

Clustered Column Line Ppt PowerPoint Presentation Summary Slides
This is a clustered column line ppt powerpoint presentation summary slides. This is a four stage process. The stages in this process are bar graph, growth, success, business, marketing.

Financial Projection Graph Template 1 Ppt PowerPoint Presentation Professional Example Introduction
This is a financial projection graph template 1 ppt powerpoint presentation professional example introduction. This is a three stage process. The stages in this process are business, bar graph, finance, marketing, strategy, analysis.

Types Of Channel Promotion Used Ppt PowerPoint Presentation Outline Display
This is a types of channel promotion used ppt powerpoint presentation outline display. This is a ten stage process. The stages in this process are bar graph, business, marketing, strategy, charts.

Data Analytics Ppt PowerPoint Presentation Icon Master Slide
This is a data analytics ppt powerpoint presentation icon master slide. This is a five stage process. The stages in this process are bar graph, growth, success, business, marketing.
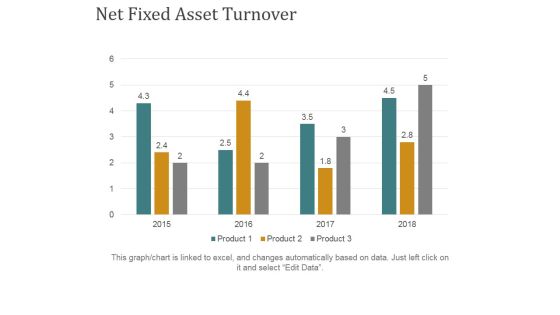
Net Fixed Asset Turnover Ppt PowerPoint Presentation Ideas Grid
This is a net fixed asset turnover ppt powerpoint presentation ideas grid. This is a four stage process. The stages in this process are business, finance, marketing, bar graph, strategy.

World Sector Growth Ppt PowerPoint Presentation Gallery Template
This is a world sector growth ppt powerpoint presentation gallery template. This is a four stage process. The stages in this process are business, bar graph, finance, marketing, strategy.

Staff Acquisition Cost Cost Per Hire Ppt PowerPoint Presentation Styles Guidelines
This is a staff acquisition cost cost per hire ppt powerpoint presentation styles guidelines. This is a seven stage process. The stages in this process are cost per hire, bar graph, business, marketing, planning.

Annual Run Rate Ppt PowerPoint Presentation Gallery Mockup
This is a annual run rate ppt powerpoint presentation gallery mockup. This is a four stage process. The stages in this process are bar graph, growth, success, business, marketing.
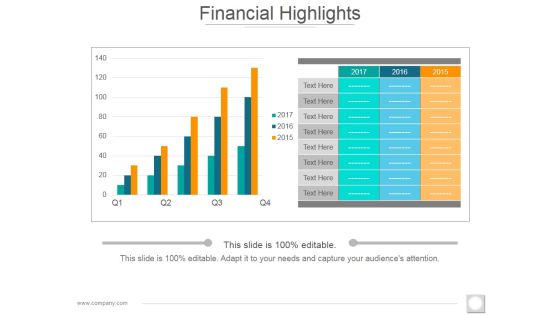
Financial Highlights Template 2 Ppt PowerPoint Presentation Slides Ideas
This is a financial highlights template 2 ppt powerpoint presentation slides ideas. This is a two stage process. The stages in this process are bar graph, growth, success, business, marketing.
Monthly Recurring Revenue Churn Template 1 Ppt PowerPoint Presentation Icon Microsoft
This is a monthly recurring revenue churn template 1 ppt powerpoint presentation icon microsoft. This is a four stage process. The stages in this process are bar graph, growth, success, business, marketing.

Stacked Area Clustered Column Ppt PowerPoint Presentation Show Guidelines
This is a stacked area clustered column ppt powerpoint presentation show guidelines. This is a four stage process. The stages in this process are in percentage, product, bar graph, growth, success.

Competitor Analysis Graph Ppt PowerPoint Presentation Slides Elements
This is a competitor analysis graph ppt powerpoint presentation slides elements. This is a five stage process. The stages in this process are bar graph, finance, marketing, strategy, business.

Clustered Column Ppt PowerPoint Presentation File Slide
This is a clustered column ppt powerpoint presentation file slide. This is a two stage process. The stages in this process are product, financial year, sales in percentage, bar graph.

Combo Chart Ppt PowerPoint Presentation Summary Slides
This is a combo chart ppt powerpoint presentation summary slides. This is a three stage process. The stages in this process are market size, product, growth rate, bar graph, success.

Clustered Column Ppt PowerPoint Presentation Slides Smartart
This is a clustered column ppt powerpoint presentation slides smartart. This is a two stage process. The stages in this process are product, sales in percentage, financial year, bar graph.
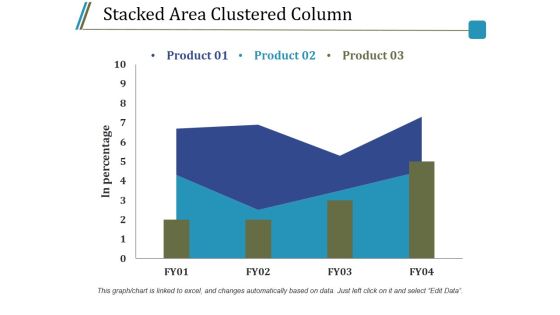
Stacked Area Clustered Column Ppt PowerPoint Presentation Model Guidelines
This is a stacked area clustered column ppt powerpoint presentation model guidelines. This is a three stage process. The stages in this process are product, in percentage, bar graph, growth, success.
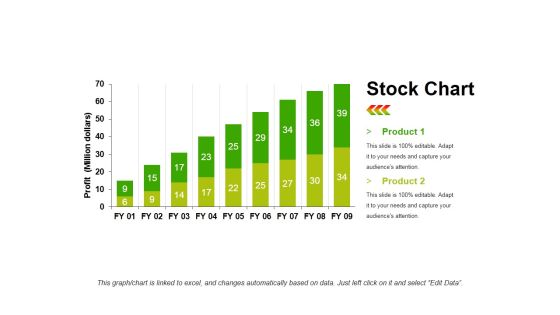
Stock Chart Template 1 Ppt PowerPoint Presentation Infographic Template Objects
This is a stock chart template 1 ppt powerpoint presentation infographic template objects. This is a two stage process. The stages in this process are product, profit, bar graph, growth, success.

Stacked Area Clustered Column Ppt PowerPoint Presentation File Background Designs
This is a stacked area clustered column ppt powerpoint presentation file background designs. This is a three stage process. The stages in this process are product, in percentage, growth, success, bar graph.

Clustered Column Line Ppt PowerPoint Presentation Icon Ideas
This is a clustered column line ppt powerpoint presentation icon ideas. This is a three stage process. The stages in this process are product, in percentage, bar graph, success, growth.

Clustered Column Template 1 Ppt PowerPoint Presentation Outline File Formats
This is a clustered column template 1 ppt powerpoint presentation outline file formats. This is a two stage process. The stages in this process are product, bar graph, success, growth, finance.

Clustered Column Template 2 Ppt PowerPoint Presentation Summary Smartart
This is a clustered column template 2 ppt powerpoint presentation summary smartart. This is a two stage process. The stages in this process are product, bar graph, in percentage, clustered column, growth.

Stacked Area Clustered Column Ppt PowerPoint Presentation Summary Professional
This is a stacked area clustered column ppt powerpoint presentation summary professional. This is a three stage process. The stages in this process are product, bar graph, growth, success, in percentage.
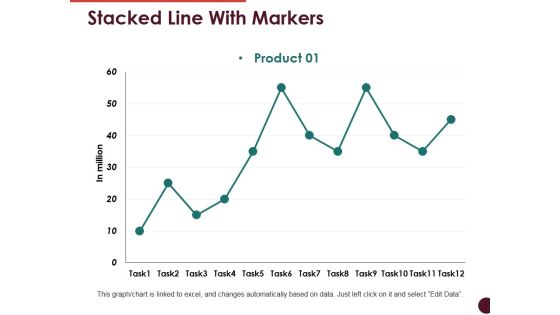
Stacked Line With Markers Ppt PowerPoint Presentation Show Templates
This is a stacked line with markers ppt powerpoint presentation show templates. This is a one stage process. The stages in this process are product, bar graph, growth, success, business.
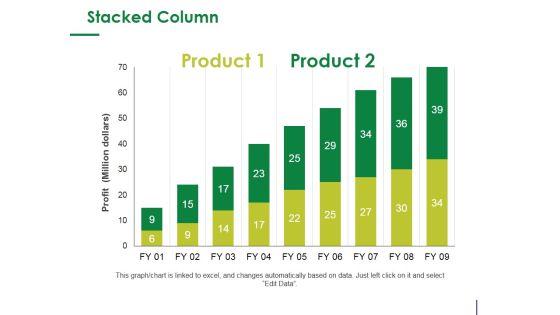
Stacked Column Ppt PowerPoint Presentation Infographic Template Design Ideas
This is a stacked column ppt powerpoint presentation infographic template design ideas. This is a two stage process. The stages in this process are product, profit, bar graph, growth, success.

Competitor Revenue And Profit Template 1 Ppt PowerPoint Presentation Infographic Template Designs Download
This is a competitor revenue and profit template 1 ppt powerpoint presentation infographic template designs download. This is a five stage process. The stages in this process are revenue, profit, competitor, bar graph, growth.

Combo Chart Ppt PowerPoint Presentation Inspiration Background
This is a combo chart ppt powerpoint presentation inspiration background. This is a three stage process. The stages in this process are product, bar graph, market size, growth, growth rate.

Budgeting Planned Actual Comparison Ppt PowerPoint Presentation Portfolio Background
This is a budgeting planned actual comparison ppt powerpoint presentation portfolio background. This is a three stage process. The stages in this process are planned cost, actual cost, value difference, deviation, bar graph.

Column Chart Ppt PowerPoint Presentation Infographics Deck
This is a column chart ppt powerpoint presentation infographics deck. This is a two stage process. The stages in this process are product, expenditure in, years, bar graph, growth.

Product Launch Budget Plan Ppt PowerPoint Presentation File Formats
This is a product launch budget plan ppt powerpoint presentation file formats. This is a seven stage process. The stages in this process are business, marketing, strategy, planning, bar graph.

Clustered Column Line Ppt PowerPoint Presentation Icon Good
This is a clustered column line ppt powerpoint presentation icon good. This is a three stage process. The stages in this process are product, financial year, bar graph, business, growth.

Combo Chart Ppt PowerPoint Presentation Slides Show
This is a combo chart ppt powerpoint presentation slides show. This is a three stage process. The stages in this process are combo chart, market size, product, bar graph, growth.
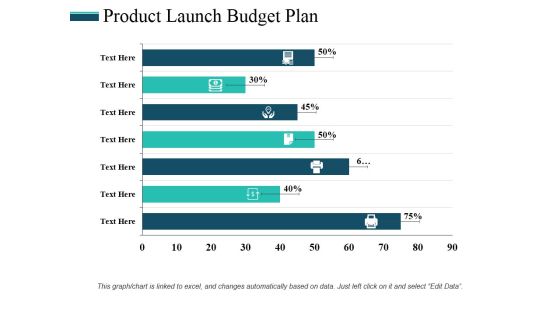
Product Launch Budget Plan Ppt PowerPoint Presentation Professional Rules
This is a product launch budget plan ppt powerpoint presentation professional rules. This is a seven stage process. The stages in this process are bar graph, finance, business, marketing, planning.

Column Chart Ppt PowerPoint Presentation Layouts Tips
This is a column chart ppt powerpoint presentation layouts tips. This is a six stage process. The stages in this process are sales in percentage, financial year, bar graph, growth, success.

Combo Chart Ppt PowerPoint Presentation Inspiration Slide Portrait
This is a combo chart ppt powerpoint presentation inspiration slide portrait. This is a three stage process. The stages in this process are product, market size, bar chart, growth, success.
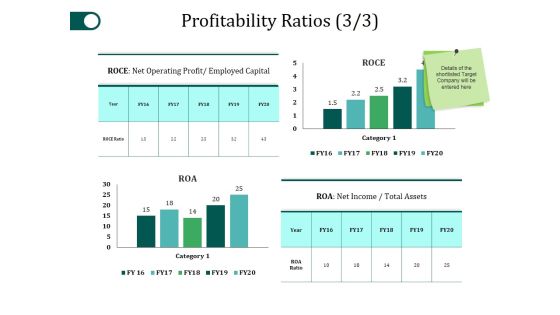
Profitability Ratios Template 3 Ppt PowerPoint Presentation Gallery Slide Portrait
This is a profitability ratios template 3 ppt powerpoint presentation gallery slide portrait. This is a four stage process. The stages in this process are category, roce, net income, business, bar graph.

Column Chart Ppt PowerPoint Presentation Portfolio Slide Download
This is a column chart ppt powerpoint presentation portfolio slide download. This is a two stage process. The stages in this process are product, year, bar graph, success, business.

Combo Chart Ppt PowerPoint Presentation Show Influencers
This is a combo chart ppt powerpoint presentation show influencers. This is a three stage process. The stages in this process are product, bar graph, growth, growth rate, market size.

 Home
Home