Bar Graphics

Client Referrals Ppt PowerPoint Presentation Example 2015
This is a client referrals ppt powerpoint presentation example 2015. This is a three stage process. The stages in this process are business, marketing, management, bar graph, line bar.
Histogram Column Chart With Red Arrow Vector Icon Ppt PowerPoint Presentation Outline Ideas Cpb
This is a histogram column chart with red arrow vector icon ppt powerpoint presentation outline ideas cpb. This is a three stage process. The stages in this process are bar chart icon, bar graph icon, data chart icon.
Histogram Financial Analysis Vector Icon Ppt PowerPoint Presentation Layouts File Formats Cpb
This is a histogram financial analysis vector icon ppt powerpoint presentation layouts file formats cpb. This is a three stage process. The stages in this process are bar chart icon, bar graph icon, data chart icon.
Histogram Icon Showing Economic Fluctuations Ppt PowerPoint Presentation Slides Samples Cpb
This is a histogram icon showing economic fluctuations ppt powerpoint presentation slides samples cpb. This is a three stage process. The stages in this process are bar chart icon, bar graph icon, data chart icon.
Histogram Showing Business Trends Vector Icon Ppt PowerPoint Presentation Styles Portrait Cpb
This is a histogram showing business trends vector icon ppt powerpoint presentation styles portrait cpb. This is a three stage process. The stages in this process are bar chart icon, bar graph icon, data chart icon.
Histogram With Dollar For Financial Success Vector Icon Ppt PowerPoint Presentation Portfolio Example File Cpb
This is a histogram with dollar for financial success vector icon ppt powerpoint presentation portfolio example file cpb. This is a three stage process. The stages in this process are bar chart icon, bar graph icon, data chart icon.
Histogram With Gear Vector Icon Ppt PowerPoint Presentation Professional Slides Cpb
This is a histogram with gear vector icon ppt powerpoint presentation professional slides cpb. This is a three stage process. The stages in this process are bar chart icon, bar graph icon, data chart icon.

Business Triangles PowerPoint Templates Marketing Pyramid Process Ppt Slides
Business Triangles PowerPoint Templates Marketing Pyramid Process PPT Slides-You have the product you need. Now mark your marketing strategies down the cone,stage by stage, refining as you go along. Enlighten others on the process with this innovative graphic to authenticate your plan of acheiving the goal of added value/profit.-Business Triangles PowerPoint Templates Marketing Pyramid Process PPT Slides-This template can be used for presentations relating to 3d, Bar, Business, Chart, Class, Conceptual, Corner, FInance, Graph, Graphic, Hierarchy, Investment, Layer, Level, Performance, Planner, Priority, Progress, Pyramid, Render, Status, Strategy, System, Triangle

Graph And Spheres Stacked In Line 4 Stages Business Plan PowerPoint Slides
We present our graph and spheres stacked in line 4 stages business plan PowerPoint Slides.Present our Business PowerPoint Templates because You are an avid believer in ethical practices. Highlight the benefits that accrue with our PowerPoint Templates and Slides. Use our Spheres PowerPoint Templates because you can Set pulses racing with our PowerPoint Templates and Slides. They will raise the expectations of your team. Present our Competition PowerPoint Templates because It will Raise the bar of your Thoughts. They are programmed to take you to the next level. Present our Shapes PowerPoint Templates because You can Bait your audience with our PowerPoint Templates and Slides. They will bite the hook of your ideas in large numbers. Use our Success PowerPoint Templates because You can Be the star of the show with our PowerPoint Templates and Slides. Rock the stage with your ideas.Use these PowerPoint slides for presentations relating to bar, graph, statistics, economy, render, success, representation, diagram, graphic, achievment, obstruction, chevron, accounting, finances, energy eco, steps, figure, tall, barrier, strategy, ladder, up, planning, high, climb, stripes, growth, maintenance, profit, successful, repair, return, gradient, sustainability, financial, construction, upwards, increasing. The prominent colors used in the PowerPoint template are Blue light, Blue, Green.

Analysis Of Stack Overflow Diagram 7 Stages Online Business Plan PowerPoint Slides
We present our analysis of stack overflow diagram 7 stages online business plan PowerPoint Slides.Download and present our Business PowerPoint Templates because Our PowerPoint Templates and Slides will let your team Walk through your plans. See their energy levels rise as you show them the way. Download and present our Spheres PowerPoint Templates because It will Raise the bar of your Thoughts. They are programmed to take you to the next level. Download and present our Competition PowerPoint Templates because Our PowerPoint Templates and Slides has conjured up a web of all you need with the help of our great team. Use them to string together your glistening ideas. Use our Shapes PowerPoint Templates because They will Put your wonderful verbal artistry on display. Our PowerPoint Templates and Slides will provide you the necessary glam and glitter. Download our Success PowerPoint Templates because You are an avid believer in ethical practices. Highlight the benefits that accrue with our PowerPoint Templates and Slides.Use these PowerPoint slides for presentations relating to bar, graph, statistics, economy, render, success, representation, diagram, graphic, achievment, obstruction, chevron, accounting, finances, energy eco, steps, figure, tall, barrier, strategy, ladder, up, planning, high, climb, stripes, growth, maintenance, profit, successful, repair, return, gradient, sustainability, financial, construction, upwards, increasing. The prominent colors used in the PowerPoint template are Green, Gray, White.

SWOT Analysis Opportunity For The Company Summary PDF
Presenting swot analysis opportunity for the company summary pdf to provide visual cues and insights. Share and navigate important information on four stages that need your due attention. This template can be used to pitch topics like growing demand for fresh juices, more promotion, tie ups with cafes and bars. In addtion, this PPT design contains high resolution images, graphics, etc, that are easily editable and available for immediate download.
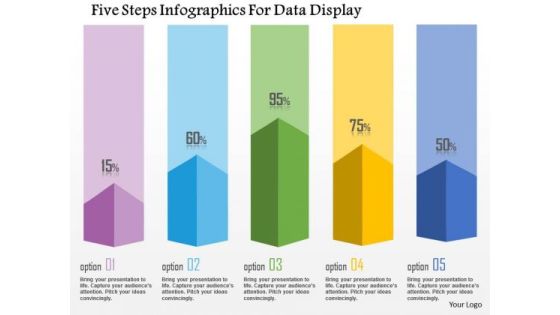
Business Diagram Five Steps Infographics For Data Display Presentation Template
This business diagram has been designed with graphic of five staged info graphics. This diagram can be used to display statistical information. Use this bar graph for your business and sales related presentations.

5 Sections Circular Gear Diagram Business Plan Financial Projections PowerPoint Slides
We present our 5 sections circular gear diagram business plan financial projections PowerPoint Slides.Download and present our Industrial PowerPoint Templates because It will Raise the bar of your Thoughts. They are programmed to take you to the next level. Use our Communication PowerPoint Templates because It can Leverage your style with our PowerPoint Templates and Slides. Charm your audience with your ability. Download our Business PowerPoint Templates because You can Zap them with our PowerPoint Templates and Slides. See them reel under the impact. Use our Gear Wheels PowerPoint Templates because Our PowerPoint Templates and Slides are created with admirable insight. Use them and give your group a sense of your logical mind. Download and present our Circle Charts PowerPoint Templates because You can Stir your ideas in the cauldron of our PowerPoint Templates and Slides. Cast a magic spell on your audience.Use these PowerPoint slides for presentations relating to Gear, vector, chart, isolated, model, step, layout, bar, business, concept, rotation, template, diagram, circle, shapes, ring, graphic, process, level, idea, graph, cycle, circulation, illustration, circular, round, segments, design, clip, motion, empty, procedure, art, progress, information, point, infographics. The prominent colors used in the PowerPoint template are Green, Black, Gray.
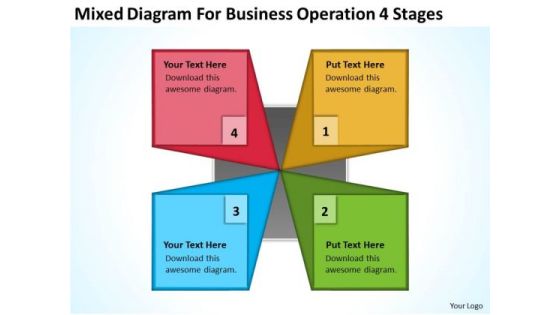
Mixed Diagram For Business Operation 4 Stages Ppt Plan PowerPoint Templates
We present our mixed diagram for business operation 4 stages ppt plan PowerPoint templates.Use our Process and Flows PowerPoint Templates because Our PowerPoint Templates and Slides will let you Illuminate the road ahead to Pinpoint the important landmarks along the way. Use our Business PowerPoint Templates because Our PowerPoint Templates and Slides will help you be quick off the draw. Just enter your specific text and see your points hit home. Present our Marketing PowerPoint Templates because Watching this your Audience will Grab their eyeballs, they wont even blink. Use our Shapes PowerPoint Templates because You canTake a leap off the starting blocks with our PowerPoint Templates and Slides. They will put you ahead of the competition in quick time. Use our Flow Charts PowerPoint Templates because It will Raise the bar of your Thoughts. They are programmed to take you to the next level.Use these PowerPoint slides for presentations relating to Diagram, website, bar, business, blank, tag, arrow, vector, sign, presentation, symbol, graphic, element, shape, label, abstract, team,modern, box, illustration, flyer, pink, connection, purple, web, design, color, ext, tab, badge, tape, set, banner, style, sticker, menu,background, site, announcement. The prominent colors used in the PowerPoint template are Red, Yellow, Green.

Parallel Arrows PowerPoint Executing Sequential Program Slides
We present our parallel arrows powerpoint executing sequential program Slides.Present our Success PowerPoint Templates because Our PowerPoint Templates and Slides are designed to help you succeed. They have all the ingredients you need. Present our Marketing PowerPoint Templates because They will Put the wind in your sails. Skim smoothly over the choppy waters of the market. Present our Arrows PowerPoint Templates because Our PowerPoint Templates and Slides will steer your racing mind. Hit the right buttons and spur on your audience. Download and present our Process and Flows PowerPoint Templates because Our PowerPoint Templates and Slides are created by a hardworking bunch of busybees. Always flitting around with solutions gauranteed to please. Download and present our Shapes PowerPoint Templates because Our PowerPoint Templates and Slides will embellish your thoughts. See them provide the desired motivation to your team.Use these PowerPoint slides for presentations relating to Arrow, Banner, Bar, Collection, Completion, Concept, Confirmation, Design, Flow, Graph, Graphic, Illustration, Indication, Information, Instruction, Interface, Internet, Layout, Measurement, Modern, Number, Order, Phase, Pointer, Process, Progress, Reflection, Scale, Shape, Stage, Status, Step, Template, Two, Vector, Web, Web Design, Web Design Elements, Websites, Work Flow. The prominent colors used in the PowerPoint template are Purple, Green, Blue. Customers tell us our parallel arrows powerpoint executing sequential program Slides will generate and maintain the level of interest you desire. They will create the impression you want to imprint on your audience. We assure you our Bar PowerPoint templates and PPT Slides will impress their bosses and teams. Use our parallel arrows powerpoint executing sequential program Slides will impress their bosses and teams. You can be sure our Bar PowerPoint templates and PPT Slides will help them to explain complicated concepts. PowerPoint presentation experts tell us our parallel arrows powerpoint executing sequential program Slides will help them to explain complicated concepts. The feedback we get is that our Design PowerPoint templates and PPT Slides are aesthetically designed to attract attention. We guarantee that they will grab all the eyeballs you need.

Circular Process With Gear 3 Stages Opening Business Plan PowerPoint Templates
We present our circular process with gear 3 stages opening business plan PowerPoint templates.Download and present our Process and Flows PowerPoint Templates because It will Raise the bar of your Thoughts. They are programmed to take you to the next level. Use our Flow Charts PowerPoint Templates because They will Put your wonderful verbal artistry on display. Our PowerPoint Templates and Slides will provide you the necessary glam and glitter. Use our Shapes PowerPoint Templates because Our PowerPoint Templates and Slides provide you with a vast range of viable options. Select the appropriate ones and just fill in your text. Download and present our Business PowerPoint Templates because It can Conjure up grand ideas with our magical PowerPoint Templates and Slides. Leave everyone awestruck by the end of your presentation. Use our Circle Charts PowerPoint Templates because It can Conjure up grand ideas with our magical PowerPoint Templates and Slides. Leave everyone awestruck by the end of your presentation.Use these PowerPoint slides for presentations relating to Arrow, gear, chart, vector, round, isolated, model, white, step, layout, bar, step, business, blank, concept, rotation, diagram, circle, shapes, ring,scheme, graphic, process, level, idea, graph, cycle, circulation, illustration, circular, segments, design, clip, step, motion, procedure, info, art,progress, information, background, radial. The prominent colors used in the PowerPoint template are Gray, Yellow, White.
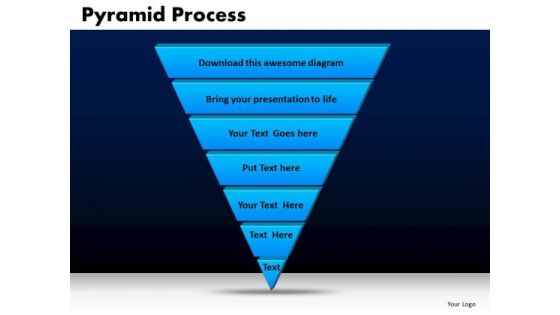
Business Triangles PowerPoint Templates Chart Pyramid Process Ppt Slides
Business Triangles PowerPoint Templates Chart Pyramid Process PPT Slides-A Pyramid Diagram may be defined as representation of data in the form of a triangle separated by horizontal lines. The widest section may contain the general topic while the narrowest section may contain a much more specific topic. -Business Triangles PowerPoint Templates Chart Pyramid Process PPT Slides-This template can be used for presentations relating to 3d, Bar, Business, Chart, Class, Conceptual, Corner, FInance, Graph, Graphic, Hierarchy, Investment, Layer, Level, Performance, Planner, Priority, Progress, Pyramid, Render, Status, Strategy, System, Triangle
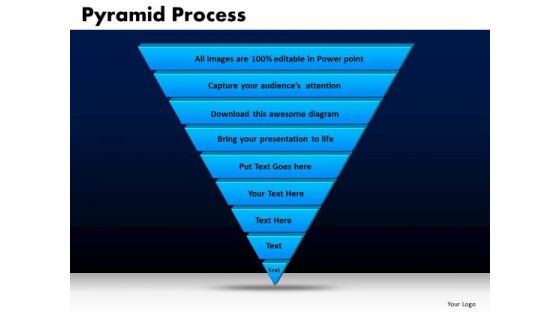
Business Triangles PowerPoint Templates Editable Pyramid Process Ppt Slides
Business Triangles PowerPoint Templates Editable Pyramid Process PPT Slides-A Pyramid Diagram may be defined as representation of data in the form of a triangle separated by horizontal lines. The widest section may contain the general topic while the narrowest section may contain a much more specific topic. -Business Triangles PowerPoint Templates Editable Pyramid Process PPT Slides-This template can be used for presentations relating to 3d, Bar, Business, Chart, Class, Conceptual, Corner, FInance, Graph, Graphic, Hierarchy, Investment, Layer, Level, Performance, Planner, Priority, Progress, Pyramid, Render, Status, Strategy, System, Triangle

Clustered Column Ppt PowerPoint Presentation Slides Visuals
This is a clustered column ppt powerpoint presentation slides visuals. This is a two stage process. The stages in this process are bar graph, marketing, strategy, finance, planning.

Column Chart Ppt PowerPoint Presentation Show Images
This is a column chart ppt powerpoint presentation show images. This is a two stage process. The stages in this process are product, expenditure, years, bar graph, growth.

Column Chart Ppt PowerPoint Presentation Layouts Images
This is a column chart ppt powerpoint presentation layouts images. This is a two stage process. The stages in this process are product, column chart, bar graph, marketing.

Conceptual Image Of Teamwork Leadership PowerPoint Templates And PowerPoint Themes 0812
Conceptual Image Of Teamwork Leadership PowerPoint Templates And PowerPoint Themes 0812-Microsoft Powerpoint Templates and Background with bar graph and red ball shows teamwork and leadership
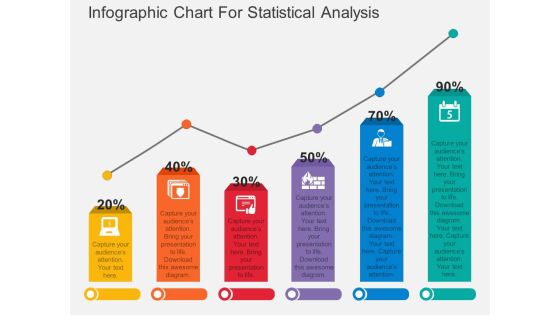
Infographic Chart For Statistical Analysis Powerpoint Template
Download this exclusive business diagram to display statistical analysis. This PowerPoint template contains bar chart with percentage values. This diagram is useful for business presentations.
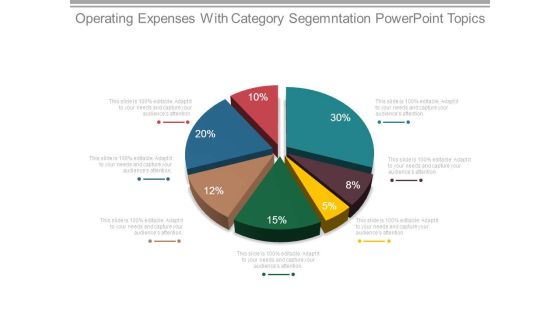
Operating Expenses With Category Segmentation Powerpoint Topics
This is a operating expenses with category segmentation powerpoint topics. This is a seven stage process. The stages in this process are bar chart, growth, business, success, management.
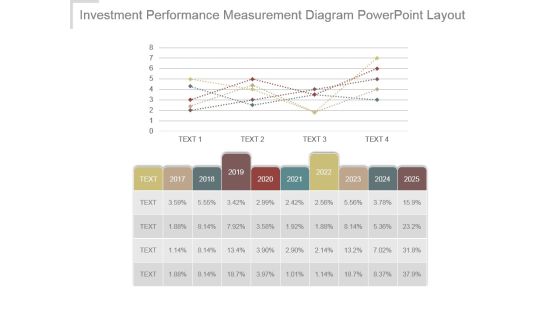
Investment Performance Measurement Diagram Powerpoint Layout
This is a investment performance measurement diagram powerpoint layout. This is a five stage process. The stages in this process are bar graph, growth, success, business, marketing.
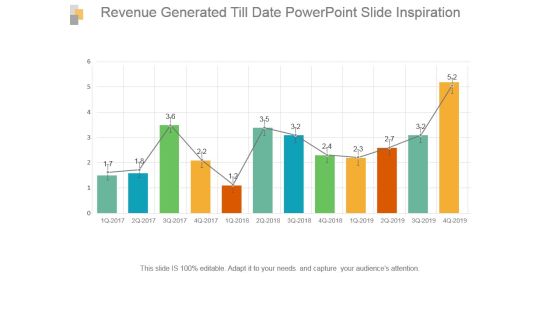
Revenue Generated Till Date Powerpoint Slide Inspiration
This is a revenue generated till date powerpoint slide inspiration. This is a twelve stage process. The stages in this process are bar graph, growth, success, data, analysis.
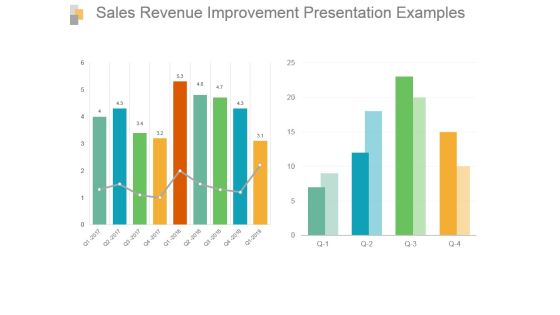
Sales Revenue Improvement Presentation Examples
This is a sales revenue improvement presentation examples. This is a two stage process. The stages in this process are bar graph, growth, sales, data, analysis.
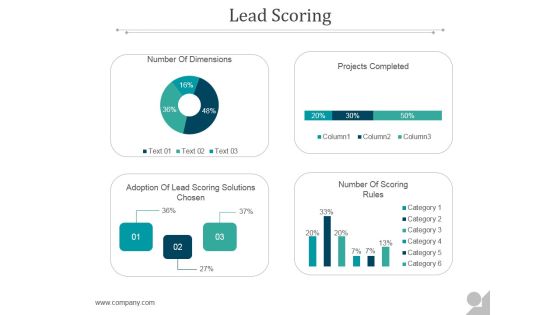
Lead Scoring Ppt PowerPoint Presentation Layouts
This is a lead scoring ppt powerpoint presentation layouts. This is a four stage process. The stages in this process are lead, business, bar graph, marketing, management.
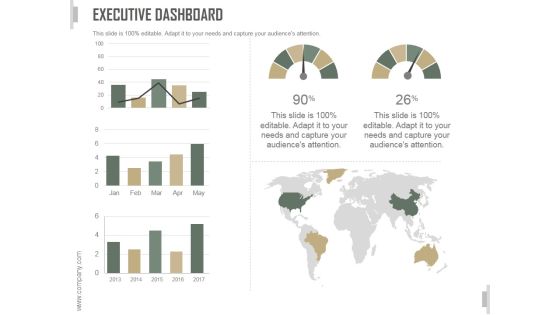
Executive Dashboard Ppt PowerPoint Presentation Examples
This is a executive dashboard ppt powerpoint presentation examples. This is a two stage process. The stages in this process are business, strategy, marketing, dashboard, location, bar chart.

Gross Margin Improvement Ppt PowerPoint Presentation Layout
This is a gross margin improvement ppt powerpoint presentation layout. This is a two stage process. The stages in this process are chart, bar graph, success, growth, marketing.

Clustered Column Line Ppt PowerPoint Presentation Samples
This is a clustered column line ppt powerpoint presentation samples. This is a four stage process. The stages in this process are finance, percentage, success, growth, bar graph.

Clustered Column Ppt PowerPoint Presentation Infographic Template
This is a clustered column ppt powerpoint presentation infographic template. This is a two stage process. The stages in this process are finance, percentage, bar graph, business, marketing.

Clustered Column Ppt PowerPoint Presentation Slide Download
This is a clustered column ppt powerpoint presentation slide download. This is a twelve stage process. The stages in this process are bar graph, marketing, strategy, analysis, business.

Competitor Analysis Graph Ppt PowerPoint Presentation Outline
This is a competitor analysis graph ppt powerpoint presentation outline. This is a five stage process. The stages in this process are bar graph, marketing, strategy, analysis, business.
Stacked Column Ppt PowerPoint Presentation Icon Samples
This is a stacked column ppt powerpoint presentation icon samples. This is a nine stage process. The stages in this process are bar graph, business, marketing, success, growth.
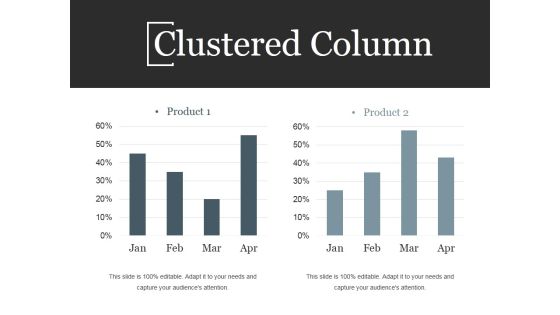
Clustered Column Ppt PowerPoint Presentation Information
This is a clustered column ppt powerpoint presentation information. This is a twelve stage process. The stages in this process are bar graph, business, marketing, growth, success.

Column Chart Ppt PowerPoint Presentation Professional Example
This is a column chart ppt powerpoint presentation professional example. This is a eight stage process. The stages in this process are bar graph, growth, success, business, marketing.
Growth Team Ppt PowerPoint Presentation Icon Topics
This is a growth team ppt powerpoint presentation icon topics. This is a five stage process. The stages in this process are bar graph, growth, success, business, marketing.

Column Chart Ppt PowerPoint Presentation Infographics Model
This is a column chart ppt powerpoint presentation infographics model. This is a two stage process. The stages in this process are bar graph, growth, product, percentage, year.

Stacked Column Ppt PowerPoint Presentation Outline Information
This is a stacked column ppt powerpoint presentation outline information. This is a two stage process. The stages in this process are profit, product, bar graph, growth, success.

Column Chart Ppt PowerPoint Presentation Professional Layouts
This is a column chart ppt powerpoint presentation professional layouts. This is a six stage process. The stages in this process are bar graph, business, marketing, finance, planning.

Channel Kpis Ppt PowerPoint Presentation Professional Inspiration
This is a channel kpis ppt powerpoint presentation professional inspiration. This is a four stage process. The stages in this process are bar graph, marketing, finance, strategy, planning.

Financial Highlights Ppt PowerPoint Presentation Gallery Deck
This is a financial highlights ppt powerpoint presentation gallery deck. This is a four stage process. The stages in this process are bar graph, marketing, finance, strategy, planning.

Column Chart Ppt PowerPoint Presentation Summary Maker
This is a column chart ppt powerpoint presentation summary maker. This is a two stage process. The stages in this process are business, marketing, product, bar graph, years.

Column Chart Ppt PowerPoint Presentation Portfolio Clipart
This is a column chart ppt powerpoint presentation portfolio clipart. This is a two stage process. The stages in this process are bar graph, growth, success, product, dollars.
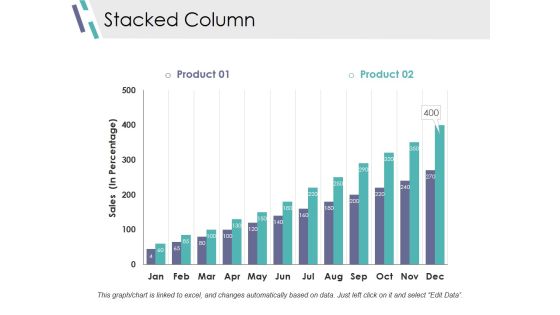
Stacked Column Ppt PowerPoint Presentation Professional Display
This is a stacked column ppt powerpoint presentation professional display. This is a two stage process. The stages in this process are bar graph, marketing, strategy, finance, planning.

Stacked Column Ppt PowerPoint Presentation Pictures Outfit
This is a stacked column ppt powerpoint presentation pictures outfit. This is a two stage process. The stages in this process are product, profit, growth, bar graph, success.

Clustered Column Ppt PowerPoint Presentation Professional Styles
This is a clustered column ppt powerpoint presentation professional styles. This is a two stage process. The stages in this process are product, profit, bar graph, growth, success.

Column Chart Ppt PowerPoint Presentation Professional Template
This is a column chart ppt powerpoint presentation professional template. This is a two stage process. The stages in this process are product, percentage, finance, bar graph, growth.

Area Chart Ppt PowerPoint Presentation Icon Gallery
This is a area chart ppt powerpoint presentation icon gallery. This is a two stage process. The stages in this process are sales in percentage, product, bar graph.

Timeline Analysis Ppt PowerPoint Presentation Professional Ideas
This is a timeline analysis ppt powerpoint presentation professional ideas. This is a seven stage process. The stages in this process are process changes, timeline analysis, bar graph.

Combo Chart Ppt PowerPoint Presentation Infographics Ideas
This is a combo chart ppt powerpoint presentation infographics ideas. This is a four stage process. The stages in this process are bar graph, marketing, strategy, finance, analysis.

Column Chart Ppt PowerPoint Presentation Summary
This is a column chart ppt powerpoint presentation summary. This is a two stage process. The stages in this process are bar graph, marketing, strategy, finance, planning.

Sales Projections Ppt PowerPoint Presentation Model Examples
This is a sales projections ppt powerpoint presentation model examples. This is a five stage process. The stages in this process are on sales, in years, bar graph.

Column Chart Ppt PowerPoint Presentation Model Layout Ideas
This is a column chart ppt powerpoint presentation model layout ideas. This is a two stage process. The stages in this process are product, column chart, bar graph.

Clustered Column Ppt PowerPoint Presentation Styles Templates
This is a clustered column ppt powerpoint presentation styles templates. This is a two stage process. The stages in this process are product, profit, bar graph.

Comparison Ppt PowerPoint Presentation Ideas Show
This is a comparison ppt powerpoint presentation ideas show. This is a two stage process. The stages in this process are comparison, bar graph, growth, management, business.
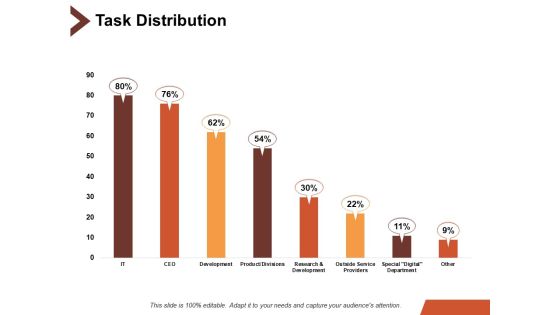
Task Distribution Ppt PowerPoint Presentation Outline Rules
This is a task distribution ppt powerpoint presentation outline rules. This is a eight stage process. The stages in this process are bar chart, finance, marketing, business, analysis.

Column Chart Graph Ppt PowerPoint Presentation Slides File Formats
This is a combo chart bar ppt powerpoint presentation slides portfolio. This is a three stage process. The stages in this process are finance, marketing, analysis, investment, million.

Campaign Performance Ppt PowerPoint Presentation Deck
This is a campaign performance ppt powerpoint presentation deck. This is a four stage process. The stages in this process are business, bar graph, strategy, growth, success.

 Home
Home