AI PPT Maker
Templates
PPT Bundles
Design Services
Business PPTs
Business Plan
Management
Strategy
Introduction PPT
Roadmap
Self Introduction
Timelines
Process
Marketing
Agenda
Technology
Medical
Startup Business Plan
Cyber Security
Dashboards
SWOT
Proposals
Education
Pitch Deck
Digital Marketing
KPIs
Project Management
Product Management
Artificial Intelligence
Target Market
Communication
Supply Chain
Google Slides
Research Services
 One Pagers
All Categories
-
Home
- Customer Favorites
- Year Over Year Growth
Year Over Year Growth
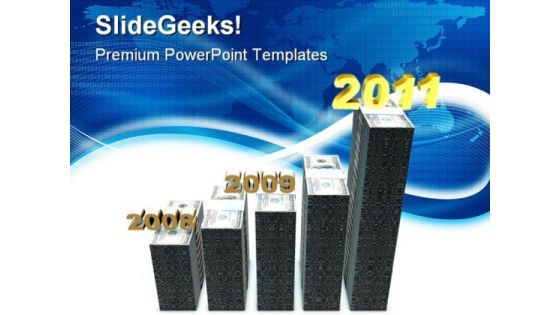
Bar Graph Business PowerPoint Templates And PowerPoint Backgrounds 0511
Microsoft PowerPoint Template and Background with bar graph showing the growth of profits in 2010 year
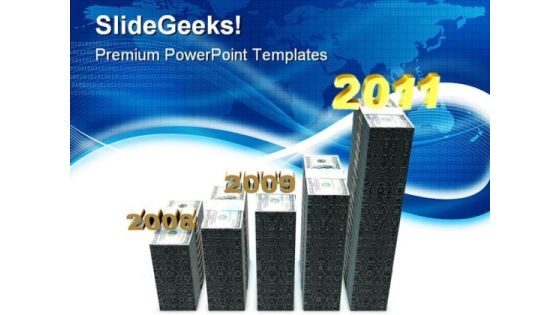
Bar Graph Business PowerPoint Themes And PowerPoint Slides 0511
Microsoft PowerPoint Theme and Slide with bar graph showing the growth of profits in 2010 year

Graph In 2011 Business PowerPoint Backgrounds And Templates 1210
Microsoft PowerPoint Template and Background with An orange arrow moving upwards over the 3D rendering of the year 2011 business graph on a white reflective background

Column Chart Ppt PowerPoint Presentation Layouts Design Inspiration
This is a column chart ppt powerpoint presentation layouts design inspiration. This is a two stage process. The stages in this process are sales in percentage, financial year in, graph, business, finance, marketing.
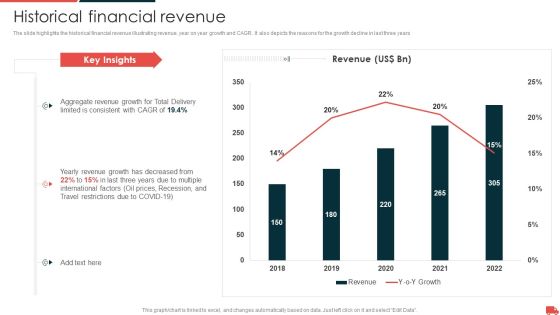
Transportation And Logistics Services Company Profile Historical Financial Revenue Rules PDF
The slide highlights the historical financial revenue illustrating revenue, year on year growth and CAGR. It also depicts the reasons for the growth decline in last three years. Deliver an awe inspiring pitch with this creative Transportation And Logistics Services Company Profile Historical Financial Revenue Rules PDF bundle. Topics like Revenue, 2018 To 2022, Yearly Revenue Growth, Travel Restrictions can be discussed with this completely editable template. It is available for immediate download depending on the needs and requirements of the user.

Company Sales And Performance Dashboard Ppt PowerPoint Presentation Show Structure
This is a company sales and performance dashboard ppt powerpoint presentation show structure. This is a four stage process. The stages in this process are year product sales, month growth in revenue, profit margins graph, year profits.
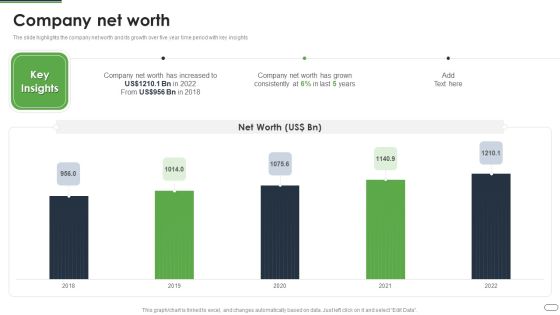
Financial Solutions Company Profile Company Net Worth Professional PDF
The slide highlights the company net worth and its growth over five year time period with key insights Deliver an awe inspiring pitch with this creative Financial Solutions Company Profile Company Net Worth Professional PDF bundle. Topics like Company, Net Worth can be discussed with this completely editable template. It is available for immediate download depending on the needs and requirements of the user.

Banking Institution Company Profile Company Net Worth Portrait PDF
The slide highlights the company net worth and its growth over five year time period with key insights.Deliver an awe inspiring pitch with this creative Banking Institution Company Profile Company Net Worth Portrait PDF bundle. Topics like Company Net Worth can be discussed with this completely editable template. It is available for immediate download depending on the needs and requirements of the user.
Forecasted Global Medicare IT Market Size Pictures PDF
This slide shows predicted healthcare IT Market Size over six years from 2022-26 for highlighting various reasons behind it. It includes elements such as annual average growth, next year growth percentage etc. Presenting Forecasted Global Medicare IT Market Size Pictures PDF to dispense important information. This template comprises six stages. It also presents valuable insights into the topics including Annual Average Growth, Fragmented Market, Neutral Market Impact. This is a completely customizable PowerPoint theme that can be put to use immediately. So, download it and address the topic impactfully.
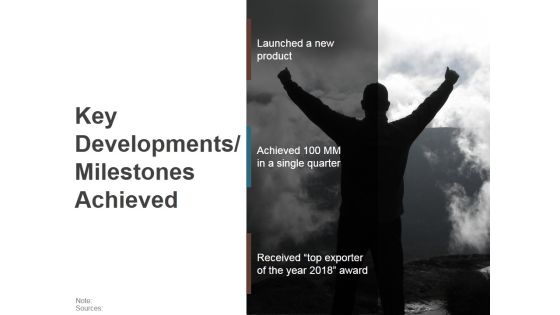
Key Developments Milestones Achieved Ppt PowerPoint Presentation Ideas Summary
This is a key developments milestones achieved ppt powerpoint presentation ideas summary. This is a one stage process. The stages in this process are launched a new product, achieved 100 mm in a single quarter, received top exporter of the year 2018 award.

Annual Cycle For Business Planning Ppt PowerPoint Presentation Outline Graphics Tutorials
Presenting this set of slides with name annual cycle for business planning ppt powerpoint presentation outline graphics tutorials. This is a twelve stage process. The stages in this process are year wheel, annual wheel, 12 months wheel. This is a completely editable PowerPoint presentation and is available for immediate download. Download now and impress your audience.

Annual Cycle Four Quarters Arrows Plan Ppt PowerPoint Presentation Pictures Objects
Presenting this set of slides with name annual cycle four quarters arrows plan ppt powerpoint presentation pictures objects. This is a four stage process. The stages in this process are year wheel, annual wheel, 12 months wheel. This is a completely editable PowerPoint presentation and is available for immediate download. Download now and impress your audience.

Annual Cycle Gear With Text Holders Ppt PowerPoint Presentation Styles Guidelines
Presenting this set of slides with name annual cycle gear with text holders ppt powerpoint presentation styles guidelines. This is a four stage process. The stages in this process are year wheel, annual wheel, 12 months wheel. This is a completely editable PowerPoint presentation and is available for immediate download. Download now and impress your audience.

Annual Cycle Monthly Schedule Planning Ppt PowerPoint Presentation Outline Format Ideas
Presenting this set of slides with name annual cycle monthly schedule planning ppt powerpoint presentation outline format ideas. This is a four stage process. The stages in this process are year wheel, annual wheel, 12 months wheel. This is a completely editable PowerPoint presentation and is available for immediate download. Download now and impress your audience.

Annual Cycle With Financial Planning Icon Ppt PowerPoint Presentation Professional Templates
Presenting this set of slides with name annual cycle with financial planning icon ppt powerpoint presentation professional templates. This is a twelve stage process. The stages in this process are year wheel, annual wheel, 12 months wheel. This is a completely editable PowerPoint presentation and is available for immediate download. Download now and impress your audience.

Annual Cycle With Four Seasons Ppt PowerPoint Presentation Slides Graphics
Presenting this set of slides with name annual cycle with four seasons ppt powerpoint presentation slides graphics. This is a four stage process. The stages in this process are year wheel, annual wheel, 12 months wheel. This is a completely editable PowerPoint presentation and is available for immediate download. Download now and impress your audience.

Annual Cycle With Months And Text Holders Ppt PowerPoint Presentation Show Topics
Presenting this set of slides with name annual cycle with months and text holders ppt powerpoint presentation show topics. This is a twelve stage process. The stages in this process are year wheel, annual wheel, 12 months wheel. This is a completely editable PowerPoint presentation and is available for immediate download. Download now and impress your audience.

Business Plan And Schedule Calendar Vector Icon Ppt PowerPoint Presentation Ideas Graphic Images
Presenting this set of slides with name business plan and schedule calendar vector icon ppt powerpoint presentation ideas graphic images. This is a four stage process. The stages in this process are year wheel, annual wheel, 12 months wheel. This is a completely editable PowerPoint presentation and is available for immediate download. Download now and impress your audience.
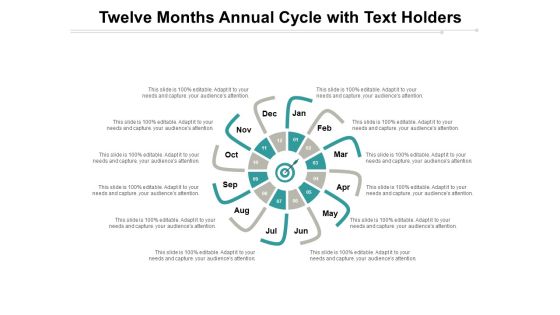
Twelve Months Annual Cycle With Text Holders Ppt PowerPoint Presentation Slides Themes
Presenting this set of slides with name twelve months annual cycle with text holders ppt powerpoint presentation slides themes. This is a twelve stage process. The stages in this process are year wheel, annual wheel, 12 months wheel. This is a completely editable PowerPoint presentation and is available for immediate download. Download now and impress your audience.
IT Services Business Profile Company Revenue Icons PDF
The slide shows annual revenue growth of the company with the CAGR for last five financial years from 2018 to 2022. It also highlights year on year growth along with key insights. Deliver and pitch your topic in the best possible manner with this IT Services Business Profile Company Revenue Icons PDF. Use them to share invaluable insights on Revenue, Growth, Business Uncertainties and impress your audience. This template can be altered and modified as per your expectations. So, grab it now.
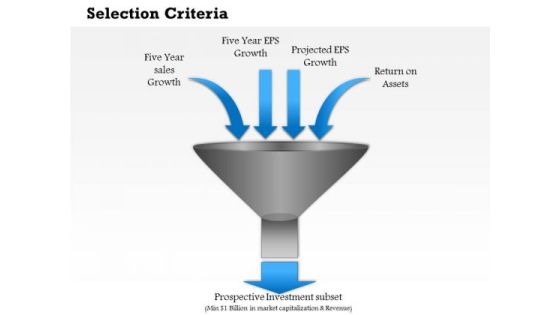
Business Diagram Selection Criteria PowerPoint Ppt Presentation
This slide displays framework for selection criteria. This diagram contains funnel diagram with four inward arrows representing five year sales growth, five year EPS growth, projected EPS growth and return on assets. You can use this funnel diagram in business and sales related presentations.

Stages Of Career For Internet Marketing Professionals Elements PDF
This slide illustrates the career path for digital marketing personnel with salary growth and experience years. It includes different levels of career track such as digital marketing assistant, manager, vice president, etc Presenting Stages Of Career For Internet Marketing Professionals Elements PDF to dispense important information. This template comprises six stages. It also presents valuable insights into the topics including Digital Marketing, Business Manager, Assistant Manager. This is a completely customizable PowerPoint theme that can be put to use immediately. So, download it and address the topic impactfully.

Earning Potential From CAGR And Business Share Data Summary PDF
This slide illustrates evaluation of expected growth potential from past CAGR and business share. It includes total market share, volume share, CAGR of last 5 years, estimated market selling products in unbranded form etc. Persuade your audience using this Earning Potential From CAGR And Business Share Data Summary PDF. This PPT design covers one stages, thus making it a great tool to use. It also caters to a variety of topics including Products, Business, Revenue Share. Download this PPT design now to present a convincing pitch that not only emphasizes the topic but also showcases your presentation skills.

Tools For Prioritization Milestones Achieved In FY20 Ppt PowerPoint Presentation Gallery Structure PDF
This slide demonstrates monthly milestones achieved by the company in 2020 financial year. It also shows that company completed 24 projects successfully in FY19. This is a tools for prioritization milestones achieved in fy20 ppt powerpoint presentation gallery structure pdf template with various stages. Focus and dispense information on one stages using this creative set, that comes with editable features. It contains large content boxes to add your information on topics like strategic expansion, collaborating, technologies, projects successfully, corporate award. You can also showcase facts, figures, and other relevant content using this PPT layout. Grab it now.
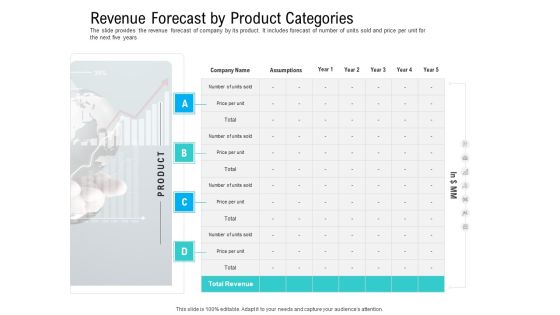
Pre Seed Funding Pitch Deck Revenue Forecast By Product Categories Ppt Infographics Example PDF
The slide provides the revenue forecast of company by its product. It includes forecast of number of units sold and price per unit for the next five years. This is a pre seed funding pitch deck revenue forecast by product categories ppt infographics example pdf template with various stages. Focus and dispense information on five stages using this creative set, that comes with editable features. It contains large content boxes to add your information on topics like revenue forecast by product categories. You can also showcase facts, figures, and other relevant content using this PPT layout. Grab it now.
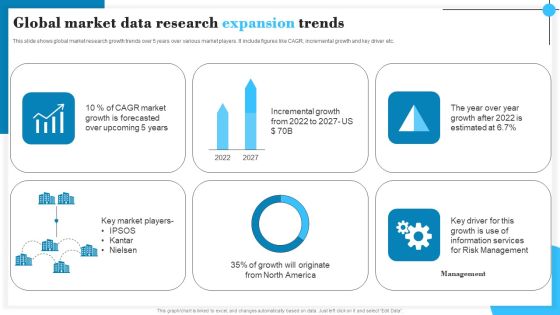
Global Market Data Research Expansion Trends Graphics PDF
This slide shows global market research growth trends over 5 years over various market players. It include figures like CAGR, incremental growth and key driver etc. Pitch your topic with ease and precision using this Global Market Data Research Expansion Trends Graphics PDF. This layout presents information on CAGR Market, Incremental Growth, Management. It is also available for immediate download and adjustment. So, changes can be made in the color, design, graphics or any other component to create a unique layout.

Marketing And Operation Planning Dashboard To Drive Better Performance Graphics PDF
This slide covers sales and operations planning dashboard to improve performance. It involves bookings plan, year on year growth, bookings plan per year and total growth and sales made by sales manager. Showcasing this set of slides titled Marketing And Operation Planning Dashboard To Drive Better Performance Graphics PDF. The topics addressed in these templates are Sales Manager, Growth Made, Bookings Plan By Year. All the content presented in this PPT design is completely editable. Download it and make adjustments in color, background, font etc. as per your unique business setting.

Freight Shipping Company Profile Historical Financial Revenue Guidelines PDF
The slide highlights the historical financial revenue illustrating revenue, year on year growth and CAGR. It also depicts the reasons for the growth decline in last three years.Deliver and pitch your topic in the best possible manner with this Freight Shipping Company Profile Historical Financial Revenue Guidelines PDF. Use them to share invaluable insights on Global Offices, Employees, Offices and impress your audience. This template can be altered and modified as per your expectations. So, grab it now.
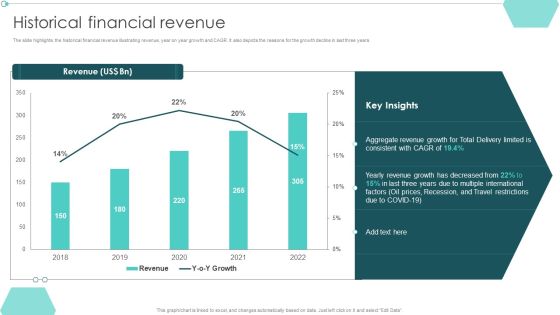
Transportation Company Profile Historical Financial Revenue Ppt PowerPoint Presentation File Layout PDF
The slide highlights the historical financial revenue illustrating revenue, year on year growth and CAGR. It also depicts the reasons for the growth decline in last three years.Deliver and pitch your topic in the best possible manner with this Transportation Company Profile Historical Financial Revenue Ppt PowerPoint Presentation File Layout PDF. Use them to share invaluable insights on Aggregate Revenue, Multiple International, Prices Recession and impress your audience. This template can be altered and modified as per your expectations. So, grab it now.
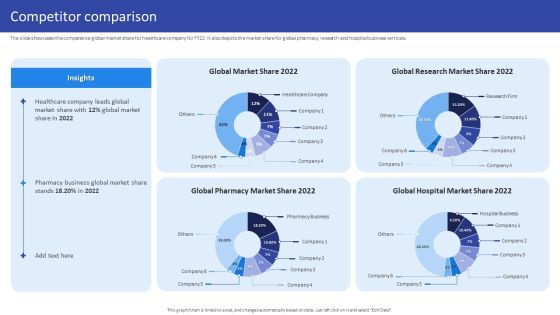
Hospital Medical Research Company Profile Competitor Comparison Inspiration PDF
The slide showcases the healthcare company historical yearly growth for profit and revenue. It also showcases comparative revenue and profit year on year growth for pharmacy, hospital and research business verticals. Deliver an awe inspiring pitch with this creative Hospital Medical Research Company Profile Competitor Comparison Inspiration PDF bundle. Topics like Global Market, Share 2022, Global Research, Market Share 2022 can be discussed with this completely editable template. It is available for immediate download depending on the needs and requirements of the user.
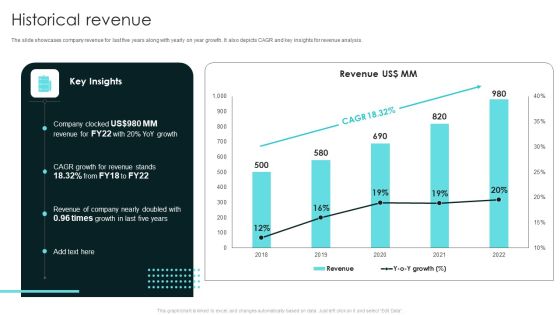
Term Life And General Insurance Company Profile Historical Revenue Designs PDF
The slide showcases company revenue for last five years along with yearly on year growth. It also depicts CAGR and key insights for revenue analysis. Deliver and pitch your topic in the best possible manner with this Term Life And General Insurance Company Profile Historical Revenue Designs PDF. Use them to share invaluable insights on Revenue, Growth and impress your audience. This template can be altered and modified as per your expectations. So, grab it now.

Company Revenue IT Software Development Company Profile Demonstration PDF
The slide shows annual revenue growth of the company with the CAGR for last five financial years from 2018 to 2022. It also highlights year on year growth along with key insights. Deliver an awe inspiring pitch with this creative Company Revenue IT Software Development Company Profile Demonstration PDF bundle. Topics like Company Revenue, Historical Revenue can be discussed with this completely editable template. It is available for immediate download depending on the needs and requirements of the user.

Business Plan Management Summary Ppt PowerPoint Presentation Rules
This is a business plan management summary ppt powerpoint presentation rules. This is a eight stage process. The stages in this process are market revenue, average price per unit industrial cameras, average price per unit frame grabbers, market size for last year of study period, base year market growth rate, compound annual growth rate, degree of technical change, market concentration.
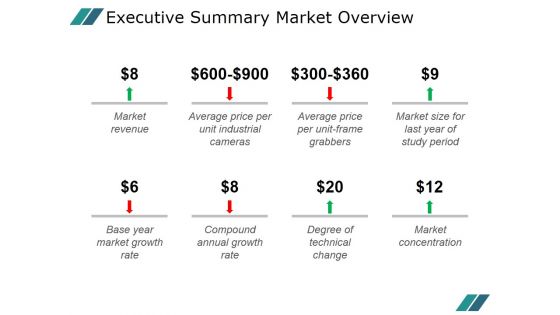
Executive Summary Market Overview Ppt PowerPoint Presentation Templates
This is a executive summary market overview ppt powerpoint presentation templates. This is a eight stage process. The stages in this process are market revenue, average price per unit industrial cameras, average price per unit frame grabbers, market size for last year of study period, base year market growth rate, compound annual growth rate, degree of technical change.

Commercial Bank Financial Services Company Profile Company Net Worth Template PDF
The slide highlights the company net worth and its growth over five year time period with key insights. Deliver an awe inspiring pitch with this creative Commercial Bank Financial Services Company Profile Company Net Worth Template PDF bundle. Topics like Company Net Worth can be discussed with this completely editable template. It is available for immediate download depending on the needs and requirements of the user.

Banking Solutions Company Overview Company Net Worth Infographics PDF
The slide highlights the company net worth and its growth over five year time period with key insights. Deliver and pitch your topic in the best possible manner with this Banking Solutions Company Overview Company Net Worth Infographics PDF. Use them to share invaluable insights on Company Net Worth, Key Insights and impress your audience. This template can be altered and modified as per your expectations. So, grab it now.
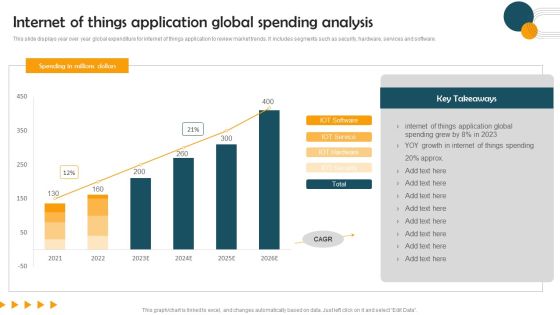
Internet Of Things Application Global Spending Analysis Guidelines PDF
This slide displays year over year global expenditure for internet of things application to review market trends. It includes segments such as security, hardware, services and software. Showcasing this set of slides titled Internet Of Things Application Global Spending Analysis Guidelines PDF. The topics addressed in these templates are Internet Of Things Application, Global Spending Analysis. All the content presented in this PPT design is completely editable. Download it and make adjustments in color, background, font etc. as per your unique business setting.

Netsurf Business Profile Netsurf Turnover 2002 To 2022 Ppt Gallery Rules PDF
This slide represents the Netsurf turnover from last 20 years from 2002 to 2022 which shows increasing trend year after year. It also showcases compound annual growth rate. Deliver an awe inspiring pitch with this creative Netsurf Business Profile Netsurf Turnover 2002 To 2022 Ppt Gallery Rules PDF bundle. Topics like Netsurf Turnover, 2002 To 2022, Company Turnover can be discussed with this completely editable template. It is available for immediate download depending on the needs and requirements of the user.
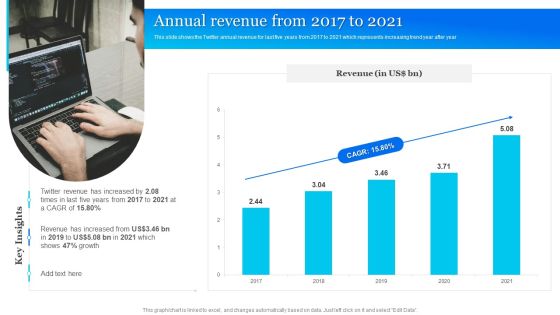
Twitter Company Summary Annual Revenue From 2017 To 2021 Inspiration PDF
This slide shows the Twitter annual revenue for last five years from 2017 to 2021 which represents increasing trend year after year. Deliver and pitch your topic in the best possible manner with this Twitter Company Summary Annual Revenue From 2017 To 2021 Inspiration PDF. Use them to share invaluable insights on Annual Revenue, Growth and impress your audience. This template can be altered and modified as per your expectations. So, grab it now.
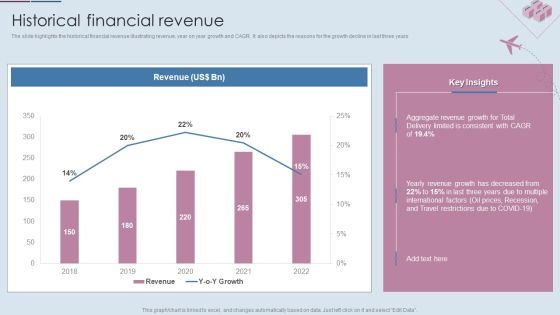
Logistics Shipment Company Profile Historical Financial Revenue Ppt Gallery Templates PDF
The slide highlights the historical financial revenue illustrating revenue, year on year growth and CAGR. It also depicts the reasons for the growth decline in last three years. Deliver and pitch your topic in the best possible manner with this Logistics Shipment Company Profile Historical Financial Revenue Ppt Gallery Templates PDF. Use them to share invaluable insights on Revenue, 2018 To 2022, Aggregate Revenue Growth and impress your audience. This template can be altered and modified as per your expectations. So, grab it now.
Infotech Solutions Research And Development Company Summary Company Revenue Icons PDF
The slide shows annual revenue growth of the company with the CAGR for last five financial years from 2018 to 2022. It also highlights year on year growth along with key insights. Deliver and pitch your topic in the best possible manner with this Infotech Solutions Research And Development Company Summary Company Revenue Icons PDF. Use them to share invaluable insights on Business Uncertainties, Growth, Company Revenue and impress your audience. This template can be altered and modified as per your expectations. So, grab it now.
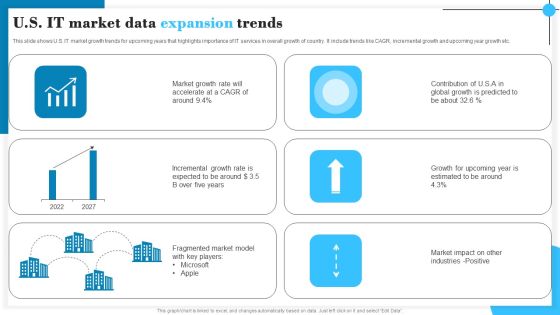
U S IT Market Data Expansion Trends Pictures PDF
This slide shows U.S. IT market growth trends for upcoming years that highlights importance of IT services in overall growth of country. It include trends like CAGR, incremental growth and upcoming year growth etc. Showcasing this set of slides titled U S IT Market Data Expansion Trends Pictures PDF. The topics addressed in these templates are Market Growth, Contribution, Incremental Growth. All the content presented in this PPT design is completely editable. Download it and make adjustments in color, background, font etc. as per your unique business setting.

Company Sales And Performance Dashboard Ppt PowerPoint Presentation Model Ideas
Presenting this set of slides with name company sales and performance dashboard ppt powerpoint presentation model ideas. The topics discussed in these slides are 5 month growth in revenue, 4 year product sales, profit margins graph, 4 year profits . This is a completely editable PowerPoint presentation and is available for immediate download. Download now and impress your audience.

Company Sales And Performance Dashboard Ppt PowerPoint Presentation Slides Background
Presenting this set of slides with name company sales and performance dashboard ppt powerpoint presentation slides background. The topics discussed in these slides are 5 month growth in revenue, 4 year product sales, profit margins graph, 4 year profits. This is a completely editable PowerPoint presentation and is available for immediate download. Download now and impress your audience.

Battery Chart With Percentage Values For Comparison PowerPoint Slides
This year?s sales has matched up with your expectations. Now match this slide with your presentation to show the same. Show your company?s performance or business growth with this four staged battery chart PowerPoint template. With this slide, you can easily convince your colleagues how your company gave a tremendous growth over the years or months. Perfect illustration to show that the targets are achieved. This PPT template is easy to edit. You can choose the color of your choice. Your colleagues are already impressed with the sales growth. Now impress others and choose this PPT innovative designed template.
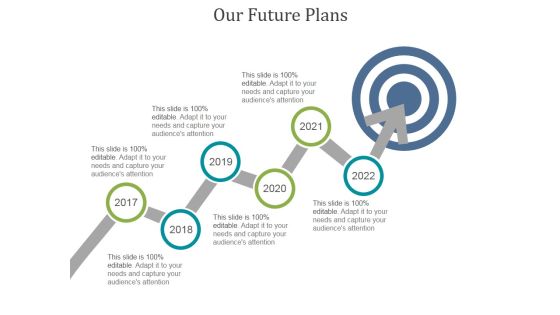
Our Future Plans Ppt PowerPoint Presentation Portfolio
This is a our future plans ppt powerpoint presentation portfolio. This is a six stage process. The stages in this process are business, years, growth, analysis, strategy, success.

Area Stacked Ppt PowerPoint Presentation Infographics Designs Download
This is a area stacked ppt powerpoint presentation infographics designs download. This is a two stage process. The stages in this process are years, growth, success, business, marketing.

Bar Graph Ppt PowerPoint Presentation Design Templates
This is a bar graph ppt powerpoint presentation design templates. This is a four stage process. The stages in this process are business, marketing, success, growth, years.
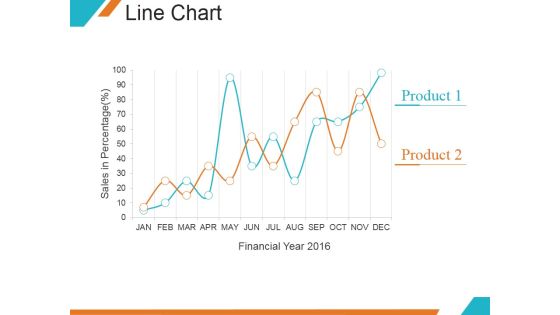
Line Chart Ppt PowerPoint Presentation Samples
This is a line chart ppt powerpoint presentation samples. This is a two stage process. The stages in this process are financial year, product, growth, marketing.

Bar Graph Ppt PowerPoint Presentation Summary Inspiration
This is a bar graph ppt powerpoint presentation summary inspiration. This is a four stage process. The stages in this process are graph, business, marketing, growth, years.

Bar Graph Ppt PowerPoint Presentation Pictures Display
This is a bar graph ppt powerpoint presentation pictures display. This is a one stage process. The stages in this process are sales in percentage, financial year.

Area Chart Ppt PowerPoint Presentation Summary Example
This is a area chart ppt powerpoint presentation summary example. This is a two stage process. The stages in this process are financial year, in percentage, product.

Line Chart Ppt PowerPoint Presentation Layouts Background Image
This is a line chart ppt powerpoint presentation layouts background image. This is a two stage process. The stages in this process are in percentage, in years, product.

Column Chart Ppt PowerPoint Presentation Layouts Layout
This is a column chart ppt powerpoint presentation layouts layout. This is a five stage process. The stages in this process are column chart, years, business, management, marketing.

Combo Chart Ppt PowerPoint Presentation Slides Introduction
This is a combo chart ppt powerpoint presentation slides introduction. This is a four stage process. The stages in this process are profit, years, business, marketing, graph.

Revenue Model Ppt PowerPoint Presentation Professional Maker
This is a revenue model ppt powerpoint presentation professional maker. This is a six stage process. The stages in this process are recurring revenue frequency, life time value of a customer, pricing, estimated yearly revenue, expected arpu.

Revenue Model Ppt PowerPoint Presentation Ideas Objects
This is a revenue model ppt powerpoint presentation ideas objects. This is a six stage process. The stages in this process are expected arpu, expected conversion rate to get a paid client, pricing, recurring revenue frequency, estimated yearly revenue.
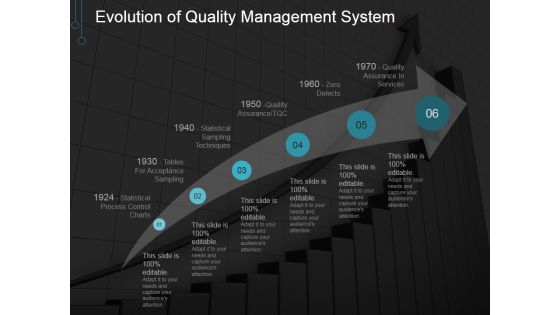
Evolution Of Quality Management System Ppt PowerPoint Presentation Visuals
This is a evolution of quality management system ppt powerpoint presentation visuals. This is a six stage process. The stages in this process are growth, year, business, marketing, success.

Scatter Bubble Chart Ppt PowerPoint Presentation Professional Model
This is a scatter bubble chart ppt powerpoint presentation professional model. This is a six stage process. The stages in this process are sales in profit, financial year, growth, business, marketing, strategy.
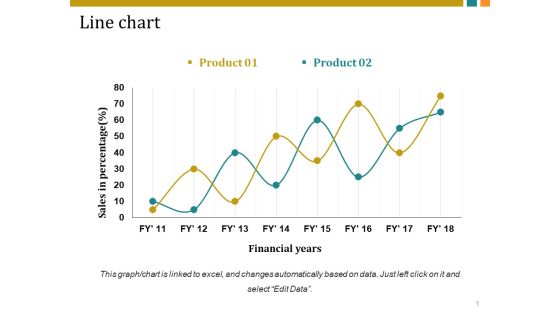
Line Chart Ppt PowerPoint Presentation Inspiration Vector
This is a line chart ppt powerpoint presentation inspiration vector. This is a two stage process. The stages in this process are sales in percentage, financial years, business, marketing, growth.

Line Chart Ppt PowerPoint Presentation Infographics Graphic Images
This is a line chart ppt powerpoint presentation infographics graphic images. This is a two stage process. The stages in this process are sales in percentage, financial years, growth, business, marketing.

Line Chart Ppt PowerPoint Presentation Pictures Templates
This is a line chart ppt powerpoint presentation pictures templates. This is a two stage process. The stages in this process are sales in percentage, financial years, business, marketing, growth.
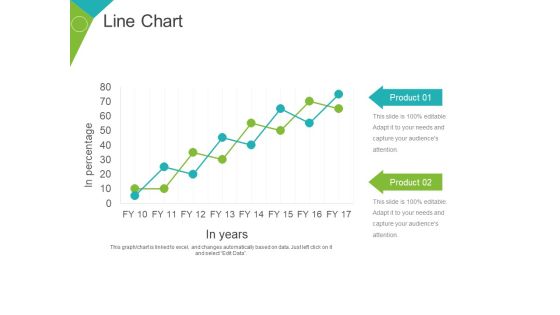
Line Chart Ppt PowerPoint Presentation Gallery Objects
This is a line chart ppt powerpoint presentation gallery objects. This is a two stage process. The stages in this process are product, business, marketing, growth, in years, in percentage.

Area Chart Ppt PowerPoint Presentation File Graphic Tips
This is a area chart ppt powerpoint presentation file graphic tips. This is a two stage process. The stages in this process are product, in percentage, financial year, business, growth.
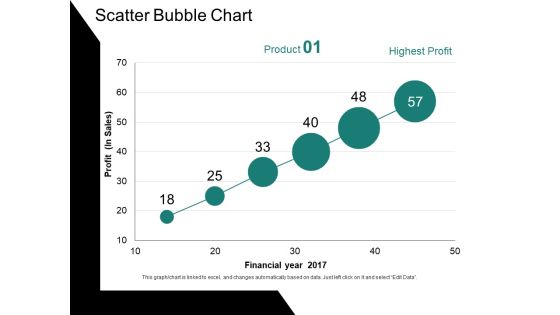
Scatter Bubble Chart Ppt PowerPoint Presentation Ideas Gallery
This is a scatter bubble chart ppt powerpoint presentation ideas gallery. This is a six stage process. The stages in this process are profit, financial year, chart, business, growth.

Column Chart Ppt PowerPoint Presentation Gallery Graphics Example
This is a column chart ppt powerpoint presentation gallery graphics example. This is a two stage process. The stages in this process are expenditure in, years, business, marketing, growth.

Combo Chart Ppt PowerPoint Presentation Show Elements
This is a combo chart ppt powerpoint presentation show elements. This is a three stage process. The stages in this process are in price, in years, business, marketing, growth.

client referrals ppt powerpoint presentation visual aids show
This is a client referrals ppt powerpoint presentation visual aids show. This is a four stage process. The stages in this process are in dollar, years, business, marketing, growth.
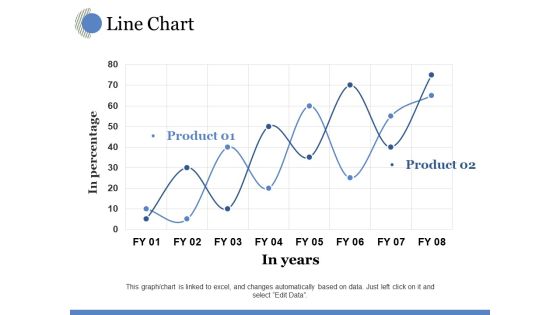
Line Chart Ppt PowerPoint Presentation Model Visual Aids
This is a line chart ppt powerpoint presentation model visual aids. This is a two stage process. The stages in this process are in years, in percentage, growth, business, marketing.
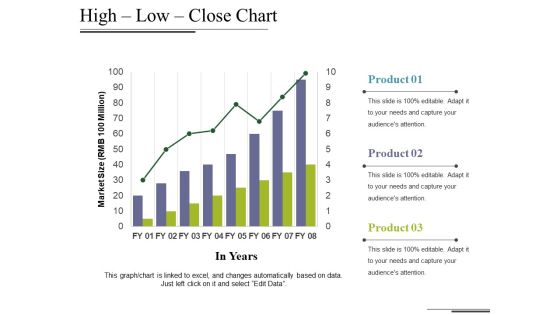
High Low Close Chart Ppt PowerPoint Presentation Styles Maker
This is a high low close chart ppt powerpoint presentation styles maker. This is a three stage process. The stages in this process are market size, in years, growth, business, marketing, graph.

Sales Forecasting Template 1 Ppt PowerPoint Presentation Slides Download
This is a sales forecasting template 1 ppt powerpoint presentation slides download. This is a one stage process. The stages in this process are forecast, sales, years, business, icons.
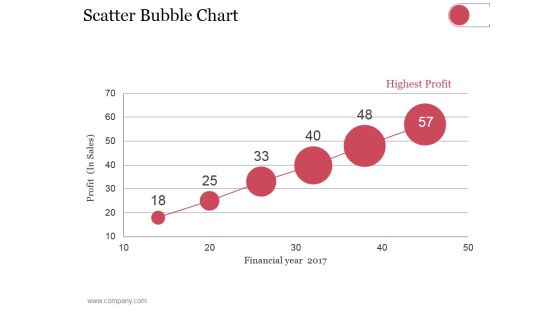
Scatter Bubble Chart Ppt PowerPoint Presentation Summary Pictures
This is a scatter bubble chart ppt powerpoint presentation summary pictures. This is a six stage process. The stages in this process are highest profit, financial year, profit in sales.

Line Chart Ppt PowerPoint Presentation Model Design Templates
This is a line chart ppt powerpoint presentation model design templates. This is a two stage process. The stages in this process are sales in percentage, financial years, product.
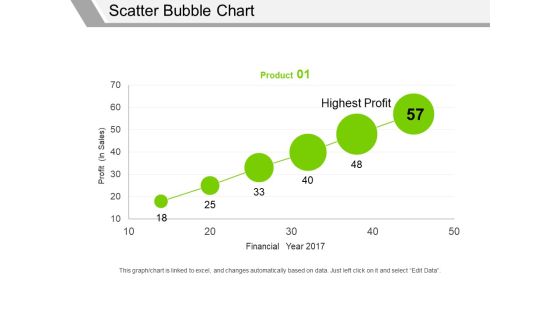
Scatter Bubble Chart Ppt PowerPoint Presentation Professional Graphics Pictures
This is a scatter bubble chart ppt powerpoint presentation professional graphics pictures. This is a one stage process. The stages in this process are profit in sales, financial year, highest profit, product.

Combo Chart Ppt PowerPoint Presentation Summary Layouts
This is a combo chart ppt powerpoint presentation summary layouts. This is a eight stage process. The stages in this process are product, sales in percentage, in years, in price, graph.
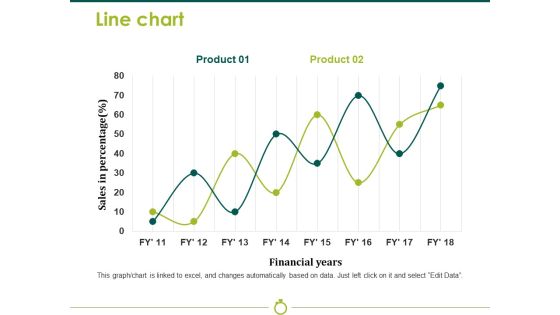
Line Chart Template 2 Ppt PowerPoint Presentation Model Background Image
This is a line chart template 2 ppt powerpoint presentation model background image. This is a two stage process. The stages in this process are sales in percentage, financial years, business, marketing, strategy, graph.
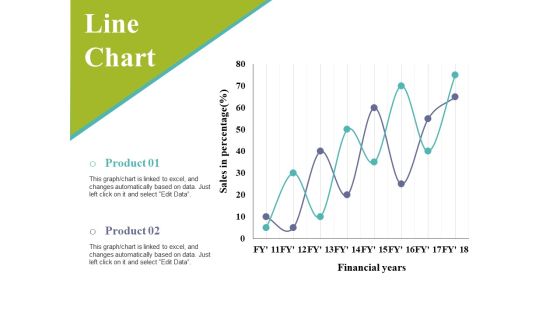
Line Chart Ppt PowerPoint Presentation Infographic Template Slides
This is a line chart ppt powerpoint presentation infographic template slides. This is a two stage process. The stages in this process are sales in percentage, financial years, business, marketing, graph.

Line Chart Ppt PowerPoint Presentation Styles Themes
This is a line chart ppt powerpoint presentation styles themes. This is a two stage process. The stages in this process are business, marketing, financial years, sales in percentage.
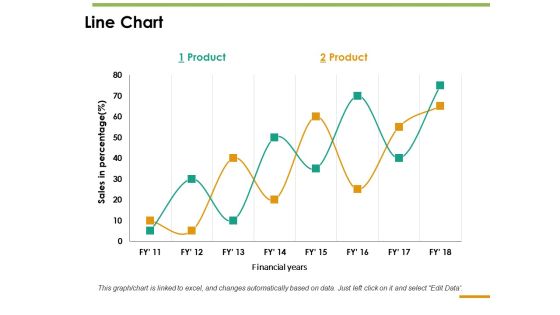
Line Chart Ppt PowerPoint Presentation Inspiration Guide
This is a line chart ppt powerpoint presentation inspiration guide. This is a two stage process. The stages in this process are line chart, sales in percentage, product, financial years.

Clustered Column Ppt PowerPoint Presentation File Designs Download
This is a clustered column ppt powerpoint presentation file designs download. This is a six stage process. The stages in this process are dollars in thousands, financial year, product.

Area Chart Ppt PowerPoint Presentation Professional Designs
This is a area chart ppt powerpoint presentation professional designs. This is a two stage process. The stages in this process are in percentage, product, in years, strategy, business, marketing.

Line Chart Ppt PowerPoint Presentation Layouts Professional
This is a line chart ppt powerpoint presentation layouts professional. This is a two stage process. The stages in this process are in percentage, product, in years, strategy, marketing, business.

Bar Graph Template 1 Ppt PowerPoint Presentation Slides Format Ideas
This is a bar graph template 1 ppt powerpoint presentation slides format ideas. This is a three stage process. The stages in this process are product, years, bar graph, business, marketing.

Column Chart Ppt PowerPoint Presentation Summary Graphics
This is a column chart ppt powerpoint presentation summary graphics. This is a nine stage process. The stages in this process are product, years, expenditure in billions, graph, business.

Line Chart Ppt PowerPoint Presentation Portfolio Design Templates
This is a line chart ppt powerpoint presentation portfolio design templates. This is a two stage process. The stages in this process are in percentage, in years, percentage, business, graph.

Combo Chart Ppt PowerPoint Presentation Outline Graphics Tutorials
This is a combo chart ppt powerpoint presentation outline graphics tutorials. This is a three stage process. The stages in this process are units sold, years, business, marketing, graph.
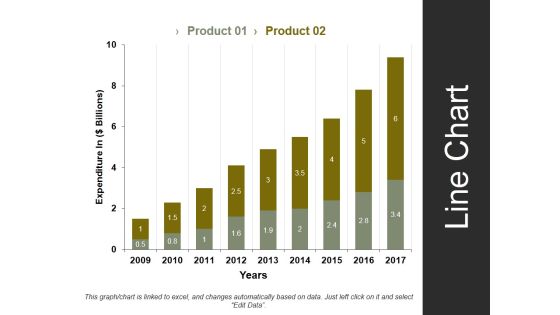
Line Chart Template 1 Ppt PowerPoint Presentation Styles Summary
This is a line chart template 1 ppt powerpoint presentation styles summary. This is a two stage process. The stages in this process are expenditure in, years, business, marketing, strategy.
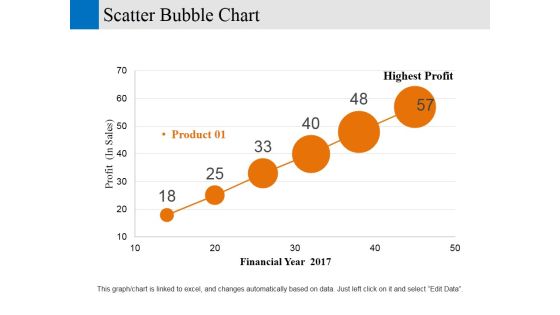
Scatter Bubble Chart Ppt PowerPoint Presentation Gallery Designs Download
This is a scatter bubble chart ppt powerpoint presentation gallery designs download. This is a six stage process. The stages in this process are financial year, profit, business, marketing, strategy.
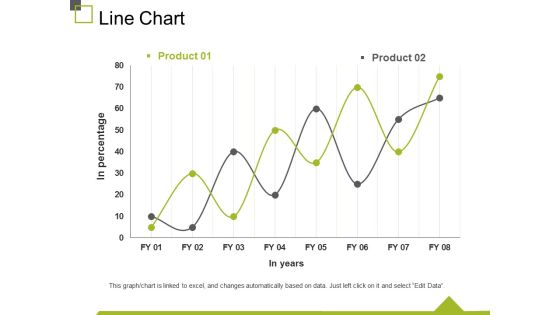
Line Chart Ppt PowerPoint Presentation Infographics Display
This is a line chart ppt powerpoint presentation infographics display. This is a two stage process. The stages in this process are in percentage, in years, chart, business, marketing.

Comparative Financial Business Objective Accomplishment List Ppt PowerPoint Presentation Gallery Slides PDF
The following slide highlights the list of achievement to compare financial business objective realization for current and previous year. While objectives for achievement are growth in revenue, growth in earning, increase in profit margin, improved cash flow and return on investment. Presenting comparative financial business objective accomplishment list ppt powerpoint presentation gallery slides pdf to dispense important information. This template comprises three stages. It also presents valuable insights into the topics including objective, previous year achievement, current year achievement. This is a completely customizable PowerPoint theme that can be put to use immediately. So, download it and address the topic impactfully.
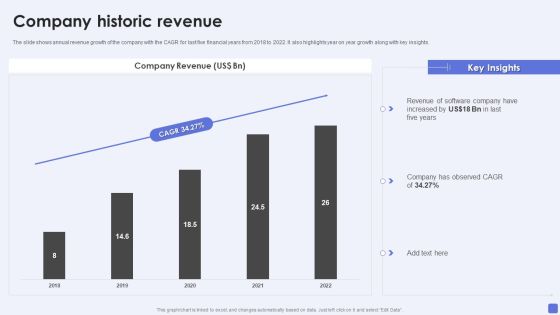
Software Services Business Profile Company Historic Revenue Ppt PowerPoint Presentation Gallery Graphics Download PDF
The slide shows annual revenue growth of the company with the CAGR for last five financial years from 2018 to 2022. It also highlights year on year growth along with key insights. Deliver and pitch your topic in the best possible manner with this Software Services Business Profile Company Historic Revenue Ppt PowerPoint Presentation Gallery Graphics Download PDF. Use them to share invaluable insights on Company Revenue, Observed CAGR, 2018 To 2022 and impress your audience. This template can be altered and modified as per your expectations. So, grab it now.
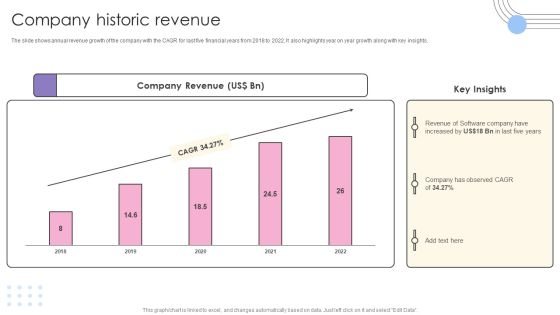
Software Products And Solutions Firm Details Company Historic Revenue Portrait PDF
The slide shows annual revenue growth of the company with the CAGR for last five financial years from 2018 to 2022. It also highlights year on year growth along with key insights. Deliver and pitch your topic in the best possible manner with this Software Products And Solutions Firm Details Company Historic Revenue Portrait PDF. Use them to share invaluable insights on Company Revenue, Observed CAGR, 2018 To 2022 and impress your audience. This template can be altered and modified as per your expectations. So, grab it now.

Business Software Development Company Profile Company Historic Revenue Graphics PDF
The slide shows annual revenue growth of the company with the CAGR for last five financial years from 2018 to 2022. It also highlights year on year growth along with key insights. Deliver and pitch your topic in the best possible manner with this Business Software Development Company Profile Company Historic Revenue Graphics PDF. Use them to share invaluable insights on Company Revenue, Observed CAGR, 2018 To 2022 and impress your audience. This template can be altered and modified as per your expectations. So, grab it now.
IT Application Services Company Outline Company Revenue Icons PDF
The slide shows annual revenue growth of the company with the CAGR for last five financial years from 2018 to 2022. It also highlights year on year growth along with key insights. Deliver and pitch your topic in the best possible manner with this IT Application Services Company Outline Company Revenue Icons PDF. Use them to share invaluable insights on Gross Profit Margin, Revenue, Business and impress your audience. This template can be altered and modified as per your expectations. So, grab it now.

IT Firm Financial Statement Company Revenue Demonstration PDF
The slide shows annual revenue growth of the company with the CAGR for last five financial years from 2019 to 2023. It also highlights year on year growth along with key insights. Find a pre designed and impeccable IT Firm Financial Statement Company Revenue Demonstration PDF. The templates can ace your presentation without additional effort. You can download these easy to edit presentation templates to make your presentation stand out from others. So, what are you waiting for Download the template from Slidegeeks today and give a unique touch to your presentation.
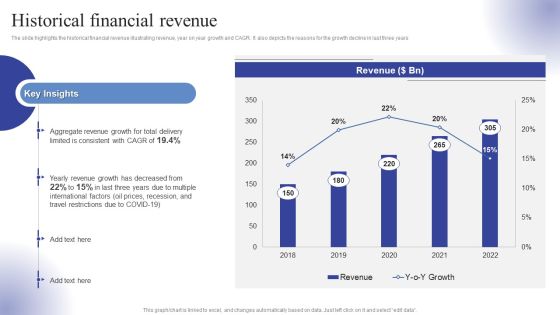
Logistics Transport Company Financial Report Historical Financial Revenue Ppt Outline Slides PDF
The slide highlights the historical financial revenue illustrating revenue, year on year growth and CAGR. It also depicts the reasons for the growth decline in last three years. Present like a pro with Logistics Transport Company Financial Report Historical Financial Revenue Ppt Outline Slides PDF Create beautiful presentations together with your team, using our easy-to-use presentation slides. Share your ideas in real-time and make changes on the fly by downloading our templates. So whether you are in the office, on the go, or in a remote location, you can stay in sync with your team and present your ideas with confidence. With Slidegeeks presentation got a whole lot easier. Grab these presentations today.

Basic Strategies For Tax Planning Ppt PowerPoint Presentation Deck
This is a basic strategies for tax planning ppt powerpoint presentation deck. This is a six stage process. The stages in this process are provide last years tax return, analyze situation and project tax saving, deliver contact outlining fees, gather additional information, research and analysis, implement tax saving strategies.
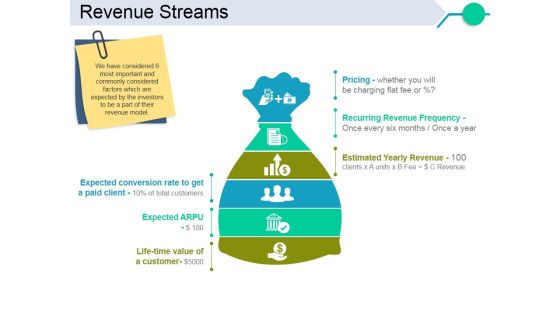
Revenue Streams Template 1 Ppt PowerPoint Presentation Inspiration Skills
This is a revenue streams template 1 ppt powerpoint presentation inspiration skills. This is a six stage process. The stages in this process are expected conversion rate to get a paid client, expected arpu, life time value of a customer, pricing, recurring revenue frequency, estimated yearly revenue.
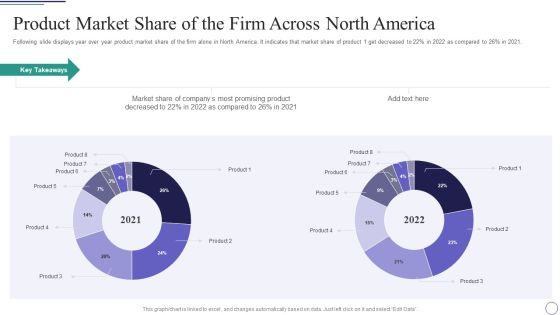
Successful Brand Development Plan Product Market Share Of The Firm Across North America Background PDF
Following slide displays year over year product market share of the firm alone in North America. It indicates that market share of product 1 get decreased to 22persent in 2022 as compared to 26persent in 2021.Deliver an awe inspiring pitch with this creative successful brand development plan product market share of the firm across north america background pdf bundle. Topics like product market share of the firm across north america can be discussed with this completely editable template. It is available for immediate download depending on the needs and requirements of the user.
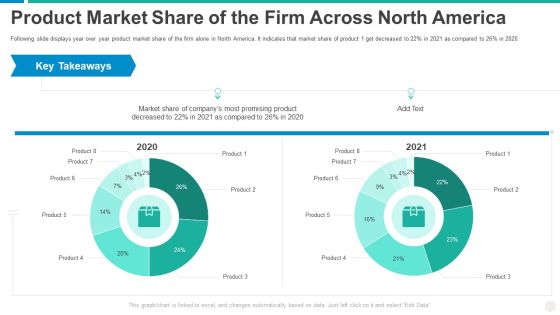
Establishing Successful Brand Strategy To Captivate Consumers Product Market Share Of The Firm Across North America Topics PDF
Following slide displays year over year product market share of the firm alone in North America. It indicates that market share of product 1 get decreased to 22 percent in 2021 as compared to 26 percent in 2020. Deliver an awe inspiring pitch with this creative establishing successful brand strategy to captivate consumers product market share of the firm across north america topics pdf bundle. Topics like product market share of the firm across north america can be discussed with this completely editable template. It is available for immediate download depending on the needs and requirements of the user.

Byjus Investor Capital Financing Pitch Deck Awards Earned By Byjus Structure PDF
This slide provides information about the awards that are acquired by Byjus over past few years and in the current year 2021.This is a Byjus Investor Capital Financing Pitch Deck Awards Earned By Byjus Structure PDF template with various stages. Focus and dispense information on six stages using this creative set, that comes with editable features. It contains large content boxes to add your information on topics like Forbes Entrepreneur, Bloomberg Businessweeks, Emerging Markets You can also showcase facts, figures, and other relevant content using this PPT layout. Grab it now.

Decoding Netflix Strategies Drives OTT Market Dominance Timeline Showcasing Netflix History Themes PDF
This slide showcases timeline that highlights history, progress and achievements of Netflix company over the years. It highlights timeline from year 1997 to 2021 and shows information about Netflix content, service offerings, new launches etc. From laying roadmaps to briefing everything in detail, our templates are perfect for you. You can set the stage with your presentation slides. All you have to do is download these easy to edit and customizable templates. Decoding Netflix Strategies Drives OTT Market Dominance Timeline Showcasing Netflix History Themes PDF will help you deliver an outstanding performance that everyone would remember and praise you for. Do download this presentation today.

Competitive Analysis Template 1 Ppt PowerPoint Presentation Clipart
This is a competitive analysis template 1 ppt powerpoint presentation clipart. This is a five stage process. The stages in this process are competitive factor, years of existence, location, products or service, business reputation.

Combo Chart Ppt PowerPoint Presentation Design Ideas
This is a combo chart ppt powerpoint presentation design ideas. This is a eight stage process. The stages in this process are market size, combo chart, in years, product, growth rate.

Network Marketing Company Profile Netsurf Turnover 2002 2022 Rules PDF
This slide represents the Netsurf turnover from last 20 years from 2002 to 2022 which shows increasing trend year after year. It also showcases compound annual growth rate From laying roadmaps to briefing everything in detail, our templates are perfect for you. You can set the stage with your presentation slides. All you have to do is download these easy to edit and customizable templates. Network Marketing Company Profile Netsurf Turnover 2002 2022 Rules PDF will help you deliver an outstanding performance that everyone would remember and praise you for. Do download this presentation today.
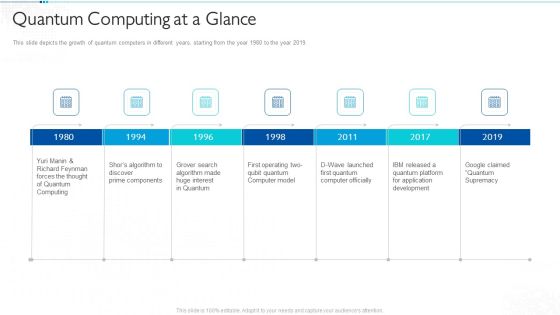
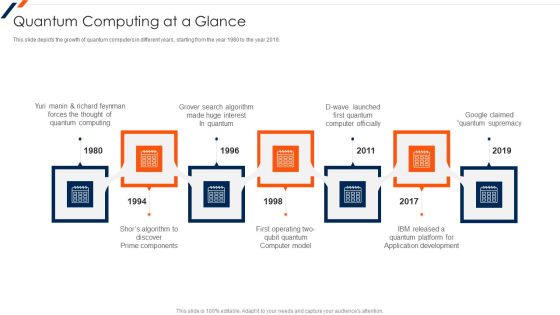
Quantum Computing For Everyone IT Quantum Computing At A Glance Pictures PDF
This slide depicts the growth of quantum computers in different years, starting from the year 1980 to the year 2019. Presenting quantum computing for everyone it quantum computing at a glance pictures pdf to provide visual cues and insights. Share and navigate important information on seven stages that need your due attention. This template can be used to pitch topics like quantum computing at a glance, 1980 to 2019. In addtion, this PPT design contains high resolution images, graphics, etc, that are easily editable and available for immediate download.
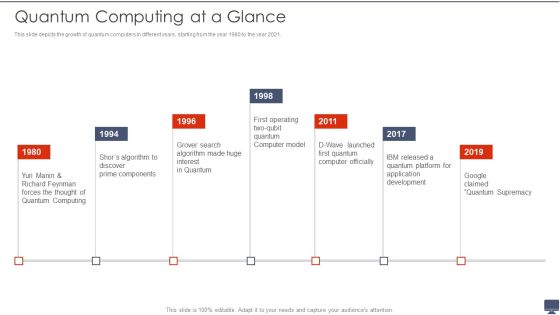
Quantum Computing At A Glance Ppt Infographic Template Graphics Example PDF
This slide depicts the growth of quantum computers in different years, starting from the year 1980 to the year 2019. Presenting Quantum Computing At A Glance Ppt Infographic Template Graphics Example PDF to provide visual cues and insights. Share and navigate important information on seven stages that need your due attention. This template can be used to pitch topics like Application Development, Computer Model. In addtion, this PPT design contains high resolution images, graphics, etc, that are easily editable and available for immediate download.
Quantum Computing At A Glance Ppt Show Example File PDF
This slide depicts the growth of quantum computers in different years, starting from the year 1980 to the year 2021.This is a Quantum Computing At A Glance Ppt Show Example File PDF template with various stages. Focus and dispense information on seven stages using this creative set, that comes with editable features. It contains large content boxes to add your information on topics like Quantum Computing, Application Development, Prime Components. You can also showcase facts, figures, and other relevant content using this PPT layout. Grab it now.
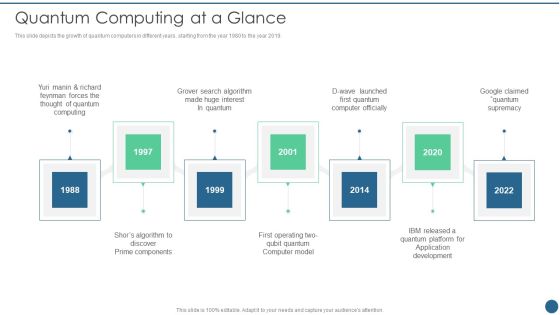
Quantum Key Distribution Quantum Computing At A Glance Background PDF
This slide depicts the growth of quantum computers in different years, starting from the year 1980 to the year 2019.Presenting Quantum Key Distribution Quantum Computing At A Glance Background PDF to provide visual cues and insights. Share and navigate important information on seven stages that need your due attention. This template can be used to pitch topics like Thought Of Quantum, Search Algorithm, Computer Officially In addtion, this PPT design contains high resolution images, graphics, etc, that are easily editable and available for immediate download.
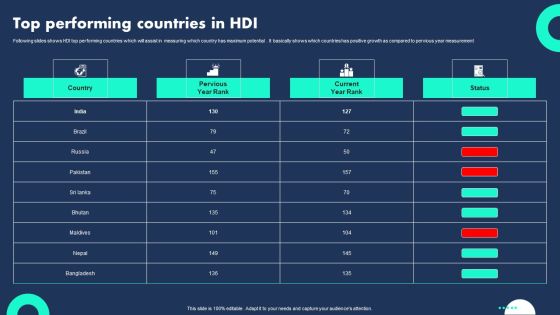
Top Performing Countries In HDI Guidelines PDF
Following slides shows HDI top performing countries which will assist in measuring which country has maximum potential . It basically shows which countries has positive growth as compared to pervious year measurement. Showcasing this set of slides titled Top Performing Countries In HDI Guidelines PDF. The topics addressed in these templates are Country, Pervious Year Rank, Current Year Rank . All the content presented in this PPT design is completely editable. Download it and make adjustments in color, background, font etc. as per your unique business setting.

Data Automation Solution Investor Funding Presentation Financial Projection Structure PDF
This slide demonstrates anticipated business revenue growth for next 4 years. It includes revenue in USdoller MM and year of growth along with growth percentage. Present like a pro with Data Automation Solution Investor Funding Presentation Financial Projection Structure PDF Create beautiful presentations together with your team, using our easy to use presentation slides. Share your ideas in real time and make changes on the fly by downloading our templates. So whether you are in the office, on the go, or in a remote location, you can stay in sync with your team and present your ideas with confidence. With Slidegeeks presentation got a whole lot easier. Grab these presentations today.
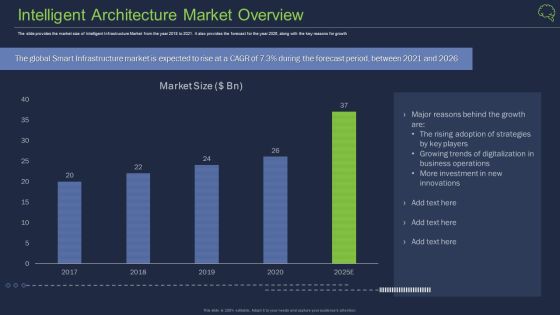
Intelligent Architecture Market Overview Ppt Slides Display PDF
The slide provides the market size of Intelligent Infrastructure Market from the year 2018 to 2021. It also provides the forecast for the year 2026, along with the key reasons for growth Deliver an awe inspiring pitch with this creative intelligent architecture market overview ppt slides display pdf bundle. Topics like investment, digitalization, business operations can be discussed with this completely editable template. It is available for immediate download depending on the needs and requirements of the user.

Global Market Share Of Cdn Ppt Show Gallery PDF
This slide depicts the global market share of CDN in the year 2020 and forecasts growth of the upcoming year 2027 in various sectors. Deliver and pitch your topic in the best possible manner with this global market share of cdn ppt show gallery pdf. Use them to share invaluable insights on global market share of cdn and impress your audience. This template can be altered and modified as per your expectations. So, grab it now.

Executive Summary Market Overview Ppt PowerPoint Presentation Background Designs
This is a executive summary market overview ppt powerpoint presentation background designs. This is a ten stage process. The stages in this process are market stage, market revenue, base year market growth rate, compound annual growth rate, customer price sensitivity, degree of technical change, market concentration.
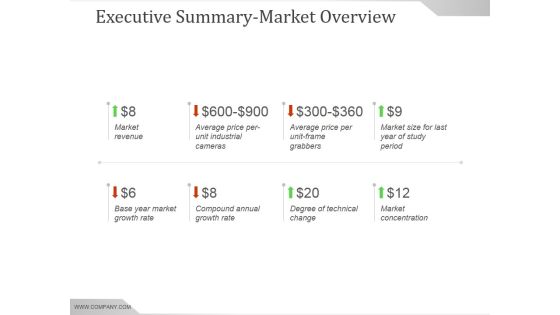
Executive Summarymarket Overview Ppt PowerPoint Presentation Background Images
This is a executive summarymarket overview ppt powerpoint presentation background images. This is a eight stage process. The stages in this process are market revenue, base year market growth rate, compound annual growth rate, average price per-unit, industrial cameras, degree of technical change, market concentration.
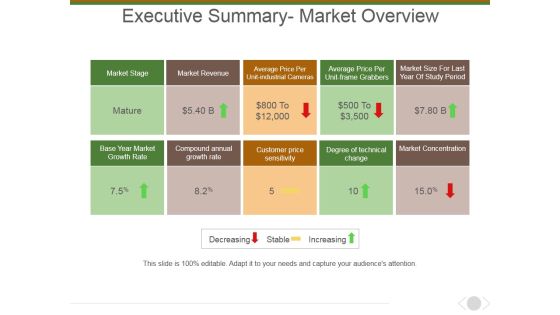
Executive Summary Market Overview Ppt PowerPoint Presentation Model Professional
This is a executive summary market overview ppt powerpoint presentation model professional. This is a ten stage process. The stages in this process are market stage, base year market growth rate, compound annual growth rate, customer price sensitivity, degree of technical change.

Area Ppt PowerPoint Presentation Show
This is a area ppt powerpoint presentation show. This is a two stage process. The stages in this process are area, bar graph, growth, years, business.

Area Chart Ppt PowerPoint Presentation Samples
This is a area chart ppt powerpoint presentation samples. This is a two stage process. The stages in this process are financial year, sales in percentage, jan, feb.

Bar Graph Ppt PowerPoint Presentation Portfolio Background
This is a bar graph ppt powerpoint presentation portfolio background. This is a four stage process. The stages in this process are sale, years, product.

Big Data Market Forecast Ppt PowerPoint Presentation Clipart
This is a big data market forecast ppt powerpoint presentation clipart. This is a five stage process. The stages in this process are business, marketing, management, planning, years.
