AI PPT Maker
Templates
PPT Bundles
Design Services
Business PPTs
Business Plan
Management
Strategy
Introduction PPT
Roadmap
Self Introduction
Timelines
Process
Marketing
Agenda
Technology
Medical
Startup Business Plan
Cyber Security
Dashboards
SWOT
Proposals
Education
Pitch Deck
Digital Marketing
KPIs
Project Management
Product Management
Artificial Intelligence
Target Market
Communication
Supply Chain
Google Slides
Research Services
 One Pagers
All Categories
-
Home
- Customer Favorites
- Year Over Year Growth
Year Over Year Growth

Combo Chart Ppt PowerPoint Presentation Deck
This is a combo chart ppt powerpoint presentation deck. This is a eight stage process. The stages in this process are in price, in years, product.

Line Chart Ppt PowerPoint Presentation Ideas Portfolio
This is a line chart ppt powerpoint presentation ideas portfolio. This is a two stage process. The stages in this process are line chart, in years, in percentage.
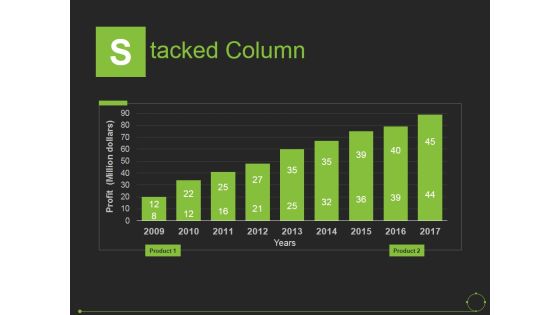
Stacked Column Ppt PowerPoint Presentation Slides Introduction
This is a stacked column ppt powerpoint presentation slides introduction. This is a nine stage process. The stages in this process are years, profit, product, business, marketing.

Column Chart Ppt PowerPoint Presentation Ideas Styles
This is a column chart ppt powerpoint presentation ideas styles. This is a two stage process. The stages in this process are dollars, product, planning, business, years.

Column Chart Ppt PowerPoint Presentation Ideas Guidelines
This is a column chart ppt powerpoint presentation ideas guidelines. This is a two stage process. The stages in this process are column chart, product, year, business, marketing.

Line Chart Ppt PowerPoint Presentation Gallery Rules
This is a line chart ppt powerpoint presentation gallery rules. This is a two stage process. The stages in this process are financial years, product, sales in percentage, line chart, growth.

Line Bubble Chart Ppt PowerPoint Presentation Portfolio Slide Portrait
This is a line bubble chart ppt powerpoint presentation portfolio slide portrait. This is a six stage process. The stages in this process are highest profit, financial year, profit in sales, growth, business.
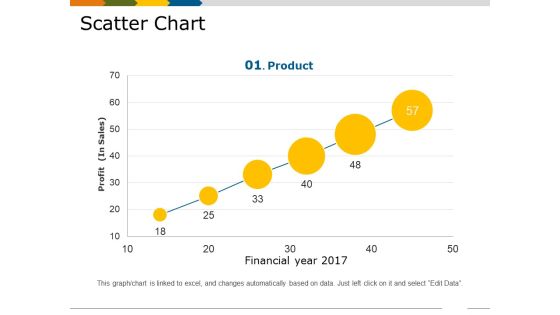
Scatter Chart Template 1 Ppt PowerPoint Presentation Show Slides
This is a scatter chart template 1 ppt powerpoint presentation show slides. This is a six stage process. The stages in this process are financial year, profit in sales, growth, business, marketing, product.

Clustered Column Line Ppt PowerPoint Presentation Model Rules
This is a clustered column line ppt powerpoint presentation model rules. This is a four stage process. The stages in this process are financial year, sales in percentage, business, marketing, growth, graph.

Crm Dashboard Deals By Expected Close Date Ppt PowerPoint Presentation Icon
This is a crm dashboard deals by expected close date ppt powerpoint presentation icon. This is a three stage process. The stages in this process are deals by expected close date, years, planning, business, growth.

Big Data Market Forecast Ppt PowerPoint Presentation Ideas Information
This is a big data market forecast ppt powerpoint presentation ideas information. This is a five stage process. The stages in this process are years, planning, growth, business, marketing.
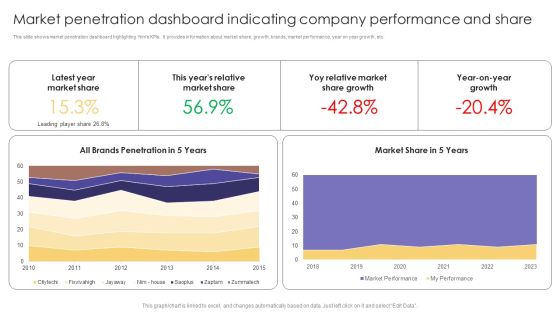
Market Penetration Dashboard Indicating Company Performance And Share Formats PDF
This slide shows market penetration dashboard highlighting firms KPIs. It provides information about market share, growth, brands, market performance, year on year growth, etc. Showcasing this set of slides titled Market Penetration Dashboard Indicating Company Performance And Share Formats PDF. The topics addressed in these templates are Latest Year, Market Share, Market Share Growth. All the content presented in this PPT design is completely editable. Download it and make adjustments in color, background, font etc. as per your unique business setting.

Clustered Column Line Ppt PowerPoint Presentation Infographic Template Deck
This is a clustered column line ppt powerpoint presentation infographic template deck. This is a three stage process. The stages in this process are business, strategy, analysis, planning, sales in percentage, financial year.
Financial Projection Graph Template 1 Ppt PowerPoint Presentation Icon Summary
This is a financial projection graph template 1 ppt powerpoint presentation icon summary. This is a three stage process. The stages in this process are annual sales forecast, years, business, marketing, management.

Area Chart Ppt PowerPoint Presentation Icon Layout Ideas
This is a area chart ppt powerpoint presentation icon layout ideas. This is a two stage process. The stages in this process are area chart, sales in percentage, years, planning, business.

Column Chart Ppt PowerPoint Presentation Gallery Design Inspiration
This is a column chart ppt powerpoint presentation gallery design inspiration. This is a two stage process. The stages in this process are column chart, product, sales in percentage, financial years.

Area Chart Financial Ppt PowerPoint Presentation Outline Professional
This is a area chart financial ppt powerpoint presentation outline professional. This is a four stage process. The stages in this process are product, sales in percentage, financial year.

Bar Chart Template 1 Ppt PowerPoint Presentation Background Images
This is a bar chart template 1 ppt powerpoint presentation background images. This is a twelve stage process. The stages in this process are product, bar chart, dollars, year.

Bar Graph Template 2 Ppt PowerPoint Presentation Introduction
This is a bar graph template 2 ppt powerpoint presentation introduction. This is a four stage process. The stages in this process are bar graph, presentation, year, planning, marketing.

Combo Chart Ppt PowerPoint Presentation Gallery Visual Aids
This is a combo chart ppt powerpoint presentation gallery visual aids. This is a three stage process. The stages in this process are combo chart, in years, market size, product.
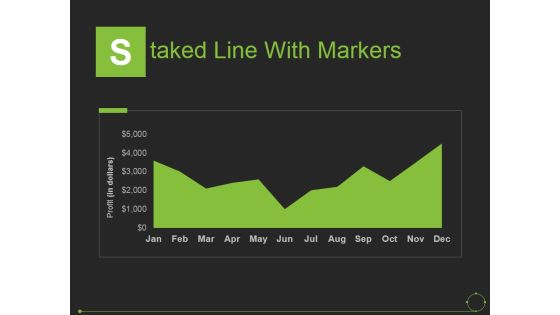
Staked Line With Markers Ppt PowerPoint Presentation Pictures Examples
This is a staked line with markers ppt powerpoint presentation pictures examples. This is a one stage process. The stages in this process are years, profit, product, business, marketing.

Bar Graph Ppt PowerPoint Presentation Model Graphic Tips
This is a bar graph ppt powerpoint presentation model graphic tips. This is a two stage process. The stages in this process are we are dollars in millions, financials years, bar graph, product, business.

Combo Chart Ppt PowerPoint Presentation Summary Design Templates
This is a combo chart ppt powerpoint presentation summary design templates. This is a four stage process. The stages in this process are units sold, product, combo chart, years, planning.

Combo Chart Ppt PowerPoint Presentation Infographics Summary
This is a combo chart ppt powerpoint presentation infographics summary. This is a three stage process. The stages in this process are market size, product, combo chart, years, business.

Forecast Accuracy Template 2 Ppt PowerPoint Presentation Pictures Grid
This is a forecast accuracy template 2 ppt powerpoint presentation pictures grid. This is a one stage process. The stages in this process are forecast accuracy, business, marketing, planning, years.
Dividend Per Share Ppt PowerPoint Presentation Icon Design Templates
This is a dividend per share ppt powerpoint presentation icon design templates. This is a five stage process. The stages in this process are business, years, planning, management, marketing.

Training Hours Per Employee Ppt PowerPoint Presentation Professional Templates
This is a training hours per employee ppt powerpoint presentation professional templates. This is a four stage process. The stages in this process are training hours, years, planning, business, marketing.
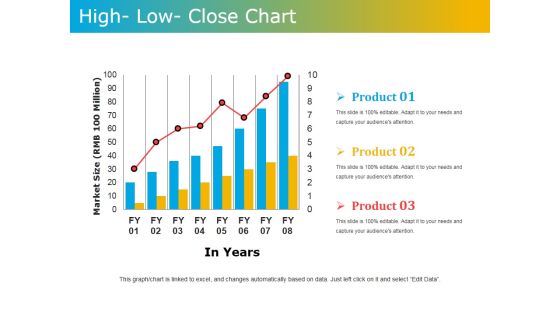
High Low Close Chart Ppt PowerPoint Presentation Model Graphics Tutorials
This is a high low close chart ppt powerpoint presentation model graphics tutorials. This is a three stage process. The stages in this process are market size, in years, product.
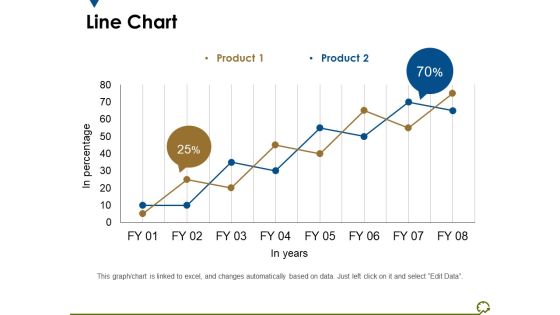
Line Chart Ppt PowerPoint Presentation Outline Diagrams
This is a line chart ppt powerpoint presentation outline diagrams. This is a two stage process. The stages in this process are in percentage, in years, percentage, business, marketing.
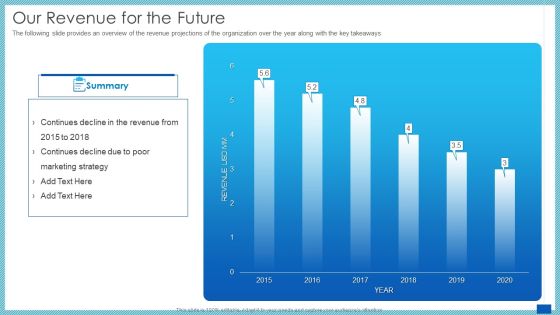
Evaluation Evolving Advanced Enterprise Development Marketing Tactics Our Revenue For The Future Download PDF
The following slide provides an overview of the revenue projections of the organization over the year along with the key takeaways. Deliver an awe inspiring pitch with this creative evaluation evolving advanced enterprise development marketing tactics our revenue for the future download pdf bundle. Topics like marketing strategy, revenue, our revenue for the future can be discussed with this completely editable template. It is available for immediate download depending on the needs and requirements of the user.
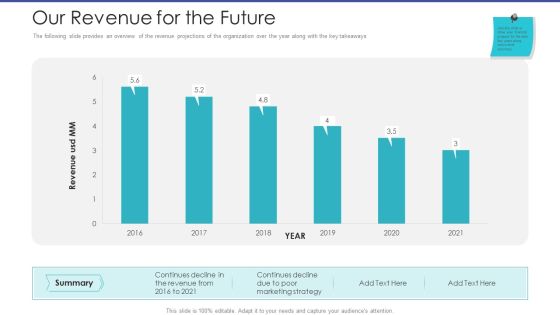
Tactical Planning For Marketing And Commercial Advancement Our Revenue For The Future Themes PDF
The following slide provides an overview of the revenue projections of the organization over the year along with the key takeaways. Deliver an awe inspiring pitch with this creative tactical planning for marketing and commercial advancement our revenue for the future themes pdf bundle. Topics like marketing, strategy, revenue, continues can be discussed with this completely editable template. It is available for immediate download depending on the needs and requirements of the user.
Our Company Achievements With Details Ppt Icon Graphics PDF
This slide shows some business achievements over a period such as Market Leadership Award, Increase in Global Sales, Logistics provider of the Year Award etc. Deliver and pitch your topic in the best possible manner with this our company achievements with details ppt icon graphics pdf. Use them to share invaluable insights on market leadership, market share, global sales and impress your audience. This template can be altered and modified as per your expectations. So, grab it now.

Insurance Services Firm Profile Historical Revenue Information PDF
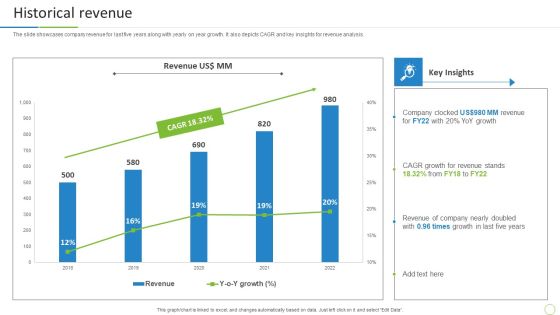
The slide showcases company revenue for last five years along with yearly on year growth. It also depicts CAGR and key insights for revenue analysis. Deliver an awe inspiring pitch with this creative Insurance Services Firm Profile Historical Revenue Information PDF bundle. Topics like Growth, Revenue can be discussed with this completely editable template. It is available for immediate download depending on the needs and requirements of the user.
Property And Casualties Insurance Business Profile Historical Revenue Mockup PDF
The slide showcases company revenue for last five years along with yearly on year growth. It also depicts CAGR and key insights for revenue analysis. Deliver and pitch your topic in the best possible manner with this Property And Casualties Insurance Business Profile Historical Revenue Mockup PDF. Use them to share invaluable insights on Growth, Revenue Stands and impress your audience. This template can be altered and modified as per your expectations. So, grab it now.
Historical Revenue Health And Property Insurance Company Profile Microsoft PDF
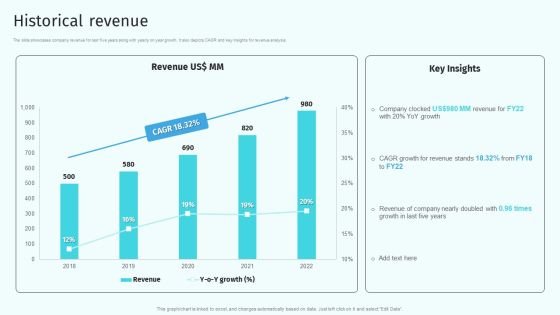
The slide showcases company revenue for last five years along with yearly on year growth. It also depicts CAGR and key insights for revenue analysis. Deliver an awe inspiring pitch with this creative Historical Revenue Health And Property Insurance Company Profile Microsoft PDF bundle. Topics like Historical, Revenue, Company can be discussed with this completely editable template. It is available for immediate download depending on the needs and requirements of the user.

Data Expansion Trends For Global Home Ware Market Icons PDF
This slide shows data growth trends for home ware industry that presents incremental growth, CAGR and other figures etc. It include figure next year growth and incremental growth etc. Pitch your topic with ease and precision using this Data Expansion Trends For Global Home Ware Market Icons PDF. This layout presents information on Incremental Growth Figures, Growth Rate Predicted, Fragmented Market Model. It is also available for immediate download and adjustment. So, changes can be made in the color, design, graphics or any other component to create a unique layout.

Bar Graph For Future Planning Powerpoint Template
This business diagram display bar graph for years 2015 and 2016. You may use this slide to display statistical analysis. This diagram provides an effective way of displaying information you can edit text, color, shade and style as per you need.

Revenue Streams Template 2 Ppt PowerPoint Presentation File Graphic Images
This is a revenue streams template 2 ppt powerpoint presentation file graphic images. This is a six stage process. The stages in this process are pricing, estimated yearly revenue, expected arpu, recurring revenue frequency, expected conversion rate to get a paid client, life time value of a customer.
Financial Solutions Company Profile Net Profit And Margin Professional PDF
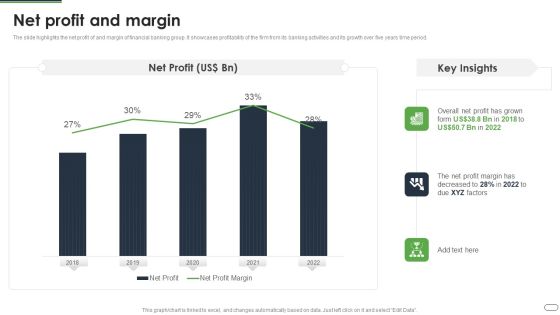
The slide highlights the net profit of and margin of financial banking group. It showcases profitability of the firm from its banking activities and its growth over five years time period.Deliver an awe inspiring pitch with this creative Financial Solutions Company Profile Net Profit And Margin Professional PDF bundle. Topics like Net Profit, Margin can be discussed with this completely editable template. It is available for immediate download depending on the needs and requirements of the user.

Commercial Bank Financial Services Company Profile Net Profit And Margin Summary PDF
The slide highlights the net profit of and margin of financial banking group. It showcases profitability of the firm from its banking activities and its growth over five years time period. Deliver an awe inspiring pitch with this creative Commercial Bank Financial Services Company Profile Net Profit And Margin Summary PDF bundle. Topics like Net Profit, Margin can be discussed with this completely editable template. It is available for immediate download depending on the needs and requirements of the user.

Data Center Infrastructure Management IT Overview Of Data Center Sample PDF
This slide represents the history and continuous growth of the company by displaying the achievements from the year 2008 to the present year 2021. This is a data center infrastructure management it overview of data center sample pdf template with various stages. Focus and dispense information on four stages using this creative set, that comes with editable features. It contains large content boxes to add your information on topics like sustained, growth, services, cost, effective. You can also showcase facts, figures, and other relevant content using this PPT layout. Grab it now.
Website Designing And Development Service Who Are We For Web Development Company Slides PDF
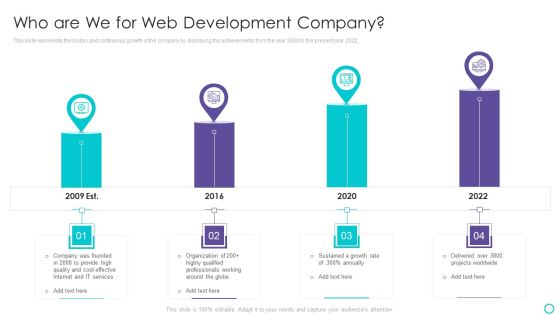
This slide represents the history and continuous growth of the company by displaying the achievements from the year 2009 to the present year 2022.Presenting Website Designing And Development Service Who Are We For Web Development Company Slides PDF to provide visual cues and insights. Share and navigate important information on four stages that need your due attention. This template can be used to pitch topics like Internet And IT Services, Professionals Working Around, Sustained A Growth In addtion, this PPT design contains high resolution images, graphics, etc, that are easily editable and available for immediate download.

Overview Of The Cloud Storage Company Ppt Summary Gridlines PDF
This slide represents the history and continuous growth of the company by displaying the achievements from the year 2007 to the present year 2021. Presenting overview of the cloud storage company ppt summary gridlines pdf to provide visual cues and insights. Share and navigate important information on four stages that need your due attention. This template can be used to pitch topics like organization, services, growth, internet, cost. In addtion, this PPT design contains high resolution images, graphics, etc, that are easily editable and available for immediate download.

Website Programming IT Who Are We For Website Programming Company Summary PDF
This slide represents the history and continuous growth of the company by displaying the achievements from the year 2008 to the present year 2021. This is a website programming it who are we for website programming company summary pdf template with various stages. Focus and dispense information on four stages using this creative set, that comes with editable features. It contains large content boxes to add your information on topics like provide high quality, cost effective internet, it services, growth rate, 2008 to 2021. You can also showcase facts, figures, and other relevant content using this PPT layout. Grab it now.
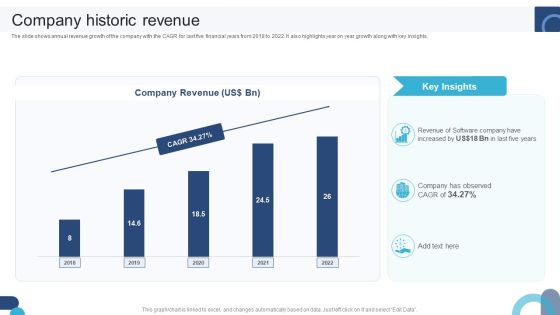
Digital Application Software Development Business Profile Company Historic Revenue Download PDF
The slide shows annual revenue growth of the company with the CAGR for last five financial years from 2018 to 2022. It also highlights year on year growth along with key insights. Do you have to make sure that everyone on your team knows about any specific topic I yes, then you should give Digital Application Software Development Business Profile Company Historic Revenue Download PDF a try. Our experts have put a lot of knowledge and effort into creating this impeccable Digital Application Software Development Business Profile Company Historic Revenue Download PDF. You can use this template for your upcoming presentations, as the slides are perfect to represent even the tiniest detail. You can download these templates from the Slidegeeks website and these are easy to edit. So grab these today.

Company Historic Revenue Financial Performance Report Of Software Firm Designs PDF
The slide shows annual revenue growth of the company with the CAGR for last five financial years from 2019 to 2023. It also highlights year on year growth along with key insights. Do you have to make sure that everyone on your team knows about any specific topic I yes, then you should give Company Historic Revenue Financial Performance Report Of Software Firm Designs PDF a try. Our experts have put a lot of knowledge and effort into creating this impeccable Company Historic Revenue Financial Performance Report Of Software Firm Designs PDF. You can use this template for your upcoming presentations, as the slides are perfect to represent even the tiniest detail. You can download these templates from the Slidegeeks website and these are easy to edit. So grab these today.

Digital Products Company Outline Company Historic Revenue Graphics PDF
The slide shows annual revenue growth of the company with the CAGR for last five financial years from 2018 to 2022. It also highlights year on year growth along with key insights. Presenting this PowerPoint presentation, titled Digital Products Company Outline Company Historic Revenue Graphics PDF, with topics curated by our researchers after extensive research. This editable presentation is available for immediate download and provides attractive features when used. Download now and captivate your audience. Presenting this Digital Products Company Outline Company Historic Revenue Graphics PDF. Our researchers have carefully researched and created these slides with all aspects taken into consideration. This is a completely customizable Digital Products Company Outline Company Historic Revenue Graphics PDF that is available for immediate downloading. Download now and make an impact on your audience. Highlight the attractive features available with our PPTs.

Problems And Leading Factors For Global Financial Market Ppt PowerPoint Presentation Professional Diagrams PDF
Pitch your topic with ease and precision using this problems and leading factors for global financial market ppt powerpoint presentation professional diagrams pdf. This layout presents information on incremental growth, challenge highly fragmented market, yoy growth for year 2020, key drivers. It is also available for immediate download and adjustment. So, changes can be made in the color, design, graphics or any other component to create a unique layout.

Interpreting Market Kinetics Influence Customer Purchasing Global Technology Market Clipart PDF
Following slide displays the growth projections of global technology market. It shows that the tech market is estimated to from 4 to 5.5 percent in the year 2021. Deliver an awe inspiring pitch with this creative interpreting market kinetics influence customer purchasing global technology market clipart pdf bundle. Topics like global technology market growth projections can be discussed with this completely editable template. It is available for immediate download depending on the needs and requirements of the user.
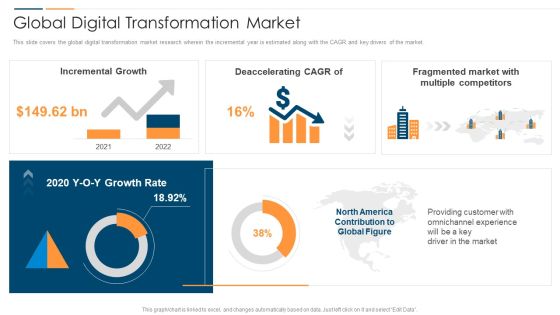
Revolution In Online Business Global Digital Transformation Market Structure PDF
This slide covers the global digital transformation market research wherein the incremental year is estimated along with the CAGR and key drivers of the market. Deliver an awe inspiring pitch with this creative Revolution In Online Business Global Digital Transformation Market Structure PDF bundle. Topics like Incremental Growth Rate, Deaccelerating CAGR Growth, Fragmented Market Multiple can be discussed with this completely editable template. It is available for immediate download depending on the needs and requirements of the user.

Headspace Fund Raising Pitch Deck The Headspace Timeline Topics PDF
The following slide displays the organization timeline as it highlights the total number of financing rounds, captured employee counts and the estimated employee growth from the year 2017 to 2021. Deliver an awe inspiring pitch with this creative Headspace Fund Raising Pitch Deck The Headspace Timeline Topics PDF bundle. Topics like Organization Increased, Estimated Growth, Employee Count can be discussed with this completely editable template. It is available for immediate download depending on the needs and requirements of the user.

Strategic M And A Deals Salesforce Business Profile Inspiration PDF
This slide highlights the strategic merger and acquisition deals of salesforce which include ExactTarget, Demandware, MuleSoft, and tableau with year acquired and growth rate. Deliver and pitch your topic in the best possible manner with this Strategic M And A Deals Salesforce Business Profile Inspiration PDF. Use them to share invaluable insights on Acquisition Amount, Growth At Acquisition, Current Revenue and impress your audience. This template can be altered and modified as per your expectations. So, grab it now.

Combo Chart Ppt PowerPoint Presentation Portfolio Infographics
This is a combo chart ppt powerpoint presentation portfolio infographics. This is a eight stage process. The stages in this process are market size, growth, years, finance, business.

Business Global Marketing PowerPoint Templates And PowerPoint Backgrounds 0611
Microsoft PowerPoint Template and Background with two businessmen in silhouette shaking hands in front of a graph showing yearly increasing growth and sales

Combo Chart Ppt PowerPoint Presentation Pictures Layouts
This is a combo chart ppt powerpoint presentation pictures layouts. This is a eight stage process. The stages in this process are product, growth rate, market size, years.

Footwear And Accessories Business Pitch Deck Who Are Our Key Partners Guidelines PDF
This slide shows the key partnership which makes the business model work. Our key partners includes manufacturing partners, top athletes, etc. Presenting footwear and accessories business pitch deck who are our key partners guidelines pdf to provide visual cues and insights. Share and navigate important information on three stages that need your due attention. This template can be used to pitch topics like year on year market growth in percentage. In addtion, this PPT design contains high resolution images, graphics, etc, that are easily editable and available for immediate download.
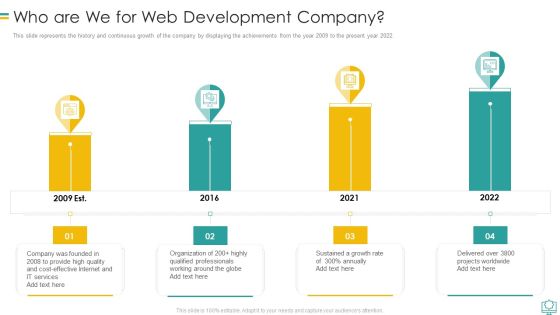
Who Are We For Web Development Company Diagrams PDF
This slide represents the history and continuous growth of the company by displaying the achievements from the year 2009 to the present year 2022.Presenting Who Are We For Web Development Company Diagrams PDF to provide visual cues and insights. Share and navigate important information on four stages that need your due attention. This template can be used to pitch topics like Qualified Professionals, Cost Effective Internet, Projects Worldwide In addtion, this PPT design contains high resolution images, graphics, etc, that are easily editable and available for immediate download.

Forecasting ROI Of Healthcare Company Summary PDF
The following slide outlines four year revenue projection of medical care organization. The statistical slide provides information about per year marketing cost, revenue, compound annual growth rate CAGR, and key takeaways. Take your projects to the next level with our ultimate collection of Forecasting ROI Of Healthcare Company Summary PDF. Slidegeeks has designed a range of layouts that are perfect for representing task or activity duration, keeping track of all your deadlines at a glance. Tailor these designs to your exact needs and give them a truly corporate look with your own brand colors they will make your projects stand out from the rest

Customer Retention With Email Advertising Campaign Plan New Customer Engagement Rate Analysis Portrait PDF
Mentioned slide showcases decreasing customer engagement rate over the year which provided overview of declining marketing team productivity. It includes key components such as yearly customer engagement rate, key reasons of declining engagement rate. Formulating a presentation can take up a lot of effort and time, so the content and message should always be the primary focus. The visuals of the PowerPoint can enhance the presenters message, so our Customer Retention With Email Advertising Campaign Plan New Customer Engagement Rate Analysis Portrait PDF was created to help save time. Instead of worrying about the design, the presenter can concentrate on the message while our designers work on creating the ideal templates for whatever situation is needed. Slidegeeks has experts for everything from amazing designs to valuable content, we have put everything into Customer Retention With Email Advertising Campaign Plan New Customer Engagement Rate Analysis Portrait PDF
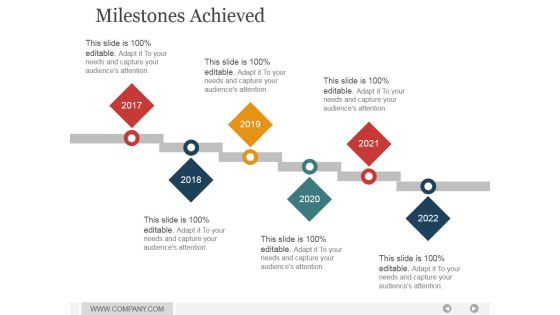
Milestones Achieved Ppt PowerPoint Presentation Ideas
This is a milestones achieved ppt powerpoint presentation ideas. This is a six stage process. The stages in this process are timeline, years, planning, management, success, business, growth strategy.

Combo Chart Ppt PowerPoint Presentation Inspiration Images
This is a combo chart ppt powerpoint presentation inspiration images. This is a three stage process. The stages in this process are market size, in years, growth rate, product.

Combo Chart Ppt PowerPoint Presentation Summary Ideas
This is a combo chart ppt powerpoint presentation summary ideas. This is a eight stage process. The stages in this process are market size, growth rate, product, in years.

Combo Chart Ppt PowerPoint Presentation Gallery Diagrams
This is a combo chart ppt powerpoint presentation gallery diagrams. This is a three stage process. The stages in this process are combo chart, market size, product, in years, growth rate.
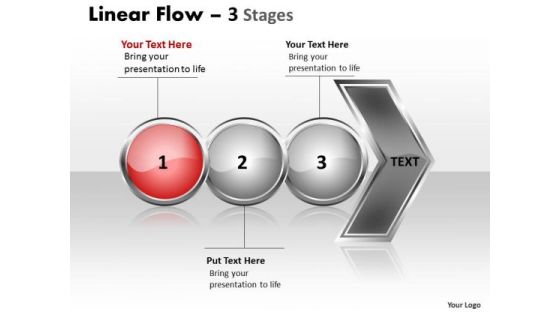
Sales Ppt Background Horizontal Flow Of 3 Stages Operations Management PowerPoint 2 Image
We present our sales PPT Background horizontal flow of 3 stages operations management PowerPoint 2 Image. Use our Spheres PowerPoint Templates because, Use this slide to detail and highlight your thought process, your views and your positive expectations. Use our Symbol PowerPoint Templates because, the plans are in your head, stage by stage, year by year. Use our Business PowerPoint Templates because, Visual appeal is a priority for us. Use our Arrows PowerPoint Templates because, Harness these opportunities, celebrate your performance till date and focus on greater growth and expansion in coming years. Use our Shapes PowerPoint Templates because, Many a core idea has various enveloping layers. Use these PowerPoint slides for presentations relating to Arrow, Background, Business, Chart, Diagram, Financial, Flow, Graphic, Gray, Icon, Illustration, Linear, Management, Orange, Perspective, Process, Reflection, Spheres, Stage, Text. The prominent colors used in the PowerPoint template are Red, Gray, and Black
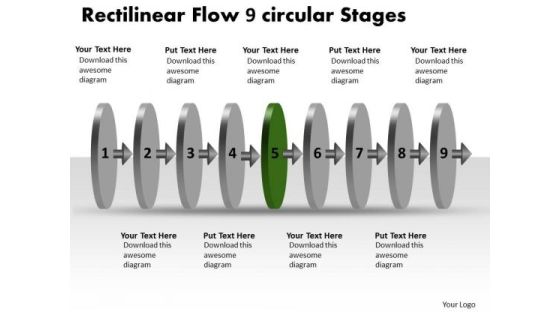
Rectilinear Flow 9 Circular Stages Charts PowerPoint Templates
We present our rectilinear flow 9 circular stages charts PowerPoint templates.Use our Circle Charts PowerPoint Templates because, The plans are in your head, stage by stage, year by year. Use our Arrows PowerPoint Templates because,They are the tools that helped most of us evolve. Use our Design PowerPoint Templates because, This diagram helps you to harness the opportunities, celebrate your performance till date and focus on greater growth and expansion in coming years. Use our Shapes PowerPoint Templates because, this slide can help to bullet point your views. Use our Process and Flows PowerPoint Templates because,Readymade PowerPoint templates can prove best of your knowledge for your slides to show.Use these PowerPoint slides for presentations relating to abstract, arrow, blank, business, chart, circular, circulation, concept, conceptual, design, diagram, executive, flow, icon, idea, illustration, linear, management, model, numbers, organization, procedure, process, progression, resource, sequence, sequential, stages, steps, strategy. The prominent colors used in the PowerPoint template are Blue, Gray, Black
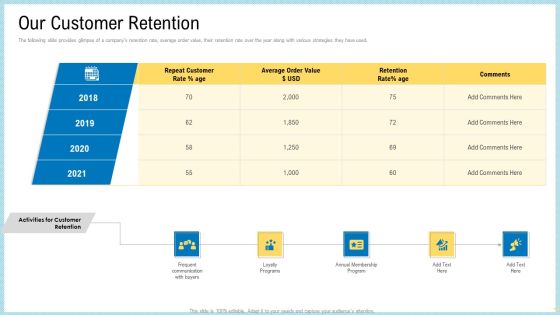
Marketing Technology Stack Our Customer Retention Clipart PDF
The following slide provides glimpse of a companys retention rate, average order value, their retention rate over the year along with various strategies they have used.This is a marketing technology stack our customer retention clipart pdf template with various stages. Focus and dispense information on five stages using this creative set, that comes with editable features. It contains large content boxes to add your information on topics like average order value, frequent communication with buyers, loyalty programs, annual membership program. You can also showcase facts, figures, and other relevant content using this PPT layout. Grab it now.

Investor Pitch Deck To Procure Federal Debt From Banks Our Company Achievements With Details Professional PDF
This slide shows some business achievements over a period such as Market Leadership Award , Increase in Global Sales, Logistics provider of the Year Award etc. This is a investor pitch deck to procure federal debt from banks our company achievements with details professional pdf template with various stages. Focus and dispense information on six stages using this creative set, that comes with editable features. It contains large content boxes to add your information on topics like market share, global sales have increased, market leadership award. You can also showcase facts, figures, and other relevant content using this PPT layout. Grab it now.

Online Streaming Services Corporate History And Achievements Timeline Ppt Icon Visuals PDF
This slide displays over the year milestone record of an OTT platform. It includes major events such as company launch, IPO, workforce increase, subscriber increase, etc. Presenting Online Streaming Services Corporate History And Achievements Timeline Ppt Icon Visuals PDF to dispense important information. This template comprises five stages. It also presents valuable insights into the topics including New Employees, Initial Public Offering, Online Streaming. This is a completely customizable PowerPoint theme that can be put to use immediately. So, download it and address the topic impactfully.

Global Healthcare Device Sale Trends Microsoft PDF
This slide shows international market sale trends that can be used to frame future marketing strategies to boost overall revenue of organization. It include projected sales over next five years, current growth data and top global players etc.Showcasing this set of slides titled Global Healthcare Device Sale Trends Microsoft PDF. The topics addressed in these templates are Market Growth, Incremental Growth, Growth Current. All the content presented in this PPT design is completely editable. Download it and make adjustments in color, background, font etc. as per your unique business setting.

Client Referrals Results Powerpoint Slide Show
This is a client referrals results powerpoint slide show. This is a three stage process. The stages in this process are series, year, success, planning, growth.

Banking Solutions Company Overview Total Deposits Inspiration PDF
The slide highlights the total deposits for financial banking groups over the period of five years. It showcases current accounts, saving accounts, term deposits and overall growth in each. Deliver and pitch your topic in the best possible manner with this Banking Solutions Company Overview Total Deposits Inspiration PDF. Use them to share invaluable insights on Growth, Term Deposits and impress your audience. This template can be altered and modified as per your expectations. So, grab it now.
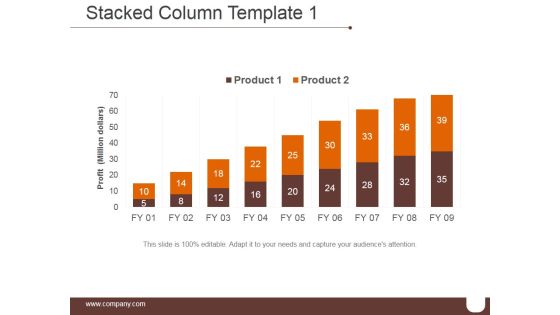
Stacked Column Template 1 Ppt PowerPoint Presentation Ideas
This is a stacked column template 1 ppt powerpoint presentation ideas. This is a nine stage process. The stages in this process are business, growth, success, marketing, year.

Bar Graph Ppt PowerPoint Presentation File Demonstration
This is a bar graph ppt powerpoint presentation file demonstration. This is a four stage process. The stages in this process are graph, year, success, growth, business.

Column Chart Ppt PowerPoint Presentation Infographics Model
This is a column chart ppt powerpoint presentation infographics model. This is a two stage process. The stages in this process are bar graph, growth, product, percentage, year.
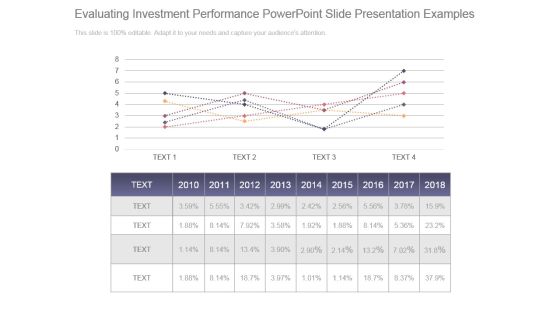
Evaluating Investment Performance Powerpoint Slide Presentation Examples
This is a evaluating investment performance powerpoint slide presentation examples. This is a five stage process. The stages in this process are graph, year, planning, growth, success.

Line Chart Ppt PowerPoint Presentation Pictures Maker
This is a line chart ppt powerpoint presentation pictures maker. This is a two stage process. The stages in this process are financial years, product, growth, success.

Column Chart Ppt PowerPoint Presentation Portfolio Topics
This is a column chart ppt powerpoint presentation portfolio topics. This is a two stage process. The stages in this process are expenditure, years, product, growth, success.

Demand Statistics Ppt PowerPoint Presentation Portfolio Guide
This is a demand statistics ppt powerpoint presentation portfolio guide. This is a four stage process. The stages in this process are demand, graph, growth, success, year.

Marketing Roadmap Planner Ppt Ideas
This is a marketing roadmap planner ppt ideas. This is a eight stage process. The stages in this process are finance, percentage, planning, year, growth.

Column Chart Ppt PowerPoint Presentation Icon Graphics Pictures
This is a column chart ppt powerpoint presentation icon graphics pictures. This is a nine stage process. The stages in this process are product, growth, year, chart, management.

Column Chart Ppt PowerPoint Presentation Show Images
This is a column chart ppt powerpoint presentation show images. This is a two stage process. The stages in this process are product, expenditure, years, bar graph, growth.

Stacked Line Chart Ppt PowerPoint Presentation Styles Graphics
This is a stacked line chart ppt powerpoint presentation styles graphics. This is a two stage process. The stages in this process are product, year, profit, percentage, growth.

Column Chart Ppt PowerPoint Presentation Gallery Show
This is a column chart ppt powerpoint presentation gallery show. This is a two stage process. The stages in this process are column chart, product, year, expenditure, growth.

Financial Performance Logistic Company Investor Fund Raising Pitch Deck Designs PDF
Mentioned slide provides information about digital freight networking company financial performance. It includes business revenue on yearly basis and year to year growth. This modern and well-arranged Financial Performance Logistic Company Investor Fund Raising Pitch Deck Designs PDF provides lots of creative possibilities. It is very simple to customize and edit with the Powerpoint Software. Just drag and drop your pictures into the shapes. All facets of this template can be edited with Powerpoint, no extra software is necessary. Add your own material, put your images in the places assigned for them, adjust the colors, and then you can show your slides to the world, with an animated slide included.
Line Chart Ppt PowerPoint Presentation Icon Inspiration
This is a line chart ppt powerpoint presentation icon inspiration. This is a two stage process. The stages in this process are product, financial years, sales in percentage.

Area Chart Ppt PowerPoint Presentation Summary Deck
This is a area chart ppt powerpoint presentation summary deck. This is a two stage process. The stages in this process are sales in percentage, financial year.

Column Chart Ppt PowerPoint Presentation Professional Aids
This is a column chart ppt powerpoint presentation professional aids. This is a two stage process. The stages in this process are product, sales in percentage, financial years.

Line Chart Ppt PowerPoint Presentation Pictures Layout
This is a line chart ppt powerpoint presentation pictures layout. This is a two stage process. The stages in this process are product, financial years, sales in percentage.

Column Chart Ppt PowerPoint Presentation Gallery Layout
This is a column chart ppt powerpoint presentation gallery layout. This is a two stage process. The stages in this process are product, sales in percentage, year.
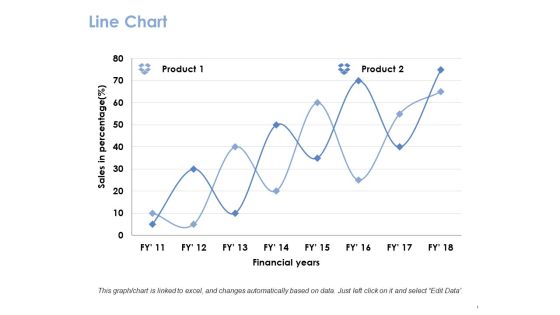
Line Chart Ppt PowerPoint Presentation Gallery Guide
This is a line chart ppt powerpoint presentation gallery guide. This is a two stage process. The stages in this process are product, financial years, sales in percentage.

Area Graph Ppt PowerPoint Presentation Slides Ideas
This is a area graph ppt powerpoint presentation slides ideas. This is a two stage process. The stages in this process are sales in percentage, financial year, product.

Customer Referrals Annual Report Chart Ppt Examples Slides
This is a customer referrals annual report chart ppt examples slides. This is a three stage process. The stages in this process are business, marketing, graph, success, years.

Column Chart Ppt PowerPoint Presentation Infographic Template Inspiration
This is a column chart ppt powerpoint presentation infographic template inspiration. This is a two stage process. The stages in this process are bar, years, business, marketing, success.

Combo Chart Ppt PowerPoint Presentation File Model
This is a combo chart ppt powerpoint presentation file model. This is a eight stage process. The stages in this process are product, year, market size, business, marketing.

Line Chart Ppt PowerPoint Presentation Layouts Templates
This is a line chart ppt powerpoint presentation layouts templates. This is a two stage process. The stages in this process are product, in percentage, in years.

Market Opportunity Analysis Ppt PowerPoint Presentation Templates
This is a market opportunity analysis ppt powerpoint presentation templates. This is a two stage process. The stages in this process are today, business, marketing, year, financial.

Bar Graph Ppt PowerPoint Presentation Design Ideas
This is a bar graph ppt powerpoint presentation design ideas. This is a four stage process. The stages in this process are business, management, marketing, finance, year.
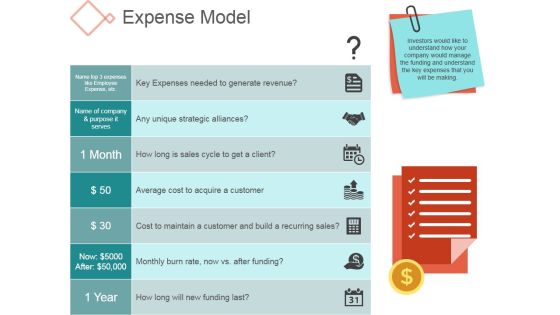
Expense Model Template 1 Ppt PowerPoint Presentation Rules
This is a expense model template 1 ppt powerpoint presentation rules. This is a seven stage process. The stages in this process are month, year, icons, strategy.

Column Chart Ppt PowerPoint Presentation Model Visuals
This is a column chart ppt powerpoint presentation model visuals. This is a two stage process. The stages in this process are product, year, graph, business, finance.

Column Chart Ppt PowerPoint Presentation Model Graphics Example
This is a column chart ppt powerpoint presentation model graphics example. This is a two stage process. The stages in this process are expenditure in, product, years.

Area Chart Ppt PowerPoint Presentation Styles Brochure
This is a area chart ppt powerpoint presentation styles brochure. This is a two stage process. The stages in this process are product, financial years, in percentage.

Line Chart Ppt PowerPoint Presentation Gallery Example Introduction
This is a line chart ppt powerpoint presentation portfolio shapes. This is a two stage process. The stages in this process are product, financial years, line chart.

Column Chart Ppt PowerPoint Presentation Ideas Clipart
This is a column chart ppt powerpoint presentation ideas clipart. This is a two stage process. The stages in this process are product, expenditure in, years.

Column Chart Ppt PowerPoint Presentation Show Slideshow
This is a column chart ppt powerpoint presentation show slideshow. This is a two stage process. The stages in this process are product, expenditure, years.
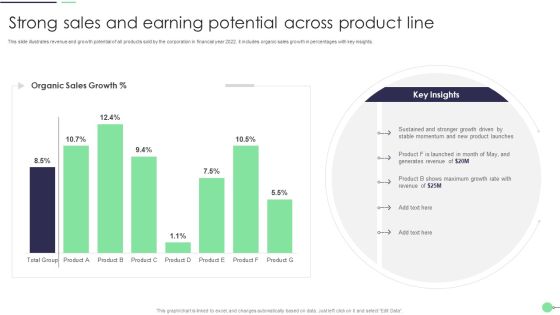
Strong Sales And Earning Potential Across Product Line Professional PDF
This slide illustrates revenue and growth potential of all products sold by the corporation in financial year 2022. it includes organic sales growth in percentages with key insights. Showcasing this set of slides titled Strong Sales And Earning Potential Across Product Line Professional PDF. The topics addressed in these templates are Product Launches, Generates Revenue, Growth Rate. All the content presented in this PPT design is completely editable. Download it and make adjustments in color, background, font etc. as per your unique business setting.

Company Department Cultural Dashboard Pictures PDF
The purpose of this slide is to provide a graph showing the production and sales over the last 4 years in the organization, also defining the rationale behind the decrease in production and sales within the company.Deliver an awe inspiring pitch with this creative company department cultural dashboard pictures pdf bundle. Topics like company culture, average per department, growth and development can be discussed with this completely editable template. It is available for immediate download depending on the needs and requirements of the user.

Banking Solutions Company Overview Net Profit And Margin Topics PDF
The slide highlights the net profit of and margin of financial banking group. It showcases profitability of the firm from its banking activities and its growth over five years time period. Deliver and pitch your topic in the best possible manner with this Banking Solutions Company Overview Net Profit And Margin Topics PDF. Use them to share invaluable insights on Overall Net Profit, Net Profit Margin and impress your audience. This template can be altered and modified as per your expectations. So, grab it now.

Civil Contractors Construction Company Milestones Ppt Pictures Slide Download PDF
This slide provides the construction companys milestone showing organization growth over the years so far. This is a civil contractors construction company milestones ppt pictures slide download pdf template with various stages. Focus and dispense information on eigth stages using this creative set, that comes with editable features. It contains large content boxes to add your information on topics like strive business expansion, delivering exceptional customer service, 1985 to 2020, establishes charitable foundation, employee stock ownership plan. You can also showcase facts, figures, and other relevant content using this PPT layout. Grab it now.

Cloud Based Marketing Company Milestones Ppt PowerPoint Presentation Ideas Sample PDF
This slide provides the companys milestone showing organization growth over the years so far. This is a cloud based marketing company milestones ppt powerpoint presentation ideas sample pdf template with various stages. Focus and dispense information on six stages using this creative set, that comes with editable features. It contains large content boxes to add your information on topics like founded, first data center opened, awarded gold medal certification, announced city z overseas headquarters, 2010 to 2020. You can also showcase facts, figures, and other relevant content using this PPT layout. Grab it now.

Bar Chart Ppt PowerPoint Presentation Icon Information
This is a bar chart ppt powerpoint presentation icon information. This is a one stage process. The stages in this process are product, sales in percentage, financial years, bar graph, growth.

Clustered Column Line Ppt PowerPoint Presentation Show Influencers
This is a clustered column line ppt powerpoint presentation show influencers. This is a four stage process. The stages in this process are financial year, sales in percentage, product, growth, success.

Line Chart Ppt PowerPoint Presentation Layouts Example
This is a line chart ppt powerpoint presentation layouts example. This is a two stage process. The stages in this process are sales in percentage, product, financial years, growth, success.

Bar Diagram Ppt PowerPoint Presentation Gallery Structure
This is a bar diagram ppt powerpoint presentation gallery structure. This is a three stage process. The stages in this process are financial in years, sales in percentage, bar graph, growth, success.

Column Chart Ppt PowerPoint Presentation Layouts Tips
This is a column chart ppt powerpoint presentation layouts tips. This is a six stage process. The stages in this process are sales in percentage, financial year, bar graph, growth, success.

Bar Diagram Ppt PowerPoint Presentation Pictures Background Image
This is a bar diagram ppt powerpoint presentation pictures background image. This is a three stage process. The stages in this process are financial in years, sales in percentage, bar graph, growth, success.

Bar Graph Ppt PowerPoint Presentation Ideas Graphic Tips
This is a bar graph ppt powerpoint presentation ideas graphic tips. This is a three stage process. The stages in this process are financial year, sales in percentage, product, bar graph, growth.

Clustered Column Line Ppt PowerPoint Presentation Portfolio Outline
This is a clustered column line ppt powerpoint presentation portfolio outline. This is a four stage process. The stages in this process are sales in percentage, financial year, product, graph, growth.

Column Chart Ppt PowerPoint Presentation Gallery Slide Portrait
This is a column chart ppt powerpoint presentation gallery slide portrait. This is a two stage process. The stages in this process are sales in percentage, financial year, product, bar graph, growth.

Column Chart Ppt PowerPoint Presentation Ideas Vector
This is a column chart ppt powerpoint presentation ideas vector. This is a two stage process. The stages in this process are column chart, product, financial years, sales in percentage, growth.

Column Chart Ppt PowerPoint Presentation Slides Show
This is a column chart ppt powerpoint presentation slides show. This is a two stage process. The stages in this process are column chart, product, sales in percentage, financial year, growth.
