Year Comparison

Merger And Acquisition Due Diligence Year Over Year Cash Flow Statement Rules PDF
Following slide covers year over year cash flow statement of the target company. It covers information of net cash flow from operations, net cash flow from investing activities and net cash flow from financing activities. This is a merger and acquisition due diligence year over year cash flow statement rules pdf template with various stages. Focus and dispense information on three stages using this creative set, that comes with editable features. It contains large content boxes to add your information on topics like operations, investing activities, financing activities. You can also showcase facts, figures, and other relevant content using this PPT layout. Grab it now.
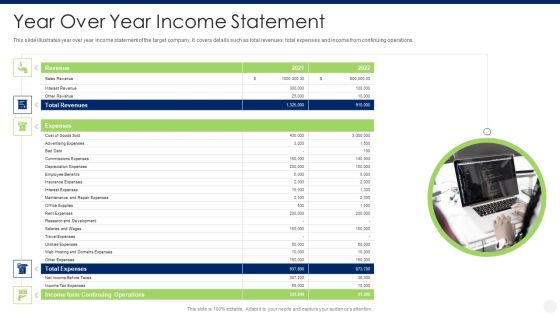
Merger And Acquisition Due Diligence Year Over Year Income Statement Themes PDF
This slide illustrates year over year income statement of the target company. It covers details such as total revenues, total expenses and income from continuing operations. This is a merger and acquisition due diligence year over year income statement themes pdf template with various stages. Focus and dispense information on five stages using this creative set, that comes with editable features. It contains large content boxes to add your information on topics like total revenues, total expenses, income from continuing operations. You can also showcase facts, figures, and other relevant content using this PPT layout. Grab it now.
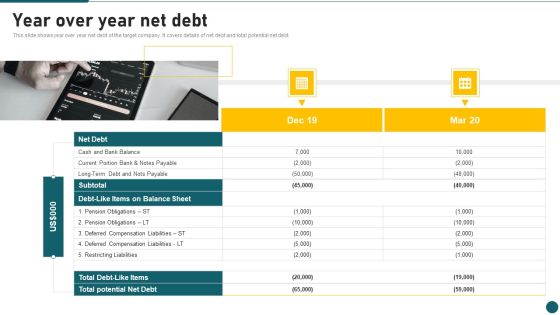
Due Diligence In Amalgamation And Acquisition Year Over Year Net Debt Information PDF
This slide shows year over year net debt of the target company. It covers details of net debt and total potential net debt. This is a Due Diligence In Amalgamation And Acquisition Year Over Year Net Debt Information PDF template with various stages. Focus and dispense information on two stages using this creative set, that comes with editable features. It contains large content boxes to add your information on topics like Potential Net Debt, Restricting Liabilities, Nots Payable. You can also showcase facts, figures, and other relevant content using this PPT layout. Grab it now.

Income Statement Format With Current Year And Previous Years Sales Ppt PowerPoint Presentation Gallery Summary PDF
Pitch your topic with ease and precision using this income statement format with current year and previous years sales ppt powerpoint presentation gallery summary pdf. This layout presents information on expenses, sales, cost. It is also available for immediate download and adjustment. So, changes can be made in the color, design, graphics or any other component to create a unique layout.

Information Technology Transformation Organization Year Over Year Operations Performance Professional PDF
Following slide compares operations performance of the company in financial years 2020 and 2021. It covers production volume, sales revenues, number of active manufacturing plant status and most common defects. Deliver and pitch your topic in the best possible manner with this information technology transformation organization year over year operations performance professional pdf. Use them to share invaluable insights on sales revenues, manufacturing, production volume and impress your audience. This template can be altered and modified as per your expectations. So, grab it now.
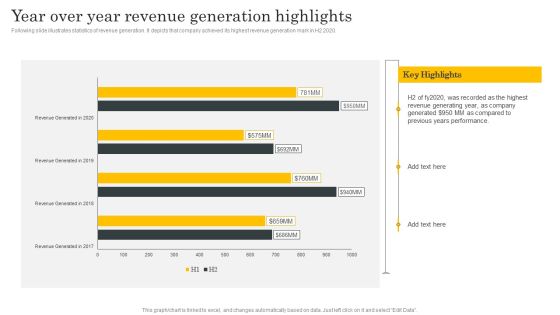
Financial Evaluation Report Year Over Year Revenue Generation Highlights Designs PDF
Following slide illustrates statistics of revenue generation. It depicts that company achieved its highest revenue generation mark in H2 2020. Are you searching for a Financial Evaluation Report Year Over Year Revenue Generation Highlights Designs PDF that is uncluttered, straightforward, and original Its easy to edit, and you can change the colors to suit your personal or business branding. For a presentation that expresses how much effort youve put in, this template is ideal With all of its features, including tables, diagrams, statistics, and lists, its perfect for a business plan presentation. Make your ideas more appealing with these professional slides. Download Financial Evaluation Report Year Over Year Revenue Generation Highlights Designs PDF from Slidegeeks today.

Power Grid Statistics Chart For Year Over Year Analysis Ppt PowerPoint Presentation Show Model PDF
Pitch your topic with ease and precision using this power grid statistics chart for year over year analysis ppt powerpoint presentation show model pdf. This layout presents information on investments by distribution system operators, investments by transmission system operators, 2017 to 2020. It is also available for immediate download and adjustment. So, changes can be made in the color, design, graphics or any other component to create a unique layout.

Cross Sell In Banking Industry Year Over Year Financial Performance Highlights Ppt Ideas Styles PDF
This is a cross sell in banking industry year over year financial performance highlights ppt ideas styles pdf template with various stages. Focus and dispense information on four stages using this creative set, that comes with editable features. It contains large content boxes to add your information on topics like operating income, net income, gross margin, operating cash flow. You can also showcase facts, figures, and other relevant content using this PPT layout. Grab it now.

Cross Selling Of Retail Banking Products Year Over Year Financial Performance Highlights Ppt Styles Gallery PDF
This is a cross selling of retail banking products year over year financial performance highlights ppt styles gallery pdf template with various stages. Focus and dispense information on six stages using this creative set, that comes with editable features. It contains large content boxes to add your information on topics like operating income, net income, gross margin, operating cash flow. You can also showcase facts, figures, and other relevant content using this PPT layout. Grab it now.
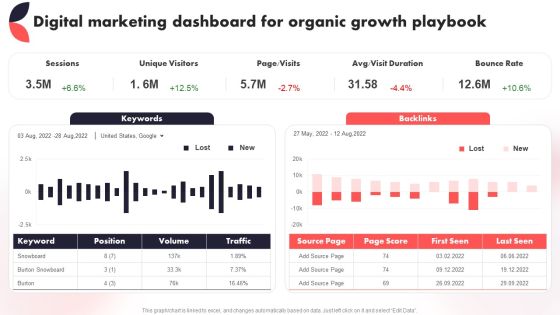
Digital Marketing Dashboard For Organic Growth Playbook Year Over Year Business Success Playbook Themes PDF
This Digital Marketing Dashboard For Organic Growth Playbook Year Over Year Business Success Playbook Themes PDF from Slidegeeks makes it easy to present information on your topic with precision. It provides customization options, so you can make changes to the colors, design, graphics, or any other component to create a unique layout. It is also available for immediate download, so you can begin using it right away. Slidegeeks has done good research to ensure that you have everything you need to make your presentation stand out. Make a name out there for a brilliant performance.

Audit Checklist For Mergers And Acquisitions Year Over Year Financial Ratios Microsoft PDF
Mentioned slide illustrates financial ratios of the firm. It covers price to earnings ratio, debt to equity ratio, current ratio, return on assets, return on equity and return on investment. This is a audit checklist for mergers and acquisitions year over year financial ratios microsoft pdf template with various stages. Focus and dispense information on six stages using this creative set, that comes with editable features. It contains large content boxes to add your information on topics like debt to equity ratio, return assets, current ratio, return on equity, return on investment. You can also showcase facts, figures, and other relevant content using this PPT layout. Grab it now.
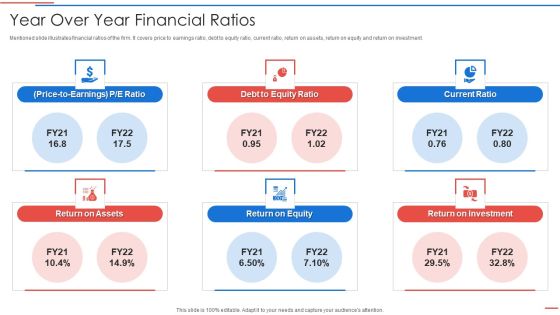
Due Diligence Process In Merger And Acquisition Agreement Year Over Year Financial Ratios Ideas PDF
Mentioned slide illustrates financial ratios of the firm. It covers price to earnings ratio, debt to equity ratio, current ratio, return on assets, return on equity and return on investment.This is a due diligence process in merger and acquisition agreement year over year financial ratios ideas pdf template with various stages. Focus and dispense information on six stages using this creative set, that comes with editable features. It contains large content boxes to add your information on topics like return on assets, return on equity, return on investment You can also showcase facts, figures, and other relevant content using this PPT layout. Grab it now.

Due Diligence In Amalgamation And Acquisition Year Over Year Financial Ratios Template PDF
Mentioned slide illustrates financial ratios of the firm. It covers price to earnings ratio, debt to equity ratio, current ratio, return on assets, return on equity and return on investment. This is a Due Diligence In Amalgamation And Acquisition Year Over Year Financial Ratios Template PDF template with various stages. Focus and dispense information on six stages using this creative set, that comes with editable features. It contains large content boxes to add your information on topics like Equity Ratio, Current Ratio, Return On Investment. You can also showcase facts, figures, and other relevant content using this PPT layout. Grab it now.

Up Selling Your Products To Existing Customers Year Over Year Business Success Playbook Designs PDF
Purpose of the following slide displays Up-selling as a strategy to sell products to existing customers, it include key points such as premium version of product, optional features, customization of products, etc.This Up Selling Your Products To Existing Customers Year Over Year Business Success Playbook Designs PDF is perfect for any presentation, be it in front of clients or colleagues. It is a versatile and stylish solution for organizing your meetings. The product features a modern design for your presentation meetings. The adjustable and customizable slides provide unlimited possibilities for acing up your presentation. Slidegeeks has done all the homework before launching the product for you. So, don not wait, grab the presentation templates today.

Construction Industry Market Share Chart Comparison Of Big Players Ppt Portfolio Shapes PDF
This slide shows the year over year market share comparison of major construction firms. It also illustrates that market share of brand B has increased by slight margin. Pitch your topic with ease and precision using this Construction Industry Market Share Chart Comparison Of Big Players Ppt Portfolio Shapes PDF. This layout presents information on Market Share Percentage, 2022 To 2023, Market Share. It is also available for immediate download and adjustment. So, changes can be made in the color, design, graphics or any other component to create a unique layout.

2 Year Evolution On Strategic Planning Process Slides PDF
This slide represents the 2 year Evolution on outlining strategic process. It comparison current and future mode of operations, design and service management. Showcasing this set of slides titled 2 Year Evolution On Strategic Planning Process Slides PDF. The topics addressed in these templates are Service Management, Enterprise Information Management. All the content presented in this PPT design is completely editable. Download it and make adjustments in color, background, font etc. as per your unique business setting.

Revenue And Operating Expenses Comparison Historical Vs Forecasted Ppt Summary Clipart PDF
The slide provides the comparison of revenue and operating expenses for the year 2015 2020 historical and 2021 2024 forecasted. Deliver an awe inspiring pitch with this creative revenue and operating expenses comparison historical vs forecasted ppt summary clipart pdf bundle. Topics like revenue and operating expenses comparison historical vs forecasted can be discussed with this completely editable template. It is available for immediate download depending on the needs and requirements of the user.

Competitors Financial Comparison With Income Statement And Balance Sheet Numbers Elements PDF
This slide shows companys Financial Comparison with the competitors based on certain factors like Revenue, EBIT, Net Cash Flows, Total Assets, Working Capital etc. for a specific year Deliver an awe-inspiring pitch with this creative competitors financial comparison with income statement and balance sheet numbers elements pdf bundle. Topics like financial factors or parameter, gross profit, working capital can be discussed with this completely editable template. It is available for immediate download depending on the needs and requirements of the user.

Fundraising From Corporate Investment Revenue And Operating Expenses Comparison Historical Pictures PDF
The slide provides the comparison of revenue and operating expenses for the year 2016 to 2021 historical and 2022 to 2025 forecasted. Deliver an awe inspiring pitch with this creative fundraising from corporate investment revenue and operating expenses comparison historical pictures pdf bundle. Topics like net revenue, operating cost can be discussed with this completely editable template. It is available for immediate download depending on the needs and requirements of the user.

Three Year Stats For Different Phases Of Recruitment Information PDF
This slide covers the stages of the recruitment that took place while selecting or doing the related tasks of choosing suitable candidates. It shows the comparison analysis of last three years of each stage of the process. Persuade your audience using this Three Year Stats For Different Phases Of Recruitment Information PDF. This PPT design covers one stages, thus making it a great tool to use. It also caters to a variety of topics including Three Year Stats For Different Phases Of Recruitment. Download this PPT design now to present a convincing pitch that not only emphasizes the topic but also showcases your presentation skills.

3 Year Marketing Roadmap With Budget Variance Microsoft PDF
This slide focuses on three year timeline that can help organization to track forward their marketing process and formulate online strategies to market their product or services. Its key also showcases pre decided vs actual budget utilized comparison with variance. Presenting 3 Year Marketing Roadmap With Budget Variance Microsoft PDF to dispense important information. This template comprises Three stages. It also presents valuable insights into the topics including Purpose, Marketing Strategy, Budget. This is a completely customizable PowerPoint theme that can be put to use immediately. So, download it and address the topic impactfully.

Financial Chart For Current And Quick Financial Ratios Comparison Brochure PDF
This slide showcases current and quick ratio graph that can help to evaluate companys liquidity and and assess the company abilities to pay off debt. It also showcases comparison of ratio with previous financial year Pitch your topic with ease and precision using this financial chart for current and quick financial ratios comparison brochure pdf. This layout presents information on financial chart for current and quick financial ratios comparison. It is also available for immediate download and adjustment. So, changes can be made in the color, design, graphics or any other component to create a unique layout.

Current And Quick Ratio Comparison Graph For Liquidity Assessment Structure PDF
This slide showcases current and quick ratio graph that can help to evaluate companys liquidity and and assess the company abilities to pay off debt. It also showcases comparison of ratio with previous financial year. Showcasing this set of slides titled Current And Quick Ratio Comparison Graph For Liquidity Assessment Structure PDF. The topics addressed in these templates are Short Term Debt, Delayed Payments, Cash Shortage. All the content presented in this PPT design is completely editable. Download it and make adjustments in color, background, font etc. as per your unique business setting.
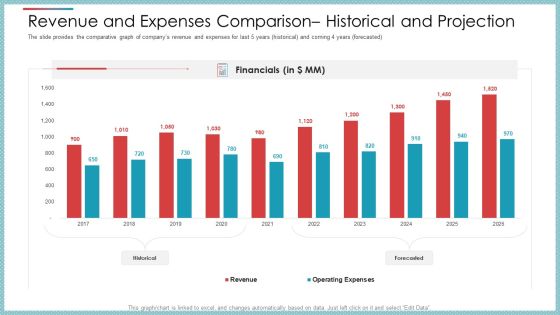
Revenue And Expenses Comparison Historical And Projection Ppt Styles Graphics Design PDF
The slide provides the comparative graph of companys revenue and expenses for last 5 years historical and coming 4 years forecasted.Deliver an awe-inspiring pitch with this creative revenue and expenses comparison historical and projection ppt styles graphics design pdf. bundle. Topics like financials, 2016 to 2025, revenue, operating expenses can be discussed with this completely editable template. It is available for immediate download depending on the needs and requirements of the user.

Big Data And Analytics Market Share And Earnings Comparison Matrix Elements PDF
This slide covers big data revenue comparison for two years. It also includes growth rate and market share of leading vendors to analyse its market position. Persuade your audience using this Big Data And Analytics Market Share And Earnings Comparison Matrix Elements PDF. This PPT design covers five stages, thus making it a great tool to use. It also caters to a variety of topics including Revenue, Growth Rate, Market Share. Download this PPT design now to present a convincing pitch that not only emphasizes the topic but also showcases your presentation skills.

Competitors Financial Comparison With Income Statement And Balance Sheet Numbers Icons PDF
This slide shows companys Financial Comparison with the competitors based on certain factors like Revenue, EBIT, Net Cash Flows, Total Assets, Working Capital etc. for a specific year Deliver an awe inspiring pitch with this creative competitors financial comparison with income statement and balance sheet numbers icons pdf. bundle. Topics like competitors financial comparison with income statement and balance sheet numbers can be discussed with this completely editable template. It is available for immediate download depending on the needs and requirements of the user.

Comparison Of Industrial Sector Based On Energy Use Intensity Themes PDF
This slide showcases the comparison of industries based on energy intensity. Energy intensity is energy used per square foot of a property per year. Key industries included for the comparison are machinery, plastic industry, food and beverage, manufacturing etc. Showcasing this set of slides titled Comparison Of Industrial Sector Based On Energy Use Intensity Themes PDF. The topics addressed in these templates are Machinery, Fabricated, Plastics. All the content presented in this PPT design is completely editable. Download it and make adjustments in color, background, font etc. as per your unique business setting.
Ukraine Vs Russia Examining Comparison Of Political Leadership Among Both Nations Icons PDF
This slide provides information regarding comparative assessment of political leaders across both nations. Post collision, Russia has been led by 3 different leaders as compared to Ukraine, which was led by 7 different leaders over the years. Presenting Ukraine Vs Russia Examining Comparison Of Political Leadership Among Both Nations Icons PDF to provide visual cues and insights. Share and navigate important information on five stages that need your due attention. This template can be used to pitch topics like Comparison Political, Leadership. In addtion, this PPT design contains high resolution images, graphics, etc, that are easily editable and available for immediate download.

Competitors Financial Comparison With Income Statement And Balance Sheet Numbers Infographics PDF
This slide shows companys Financial Comparison with the competitors based on certain factors like Revenue, EBIT, Net Cash Flows, Total Assets, Working Capital etc. for a specific year. Deliver an awe-inspiring pitch with this creative competitors financial comparison with income statement and balance sheet numbers infographics pdf bundle. Topics like revenue, gross profit, net cash flows, working capital, competitor can be discussed with this completely editable template. It is available for immediate download depending on the needs and requirements of the user.

Remuneration Strategy And Payout Comparison Across Industries Ppt Layouts Example Topics PDF
The following slide highlights the commission scheme and payout comparison across industries. It compares industries payout for three years for retail, real estate, insurance, engineering, advertising and financial service industry. Persuade your audience using this Remuneration Strategy And Payout Comparison Across Industries Ppt Layouts Example Topics PDF. This PPT design covers five stages, thus making it a great tool to use. It also caters to a variety of topics including Industry, Commission Scheme, 2020 Payout, 2021 Payout, 2022 Payout. Download this PPT design now to present a convincing pitch that not only emphasizes the topic but also showcases your presentation skills.

Competitors Financial Comparison With Income Statement And Balance Sheet Numbers Diagrams PDF
This slide shows companys Financial Comparison with the competitors based on certain factors like Revenue, EBIT, Net Cash Flows, Total Assets, Working Capital etc. for a specific year. Deliver an awe inspiring pitch with this creative competitors financial comparison with income statement and balance sheet numbers diagrams pdf bundle. Topics like gross profit, net cash flows, working capital can be discussed with this completely editable template. It is available for immediate download depending on the needs and requirements of the user.

Competitors Financial Comparison With Income Statement And Balance Sheet Numbers Mockup PDF
This slide shows companys Financial Comparison with the competitors based on certain factors like Revenue, EBIT, Net Cash Flows, Total Assets, Working Capital etc. for a specific year. Deliver an awe inspiring pitch with this creative competitors financial comparison with income statement and balance sheet numbers mockup pdf bundle. Topics like revenue, gross profit, working capital, net cash flows can be discussed with this completely editable template. It is available for immediate download depending on the needs and requirements of the user.

Competitors Financial Comparison With Income Statement And Balance Sheet Numbers Professional PDF
This slide shows companys Financial Comparison with the competitors based on certain factors like Revenue, EBIT, Net Cash Flows, Total Assets, Working Capital etc. for a specific year. Deliver an awe inspiring pitch with this creative competitors financial comparison with income statement and balance sheet numbers professional pdf bundle. Topics like financial, competitor, revenue, gross profit, net cash flows can be discussed with this completely editable template. It is available for immediate download depending on the needs and requirements of the user.

Employee Headcount Analysis Turnover Comparison Of Two Companies Ppt PowerPoint Presentation Infographics Smartart PDF
This slide shows the comparison of two organizations on the basis of headcount turnover. It includes turnover data of last six years. Showcasing this set of slides titled Employee Headcount Analysis Turnover Comparison Of Two Companies Ppt PowerPoint Presentation Infographics Smartart PDF. The topics addressed in these templates are Highest Turnover, Flexible Working, Lowest. All the content presented in this PPT design is completely editable. Download it and make adjustments in color, background, font etc. as per your unique business setting.

Companys Financial Comparison With Income Statement And Balance Sheet Numbers Elements PDF
This slide shows companys Financial Comparison based on certain parameters like revenue, EBIT, net cash flows, total assets, working capital etc. from the years 2020 to 2024 Create an editable Companys Financial Comparison With Income Statement And Balance Sheet Numbers Elements PDF that communicates your idea and engages your audience. Whether you are presenting a business or an educational presentation, pre designed presentation templates help save time. Companys Financial Comparison With Income Statement And Balance Sheet Numbers Elements PDF is highly customizable and very easy to edit, covering many different styles from creative to business presentations. Slidegeeks has creative team members who have crafted amazing templates. So, go and get them without any delay.

Competitors Financial Comparison With Income Statement And Balance Sheet Numbers Ppt Styles Gallery PDF
This slide shows companys Financial Comparison with the competitors based on certain factors like Revenue, EBIT, Net Cash Flows, Total Assets, Working Capital etc. for a specific year. Deliver an awe inspiring pitch with this creative competitors financial comparison with income statement and balance sheet numbers ppt styles gallery pdf bundle. Topics like revenue, gross profit, net cash flows, working capital can be discussed with this completely editable template. It is available for immediate download depending on the needs and requirements of the user.

Competitors Financial Comparison With Income Statement And Balance Sheet Numbers Ideas PDF
This slide shows companys Financial Comparison with the competitors based on certain factors like Revenue, EBIT, Net Cash Flows, Total Assets, Working Capital etc. for a specific year. Deliver an awe inspiring pitch with this creative competitors financial comparison with income statement and balance sheet numbers ideas pdf bundle. Topics like financial factors parameters, competitor, net cash flows, revenue, gross profit can be discussed with this completely editable template. It is available for immediate download depending on the needs and requirements of the user.

Budget Analysis Dashboard With Actual And Forecasted Revenue Comparison Structure PDF
This slide displays the budget analysis report comparing the budget with the actual year to date data. It also helps in making estimations for the remaining year. It includes variance between budgeted and actual gross margin results, service revenue, profit margin, product revenue, payroll cost, etc. Pitch your topic with ease and precision using this Budget Analysis Dashboard With Actual And Forecasted Revenue Comparison Structure PDF. This layout presents information on Payroll Cost, Budget Revenue Components, Product Revenue. It is also available for immediate download and adjustment. So, changes can be made in the color, design, graphics or any other component to create a unique layout.

Four Cities Sales Comparison Report Ppt PowerPoint Presentation Pictures Mockup PDF
Pitch your topic with ease and precision using this four cities sales comparison report ppt powerpoint presentation pictures mockup pdf. This layout presents information on sales, year 2020. It is also available for immediate download and adjustment. So, changes can be made in the color, design, graphics or any other component to create a unique layout.
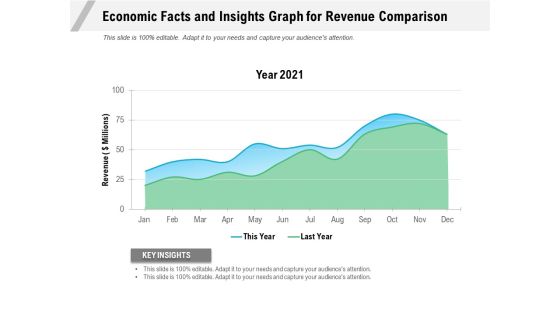
Economic Facts And Insights Graph For Revenue Comparison Ppt PowerPoint Presentation Gallery Portfolio PDF
Pitch your topic with ease and precision using this economic facts and insights graph for revenue comparison ppt powerpoint presentation gallery portfolio pdf. This layout presents information on year 2021, revenue, key insights. It is also available for immediate download and adjustment. So, changes can be made in the color, design, graphics or any other component to create a unique layout.

2 Year Evolution On Overall Corporate Goals Template PDF
This slide represents the Evolution on achieving overall organisational goals and objectives. It includes comparison on the basis of marketing, finance, operations, sales and customer support. Pitch your topic with ease and precision using this 2 Year Evolution On Overall Corporate Goals Template PDF. This layout presents information on Finance, Operations, Customer Support. It is also available for immediate download and adjustment. So, changes can be made in the color, design, graphics or any other component to create a unique layout.

2 Year Evolution Of Dealership Customer Experience Slides PDF
This slide signifies the dealership customer experience Evolution with goals and objectives. It includes comparison on the basis of client and dealer. Showcasing this set of slides titled 2 Year Evolution Of Dealership Customer Experience Slides PDF. The topics addressed in these templates are Client Dealer, Best Customer Experience. All the content presented in this PPT design is completely editable. Download it and make adjustments in color, background, font etc. as per your unique business setting.

Budget And Actual Costs Variance Comparison Chart Ppt PowerPoint Presentation Show Graphics Example PDF
This slide illustrates graphical representation of cost variance. It includes monthly data table of financial year 2021 with budget and actual costs etc.Showcasing this set of slides titled Budget And Actual Costs Variance Comparison Chart Ppt PowerPoint Presentation Show Graphics Example PDF. The topics addressed in these templates are Budget And Actual, Costs Variance, Comparison Chart. All the content presented in this PPT design is completely editable. Download it and make adjustments in color, background, font etc. as per your unique business setting.
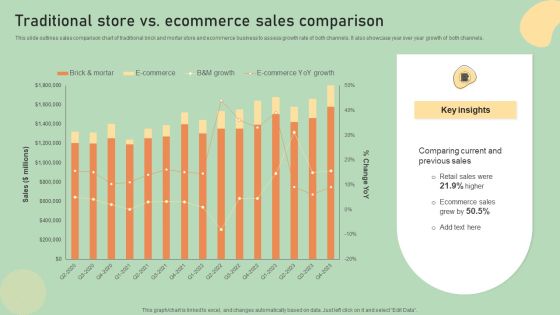
E Commerce Business Development Plan Traditional Store Vs Ecommerce Sales Comparison Guidelines PDF
This slide outlines sales comparison chart of traditional brick and mortar store and ecommerce business to assess growth rate of both channels. It also showcase year over year growth of both channels. Create an editable E Commerce Business Development Plan Traditional Store Vs Ecommerce Sales Comparison Guidelines PDF that communicates your idea and engages your audience. Whether you are presenting a business or an educational presentation, pre-designed presentation templates help save time. E Commerce Business Development Plan Traditional Store Vs Ecommerce Sales Comparison Guidelines PDF is highly customizable and very easy to edit, covering many different styles from creative to business presentations. Slidegeeks has creative team members who have crafted amazing templates. So, go and get them without any delay.
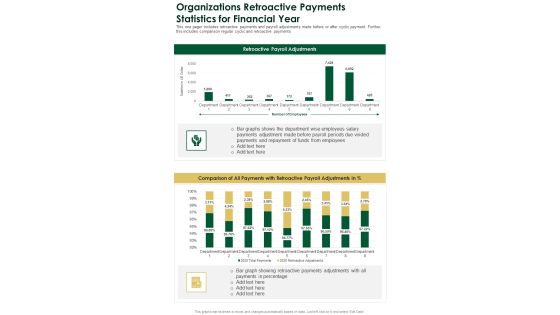
Organizations Retroactive Payments Statistics For Financial Year One Pager Documents
This one pager includes retroactive payments and payroll adjustments made before or after cyclic payment. Further, this includes comparison regular cyclic and retroactive payments. Presenting you an exemplary Organizations Retroactive Payments Statistics For Financial Year One Pager Documents. Our one-pager comprises all the must-have essentials of an inclusive document. You can edit it with ease, as its layout is completely editable. With such freedom, you can tweak its design and other elements to your requirements. Download this Organizations Retroactive Payments Statistics For Financial Year One Pager Documents brilliant piece now.

Case Competition Petroleum Sector Issues Price Comparison Between Crude Oil And Natural Gas Introduction PDF
The slide provides the price comparison graph of crude oil and natural gas from the year 1995 to 2021. Additionally, it provides the key facts such as reason behind the increase or decrease in price, factors that affect the price etc. Deliver an awe inspiring pitch with this creative case competition petroleum sector issues price comparison between crude oil and natural gas introduction pdf bundle. Topics like price comparison between crude oil and natural gas can be discussed with this completely editable template. It is available for immediate download depending on the needs and requirements of the user.

Price Comparison Between Crude Oil And Natural Gas Ppt Outline Background Image PDF
The slide provides the price comparison graph of crude oil and natural gas from the year 1995 to 2021. Additionally, it provides the key facts such as reason behind the increase or decrease in price, factors that affect the price etc. Deliver an awe inspiring pitch with this creative price comparison between crude oil and natural gas ppt outline background image pdf bundle. Topics like price comparison between crude oil and natural gas can be discussed with this completely editable template. It is available for immediate download depending on the needs and requirements of the user.
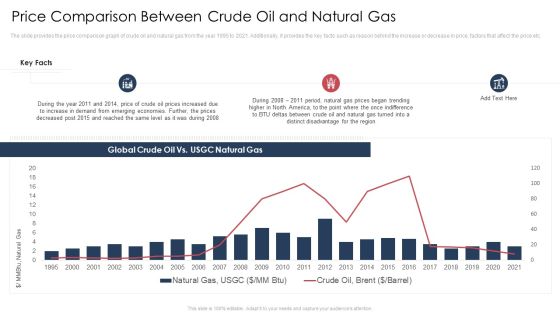
Price Comparison Between Crude Oil And Natural Gas Ppt Summary Smartart PDF
The slide provides the price comparison graph of crude oil and natural gas from the year 1995 to 2021. Additionally, it provides the key facts such as reason behind the increase or decrease in price, factors that affect the price etc.Deliver an awe-inspiring pitch with this creative price comparison between crude oil and natural gas ppt summary smartart pdf. bundle. Topics like global crude oil vs. usgc natural gas, 1995 to 2021 can be discussed with this completely editable template. It is available for immediate download depending on the needs and requirements of the user.
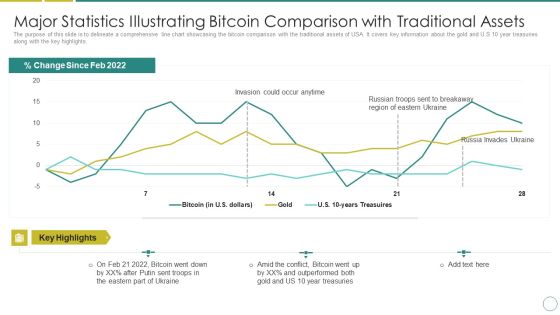
Russia Ukraine Major Statistics Illustrating Bitcoin Comparison With Traditional Assets Guidelines PDF
The purpose of this slide is to delineate a comprehensive line chart showcasing the bitcoin comparison with the traditional assets of USA. It covers key information about the gold and U.S 10 year treasuries along with the key highlights. Deliver an awe inspiring pitch with this creative russia ukraine major statistics illustrating bitcoin comparison with traditional assets guidelines pdf bundle. Topics like invasion could occur anytime, percent change since feb 2022 can be discussed with this completely editable template. It is available for immediate download depending on the needs and requirements of the user.

Industrial Sector Comparison Based On Employment Generated In 2023 Portrait PDF
This slide showcases the industry comparison based on number of people employed across in each industry in the year 2021. Key industries included here are energy, industrial, communications, financial, healthcare, education etc. Showcasing this set of slides titled Industrial Sector Comparison Based On Employment Generated In 2023 Portrait PDF. The topics addressed in these templates are Employed People, Across Industries, Power Sector Emissions. All the content presented in this PPT design is completely editable. Download it and make adjustments in color, background, font etc. as per your unique business setting.

Quarterly Sales Performance In Comparison With Revenue Analysis One Pager Documents
This one page covers about quarterly revenue generations comparable with previous year and revenue analysis from various channels. Presenting you an exemplary Quarterly Sales Performance In Comparison With Revenue Analysis One Pager Documents. Our one-pager comprises all the must-have essentials of an inclusive document. You can edit it with ease, as its layout is completely editable. With such freedom, you can tweak its design and other elements to your requirements. Download this Quarterly Sales Performance In Comparison With Revenue Analysis One Pager Documents brilliant piece now.

Annual Operating Revenue And Total Expenses Comparison Ppt Infographic Template Rules PDF
The slide showcases the operating revenue, total expenses, profit and loss, and cash from operations. It compares all the financial parameters for the financial year 2021 and 2022. Want to ace your presentation in front of a live audience Our Annual Operating Revenue And Total Expenses Comparison Ppt Infographic Template Rules PDF can help you do that by engaging all the users towards you.. Slidegeeks experts have put their efforts and expertise into creating these impeccable powerpoint presentations so that you can communicate your ideas clearly. Moreover, all the templates are customizable, and easy-to-edit and downloadable. Use these for both personal and commercial use.

Cloud Kitchen And Dine In Restaurant Sales Comparison Analyzing Global Commissary Clipart PDF
The following slide highlights comparison of cloud kitchen and dine in restaurants based on gross food sales of previous years. It presents yearly sales growth of cloud kitchen and direct restaurant.There are so many reasons you need a Cloud Kitchen And Dine In Restaurant Sales Comparison Analyzing Global Commissary Clipart PDF. The first reason is you can notspend time making everything from scratch, Thus, Slidegeeks has made presentation templates for you too. You can easily download these templates from our website easily.

Revenue And Expenses Comparison Historical And Projection Ppt Ideas Slide Download PDF
The slide provides the comparative graph of companys revenue and expenses for last 5 years historical and coming 4 years forecasted. Deliver an awe-inspiring pitch with this creative revenue and expenses comparison historical and projection ppt ideas slide download pdf bundle. Topics like revenue, operating expenses, historical, forecasted can be discussed with this completely editable template. It is available for immediate download depending on the needs and requirements of the user.

Revenue And Expenses Comparison Historical And Projection Ppt Show Format PDF
The slide provides the comparative graph of companys revenue and expenses for last 5 years historical and coming 4 years forecasted. Deliver an awe-inspiring pitch with this creative revenue and expenses comparison historical and projection ppt show format pdf bundle. Topics like historical, forecasted, financials can be discussed with this completely editable template. It is available for immediate download depending on the needs and requirements of the user.
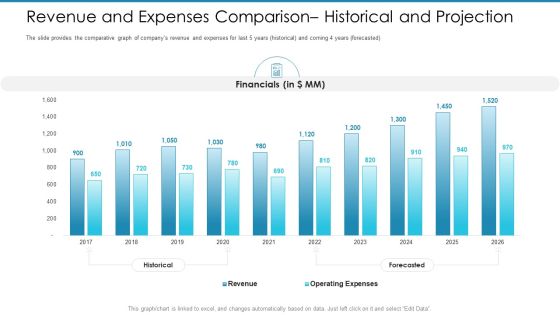
Post Initial Pubic Offering Market Pitch Deck Revenue And Expenses Comparison Historical And Projection Sample PDF
The slide provides the comparative graph of companys revenue and expenses for last 5 years historical and coming 4 years forecasted.Deliver an awe-inspiring pitch with this creative post initial pubic offering market pitch deck revenue and expenses comparison historical and projection sample pdf. bundle. Topics like financials, 2017 to 2026 can be discussed with this completely editable template. It is available for immediate download depending on the needs and requirements of the user.
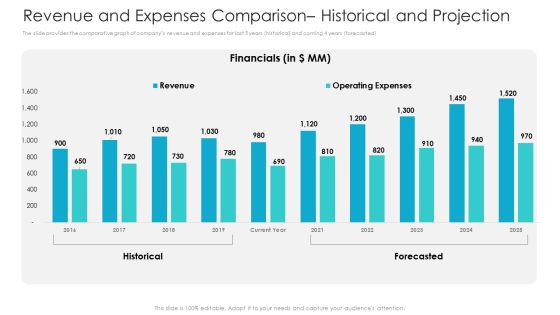
Private Equity Fundraising Pitch Deck Revenue And Expenses Comparison Historical And Projection Clipart PDF
The slide provides the comparative graph of companys revenue and expenses for last 5 years historical and coming 4 years forecasted. Deliver and pitch your topic in the best possible manner with this private equity fundraising pitch deck revenue and expenses comparison historical and projection clipart pdf. Use them to share invaluable insights on financials, revenue, operating expenses, 2016 to 2025 and impress your audience. This template can be altered and modified as per your expectations. So, grab it now.
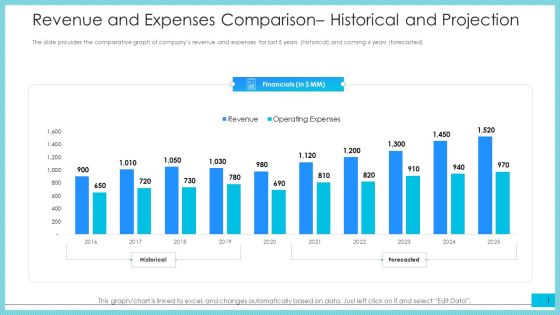
Revenue And Expenses Comparison Historical And Projection Ppt Summary Example Introduction PDF
The slide provides the comparative graph of companys revenue and expenses for last 5 years historical and coming 4 years forecasted.Deliver and pitch your topic in the best possible manner with this revenue and expenses comparison historical and projection ppt summary example introduction pdf. Use them to share invaluable insights on financials, 2016 to 2025, revenue, operating expenses and impress your audience. This template can be altered and modified as per your expectations. So, grab it now.

Revenue And Expenses Comparison Historical And Projection Ppt Show Slide Download PDF
The slide provides the comparative graph of companys revenue and expenses for last 5 years historical and coming 4 years forecasted.Deliver and pitch your topic in the best possible manner with this revenue and expenses comparison historical and projection ppt show slide download pdf. Use them to share invaluable insights on financials, 2016 to 2025, revenue, operating expenses and impress your audience. This template can be altered and modified as per your expectations. So, grab it now.

Funding Pitch To Raise Funds From PE Revenue And Expenses Comparison Historical And Projection Summary PDF
The slide provides the comparative graph of companys revenue and expenses for last 5 years historical and coming 4 years forecasted. Deliver an awe inspiring pitch with this creative funding pitch to raise funds from pe revenue and expenses comparison historical and projection summary pdf bundle. Topics like financials, historical, forecasted, revenue, expenses can be discussed with this completely editable template. It is available for immediate download depending on the needs and requirements of the user.

 Home
Home