Year Comparison
Year Over Year Comparison Of Global Retail Market Icons PDF
Presenting Year Over Year Comparison Of Global Retail Market Icons PDF to dispense important information. This template comprises three stages. It also presents valuable insights into the topics including Year Over Year, Comparison Global, Retail Market. This is a completely customizable PowerPoint theme that can be put to use immediately. So, download it and address the topic impactfully.
Year Over Year Comparison Of Online Banking Topics PDF
Persuade your audience using this Year Over Year Comparison Of Online Banking Topics PDF. This PPT design covers three stages, thus making it a great tool to use. It also caters to a variety of topics including Year Over Year, Comparison, Online Banking. Download this PPT design now to present a convincing pitch that not only emphasizes the topic but also showcases your presentation skills.
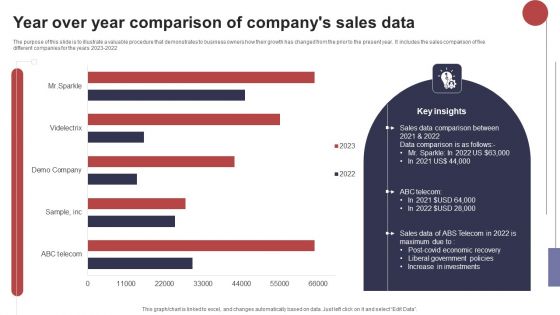
Year Over Year Comparison Of Companys Sales Data Microsoft PDF
The purpose of this slide is to illustrate a valuable procedure that demonstrates to business owners how their growth has changed from the prior to the present year. It includes the sales comparison of five different companies for the years 2023 2022. Pitch your topic with ease and precision using this Year Over Year Comparison Of Companys Sales Data Microsoft PDF. This layout presents information on Sales Data Comparison, Liberal Government, Increase Investments. It is also available for immediate download and adjustment. So, changes can be made in the color, design, graphics or any other component to create a unique layout.
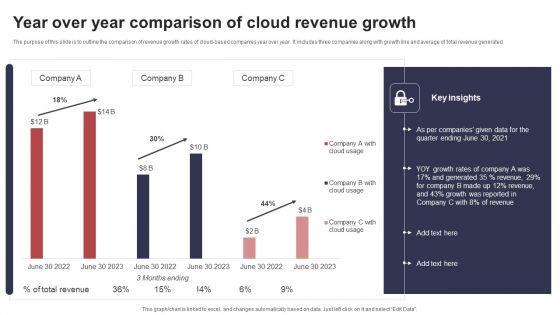
Year Over Year Comparison Of Cloud Revenue Growth Sample PDF
The purpose of this slide is to outline the comparison of revenue growth rates of cloud based companies year over year. It includes three companies along with growth line and average of total revenue generated. Showcasing this set of slides titled Year Over Year Comparison Of Cloud Revenue Growth Sample PDF. The topics addressed in these templates are Yoy Growth Rates, Generated, Growth Reported. All the content presented in this PPT design is completely editable. Download it and make adjustments in color, background, font etc. as per your unique business setting.
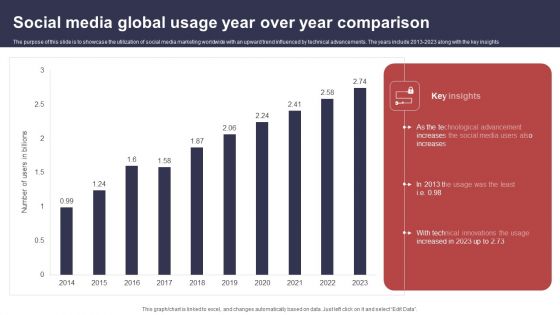
Social Media Global Usage Year Over Year Comparison Professional PDF
The purpose of this slide is to showcase the utilization of social media marketing worldwide with an upward trend influenced by technical advancements. The years include 2013 2023 along with the key insights. Showcasing this set of slides titled Social Media Global Usage Year Over Year Comparison Professional PDF. The topics addressed in these templates are Social Media, Technological Advancement, Technical Innovations. All the content presented in this PPT design is completely editable. Download it and make adjustments in color, background, font etc. as per your unique business setting.
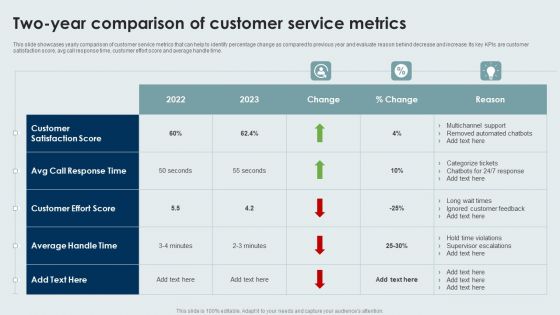
Two Year Comparison Of Customer Service Metrics Information PDF
This slide showcases yearly comparison of customer service metrics that can help to identify percentage change as compared to previous year and evaluate reason behind decrease and increase. Its key KPIs are customer satisfaction score, avg call response time, customer effort score and average handle time. Pitch your topic with ease and precision using this Two Year Comparison Of Customer Service Metrics Information PDF. This layout presents information on Customer Effort Score, Customer Satisfaction Score, Average Handle Time. It is also available for immediate download and adjustment. So, changes can be made in the color, design, graphics or any other component to create a unique layout.
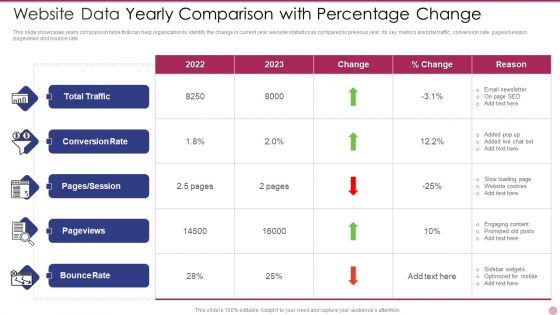
Website Data Yearly Comparison With Percentage Change Formats PDF
This slide showcases yearly comparison table that can help organization to identify the change in current year website statistics as compared to previous year. Its key metrics are total traffic, conversion rate, pages or session, pageviews and bounce rate. Pitch your topic with ease and precision using this Website Data Yearly Comparison With Percentage Change Formats PDF. This layout presents information on Website Data Yearly Comparison With Percentage Change. It is also available for immediate download and adjustment. So, changes can be made in the color, design, graphics or any other component to create a unique layout.
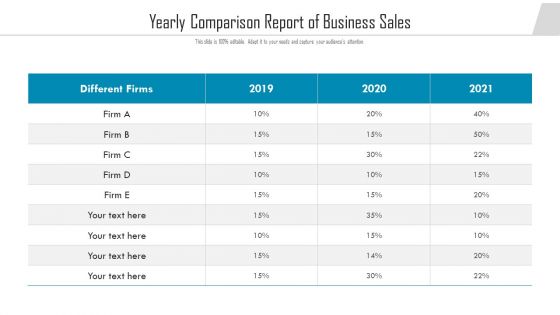
Yearly Comparison Report Of Business Sales Ppt Portfolio Rules PDF
Showcasing this set of slides titled yearly comparison report of business sales ppt portfolio rules pdf. The topics addressed in these templates are yearly comparison report of business sales. All the content presented in this PPT design is completely editable. Download it and make adjustments in color, background, font etc. as per your unique business setting.

Trend Analysis Yearly Comparison Ppt Powerpoint Presentation Professional Example
This is a trend analysis yearly comparison ppt powerpoint presentation professional example. This is a two stage process. The stages in this process are finance, marketing, management, investment, analysis.
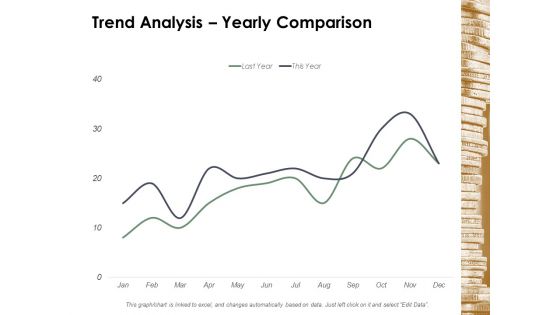
Trend Analysis Yearly Comparison Ppt Powerpoint Presentation Professional Show
This is a trend analysis yearly comparison ppt powerpoint presentation professional show. This is a two stage process. The stages in this process are finance, marketing, management, investment, analysis.

Trend Analysis Yearly Comparison Ppt Powerpoint Presentation Layouts Slideshow
This is a trend analysis yearly comparison ppt powerpoint presentation layouts slideshow. This is a two stage process. The stages in this process are finance, marketing, management, investment, analysis.

Trend Analysis Yearly Comparison Ppt PowerPoint Presentation Summary Visual Aids
This is a trend analysis yearly comparison ppt powerpoint presentation summary visual aids. This is a two stage process. The stages in this process are finance, strategy, marketing, management, business.

Yearly Comparison Of Customer Satisfaction Survey Outcome Demonstration PDF
This slide showcases yearly comparison that can help organization to quickly ascertain a changes in customer satisfaction survey outcome as compared to previous year and take corrective actions to meet the consumer expectations for future. It showcases comparison for a period of 3 years. Showcasing this set of slides titled Yearly Comparison Of Customer Satisfaction Survey Outcome Demonstration PDF. The topics addressed in these templates are Sales Services Customer, Implementation, Product Quality Satisfaction. All the content presented in this PPT design is completely editable. Download it and make adjustments in color, background, font etc. as per your unique business setting.
Yearly Comparison Graph Icon For Operating Profit Margin Topics PDF
Persuade your audience using this Yearly Comparison Graph Icon For Operating Profit Margin Topics PDF. This PPT design covers four stages, thus making it a great tool to use. It also caters to a variety of topics including Yearly Comparison Graph, Icon For Operating, Profit Margin. Download this PPT design now to present a convincing pitch that not only emphasizes the topic but also showcases your presentation skills.
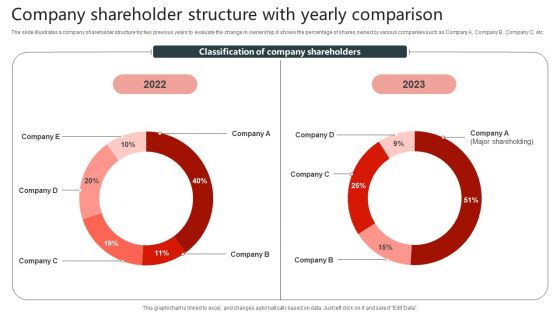
Company Shareholder Structure With Yearly Comparison Infographics PDF
The slide illustrates a company shareholder structure for two previous years to evaluate the change in ownership. It shows the percentage of shares owned by various companies such as Company A, Company B, Company C, etc. Pitch your topic with ease and precision using this Company Shareholder Structure With Yearly Comparison Infographics PDF. This layout presents information on Structure With Yearly Comparison, Company Shareholder. It is also available for immediate download and adjustment. So, changes can be made in the color, design, graphics or any other component to create a unique layout.
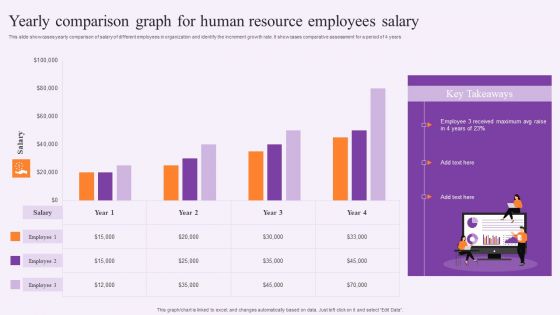
Yearly Comparison Graph For Human Resource Employees Salary Template PDF
This slide showcases yearly comparison of salary of different employees in organization and identify the increment growth rate. It showcases comparative assessment for a period of 4 years. Pitch your topic with ease and precision using this Yearly Comparison Graph For Human Resource Employees Salary Template PDF. This layout presents information on Human Resource, Employees Salary. It is also available for immediate download and adjustment. So, changes can be made in the color, design, graphics or any other component to create a unique layout.

Before Vs After Two Years Comparison Charts PPT Sample SS
Retrieve professionally designed Before Vs After Two Years Comparison Charts PPT Sample SS to effectively convey your message and captivate your listeners. Save time by selecting pre-made slideshows that are appropriate for various topics, from business to educational purposes. These themes come in many different styles, from creative to corporate, and all of them are easily adjustable and can be edited quickly. Access them as PowerPoint templates or as Google Slides themes. You do not have to go on a hunt for the perfect presentation because Slidegeeks got you covered from everywhere.
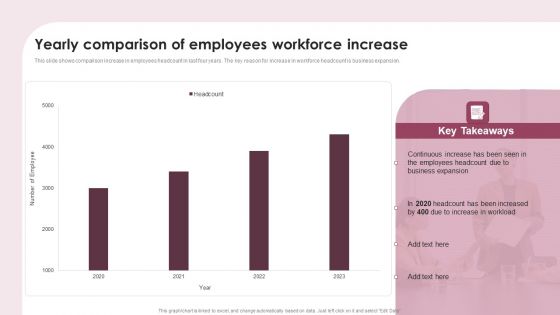
Yearly Comparison Of Employees Workforce Increase Ppt Styles Slide PDF
This slide shows comparison increase in employees headcount in last four years. The key reason for increase in workforce headcount is business expansion. Showcasing this set of slides titled Yearly Comparison Of Employees Workforce Increase Ppt Styles Slide PDF. The topics addressed in these templates are Continuous Increase, Employees Headcount, Business Expansion. All the content presented in this PPT design is completely editable. Download it and make adjustments in color, background, font etc. as per your unique business setting.
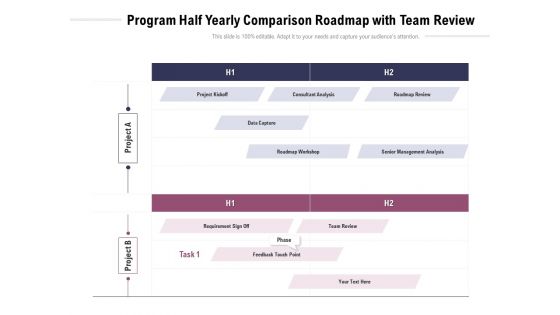
Program Half Yearly Comparison Roadmap With Team Review Microsoft
Presenting our jaw dropping program half yearly comparison roadmap with team review microsoft. You can alternate the color, font size, font type, and shapes of this PPT layout according to your strategic process. This PPT presentation is compatible with Google Slides and is available in both standard screen and widescreen aspect ratios. You can also download this well researched PowerPoint template design in different formats like PDF, JPG, and PNG. So utilize this visually appealing design by clicking the download button given below.
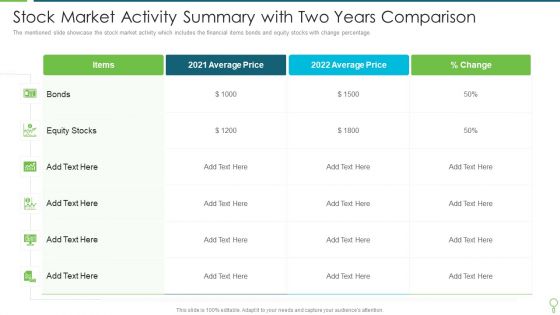
Stock Market Activity Summary With Two Years Comparison Infographics PDF
The mentioned slide showcase the stock market activity which includes the financial items bonds and equity stocks with change percentage. Pitch your topic with ease and precision using this Stock Market Activity Summary With Two Years Comparison Infographics PDF. This layout presents information on Average, Price, Equity Stocks. It is also available for immediate download and adjustment. So, changes can be made in the color, design, graphics or any other component to create a unique layout.
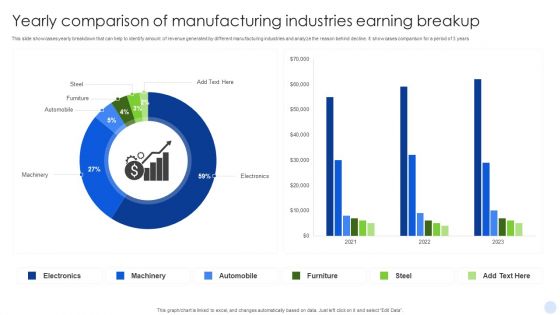
Yearly Comparison Of Manufacturing Industries Earning Breakup Portrait PDF
This slide showcases yearly breakdown that can help to identify amount of revenue generated by different manufacturing industries and analyze the reason behind decline. It showcases comparison for a period of 3 years. Showcasing this set of slides titled Yearly Comparison Of Manufacturing Industries Earning Breakup Portrait PDF. The topics addressed in these templates are Electronics, Machinery, Automobile. All the content presented in this PPT design is completely editable. Download it and make adjustments in color, background, font etc. as per your unique business setting.

Three Year Revenues Comparison One Pager Documents
The slide shows the key comparison of revenues generated from projects and services delivered to clients. Presenting you a fantastic Three Year Revenues Comparison One Pager Documents. This piece is crafted on hours of research and professional design efforts to ensure you have the best resource. It is completely editable and its design allow you to rehash its elements to suit your needs. Get this Three Year Revenues Comparison One Pager Documents A4 One-pager now.
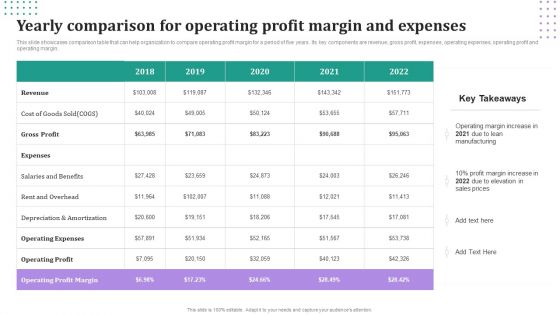
Yearly Comparison For Operating Profit Margin And Expenses Demonstration PDF
This slide showcases comparison table that can help organization to compare operating profit margin for a period of five years. Its key components are revenue, gross profit, expenses, operating expenses, operating profit and operating margin. Showcasing this set of slides titled Yearly Comparison For Operating Profit Margin And Expenses Demonstration PDF. The topics addressed in these templates are Gross Profit, Revenue, Operating Expenses. All the content presented in this PPT design is completely editable. Download it and make adjustments in color, background, font etc. as per your unique business setting.
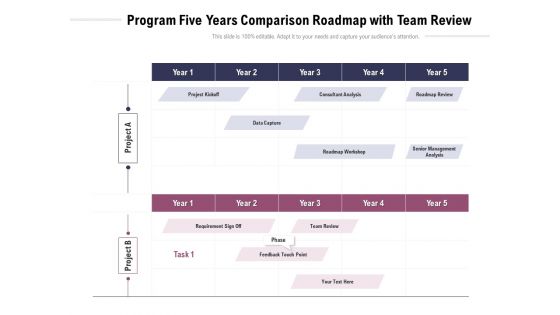
Program Five Years Comparison Roadmap With Team Review Ideas
Presenting the program five years comparison roadmap with team review ideas. The template includes a roadmap that can be used to initiate a strategic plan. Not only this, the PowerPoint slideshow is completely editable and you can effortlessly modify the font size, font type, and shapes according to your needs. This PPT slide can be easily reached in standard screen and widescreen aspect ratios. The set is also available in various formats like PDF, PNG, and JPG. So download and use it multiple times as per your knowledge.
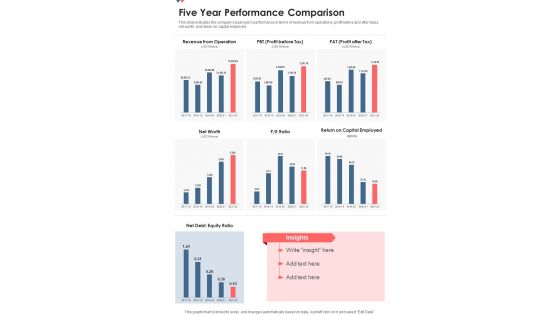
Five Year Performance Comparison One Pager Documents
This slide indicates the companys past years performance in terms of revenue from operations, profit before and after taxes, net worth, and return on capital employed. Presenting you a fantastic Five Year Performance Comparison One Pager Documents. This piece is crafted on hours of research and professional design efforts to ensure you have the best resource. It is completely editable and its design allow you to rehash its elements to suit your needs. Get this Five Year Performance Comparison One Pager Documents A4 One-pager now.
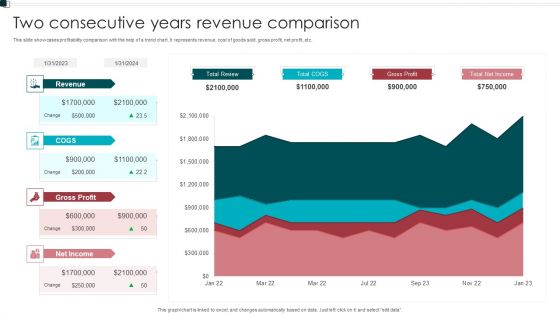
Two Consecutive Years Revenue Comparison Topics PDF
This slide showcases profitability comparison with the help of a trend chart. It represents revenue, cost of goods sold, gross profit, net profit, etc. Pitch your topic with ease and precision using this Two Consecutive Years Revenue Comparison Topics PDF. This layout presents information on Revenue, Gross Profit, Net Income. It is also available for immediate download and adjustment. So, changes can be made in the color, design, graphics or any other component to create a unique layout.
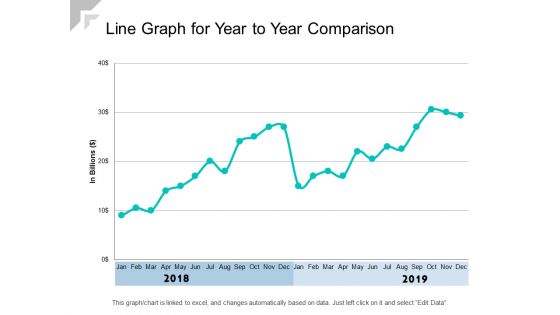
Line Graph For Year To Year Comparison Ppt PowerPoint Presentation Show Graphics Example
Presenting this set of slides with name line graph for year to year comparison ppt powerpoint presentation show graphics example. The topics discussed in these slides are revenue trend, bar chart, financial. This is a completely editable PowerPoint presentation and is available for immediate download. Download now and impress your audience.
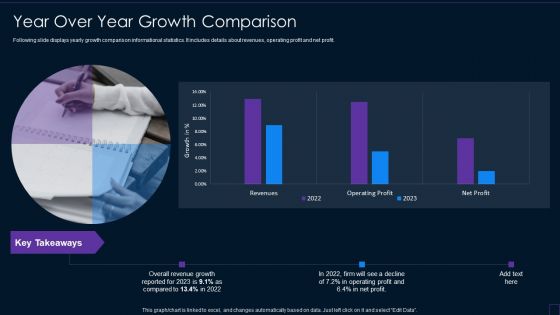
Brand Development Manual Year Over Year Growth Comparison Ideas PDF
Following slide displays yearly growth comparison informational statistics. It includes details about revenues, operating profit and net profit. Deliver and pitch your topic in the best possible manner with this Brand Development Manual Year Over Year Growth Comparison Ideas PDF Use them to share invaluable insights on Year Over Year Growth Comparison and impress your audience. This template can be altered and modified as per your expectations. So, grab it now.
Multinational Firms Year Over Year Revenue Comparison Slides PDF
Presenting Multinational Firms Year Over Year Revenue Comparison Slides PDF to dispense important information. This template comprises three stages. It also presents valuable insights into the topics including Multinational Firms, Year Over Year, Revenue Comparison. This is a completely customizable PowerPoint theme that can be put to use immediately. So, download it and address the topic impactfully.

Year Over Year Growth Comparison Brand Techniques Structure Designs PDF
Following slide displays yearly growth comparison informational statistics. It includes details about revenues, operating profit and net profit. Deliver an awe inspiring pitch with this creative year over year growth comparison brand techniques structure designs pdf bundle. Topics like revenue, growth, profit can be discussed with this completely editable template. It is available for immediate download depending on the needs and requirements of the user.
Chart Illustrating Two Year Comparison Of Business Data Icon Ppt Outline Example Topics PDF
Persuade your audience using this Chart Illustrating Two Year Comparison Of Business Data Icon Ppt Outline Example Topics PDF. This PPT design covers three stages, thus making it a great tool to use. It also caters to a variety of topics including chart illustrating two year comparison of business data icon. Download this PPT design now to present a convincing pitch that not only emphasizes the topic but also showcases your presentation skills.
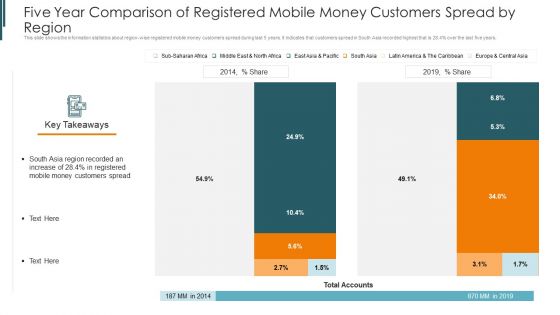
Introduction To Mobile Money In Developing Countries Five Year Comparison Of Registered Demonstration PDF
This slide shows the information statistics about region wise registered mobile money customers spread during last 5 years. It indicates that customers spread in South Asia recorded highest that is 28.4persent over the last five years.Deliver an awe inspiring pitch with this creative introduction to mobile money in developing countries five year comparison of registered demonstration pdf bundle. Topics like five year comparison of registered mobile money customers spread by region can be discussed with this completely editable template. It is available for immediate download depending on the needs and requirements of the user.

Five Year Comparison Of Registered Mobile Money Customers Spread By Region Graphics PDF
This slide shows the information statistics about region wise registered mobile money customers spread during last 5 years. It indicates that customers spread in South Asia recorded highest that is 28.4 percentage over the last five years. Deliver an awe inspiring pitch with this creative Five Year Comparison Of Registered Mobile Money Customers Spread By Region Graphics PDF bundle. Topics like Five Year Comparison Of Registered Mobile Money Customers Spread By Region can be discussed with this completely editable template. It is available for immediate download depending on the needs and requirements of the user.

Enhanced Customer Banking Experience With Mobile Five Year Comparison Of Registered Mobile Background PDF
This slide shows the information statistics about region-wise registered mobile money customers spread during last 5 years. It indicates that customers spread in South Asia recorded highest that is 28.4percent over the last five years.Deliver an awe inspiring pitch with this creative Enhanced Customer Banking Experience With Mobile Five Year Comparison Of Registered Mobile Background PDF bundle. Topics like Five Year Comparison Of Registered Mobile Money Customers Spread By Region can be discussed with this completely editable template. It is available for immediate download depending on the needs and requirements of the user.

M Banking System Improving Consumer Five Year Comparison Of Registered Mobile Money Topics PDF
This slide shows the information statistics about region-wise registered mobile money customers spread during last 5 years. It indicates that customers spread in South Asia recorded highest that is 28.4 percent over the last five years. This is a m banking system improving consumer five year comparison of registered mobile money topics pdf template with various stages. Focus and dispense information on one stages using this creative set, that comes with editable features. It contains large content boxes to add your information on topics like total accounts, customers spread, mobile money. You can also showcase facts, figures, and other relevant content using this PPT layout. Grab it now.

Five Year Comparison Of Registered Mobile Money Customers Spread By Region Introduction PDF
This slide shows the information statistics about region wise registered mobile money customers spread during last 5 years. It indicates that customers spread in south asia recorded highest that is 28.4persent over the last five years.Deliver and pitch your topic in the best possible manner with this Five Year Comparison Of Registered Mobile Money Customers Spread By Region Introduction PDF. Use them to share invaluable insights on Region Recorded, Mobile Money, Customers Spread and impress your audience. This template can be altered and modified as per your expectations. So, grab it now.

Two Year Comparison Of Income And Cash Flow Statement Of Manufacturing Company Demonstration PDF
This slide covers cash flow, profit and loss statements of two years of manufacturing plant. It includes comparative assessment of income, cost of goods, expenses, net earnings, depreciations, etc. Pitch your topic with ease and precision using this Two Year Comparison Of Income And Cash Flow Statement Of Manufacturing Company Demonstration PDF. This layout presents information on Cost Goods, Income, Cash Flow, Net Income. It is also available for immediate download and adjustment. So, changes can be made in the color, design, graphics or any other component to create a unique layout.

Three Year Revenues Comparison Template 328 One Pager Documents
The slide shows the key comparison of revenues generated from projects and services delivered to clients. Presenting you a fantastic Three Year Revenues Comparison Template 328 One Pager Documents. This piece is crafted on hours of research and professional design efforts to ensure you have the best resource. It is completely editable and its design allow you to rehash its elements to suit your needs. Get this Three Year Revenues Comparison Template 328 One Pager Documents A4 One-pager now.
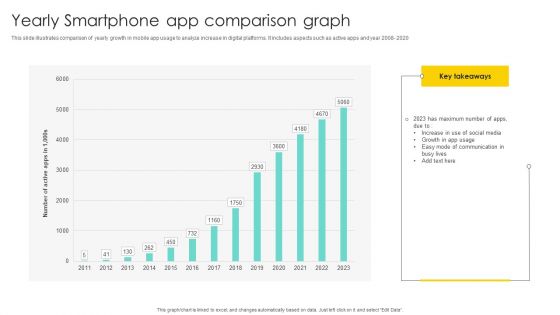
Yearly Smartphone App Comparison Graph Diagrams PDF
Showcasing this set of slides titled Yearly Smartphone App Comparison Graph Diagrams PDF. The topics addressed in these templates are Comparison Graph, Comparison Of Yearly, Growth In App . All the content presented in this PPT design is completely editable. Download it and make adjustments in color, background, font etc. as per your unique business setting.
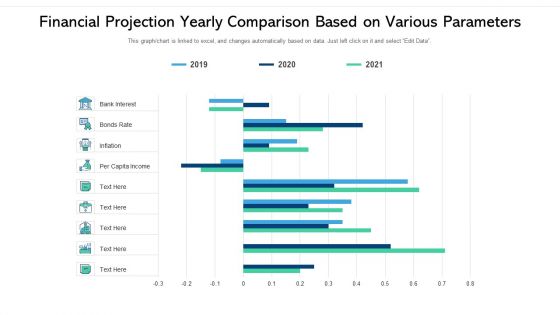
Financial Projection Yearly Comparison Based On Various Parameters Ppt Ideas Infographics PDF
Showcasing this set of slides titled financial projection yearly comparison based on various parameters ppt ideas infographics pdf. The topics addressed in these templates are financial projection yearly comparison based on various parameters. All the content presented in this PPT design is completely editable. Download it and make adjustments in color, background, font etc. as per your unique business setting.
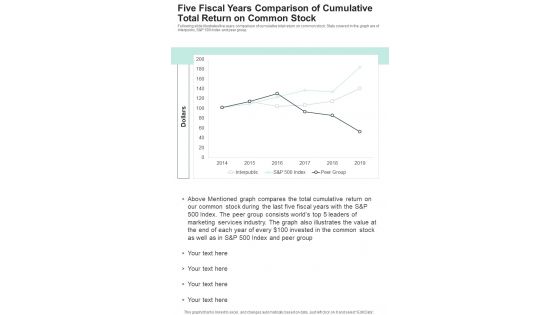
Five Fiscal Years Comparison Of Cumulative Total Return On Common Stock One Pager Documents
Following slide illustrates five years comparison of cumulative total return on common stock. Stats covered in the graph are of interpublic, S and P 500 Index and peer group. Presenting you a fantastic Five Fiscal Years Comparison Of Cumulative Total Return On Common Stock One Pager Documents. This piece is crafted on hours of research and professional design efforts to ensure you have the best resource. It is completely editable and its design allow you to rehash its elements to suit your needs. Get this Five Fiscal Years Comparison Of Cumulative Total Return On Common Stock One Pager Documents A4 One-pager now.
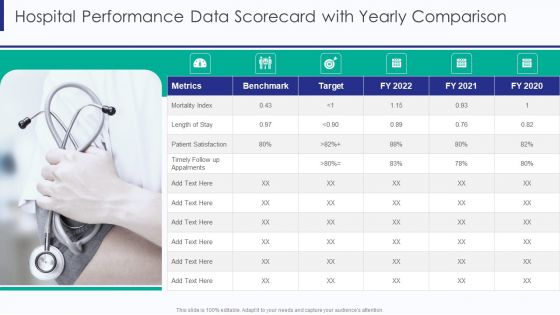
Healthcare Hospital Performance Data Scorecard With Yearly Comparison Ppt Model Templates PDF
Deliver and pitch your topic in the best possible manner with this Healthcare Hospital Performance Data Scorecard With Yearly Comparison Ppt Model Templates PDF. Use them to share invaluable insights on Mortality Index Metrics, Patient Satisfaction Target, Length Of Stay and impress your audience. This template can be altered and modified as per your expectations. So, grab it now.
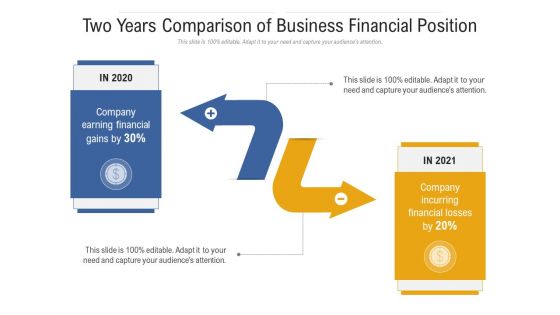
Two Years Comparison Of Business Financial Position Ppt PowerPoint Presentation Model Maker PDF
Presenting two years comparison of business financial position ppt powerpoint presentation model maker pdf to provide visual cues and insights. Share and navigate important information on two stages that need your due attention. This template can be used to pitch topics like company earning financial gains, company incurring financial losses, 2020 to 2021. In addtion, this PPT design contains high resolution images, graphics, etc, that are easily editable and available for immediate download.

Property Investment Assessment Report Highlighting Two Years Comparison Ppt PowerPoint Presentation Inspiration Display PDF
Showcasing this set of slides titled property investment assessment report highlighting two years comparison ppt powerpoint presentation inspiration display pdf. The topics addressed in these templates are revenues, expenses, total revenues, total expenses, rental income, operating income, net income. All the content presented in this PPT design is completely editable. Download it and make adjustments in color, background, font etc. as per your unique business setting.
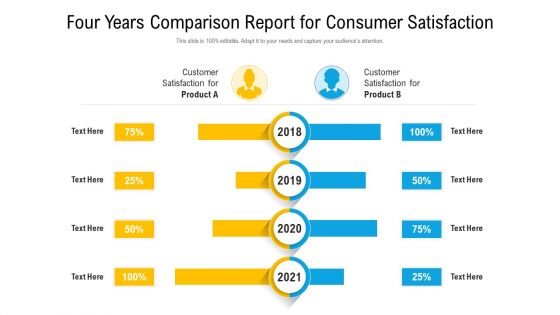
Four Years Comparison Report For Consumer Satisfaction Ppt PowerPoint Presentation Slides Topics PDF
Presenting four years comparison report for consumer satisfaction ppt powerpoint presentation slides topics pdf to provide visual cues and insights. Share and navigate important information on four stages that need your due attention. This template can be used to pitch topics like customer satisfaction for 2018 to 2021. In addtion, this PPT design contains high resolution images, graphics, etc, that are easily editable and available for immediate download.

Year Over Year Revenue Growth Comparison Diagrams PDF
The given slide depicts the year over year comparison of quarterly revenue growth between two years, especially with the sources of revenue in order to track the profitability and incurring losses in the business. Showcasing this set of slides titled Year Over Year Revenue Growth Comparison Diagrams PDF. The topics addressed in these templates are Year Over Year, Revenue Growth, Comparison. All the content presented in this PPT design is completely editable. Download it and make adjustments in color, background, font etc. as per your unique business setting.

Sales Managers Yearly Performance Comparison Scorecard Designs PDF
Deliver and pitch your topic in the best possible manner with this Sales Managers Yearly Performance Comparison Scorecard Designs PDF. Use them to share invaluable insights on Sales Managers, Yearly Performance, Comparison Scorecard and impress your audience. This template can be altered and modified as per your expectations. So, grab it now.
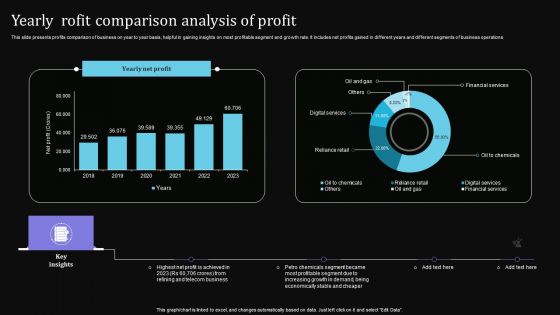
Yearly Rofit Comparison Analysis Of Profit Slides PDF
This slide presents profits comparison of business on year to year basis, helpful in gaining insights on most profitable segment and growth rate. It includes net profits gained in different years and different segments of business operations. Showcasing this set of slides titled Yearly Rofit Comparison Analysis Of Profit Slides PDF. The topics addressed in these templates are Highest Net Profit, Telecom Business, Stable Cheaper. All the content presented in this PPT design is completely editable. Download it and make adjustments in color, background, font etc. as per your unique business setting.

Half Yearly Employees Comparison Roadmap Based On Sales Performance Template
We present our half yearly employees comparison roadmap based on sales performance template. This PowerPoint layout is easy to edit so you can change the font size, font type, color, and shape conveniently. In addition to this, the PowerPoint layout is Google Slides compatible, so you can share it with your audience and give them access to edit it. Therefore, download and save this well researched half yearly employees comparison roadmap based on sales performance template in different formats like PDF, PNG, and JPG to smoothly execute your business plan.

Five Yearly Employees Comparison Roadmap Based On Sales Performance Summary
We present our five yearly employees comparison roadmap based on sales performance summary. This PowerPoint layout is easy to edit so you can change the font size, font type, color, and shape conveniently. In addition to this, the PowerPoint layout is Google Slides compatible, so you can share it with your audience and give them access to edit it. Therefore, download and save this well researched five yearly employees comparison roadmap based on sales performance summary in different formats like PDF, PNG, and JPG to smoothly execute your business plan.
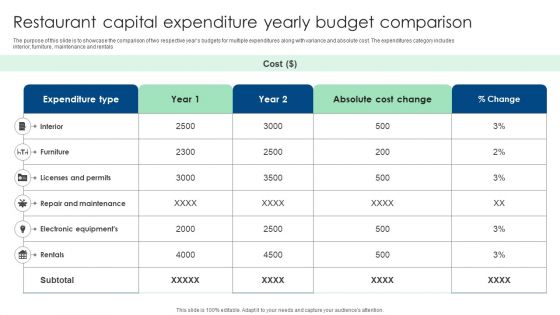
Restaurant Capital Expenditure Yearly Budget Comparison Ppt Professional Guide PDF
The purpose of this slide is to showcase the comparison of two respective years budgets for multiple expenditures along with variance and absolute cost. The expenditures category includes interior, furniture, maintenance and rentals. Showcasing this set of slides titled Restaurant Capital Expenditure Yearly Budget Comparison Ppt Professional Guide PDF. The topics addressed in these templates are Expenditure Type, Licenses And Permits, Absolute Cost Change. All the content presented in this PPT design is completely editable. Download it and make adjustments in color, background, font etc. as per your unique business setting.
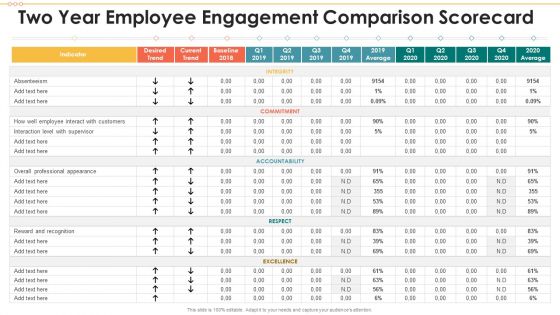
Two Year Employee Engagement Comparison Scorecard Designs PDF
Deliver an awe inspiring pitch with this creative Two Year Employee Engagement Comparison Scorecard Designs PDF bundle. Topics like Employee Interact, Professional Appearance, Reward And Recognition can be discussed with this completely editable template. It is available for immediate download depending on the needs and requirements of the user.
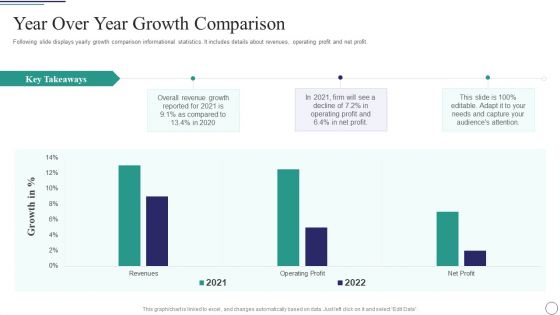
Successful Brand Development Plan Year Over Year Growth Comparison Clipart PDF
Following slide displays yearly growth comparison informational statistics. It includes details about revenues, operating profit and net profit. Deliver and pitch your topic in the best possible manner with this successful brand development plan year over year growth comparison clipart pdf. Use them to share invaluable insights on year over year growth comparison and impress your audience. This template can be altered and modified as per your expectations. So, grab it now.
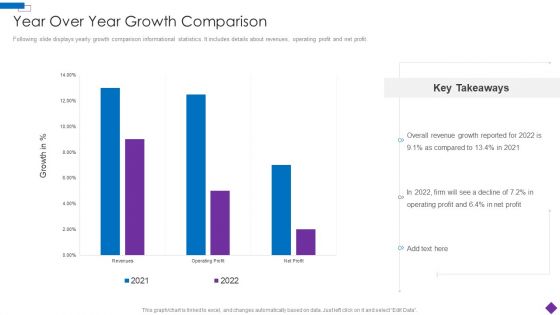
Introducing A New Product To The Market Year Over Year Growth Comparison Elements PDF
Following slide displays yearly growth comparison informational statistics. It includes details about revenues, operating profit and net profit. Deliver and pitch your topic in the best possible manner with this Introducing A New Product To The Market Year Over Year Growth Comparison Elements PDF. Use them to share invaluable insights on Year Over Year Growth Comparison and impress your audience. This template can be altered and modified as per your expectations. So, grab it now.
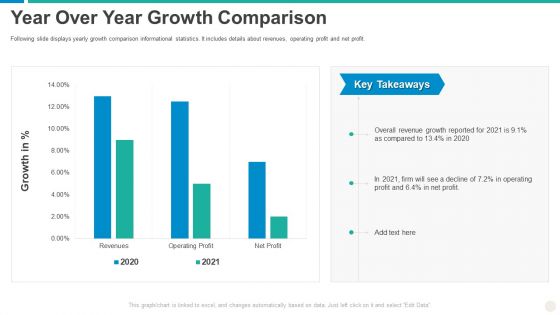
Establishing Successful Brand Strategy To Captivate Consumers Year Over Year Growth Comparison Professional PDF
Following slide displays yearly growth comparison informational statistics. It includes details about revenues, operating profit and net profit. Deliver an awe inspiring pitch with this creative establishing successful brand strategy to captivate consumers year over year growth comparison professional pdf bundle. Topics like operating profit, revenue, growth can be discussed with this completely editable template. It is available for immediate download depending on the needs and requirements of the user.
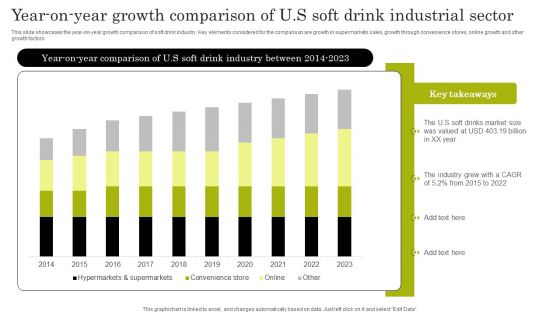
Year On Year Growth Comparison Of U S Soft Drink Industrial Sector Topics PDF
This slide showcases the year-on-year growth comparison of soft drink industry. Key elements considered for the comparison are growth in supermarkets sales, growth through convenience stores, online growth and other growth factors. Showcasing this set of slides titled Year On Year Growth Comparison Of U S Soft Drink Industrial Sector Topics PDF. The topics addressed in these templates are The Industry Grew, Soft Drinks, Market Size. All the content presented in this PPT design is completely editable. Download it and make adjustments in color, background, font etc. as per your unique business setting.
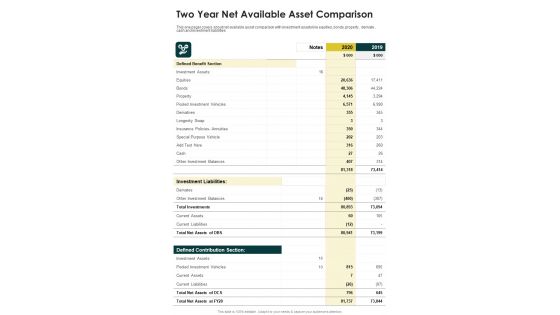
Two Year Net Available Asset Comparison One Pager Documents
This one pager covers about net available asset comparison with investment assets like equities ,bonds, property , derivate , cash and investment liabilities. Presenting you a fantastic Two Year Net Available Asset Comparison One Pager Documents. This piece is crafted on hours of research and professional design efforts to ensure you have the best resource. It is completely editable and its design allow you to rehash its elements to suit your needs. Get this Two Year Net Available Asset Comparison One Pager Documents A4 One-pager now.
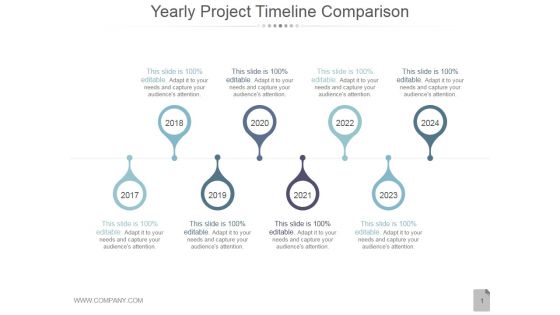
Yearly Project Timeline Comparison Ppt PowerPoint Presentation Picture
This is a yearly project timeline comparison ppt powerpoint presentation picture. This is a eight stage process. The stages in this process are timeline, business, marketing, planning, management.

Comparison Yearly Operating Plan Ppt PowerPoint Presentation Professional Model
This is a comparison yearly operating plan ppt powerpoint presentation professional model. This is a two stage process. The stages in this process are business, management, strategy, analysis, icons.

Yearly Selling Forecasts Comparison And IT Store Demonstration PDF
This slide covers two year sales projections for an IT retail store. It includes projections based on per unit sales, prices and overall sale of products and services for systems, services, software, training, etc. Showcasing this set of slides titled Yearly Selling Forecasts Comparison And IT Store Demonstration PDF. The topics addressed in these templates are Service, Sales Per Unit, Price Per Unit. All the content presented in this PPT design is completely editable. Download it and make adjustments in color, background, font etc. as per your unique business setting.
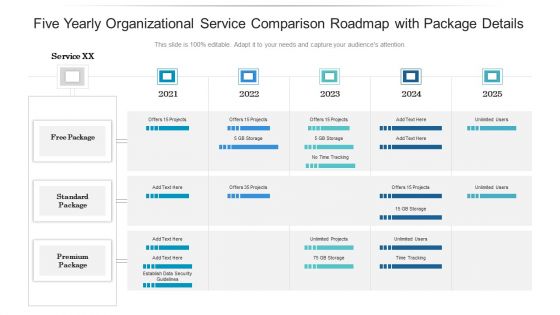
Five Yearly Organizational Service Comparison Roadmap With Package Details Sample
Presenting the five yearly organizational service comparison roadmap with package details sample. The template includes a roadmap that can be used to initiate a strategic plan. Not only this, the PowerPoint slideshow is completely editable and you can effortlessly modify the font size, font type, and shapes according to your needs. This PPT slide can be easily reached in standard screen and widescreen aspect ratios. The set is also available in various formats like PDF, PNG, and JPG. So download and use it multiple times as per your knowledge.
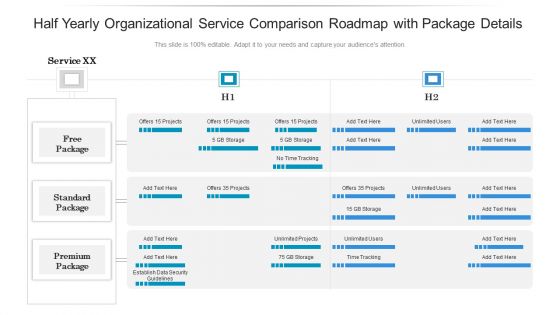
Half Yearly Organizational Service Comparison Roadmap With Package Details Diagrams
Presenting the half yearly organizational service comparison roadmap with package details diagrams. The template includes a roadmap that can be used to initiate a strategic plan. Not only this, the PowerPoint slideshow is completely editable and you can effortlessly modify the font size, font type, and shapes according to your needs. This PPT slide can be easily reached in standard screen and widescreen aspect ratios. The set is also available in various formats like PDF, PNG, and JPG. So download and use it multiple times as per your knowledge.
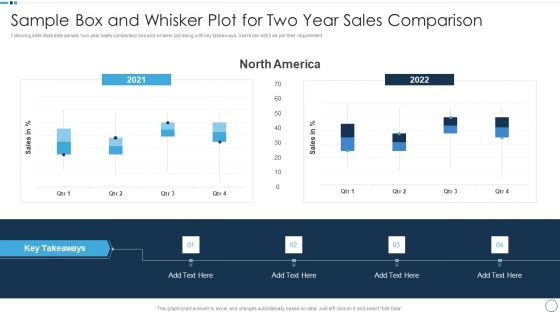
QA Plan Set 1 Sample Box And Whisker Plot For Two Year Sales Comparison Themes PDF
Following slide illustrates sample two year sales comparison box and whisker plot along with key takeaways. Users can edit it as per their requirement. Deliver and pitch your topic in the best possible manner with this QA Plan Set 1 Sample Box And Whisker Plot For Two Year Sales Comparison Themes PDF. Use them to share invaluable insights on Sales Comparison and impress your audience. This template can be altered and modified as per your expectations. So, grab it now.
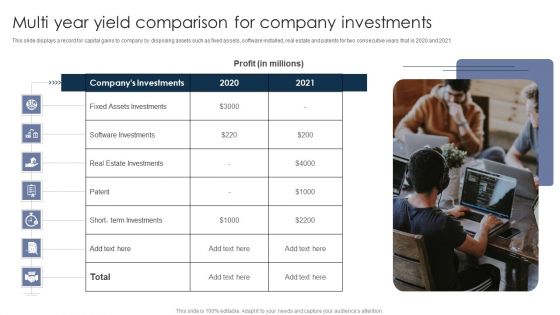
Multi Year Yield Comparison For Company Investments Ppt PowerPoint Presentation Pictures Layouts PDF
This slide displays a record for capital gains to company by disposing assets such as fixed assets, software installed, real estate and patents for two consecutive years that is 2020 and 2021.Presenting Multi Year Yield Comparison For Company Investments Ppt PowerPoint Presentation Pictures Layouts PDF to dispense important information. This template comprises one stage. It also presents valuable insights into the topics including Assets Investments, Estate Investments, Term Investments. This is a completely customizable PowerPoint theme that can be put to use immediately. So, download it and address the topic impactfully.

Line Comparison Graph For Yearly Liquidity Ratio Analysis Comparison Topics PDF
This slide showcases liquidity ratios graph that can help in identifying cash richness and financial position of organization. It showcases comparison for last 6 years and it key components are current ratio, quick ratio and cash ratio. Showcasing this set of slides titled Line Comparison Graph For Yearly Liquidity Ratio Analysis Comparison Topics PDF. The topics addressed in these templates are Term Financing, Cash Shortage, Cash Ratio. All the content presented in this PPT design is completely editable. Download it and make adjustments in color, background, font etc. as per your unique business setting.
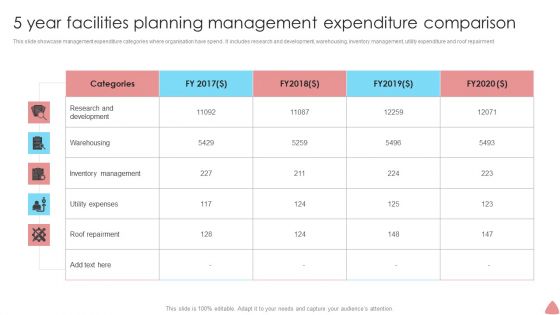
5 Year Facilities Planning Management Expenditure Comparison Rules PDF
Showcasing this set of slides titled 5 Year Facilities Planning Management Expenditure Comparison Rules PDF. The topics addressed in these templates are Research And Development, Inventory Management, Warehousing. All the content presented in this PPT design is completely editable. Download it and make adjustments in color, background, font etc. as per your unique business setting.
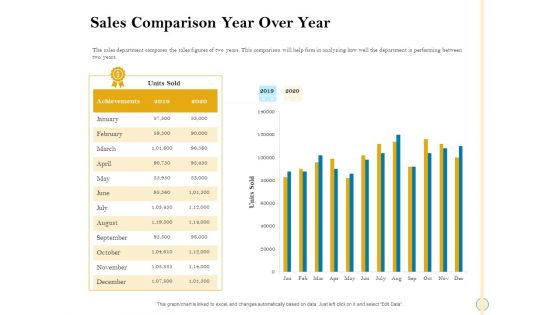
Sales Optimization Best Practices To Close More Deals Sales Comparison Year Over Year Structure PDF
The sales department compares the sales figures of two years. This comparison will help firm in analyzing how well the department is performing between two years. Deliver an awe inspiring pitch with this creative sales optimization best practices to close more deals sales comparison year over year structure pdf bundle. Topics like sales comparison year over year can be discussed with this completely editable template. It is available for immediate download depending on the needs and requirements of the user.

Sales Department Strategies Increase Revenues Sales Comparison Year Over Year Infographics PDF
The sales department compares the sales figures of two years. This comparison will help firm in analyzing how well the department is performing between two years. Deliver an awe-inspiring pitch with this creative sales department strategies increase revenues sales comparison year over year infographics pdf bundle. Topics like sales comparison year over year can be discussed with this completely editable template. It is available for immediate download depending on the needs and requirements of the user.

Performance Assessment Sales Initiative Report Sales Comparison Year Over Year Ppt Professional Design Ideas PDF
Presenting this set of slides with name performance assessment sales initiative report sales comparison year over year ppt professional design ideas pdf. The topics discussed in these slide is sales comparison year over year. This is a completely editable PowerPoint presentation and is available for immediate download. Download now and impress your audience.

Sales Assistance Boost Overall Efficiency Sales Comparison Year Over Year Brochure PDF
This slide provides information regarding the brand sales report of last month in terms of the best selling as well as worst selling products of various brands. It will help in recognizing the winners and losers of the month. Deliver an awe-inspiring pitch with this creative sales assistance boost overall efficiency sales comparison year over year brochure pdf bundle. Topics like sales comparison year over year can be discussed with this completely editable template. It is available for immediate download depending on the needs and requirements of the user.
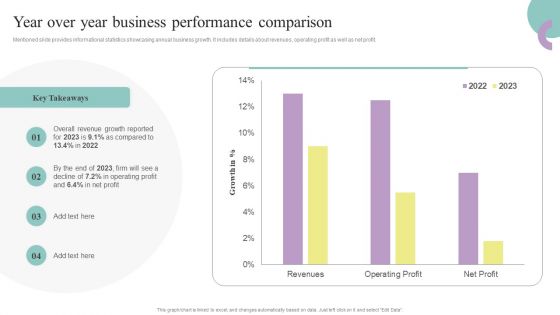
Comprehensive Guide To Enhance Year Over Year Business Performance Comparison Professional PDF
Mentioned slide provides informational statistics showcasing annual business growth. It includes details about revenues, operating profit as well as net profit. From laying roadmaps to briefing everything in detail, our templates are perfect for you. You can set the stage with your presentation slides. All you have to do is download these easy-to-edit and customizable templates. Comprehensive Guide To Enhance Year Over Year Business Performance Comparison Professional PDF will help you deliver an outstanding performance that everyone would remember and praise you for. Do download this presentation today.
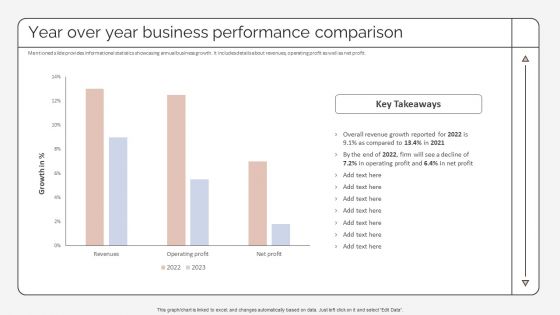
Year Over Year Business Performance Comparison Strategic Promotion Plan Pictures PDF
Mentioned slide provides informational statistics showcasing annual business growth. It includes details about revenues, operating profit as well as net profit. Are you in need of a template that can accommodate all of your creative concepts This one is crafted professionally and can be altered to fit any style. Use it with Google Slides or PowerPoint. Include striking photographs, symbols, depictions, and other visuals. Fill, move around, or remove text boxes as desired. Test out color palettes and font mixtures. Edit and save your work, or work with colleagues. Download Year Over Year Business Performance Comparison Strategic Promotion Plan Pictures PDF and observe how to make your presentation outstanding. Give an impeccable presentation to your group and make your presentation unforgettable.

Yearly Timeline Comparison Of Loyal Customers Ppt PowerPoint Presentation Pictures Information PDF
This is a yearly timeline comparison of loyal customers ppt powerpoint presentation pictures information pdf template with various stages. Focus and dispense information on two stages using this creative set, that comes with editable features. It contains large content boxes to add your information on topics like timeline analysis of business loyal consumers. You can also showcase facts, figures, and other relevant content using this PPT layout. Grab it now.

Five Yearly Product Comparison Roadmap Based On Multiple Release Versions Guidelines
Presenting our jaw dropping five yearly product comparison roadmap based on multiple release versions guidelines. You can alternate the color, font size, font type, and shapes of this PPT layout according to your strategic process. This PPT presentation is compatible with Google Slides and is available in both standard screen and widescreen aspect ratios. You can also download this well researched PowerPoint template design in different formats like PDF, JPG, and PNG. So utilize this visually appealing design by clicking the download button given below.
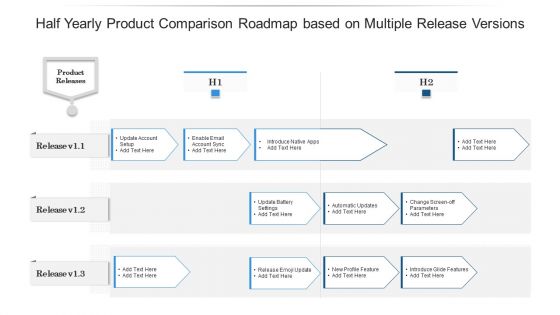
Half Yearly Product Comparison Roadmap Based On Multiple Release Versions Information
Presenting our jaw dropping half yearly product comparison roadmap based on multiple release versions information. You can alternate the color, font size, font type, and shapes of this PPT layout according to your strategic process. This PPT presentation is compatible with Google Slides and is available in both standard screen and widescreen aspect ratios. You can also download this well researched PowerPoint template design in different formats like PDF, JPG, and PNG. So utilize this visually appealing design by clicking the download button given below.
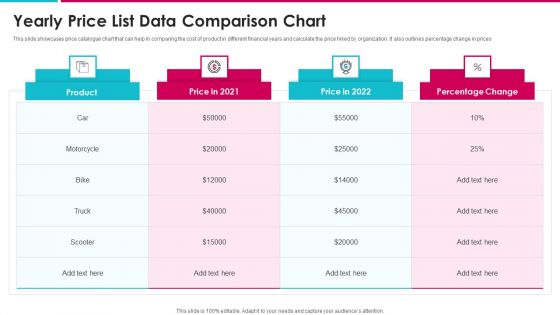
Yearly Price List Data Comparison Chart Structure PDF
This slide showcases price catalogue chart that can help in comparing the cost of product in different financial years and calculate the price hiked by organization. It also outlines percentage change in prices Showcasing this set of slides titled yearly price list data comparison chart structure pdf. The topics addressed in these templates are yearly price list data comparison chart. All the content presented in this PPT design is completely editable. Download it and make adjustments in color, background, font etc. as per your unique business setting.

Three Years Customer Sales Performance Comparison Chart Professional PDF
This slide shows the comparative analysis of sales to top five Customers in the last years. It includes sales from 2021 to 2023. Pitch your topic with ease and precision using this Three Years Customer Sales Performance Comparison Chart Professional PDF. This layout presents information on Highest Sales, Customer Relationships, Lowest Sales. It is also available for immediate download and adjustment. So, changes can be made in the color, design, graphics or any other component to create a unique layout.

Collection Of Quality Assurance PPT Sample Box And Whisker Plot For Two Year Sales Comparison Elements PDF
Following slide illustrates sample two to year sales comparison box and whisker plot along with key takeaways. Users can edit it as per their requirement. Deliver an awe inspiring pitch with this creative collection of quality assurance ppt sample box and whisker plot for two year sales comparison elements pdf bundle. Topics like graph, data can be discussed with this completely editable template. It is available for immediate download depending on the needs and requirements of the user.
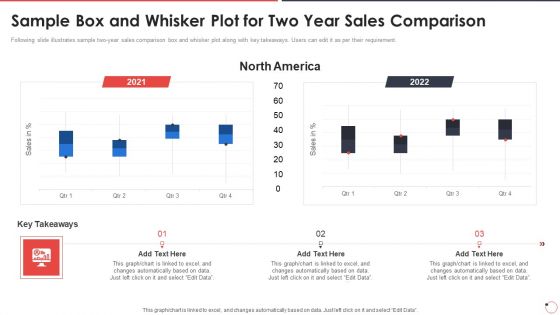
Quality Assurance Templates Set 1 Sample Box And Whisker Plot For Two Year Sales Comparison Ppt Slides Visual Aids PDF
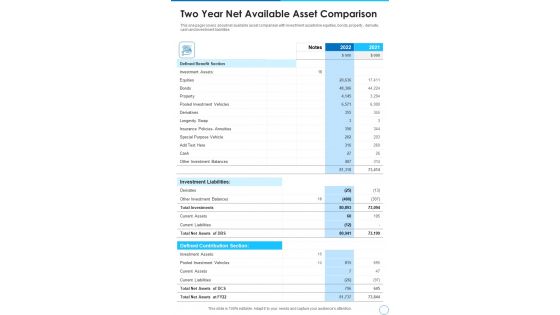
Two Year Net Available Asset Comparison Template 139 One Pager Documents
Presenting you a fantastic Two Year Net Available Asset Comparison Template 139 One Pager Documents. This piece is crafted on hours of research and professional design efforts to ensure you have the best resource. It is completely editable and its design allow you to rehash its elements to suit your needs. Get this Two Year Net Available Asset Comparison Template 139 One Pager Documents A4 One-pager now.
Three Years Products Sales Comparison Of Business Ppt PowerPoint Presentation Icon Layouts PDF
Presenting three years products sales comparison of business ppt powerpoint presentation icon layouts pdf to dispense important information. This template comprises three stages. It also presents valuable insights into the topics including three years products sales comparison of business. This is a completely customizable PowerPoint theme that can be put to use immediately. So, download it and address the topic impactfully.
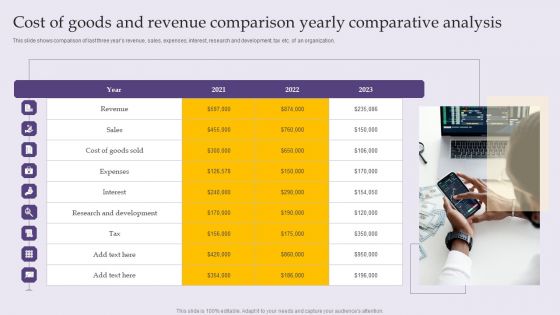
Cost Of Goods And Revenue Comparison Yearly Comparative Analysis Slides PDF
This slide shows comparison of last three years revenue, sales, expenses, interest, research and development, tax etc. of an organization. Pitch your topic with ease and precision using this Cost Of Goods And Revenue Comparison Yearly Comparative Analysis Slides PDF. This layout presents information on Expenses, Research Development, Cost Goods. It is also available for immediate download and adjustment. So, changes can be made in the color, design, graphics or any other component to create a unique layout.
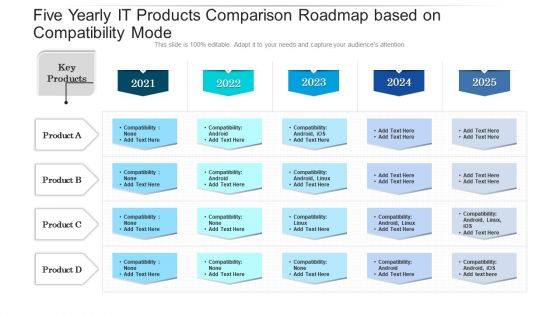
Five Yearly IT Products Comparison Roadmap Based On Compatibility Mode Graphics
Presenting our innovatively structured five yearly it products comparison roadmap based on compatibility mode graphics Template. Showcase your roadmap process in different formats like PDF, PNG, and JPG by clicking the download button below. This PPT design is available in both Standard Screen and Widescreen aspect ratios. It can also be easily personalized and presented with modified font size, font type, color, and shapes to measure your progress in a clear way.
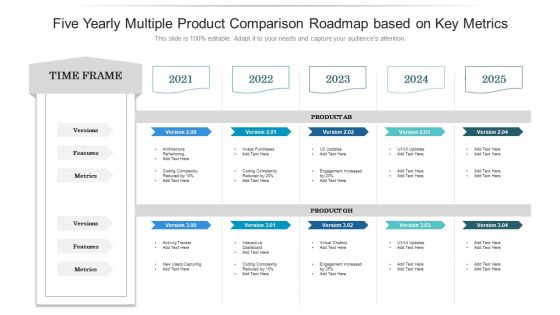
Five Yearly Multiple Product Comparison Roadmap Based On Key Metrics Slides
Introducing our five yearly multiple product comparison roadmap based on key metrics slides. This PPT presentation is Google Slides compatible, therefore, you can share it easily with the collaborators for measuring the progress. Also, the presentation is available in both standard screen and widescreen aspect ratios. So edit the template design by modifying the font size, font type, color, and shapes as per your requirements. As this PPT design is fully editable it can be presented in PDF, JPG and PNG formats.

Half Yearly IT Products Comparison Roadmap Based On Compatibility Mode Structure
Presenting our innovatively structured half yearly it products comparison roadmap based on compatibility mode structure Template. Showcase your roadmap process in different formats like PDF, PNG, and JPG by clicking the download button below. This PPT design is available in both Standard Screen and Widescreen aspect ratios. It can also be easily personalized and presented with modified font size, font type, color, and shapes to measure your progress in a clear way.

Half Yearly Multiple Product Comparison Roadmap Based On Key Metrics Download
Introducing our half yearly multiple product comparison roadmap based on key metrics download. This PPT presentation is Google Slides compatible, therefore, you can share it easily with the collaborators for measuring the progress. Also, the presentation is available in both standard screen and widescreen aspect ratios. So edit the template design by modifying the font size, font type, color, and shapes as per your requirements. As this PPT design is fully editable it can be presented in PDF, JPG and PNG formats.
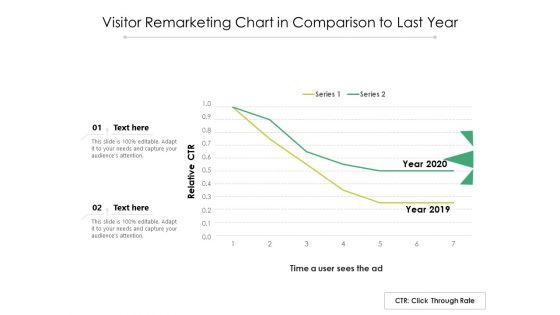
Visitor Remarketing Chart In Comparison To Last Year Ppt PowerPoint Presentation File Themes PDF
Showcasing this set of slides titled visitor remarketing chart in comparison to last year ppt powerpoint presentation file themes pdf. The topics addressed in these templates are visitor remarketing chart in comparison to last year. All the content presented in this PPT design is completely editable. Download it and make adjustments in color, background, font etc. as per your unique business setting.

Annual Comparison Analysis Trends Between Current Year And Previous Year Rules PDF
The slide shows the comparative analysis trend of an business product between current year and previous year. The slide shows an increasing trend with a dip at the end of the year. Showcasing this set of slides titled Annual Comparison Analysis Trends Between Current Year And Previous Year Rules PDF. The topics addressed in these templates are Annual Comparison, Analysis Trends, Between Current . All the content presented in this PPT design is completely editable. Download it and make adjustments in color, background, font etc. as per your unique business setting.
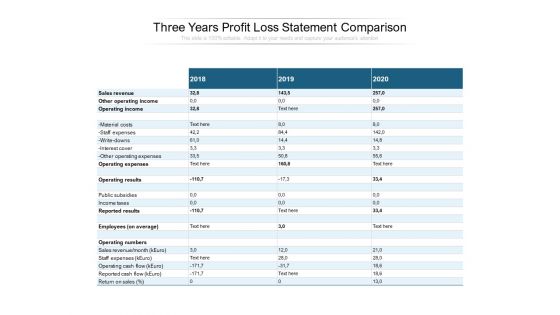
Three Years Profit Loss Statement Comparison Ppt PowerPoint Presentation Professional Design Templates
Presenting this set of slides with name three years profit loss statement comparison ppt powerpoint presentation professional design templates. The topics discussed in these slides are sales revenue, other operating income, operating expenses, operating results, employees. This is a completely editable PowerPoint presentation and is available for immediate download. Download now and impress your audience.

Outsource Bookkeeping Service Manage Financial Transactions Income Statement Analysis Comparison Two Years Mockup PDF
Presenting this set of slides with name outsource bookkeeping service manage financial transactions income statement analysis comparison two years mockup pdf. The topics discussed in these slides are cost, expenses, administrative, gross profit, operating profit. This is a completely editable PowerPoint presentation and is available for immediate download. Download now and impress your audience.

Loan Scorecard Individual Credit Rating Scorecard In Comparison With Previous Years Ppt Infographic Template Graphics PDF
Deliver and pitch your topic in the best possible manner with this loan scorecard individual credit rating scorecard in comparison with previous years ppt infographic template graphics pdf. Use them to share invaluable insights on individual credit rating scorecard in comparison with previous years and impress your audience. This template can be altered and modified as per your expectations. So, grab it now.
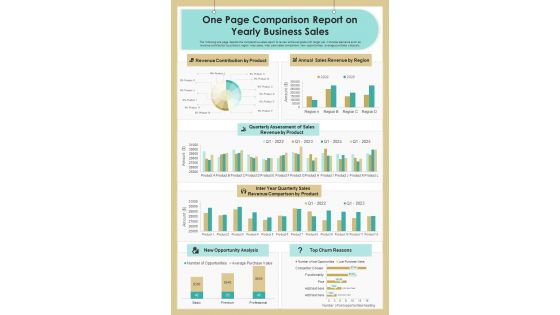
One Page Comparison Report On Yearly Business Sales PDF Document PPT Template
Presenting you an exemplary One Page Comparison Report On Yearly Business Sales PDF Document PPT Template. Our one-pager template comprises all the must-have essentials of an inclusive document. You can edit it with ease, as its layout is completely editable. With such freedom, you can tweak its design and other elements to your requirements. Download this One Page Comparison Report On Yearly Business Sales PDF Document PPT Template Download now.

Five Years Timeline For Product Performance Comparison Ppt PowerPoint Presentation Pictures Introduction PDF
This is a five years timeline for product performance comparison ppt powerpoint presentation pictures introduction pdf template with various stages. Focus and dispense information on six stages using this creative set, that comes with editable features. It contains large content boxes to add your information on topics like five years timeline for product performance comparison 2016 to 2020. You can also showcase facts, figures, and other relevant content using this PPT layout. Grab it now.

Outsourcing Finance Accounting Processes Income Statement Analysis With Comparison For Two Years Template PDF
Presenting this set of slides with name outsourcing finance accounting processes income statement analysis with comparison for two years template pdf. The topics discussed in these slides are cost, expenses, administrative, gross profit, operating profit. This is a completely editable PowerPoint presentation and is available for immediate download. Download now and impress your audience.

Figure Chart Illustrating Data Comparison Of Different Years Ppt PowerPoint Presentation File Inspiration PDF
Pitch your topic with ease and precision using this figure chart illustrating data comparison of different years ppt powerpoint presentation file inspiration pdf. This layout presents information on gross profit, total revenue, operating income. It is also available for immediate download and adjustment. So, changes can be made in the color, design, graphics or any other component to create a unique layout.

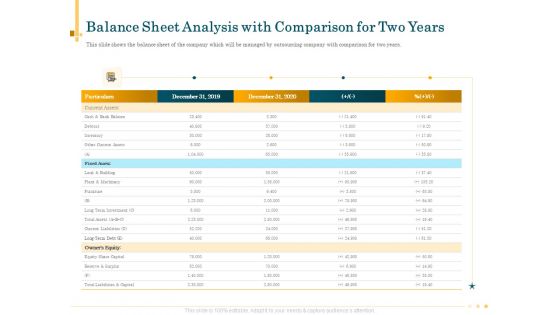
Managing CFO Services Balance Sheet Analysis With Comparison For Two Years Formats PDF
Presenting this set of slides with name managing cfo services balance sheet analysis with comparison for two years formats pdf. The topics discussed in these slides are current assets, fixed assets, owners equity, equity share capital. This is a completely editable PowerPoint presentation and is available for immediate download. Download now and impress your audience.
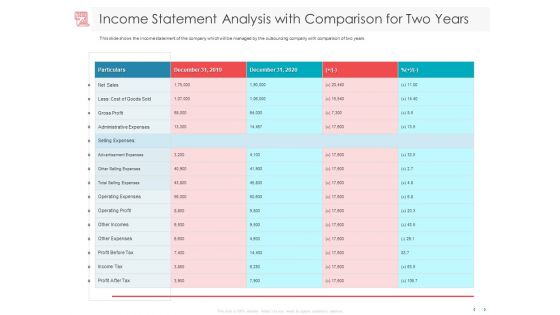
Managing CFO Services Income Statement Analysis With Comparison For Two Years Infographics PDF
Presenting this set of slides with name managing cfo services income statement analysis with comparison for two years infographics pdf. The topics discussed in these slides are net sales, gross profit, operating profit, income tax, operating expenses, administrative expenses, profit before tax. This is a completely editable PowerPoint presentation and is available for immediate download. Download now and impress your audience.

Bar Chart Showing Income Comparison Of Different Years Ppt PowerPoint Presentation Gallery Ideas PDF
Presenting this set of slides with name bar chart showing income comparison of different years ppt powerpoint presentation gallery ideas pdf. The topics discussed in these slides are revenue of first 6 months, revenue of last 6 months. This is a completely editable PowerPoint presentation and is available for immediate download. Download now and impress your audience.
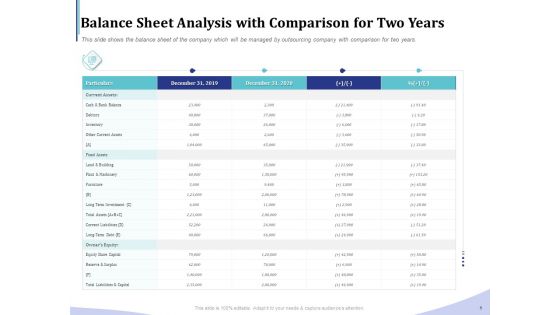
Accounting Bookkeeping Services Balance Sheet Analysis With Comparison For Two Years Mockup PDF
Presenting this set of slides with name accounting bookkeeping services balance sheet analysis with comparison for two years mockup pdf. The topics discussed in these slides are inventory, investment, equity, liabilities, current assets. This is a completely editable PowerPoint presentation and is available for immediate download. Download now and impress your audience.
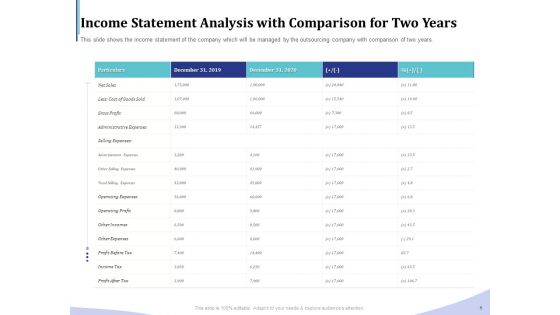
Accounting Bookkeeping Services Income Statement Analysis With Comparison For Two Years Rules PDF
Presenting this set of slides with name accounting bookkeeping services income statement analysis with comparison for two years rules pdf. The topics discussed in these slides are cost, expenses, administrative, gross profit, operating profit. This is a completely editable PowerPoint presentation and is available for immediate download. Download now and impress your audience.

BPO Managing Enterprise Financial Transactions Balance Sheet Analysis With Comparison For Two Years Rules PDF
Presenting this set of slides with name bpo managing enterprise financial transactions balance sheet analysis with comparison for two years rules pdf. The topics discussed in these slides are inventory, investment, equity, liabilities, current assets. This is a completely editable PowerPoint presentation and is available for immediate download. Download now and impress your audience.

BPO Managing Enterprise Financial Transactions Income Statement Analysis With Comparison For Two Years Ideas PDF
Presenting this set of slides with name bpo managing enterprise financial transactions income statement analysis with comparison for two years ideas pdf. The topics discussed in these slides are cost, expenses, administrative, gross profit, operating profit. This is a completely editable PowerPoint presentation and is available for immediate download. Download now and impress your audience.
Outsource Bookkeeping Service Manage Financial Transactions Balance Sheet Analysis With Comparison For Two Years Rules PDF
Presenting this set of slides with name outsource bookkeeping service manage financial transactions balance sheet analysis with comparison for two years rules pdf. The topics discussed in these slides are inventory, investment, equity, liabilities, current assets. This is a completely editable PowerPoint presentation and is available for immediate download. Download now and impress your audience.
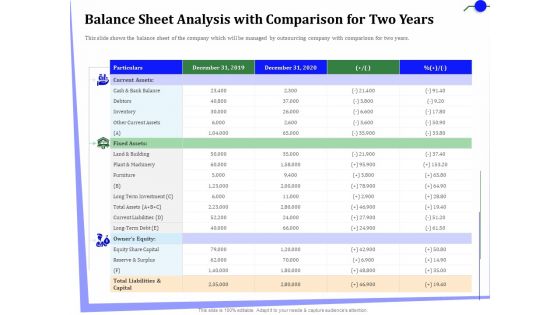
Outsourcing Finance Accounting Processes Balance Sheet Analysis With Comparison For Two Years Rules PDF
Presenting this set of slides with name outsourcing finance accounting processes balance sheet analysis with comparison for two years rules pdf. The topics discussed in these slides are inventory, investment, equity, liabilities, current assets. This is a completely editable PowerPoint presentation and is available for immediate download. Download now and impress your audience.

Comparison Of Business Performance With Five Year Profit Growth Ppt PowerPoint Presentation Layouts Summary PDF
Presenting this set of slides with name comparison of business performance with five year profit growth ppt powerpoint presentation layouts summary pdf. The topics discussed in these slides are market capitalization, current pe, dividend yield, 5 year profit growth, 2020. This is a completely editable PowerPoint presentation and is available for immediate download. Download now and impress your audience.
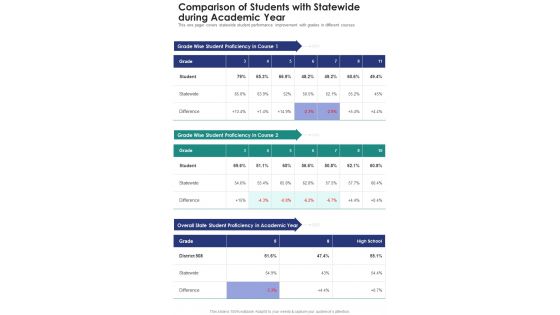
Comparison Of Students With Statewide During Academic Year One Pager Documents
This one pager covers statewide student performance improvement with grades in different courses. Presenting you an exemplary Comparison Of Students With Statewide During Academic Year One Pager Documents. Our one-pager comprises all the must-have essentials of an inclusive document. You can edit it with ease, as its layout is completely editable. With such freedom, you can tweak its design and other elements to your requirements. Download this Comparison Of Students With Statewide During Academic Year One Pager Documents brilliant piece now.

Graph Showing Income Comparison Of Different Companies In Years Ppt PowerPoint Presentation Gallery Clipart PDF
Presenting this set of slides with name graph showing income comparison of different companies in years ppt powerpoint presentation gallery clipart pdf. The topics discussed in these slide is graph showing income comparison of different companies in years. This is a completely editable PowerPoint presentation and is available for immediate download. Download now and impress your audience.
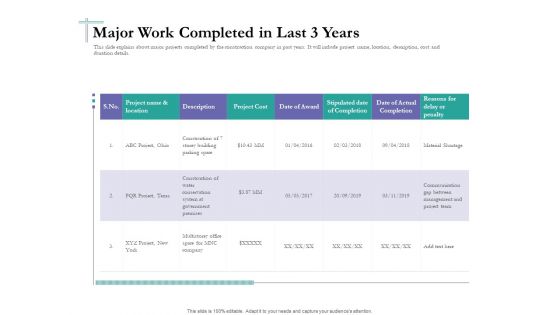
Bidding Cost Comparison Major Work Completed In Last 3 Years Ppt Inspiration Influencers PDF
This slide explains about major projects completed by the construction company in past years. It will include project name, location, description, cost and duration details. Deliver and pitch your topic in the best possible manner with this Bidding Cost Comparison Major Work Completed In Last 3 Years Ppt Inspiration Influencers PDF. Use them to share invaluable insights on project name and location, description, project cost, date of award, stipulated date of completion and impress your audience. This template can be altered and modified as per your expectations. So, grab it now.
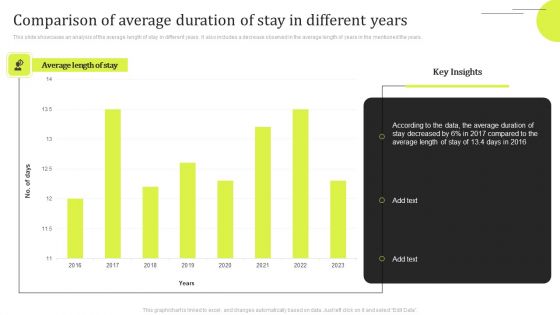
Comparison Of Average Duration Of Stay In Different Years Summary PDF
This slide showcases an analysis of the average length of stay in different years. It also includes a decrease observed in the average length of years in the mentioned the years. Showcasing this set of slides titled Comparison Of Average Duration Of Stay In Different Years Summary PDF. The topics addressed in these templates are Key Insights, Average Duration. All the content presented in this PPT design is completely editable. Download it and make adjustments in color, background, font etc. as per your unique business setting.

Comparison Ppt PowerPoint Presentation Styles Graphics Example
This is a comparison ppt powerpoint presentation styles graphics example. This is a two stage process. The stages in this process are year, comparison, technology, mobile, million.

Comparison Ppt PowerPoint Presentation Guide
This is a comparison ppt powerpoint presentation guide. This is a two stage process. The stages in this process are business, marketing, year, finance, percentage.

Comparison Ppt PowerPoint Presentation File Graphics Template
This is a comparison ppt powerpoint presentation file graphics template. This is a two stage process. The stages in this process are comparison, years, business, marketing, strategy, percentage.

Comparison Ppt PowerPoint Presentation Infographics Templates
This is a comparison ppt powerpoint presentation infographics templates. This is a two stage process. The stages in this process are business, comparison, years, marketing, planning.

Comparison Ppt PowerPoint Presentation File Visual Aids
This is a comparison ppt powerpoint presentation file visual aids. This is a two stage process. The stages in this process are comparison, years, percentage, business, marketing.
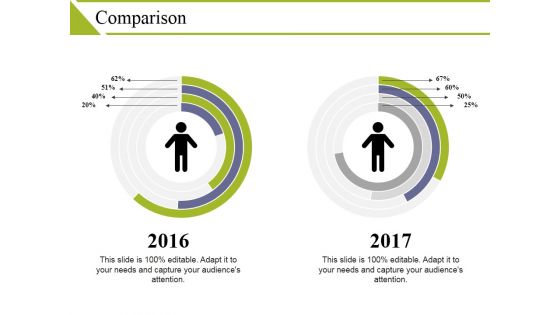
Comparison Ppt PowerPoint Presentation Pictures Objects
This is a comparison ppt powerpoint presentation pictures objects. This is a two stage process. The stages in this process are comparison, percentage, year, business, marketing.

Comparison Ppt PowerPoint Presentation Outline Display
This is a comparison ppt powerpoint presentation outline display. This is a three stage process. The stages in this process are business, marketing, comparison, percentage, years.
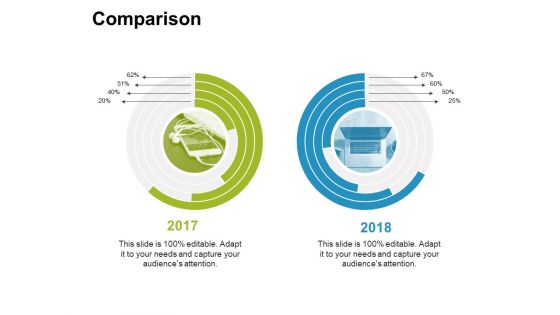
Comparison Ppt PowerPoint Presentation Gallery Slides
This is a comparison ppt powerpoint presentation gallery slides. This is a two stage process. The stages in this process are comparison, percentage, year, business.

Comparison Ppt PowerPoint Presentation Gallery Topics
This is a comparison ppt powerpoint presentation gallery topics. This is a two stage process. The stages in this process are comparison, finance, year, business, marketing.
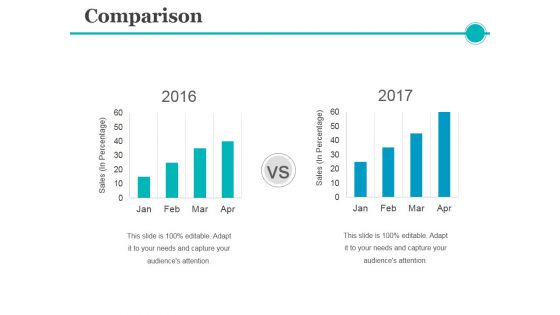
Comparison Ppt PowerPoint Presentation Layouts Example
This is a comparison ppt powerpoint presentation layouts example. This is a two stage process. The stages in this process are sales, year, success, growth, business.
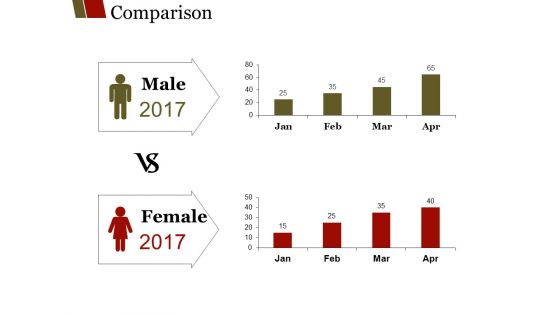
Comparison Ppt PowerPoint Presentation Outline Guidelines
This is a comparison ppt powerpoint presentation outline guidelines. This is a two stage process. The stages in this process are male, years, business, female, marketing.

Comparison Ppt PowerPoint Presentation Layouts Gridlines
This is a comparison ppt powerpoint presentation layouts gridlines. This is a three stage process. The stages in this process are year, growth, success, percentage, finance.
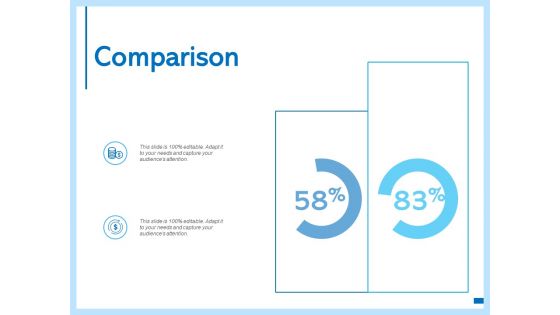
Comparison Management Ppt PowerPoint Presentation Ideas Microsoft
Presenting this set of slides with name comparison management ppt powerpoint presentation ideas microsoft. This is a two stage process. The stages in this process are year, investment balance at start of year, total amount, capital recovery, investment balance at end of year. This is a completely editable PowerPoint presentation and is available for immediate download. Download now and impress your audience.

Comparison Ppt PowerPoint Presentation File Outline
This is a comparison ppt powerpoint presentation file outline. This is a three stage process. The stages in this process are pc users in, laptop users in, mobile users in, years, percentage.

Comparison Ppt PowerPoint Presentation Slides Structure
This is a comparison ppt powerpoint presentation slides structure. This is a three stage process. The stages in this process are pc users in, laptop users in, mobile users in, technology, years.

Year Over Year Operations Performance Ppt Infographic Template Shapes PDF
Following slide compares operations performance of the company in financial years 2018 and 2019. It covers production volume, sales revenues, number of active manufacturing plant status and most common defects.Deliver and pitch your topic in the best possible manner with this year over year operations performance ppt infographic template shapes pdf. Use them to share invaluable insights on most common defects, most common defects, active manufacturing plants, production volume and impress your audience. This template can be altered and modified as per your expectations. So, grab it now.

Year Over Year Revenue Generation Highlights Inspiration PDF
Following slide illustrates statistics of revenue generation. It depicts that company achieved its highest revenue generation mark in H2 2020. This Year Over Year Revenue Generation Highlights Inspiration PDF from Slidegeeks makes it easy to present information on your topic with precision. It provides customization options, so you can make changes to the colors, design, graphics, or any other component to create a unique layout. It is also available for immediate download, so you can begin using it right away. Slidegeeks has done good research to ensure that you have everything you need to make your presentation stand out. Make a name out there for a brilliant performance.
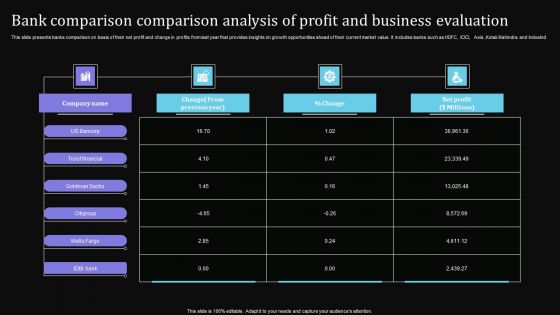
Bank Comparison Comparison Analysis Of Profit And Business Evaluation Designs PDF

Annual Sales Capability Comparison And Forecasting Guidelines PDF
This slide illustrates yearly sales comparison of a corporation for evaluating future potential. It includes pipeline, growth rate, conversion rate, total sold units, cost per unit, revenue etc. Showcasing this set of slides titled Annual Sales Capability Comparison And Forecasting Guidelines PDF. The topics addressed in these templates are Annual Sales Capability, Comparison And Forecasting. All the content presented in this PPT design is completely editable. Download it and make adjustments in color, background, font etc. as per your unique business setting.

Global Electric Vehicle Stock Growth Annual Comparison Ideas PDF
The purpose of this slide is to highlight the year over year stock growth comparison of worldwide global electric vehicles. The vehicle category includes plug in hybrid electric, battery electric vehicle. Showcasing this set of slides titled Global Electric Vehicle Stock Growth Annual Comparison Ideas PDF. The topics addressed in these templates are Electric Vehicles, Stock Minimum, Highest. All the content presented in this PPT design is completely editable. Download it and make adjustments in color, background, font etc. as per your unique business setting.

6 Months Company Revenue Comparison Dashboard Graphics PDF
This slide showcases the half yearly profit comparison dashboard. It also includes comparison kp is such as monthly profit, profit margin growth, branch profit percentage, top 3 profitable products, etc. Showcasing this set of slides titled 6 Months Company Revenue Comparison Dashboard Graphics PDF. The topics addressed in these templates are Growth Rate, Overall Profit Margin, Branch Profit. All the content presented in this PPT design is completely editable. Download it and make adjustments in color, background, font etc. as per your unique business setting.

Software Sales And Comparison Analysis Of Profit Dashboard Sample PDF
This slide presents software sales and profit comparison dashboard highlighting yearly growth. It shows increase in sales, profit, number of sales and comparison of 3 different software. Showcasing this set of slides titled Software Sales And Comparison Analysis Of Profit Dashboard Sample PDF. The topics addressed in these templates are Increase Sales, Profit, Sales Dashboard. All the content presented in this PPT design is completely editable. Download it and make adjustments in color, background, font etc. as per your unique business setting.

Revenue And Operating Expenses Comparison Historical Vs Forecasted Background PDF
The slide provides the comparison of revenue and operating expenses for the year 2015 2020 historical and 2021 2024 forecasted. Deliver an awe-inspiring pitch with this creative revenue and operating expenses comparison historical vs forecasted background pdf. bundle. Topics like revenue and operating expenses comparison historical vs forecasted can be discussed with this completely editable template. It is available for immediate download depending on the needs and requirements of the user.
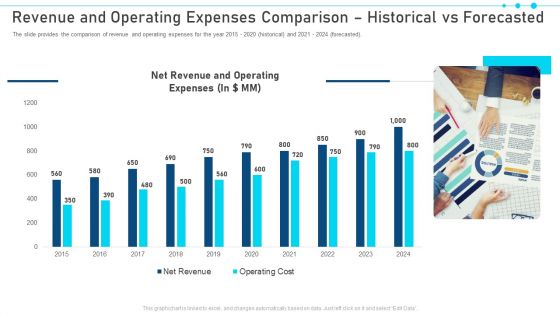
Revenue And Operating Expenses Comparison Historical Vs Forecasted Pictures PDF
The slide provides the comparison of revenue and operating expenses for the year 2015 2020 historical and 2021 2024 forecasted. Deliver an awe-inspiring pitch with this creative revenue and operating expenses comparison historical vs forecasted pictures pdf. bundle. Topics like revenue and operating expenses comparison historical vs forecasted can be discussed with this completely editable template. It is available for immediate download depending on the needs and requirements of the user.
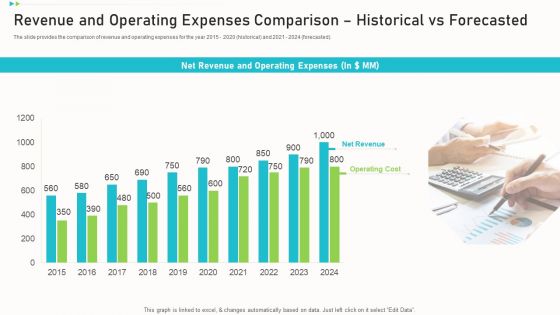
Revenue And Operating Expenses Comparison Historical Vs Forecasted Summary PDF
The slide provides the comparison of revenue and operating expenses for the year 2015 - 2020 historical and 2021 - 2024 forecasted. Deliver an awe inspiring pitch with this creative revenue and operating expenses comparison historical vs forecasted summary pdf bundle. Topics like net revenue, operating cost, operating expenses can be discussed with this completely editable template. It is available for immediate download depending on the needs and requirements of the user.

2 Year Data Management Evolution Infographics PDF
This slide signifies the 2 year Evolution on data management. It comparison includes data system, governance, sourcing with vision. Showcasing this set of slides titled 2 Year Data Management Evolution Infographics PDF. The topics addressed in these templates are Data Sourcing, Governance, Data System. All the content presented in this PPT design is completely editable. Download it and make adjustments in color, background, font etc. as per your unique business setting.
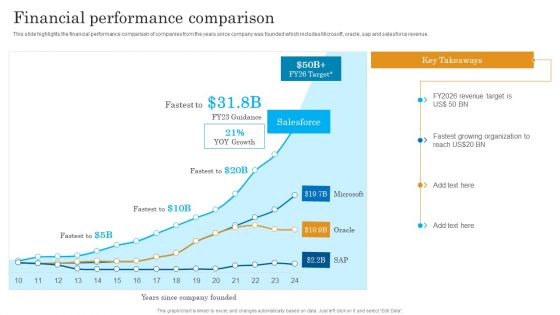
Financial Performance Comparison Salesforce Business Profile Demonstration PDF
This slide highlights the financial performance comparison of companies from the years since company was founded which includes Microsoft, oracle, sap and salesforce revenue. Deliver an awe inspiring pitch with this creative Financial Performance Comparison Salesforce Business Profile Demonstration PDF bundle. Topics like Target, Salesforce, Organization can be discussed with this completely editable template. It is available for immediate download depending on the needs and requirements of the user.

Vendor Management Audit Supplier Audited Performance Comparison Matrix
Following slide provides detailed conclusion of supplier audit report comparison with previous year performance. It includes standard score, previous score, current score and variance. Presenting this PowerPoint presentation, titled Vendor Management Audit Supplier Audited Performance Comparison Matrix, with topics curated by our researchers after extensive research. This editable presentation is available for immediate download and provides attractive features when used. Download now and captivate your audience. Presenting this Vendor Management Audit Supplier Audited Performance Comparison Matrix. Our researchers have carefully researched and created these slides with all aspects taken into consideration. This is a completely customizable Vendor Management Audit Supplier Audited Performance Comparison Matrix that is available for immediate downloading. Download now and make an impact on your audience. Highlight the attractive features available with our PPTs.

Strategic Supplier Evaluation Supplier Audited Performance Comparison Matrix
Following slide provides detailed conclusion of supplier audit report comparison with previous year performance. It includes standard score, previous score, current score and variance. Retrieve professionally designed Strategic Supplier Evaluation Supplier Audited Performance Comparison Matrix to effectively convey your message and captivate your listeners. Save time by selecting pre-made slideshows that are appropriate for various topics, from business to educational purposes. These themes come in many different styles, from creative to corporate, and all of them are easily adjustable and can be edited quickly. Access them as PowerPoint templates or as Google Slides themes. You do not have to go on a hunt for the perfect presentation because Slidegeeks got you covered from everywhere.
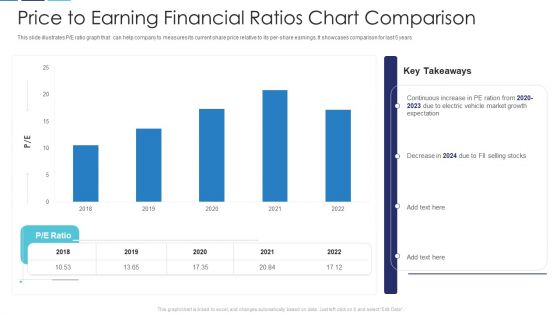
Price To Earning Financial Ratios Chart Comparison Slides PDF
This slide illustrates P or E ratio graph that can help company to measures its current share price relative to its per-share earnings. It showcases comparison for last 5 years Showcasing this set of slides titled price to earning financial ratios chart comparison slides pdf. The topics addressed in these templates are price to earning financial ratios chart comparison. All the content presented in this PPT design is completely editable. Download it and make adjustments in color, background, font etc. as per your unique business setting.

Web Hosting Software Company Outline Financial Performance Comparison Themes PDF
This slide highlights the financial performance comparison of companies from the years since company was founded which includes microsoft, oracle, sap and salesforce revenue. Get a simple yet stunning designed Web Hosting Software Company Outline Financial Performance Comparison Themes PDF. It is the best one to establish the tone in your meetings. It is an excellent way to make your presentations highly effective. So, download this PPT today from Slidegeeks and see the positive impacts. Our easy to edit Web Hosting Software Company Outline Financial Performance Comparison Themes PDF can be your go to option for all upcoming conferences and meetings. So, what are you waiting for Grab this template today.

Dividend Payout Financial Ratios Chart Comparison Themes PDF
This slide showcases dividend payout ratio graph that can help organization to determine the percentage of the companys earnings that is paid out to shareholders by way of dividend. It showcases comparison for a period of 8 years Showcasing this set of slides titled dividend payout financial ratios chart comparison themes pdf. The topics addressed in these templates are dividend payout financial ratios chart comparison. All the content presented in this PPT design is completely editable. Download it and make adjustments in color, background, font etc. as per your unique business setting.

IT Business Valuation Comparison Chart Ppt Model Themes PDF
This slide shows the comparison amongst valuation of three information technology companies. It includes data of last four years. Showcasing this set of slides titled IT Business Valuation Comparison Chart Ppt Model Themes PDF. The topics addressed in these templates are Key Takeaways, Increasing Competition, Innovative Products . All the content presented in this PPT design is completely editable. Download it and make adjustments in color, background, font etc. as per your unique business setting.
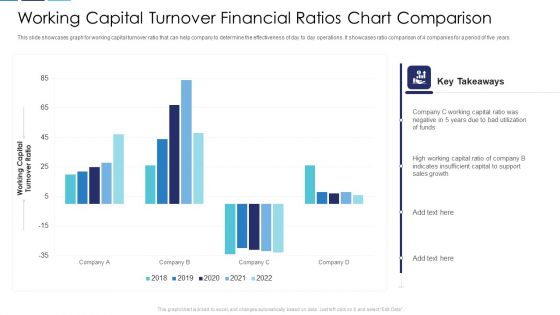
Working Capital Turnover Financial Ratios Chart Comparison Clipart PDF
This slide showcases graph for working capital turnover ratio that can help company to determine the effectiveness of day to day operations. It showcases ratio comparison of 4 companies for a period of five years Pitch your topic with ease and precision using this working capital turnover financial ratios chart comparison clipart pdf. This layout presents information on working capital turnover financial ratios chart comparison. It is also available for immediate download and adjustment. So, changes can be made in the color, design, graphics or any other component to create a unique layout.
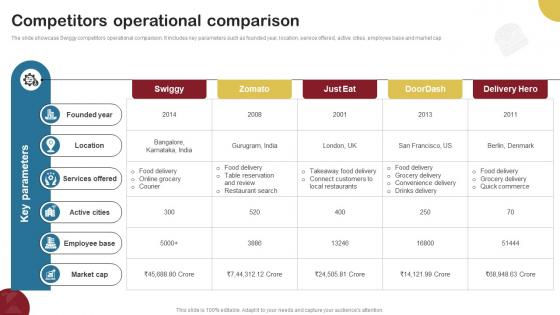
Competitors Operational Comparison Food Delivery Company Profile CP SS V
The slide showcase Swiggy competitors operational comparison. It includes key parameters such as founded year, location, service offered, active cities, employee base and market cap. From laying roadmaps to briefing everything in detail, our templates are perfect for you. You can set the stage with your presentation slides. All you have to do is download these easy-to-edit and customizable templates. Competitors Operational Comparison Food Delivery Company Profile CP SS V will help you deliver an outstanding performance that everyone would remember and praise you for. Do download this presentation today.
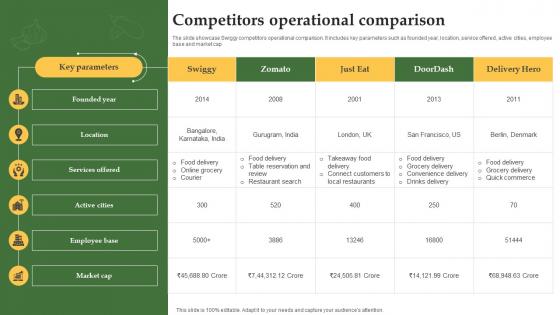
Competitors Operational Comparison Grocery Delivery Company Profile CP SS V
The slide showcase Swiggy competitors operational comparison. It includes key parameters such as founded year, location, service offered, active cities, employee base and market cap. From laying roadmaps to briefing everything in detail, our templates are perfect for you. You can set the stage with your presentation slides. All you have to do is download these easy-to-edit and customizable templates. Competitors Operational Comparison Grocery Delivery Company Profile CP SS V will help you deliver an outstanding performance that everyone would remember and praise you for. Do download this presentation today.

Hospital Medical Research Company Profile Competitor Comparison Inspiration PDF
The slide showcases the healthcare company historical yearly growth for profit and revenue. It also showcases comparative revenue and profit year on year growth for pharmacy, hospital and research business verticals. Deliver an awe inspiring pitch with this creative Hospital Medical Research Company Profile Competitor Comparison Inspiration PDF bundle. Topics like Global Market, Share 2022, Global Research, Market Share 2022 can be discussed with this completely editable template. It is available for immediate download depending on the needs and requirements of the user.
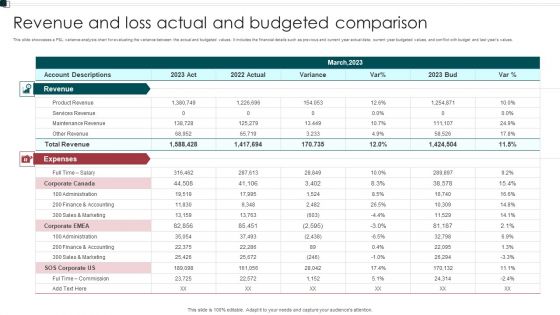
Revenue And Loss Actual And Budgeted Comparison Elements PDF
This slide showcases a P and L variance analysis chart for evaluating the variance between the actual and budgeted values. It includes the financial details such as previous and current year actual data current year budgeted values, and conflict with budget and last years values. Showcasing this set of slides titled Revenue And Loss Actual And Budgeted Comparison Elements PDF. The topics addressed in these templates are Expenses, Administration, Commission. All the content presented in this PPT design is completely editable. Download it and make adjustments in color, background, font etc. as per your unique business setting.

Annual Growth Comparison Of Online Health Industry Rules PDF
The purpose of this slide is to outline the healthcare online market revenue growth year over year influenced by expanding penetration among new consumer groups. Certain online tactics include digital advertising, online inquiry, online medicine delivery, etc. Showcasing this set of slides titled Annual Growth Comparison Of Online Health Industry Rules PDF. The topics addressed in these templates are Evolutionary Years, Online Health Insurance, Digital Advertising. All the content presented in this PPT design is completely editable. Download it and make adjustments in color, background, font etc. as per your unique business setting.

Companys Competitor Comparison Framework Ppt Infographic Template Example 2015 PDF
This slide provides competitive analysis with respect to the competitors based on some paraments like Revenue, Preferred Online Channel, Media Strategy, Global Market Share, Target Audience etc. Deliver and pitch your topic in the best possible manner with this companys competitor comparison framework ppt infographic template example 2015 pdf. Use them to share invaluable insights on media strategy, global market share, target audience, customer base, revenue, founding year and impress your audience. This template can be altered and modified as per your expectations. So, grab it now.

Revenue And Expenses Comparison Historical And Projection Designs PDF
The slide provides the comparative graph of companys revenue and expenses for last 5 years historical and coming 4 years forecasted. Deliver an awe inspiring pitch with this creative revenue and expenses comparison historical and projection designs pdf bundle. Topics like revenue and expenses comparison historical and projection can be discussed with this completely editable template. It is available for immediate download depending on the needs and requirements of the user.
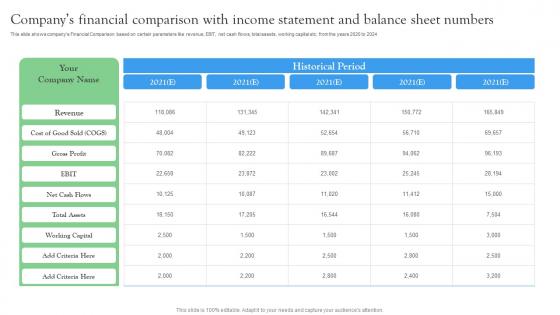
Companys Financial Comparison With Income Startup Investment Sources Summary Pdf
This slide shows companys Financial Comparison based on certain parameters like revenue, EBIT, net cash flows, total assets, working capital etc. from the years 2020 to 2024. There are so many reasons you need a Companys Financial Comparison With Income Startup Investment Sources Summary Pdf. The first reason is you can not spend time making everything from scratch, Thus, Slidegeeks has made presentation templates for you too. You can easily download these templates from our website easily.
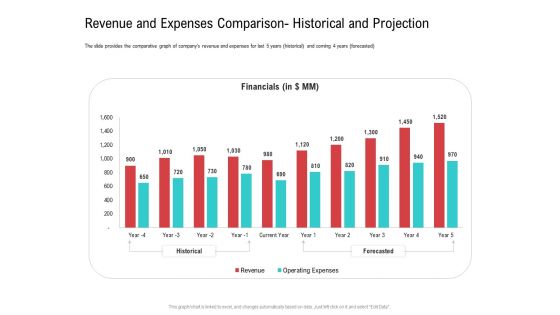
Revenue And Expenses Comparison Historical And Projection Professional PDF
The slide provides the comparative graph of companys revenue and expenses for last 5 years historical and coming 4 years forecasted. Deliver and pitch your topic in the best possible manner with this revenue and expenses comparison historical and projection professional pdf. Use them to share invaluable insights on revenue, financial, operating expenses and impress your audience. This template can be altered and modified as per your expectations. So, grab it now.

Revenue And Expenses Comparison Historical And Projection Structure PDF
The slide provides the comparative graph of companys revenue and expenses for last 5 years historical and coming 4 years forecasted. Deliver an awe-inspiring pitch with this creative revenue and expenses comparison historical and projection structure pdf bundle. Topics like financials, revenue, operating expenses can be discussed with this completely editable template. It is available for immediate download depending on the needs and requirements of the user.
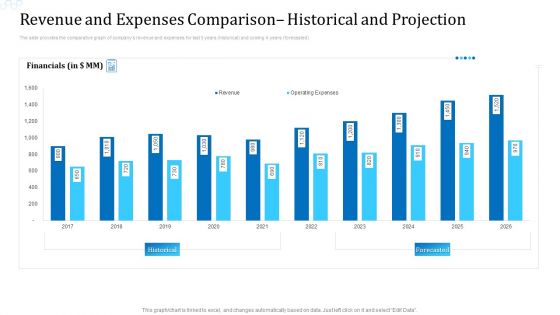
Revenue And Expenses Comparison Historical And Projection Mockup PDF
The slide provides the comparative graph of companys revenue and expenses for last 5 years historical and coming 4 years forecasted. Deliver an awe inspiring pitch with this creative revenue and expenses comparison historical and projection mockup pdf bundle. Topics like financials, revenue, expenses can be discussed with this completely editable template. It is available for immediate download depending on the needs and requirements of the user.

Battery Chart With Percentage Values For Comparison PowerPoint Slides
This year?s sales has matched up with your expectations. Now match this slide with your presentation to show the same. Show your company?s performance or business growth with this four staged battery chart PowerPoint template. With this slide, you can easily convince your colleagues how your company gave a tremendous growth over the years or months. Perfect illustration to show that the targets are achieved. This PPT template is easy to edit. You can choose the color of your choice. Your colleagues are already impressed with the sales growth. Now impress others and choose this PPT innovative designed template.
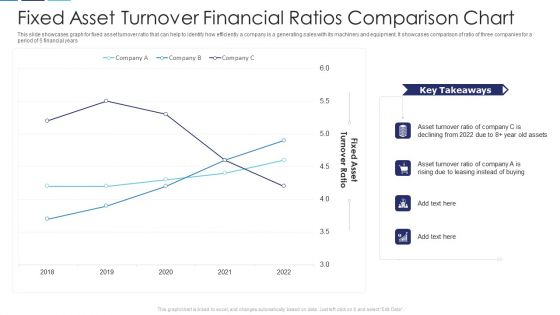
Fixed Asset Turnover Financial Ratios Comparison Chart Structure PDF
This slide showcases graph for fixed asset turnover ratio that can help to identify how efficiently a company is a generating sales with its machinery and equipment. It showcases comparison of ratio of three companies for a period of 5 financial years Showcasing this set of slides titled fixed asset turnover financial ratios comparison chart structure pdf. The topics addressed in these templates are fixed asset turnover financial ratios comparison chart. All the content presented in this PPT design is completely editable. Download it and make adjustments in color, background, font etc. as per your unique business setting.
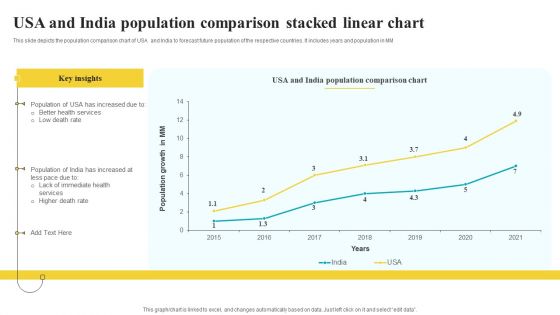
Usa And India Population Comparison Stacked Linear Chart Guidelines PDF
This slide depicts the population comparison chart of USA and India to forecast future population of the respective countries. It includes years and population in MM Pitch your topic with ease and precision using this Usa And India Population Comparison Stacked Linear Chart Guidelines PDF. This layout presents information on Key Insights, Population Growth, Comparison Chart. It is also available for immediate download and adjustment. So, changes can be made in the color, design, graphics or any other component to create a unique layout.
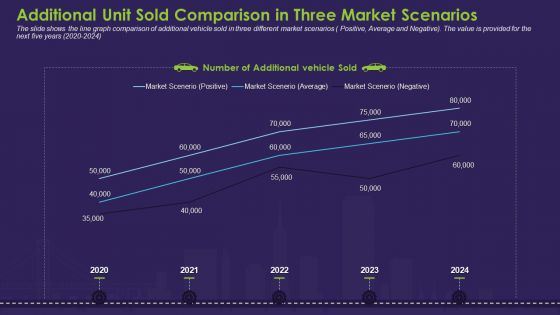
Additional Unit Sold Comparison In Three Market Scenarios Introduction PDF
The slide shows the line graph comparison of additional vehicle sold in three different market scenarios Positive, Average and Negative. The value is provided for the next five years 2020 to 2024.Deliver an awe-inspiring pitch with this creative additional unit sold comparison in three market scenarios introduction pdf. bundle. Topics like market scenario, positive, market scenario average, market scenario negative, 2020 to 2024 can be discussed with this completely editable template. It is available for immediate download depending on the needs and requirements of the user.

Annual Growth Comparison Of Digital Advertising Market Summary PDF
The purpose of this slide is to highlight the yearly growth of digital marketing due rapid increase in the e commerce industry. The growth trend period includes 2019 2023 along with key insights. Pitch your topic with ease and precision using this Annual Growth Comparison Of Digital Advertising Market Summary PDF. This layout presents information on Digital Marketing, Internet Users, Career Among Youngsters. It is also available for immediate download and adjustment. So, changes can be made in the color, design, graphics or any other component to create a unique layout.

Computer Comparison With Laptop Tablet And Mobile PowerPoint Slides
This PPT template is ideal to help you compare the big screen with small screen electronic gadgets like Laptops, Mac books, Tablets, IOS Pads, Mobiles and I-phones. This template can help differentiate application being used by various customers. Portable Devices can easily be compared with immovable devices by companies with the help of this PowerPoint design. The Technological developments in recent years can easily be represented with this diagram. This slide can be customized to demonstrate as per your needs.
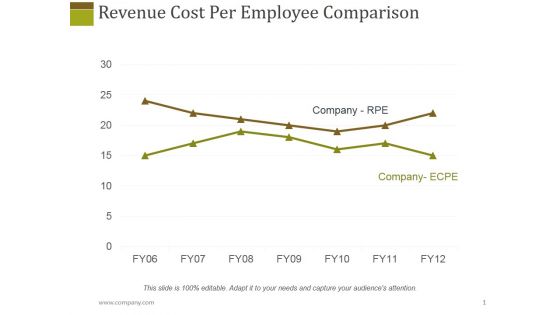
Revenue Cost Per Employee Comparison Ppt PowerPoint Presentation Diagram Lists
This is a revenue cost per employee comparison ppt powerpoint presentation diagram lists. This is a seven stage process. The stages in this process are year, graph, management, finance, company rpe.
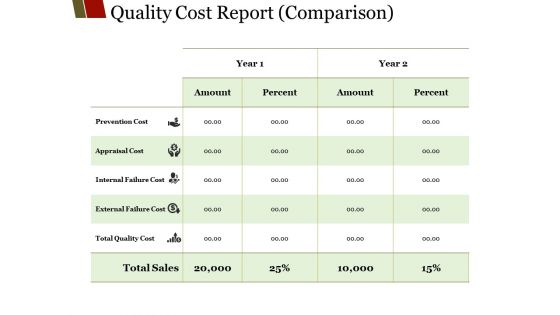
Quality Cost Report Comparison Ppt PowerPoint Presentation Visual Aids Model
This is a quality cost report comparison ppt powerpoint presentation visual aids model. This is a five stage process. The stages in this process are amount, percent, year, prevention cost, prevention cost.

Instagram Company Details Social Network Financial Comparison Portrait PDF
This slide showcases the financial comparison of social media networks which represents platform name, founded year, type, total funding raised, number of active users and revenue. Deliver an awe inspiring pitch with this creative Instagram Company Details Social Network Financial Comparison Portrait PDF bundle. Topics like Social Network Platforms, Revenue can be discussed with this completely editable template. It is available for immediate download depending on the needs and requirements of the user.
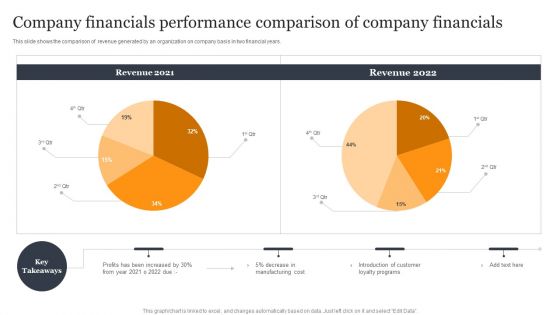
Company Financials Performance Comparison Of Company Financials Formats PDF
This slide shows the comparison of revenue generated by an organization on company basis in two financial years. Pitch your topic with ease and precision using this Company Financials Performance Comparison Of Company Financials Formats PDF. This layout presents information on Manufacturing Cost, Introduction Customer, Loyalty Programs. It is also available for immediate download and adjustment. So, changes can be made in the color, design, graphics or any other component to create a unique layout.

Competitor Comparison By Total Sales And Store Count Formats PDF
The purpose of this slide is to provide glimpse about several competitors and their comparison on the basis of total sales and store count in the present year. Deliver and pitch your topic in the best possible manner with this NAME. Use them to share invaluable insights on competitor comparison by total sales and store count and impress your audience. This template can be altered and modified as per your expectations. So, grab it now.
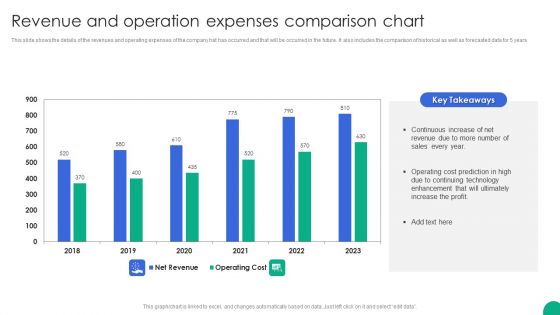
Revenue And Operation Expenses Comparison Chart Slides PDF
This slide shows the details of the revenues and operating expenses of the company hat has occurred and that will be occurred in the future. It also includes the comparison of historical as well as forecasted data for 5 years.Showcasing this set of slides titled Revenue And Operation Expenses Comparison Chart Slides PDF. The topics addressed in these templates are Continuous Increase, Operating Cost, Enhancement Ultimately. All the content presented in this PPT design is completely editable. Download it and make adjustments in color, background, font etc. as per your unique business setting.
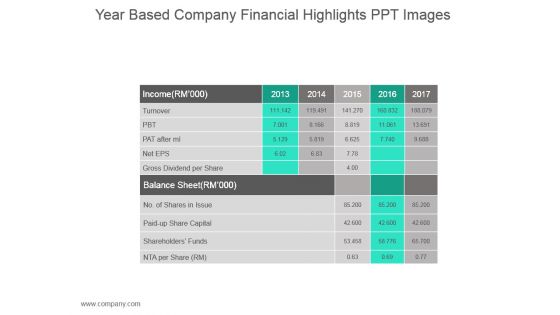
Year Based Company Financial Highlights Ppt Images
This is a year based company financial highlights ppt images. This is a two stage process. The stages in this process are turnover, gross dividend per share, shareholders funds, paid up share capital.

Four Year Sales Plan Timeline Summary PDF
This slide contains Gantt chart which can be used to present four year sales plan. It includes sales target, strategy, goal, etc. Pitch your topic with ease and precision using this Four Year Sales Plan Timeline Summary PDF. This layout presents information on Brand Awareness, Marketing Channel, Sales Target. It is also available for immediate download and adjustment. So, changes can be made in the color, design, graphics or any other component to create a unique layout.

5 Year Software Features Merger Roadmap Guidelines
Introducing our 5 year software features merger roadmap guidelines. This PPT presentation is Google Slides compatible, therefore, you can share it easily with the collaborators for measuring the progress. Also, the presentation is available in both standard screen and widescreen aspect ratios. So edit the template design by modifying the font size, font type, color, and shapes as per your requirements. As this PPT design is fully editable it can be presented in PDF, JPG and PNG formats.

Four Year Digital Marketing Timeline Brochure PDF
Pitch your topic with ease and precision using this Four Year Digital Marketing Timeline Brochure PDF. This layout presents information on Email Marketing, Organic Search, Social Media. It is also available for immediate download and adjustment. So, changes can be made in the color, design, graphics or any other component to create a unique layout.

Quarterly Sales Performance Of Business Dashboard With Region And Product Wise Comparison Guidelines PDF
This slide displays sales analysis for different products and regions in each quarter. t also includes inter year comparisons. Pitch your topic with ease and precision using this Quarterly Sales Performance Of Business Dashboard With Region And Product Wise Comparison Guidelines PDF. This layout presents information on Product Wise Quarterly Sales, Comparison. It is also available for immediate download and adjustment. So, changes can be made in the color, design, graphics or any other component to create a unique layout.
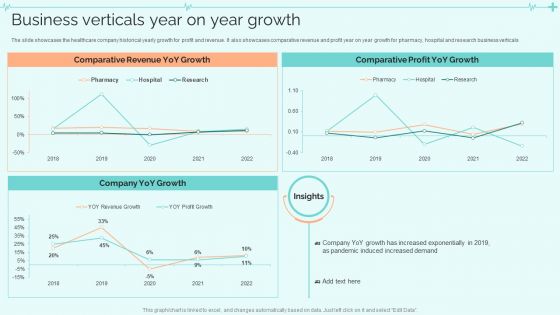
Clinical Services Company Profile Business Verticals Year On Year Growth Graphics PDF
The slide showcases the healthcare company historical yearly growth for profit and revenue. It also showcases comparative revenue and profit year on year growth for pharmacy, hospital and research business verticals. Deliver an awe inspiring pitch with this creative Clinical Services Company Profile Business Verticals Year On Year Growth Graphics PDF bundle. Topics like Comparative Revenue, Comparative Profit, Increased Demand can be discussed with this completely editable template. It is available for immediate download depending on the needs and requirements of the user.
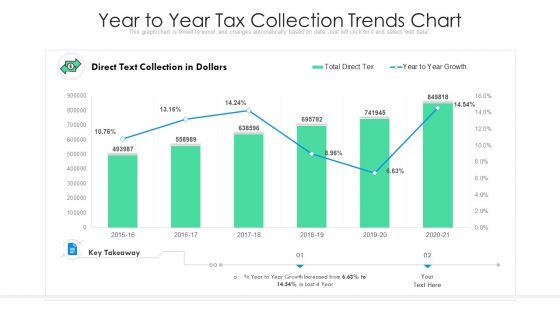
Year To Year Tax Collection Trends Chart Ppt Infographic Template Influencers PDF
Pitch your topic with ease and precision using this year to year tax collection trends chart ppt infographic template influencers pdf. This layout presents information on year to year tax collection trends chart. It is also available for immediate download and adjustment. So, changes can be made in the color, design, graphics or any other component to create a unique layout.

Merger And Acquisition Due Diligence Year Over Year Net Debt Diagrams PDF
This slide shows year over year net debt of the target company. It covers details of net debt and total potential net debt. Deliver and pitch your topic in the best possible manner with this merger and acquisition due diligence year over year net debt diagrams pdf. Use them to share invaluable insights on net debt, compensation liabilities, potential net debt, notes payable and impress your audience. This template can be altered and modified as per your expectations. So, grab it now.
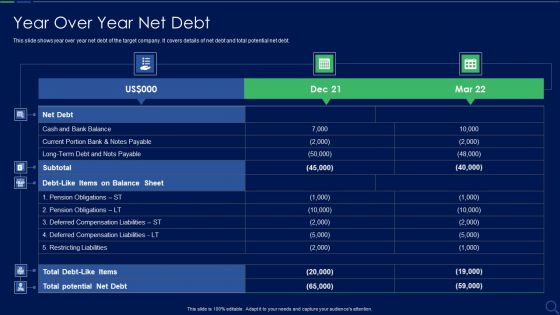
Audit Checklist For Mergers And Acquisitions Year Over Year Net Debt Ideas PDF
This slide shows year over year net debt of the target company. It covers details of net debt and total potential net debt. Deliver an awe inspiring pitch with this creative audit checklist for mergers and acquisitions year over year net debt ideas pdf bundle. Topics like net debt, total potential net debt, cash can be discussed with this completely editable template. It is available for immediate download depending on the needs and requirements of the user.

Due Diligence Process In Merger And Acquisition Agreement Year Over Year Income Statement Download PDF
This slide illustrates year over year income statement of the target company. It covers details such as total revenues, total expenses and income from continuing operations.Deliver an awe inspiring pitch with this creative due diligence process in merger and acquisition agreement year over year income statement download pdf bundle. Topics like commissions expenses, employee benefits, research and development can be discussed with this completely editable template. It is available for immediate download depending on the needs and requirements of the user.

Due Diligence Process In Merger And Acquisition Agreement Year Over Year Net Debt Elements PDF
This slide shows year over year net debt of the target company. It covers details of net debt and total potential net debt.Deliver and pitch your topic in the best possible manner with this due diligence process in merger and acquisition agreement year over year net debt elements pdf Use them to share invaluable insights on current portion, deferred compensation, pension obligations and impress your audience. This template can be altered and modified as per your expectations. So, grab it now.
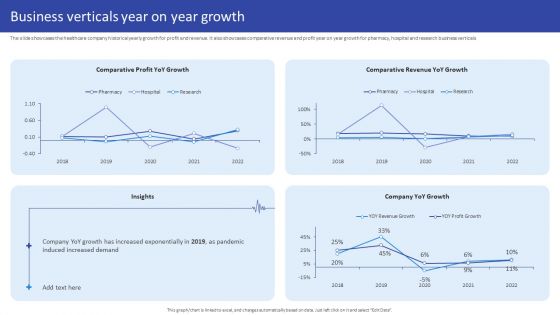
Hospital Medical Research Company Profile Business Verticals Year On Year Growth Themes PDF
The slide showcases the healthcare company historical yearly growth for profit and revenue. It also showcases comparative revenue and profit year on year growth for pharmacy, hospital and research business verticals Deliver an awe inspiring pitch with this creative Hospital Medical Research Company Profile Business Verticals Year On Year Growth Themes PDF bundle. Topics like Comparative Profit, YoY Growth, Comparative Revenue, Company YoY Growth can be discussed with this completely editable template. It is available for immediate download depending on the needs and requirements of the user.

Medical Care Company Overview Business Verticals Year On Year Growth Elements PDF
The slide showcases the healthcare company historical yearly growth for profit and revenue. It also showcases comparative revenue and profit year on year growth for pharmacy, hospital and research business verticals. Deliver an awe inspiring pitch with this creative Medical Care Company Overview Business Verticals Year On Year Growth Elements PDF bundle. Topics like Company Yoy Growth, Comparative Revenue, Comparative Profit can be discussed with this completely editable template. It is available for immediate download depending on the needs and requirements of the user.
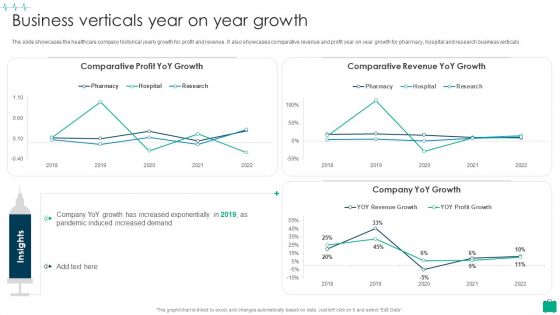
Healthcare Services Company Profile Business Verticals Year On Year Growth Summary PDF
The slide showcases the healthcare company historical yearly growth for profit and revenue. It also showcases comparative revenue and profit year on year growth for pharmacy, hospital and research business verticals.Deliver and pitch your topic in the best possible manner with this Healthcare Services Company Profile Business Verticals Year On Year Growth Summary PDF Use them to share invaluable insights on Comparative Profit, Comparative Revenue, Increased Exponentially and impress your audience. This template can be altered and modified as per your expectations. So, grab it now.

 Home
Home