Year Comparison

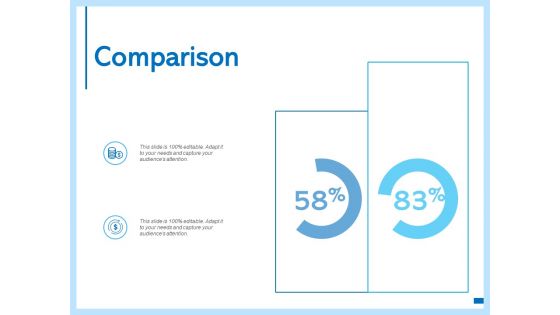
Comparison Ppt PowerPoint Presentation Layouts Gridlines
This is a comparison ppt powerpoint presentation layouts gridlines. This is a three stage process. The stages in this process are year, growth, success, percentage, finance.
Comparison Management Ppt PowerPoint Presentation Ideas Microsoft
Presenting this set of slides with name comparison management ppt powerpoint presentation ideas microsoft. This is a two stage process. The stages in this process are year, investment balance at start of year, total amount, capital recovery, investment balance at end of year. This is a completely editable PowerPoint presentation and is available for immediate download. Download now and impress your audience.

Comparison Ppt PowerPoint Presentation File Outline
This is a comparison ppt powerpoint presentation file outline. This is a three stage process. The stages in this process are pc users in, laptop users in, mobile users in, years, percentage.

Comparison Ppt PowerPoint Presentation Slides Structure
This is a comparison ppt powerpoint presentation slides structure. This is a three stage process. The stages in this process are pc users in, laptop users in, mobile users in, technology, years.

Year Over Year Operations Performance Ppt Infographic Template Shapes PDF
Following slide compares operations performance of the company in financial years 2018 and 2019. It covers production volume, sales revenues, number of active manufacturing plant status and most common defects.Deliver and pitch your topic in the best possible manner with this year over year operations performance ppt infographic template shapes pdf. Use them to share invaluable insights on most common defects, most common defects, active manufacturing plants, production volume and impress your audience. This template can be altered and modified as per your expectations. So, grab it now.

Year Over Year Revenue Generation Highlights Inspiration PDF
Following slide illustrates statistics of revenue generation. It depicts that company achieved its highest revenue generation mark in H2 2020. This Year Over Year Revenue Generation Highlights Inspiration PDF from Slidegeeks makes it easy to present information on your topic with precision. It provides customization options, so you can make changes to the colors, design, graphics, or any other component to create a unique layout. It is also available for immediate download, so you can begin using it right away. Slidegeeks has done good research to ensure that you have everything you need to make your presentation stand out. Make a name out there for a brilliant performance.
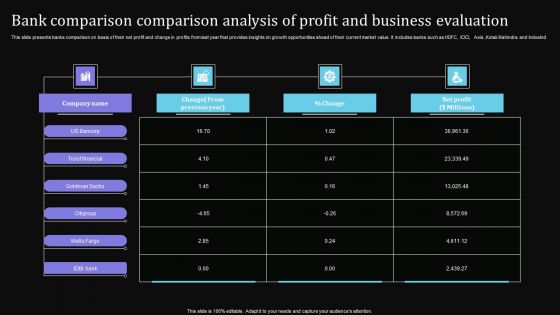
Bank Comparison Comparison Analysis Of Profit And Business Evaluation Designs PDF

Annual Sales Capability Comparison And Forecasting Guidelines PDF
This slide illustrates yearly sales comparison of a corporation for evaluating future potential. It includes pipeline, growth rate, conversion rate, total sold units, cost per unit, revenue etc. Showcasing this set of slides titled Annual Sales Capability Comparison And Forecasting Guidelines PDF. The topics addressed in these templates are Annual Sales Capability, Comparison And Forecasting. All the content presented in this PPT design is completely editable. Download it and make adjustments in color, background, font etc. as per your unique business setting.

Global Electric Vehicle Stock Growth Annual Comparison Ideas PDF
The purpose of this slide is to highlight the year over year stock growth comparison of worldwide global electric vehicles. The vehicle category includes plug in hybrid electric, battery electric vehicle. Showcasing this set of slides titled Global Electric Vehicle Stock Growth Annual Comparison Ideas PDF. The topics addressed in these templates are Electric Vehicles, Stock Minimum, Highest. All the content presented in this PPT design is completely editable. Download it and make adjustments in color, background, font etc. as per your unique business setting.

6 Months Company Revenue Comparison Dashboard Graphics PDF
This slide showcases the half yearly profit comparison dashboard. It also includes comparison kp is such as monthly profit, profit margin growth, branch profit percentage, top 3 profitable products, etc. Showcasing this set of slides titled 6 Months Company Revenue Comparison Dashboard Graphics PDF. The topics addressed in these templates are Growth Rate, Overall Profit Margin, Branch Profit. All the content presented in this PPT design is completely editable. Download it and make adjustments in color, background, font etc. as per your unique business setting.

Software Sales And Comparison Analysis Of Profit Dashboard Sample PDF
This slide presents software sales and profit comparison dashboard highlighting yearly growth. It shows increase in sales, profit, number of sales and comparison of 3 different software. Showcasing this set of slides titled Software Sales And Comparison Analysis Of Profit Dashboard Sample PDF. The topics addressed in these templates are Increase Sales, Profit, Sales Dashboard. All the content presented in this PPT design is completely editable. Download it and make adjustments in color, background, font etc. as per your unique business setting.

Revenue And Operating Expenses Comparison Historical Vs Forecasted Background PDF
The slide provides the comparison of revenue and operating expenses for the year 2015 2020 historical and 2021 2024 forecasted. Deliver an awe-inspiring pitch with this creative revenue and operating expenses comparison historical vs forecasted background pdf. bundle. Topics like revenue and operating expenses comparison historical vs forecasted can be discussed with this completely editable template. It is available for immediate download depending on the needs and requirements of the user.
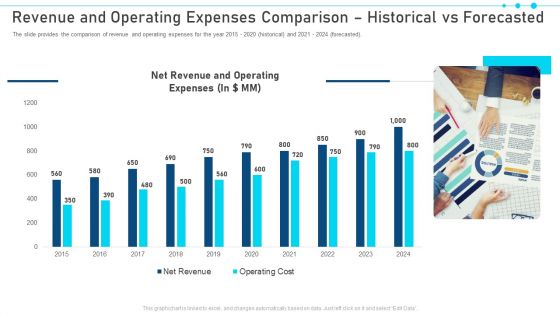
Revenue And Operating Expenses Comparison Historical Vs Forecasted Pictures PDF
The slide provides the comparison of revenue and operating expenses for the year 2015 2020 historical and 2021 2024 forecasted. Deliver an awe-inspiring pitch with this creative revenue and operating expenses comparison historical vs forecasted pictures pdf. bundle. Topics like revenue and operating expenses comparison historical vs forecasted can be discussed with this completely editable template. It is available for immediate download depending on the needs and requirements of the user.
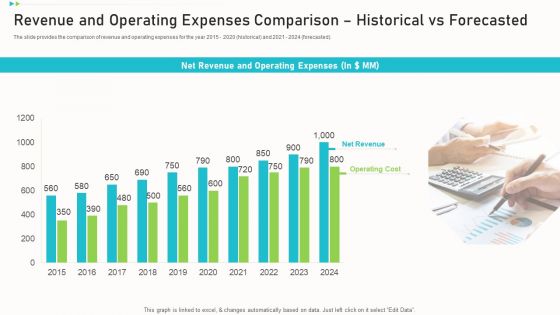
Revenue And Operating Expenses Comparison Historical Vs Forecasted Summary PDF
The slide provides the comparison of revenue and operating expenses for the year 2015 - 2020 historical and 2021 - 2024 forecasted. Deliver an awe inspiring pitch with this creative revenue and operating expenses comparison historical vs forecasted summary pdf bundle. Topics like net revenue, operating cost, operating expenses can be discussed with this completely editable template. It is available for immediate download depending on the needs and requirements of the user.

2 Year Data Management Evolution Infographics PDF
This slide signifies the 2 year Evolution on data management. It comparison includes data system, governance, sourcing with vision. Showcasing this set of slides titled 2 Year Data Management Evolution Infographics PDF. The topics addressed in these templates are Data Sourcing, Governance, Data System. All the content presented in this PPT design is completely editable. Download it and make adjustments in color, background, font etc. as per your unique business setting.
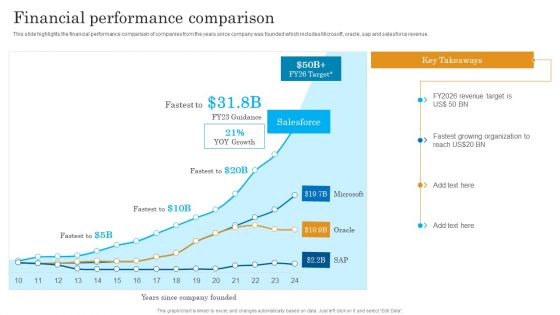
Financial Performance Comparison Salesforce Business Profile Demonstration PDF
This slide highlights the financial performance comparison of companies from the years since company was founded which includes Microsoft, oracle, sap and salesforce revenue. Deliver an awe inspiring pitch with this creative Financial Performance Comparison Salesforce Business Profile Demonstration PDF bundle. Topics like Target, Salesforce, Organization can be discussed with this completely editable template. It is available for immediate download depending on the needs and requirements of the user.

Vendor Management Audit Supplier Audited Performance Comparison Matrix
Following slide provides detailed conclusion of supplier audit report comparison with previous year performance. It includes standard score, previous score, current score and variance. Presenting this PowerPoint presentation, titled Vendor Management Audit Supplier Audited Performance Comparison Matrix, with topics curated by our researchers after extensive research. This editable presentation is available for immediate download and provides attractive features when used. Download now and captivate your audience. Presenting this Vendor Management Audit Supplier Audited Performance Comparison Matrix. Our researchers have carefully researched and created these slides with all aspects taken into consideration. This is a completely customizable Vendor Management Audit Supplier Audited Performance Comparison Matrix that is available for immediate downloading. Download now and make an impact on your audience. Highlight the attractive features available with our PPTs.

Strategic Supplier Evaluation Supplier Audited Performance Comparison Matrix
Following slide provides detailed conclusion of supplier audit report comparison with previous year performance. It includes standard score, previous score, current score and variance. Retrieve professionally designed Strategic Supplier Evaluation Supplier Audited Performance Comparison Matrix to effectively convey your message and captivate your listeners. Save time by selecting pre-made slideshows that are appropriate for various topics, from business to educational purposes. These themes come in many different styles, from creative to corporate, and all of them are easily adjustable and can be edited quickly. Access them as PowerPoint templates or as Google Slides themes. You do not have to go on a hunt for the perfect presentation because Slidegeeks got you covered from everywhere.
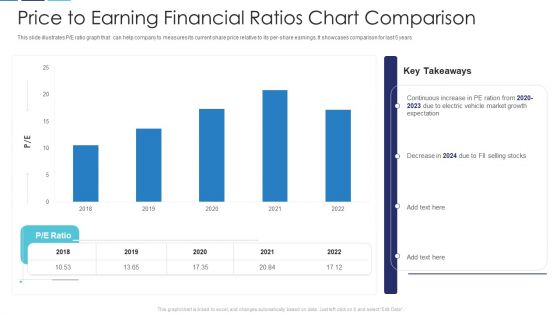
Price To Earning Financial Ratios Chart Comparison Slides PDF
This slide illustrates P or E ratio graph that can help company to measures its current share price relative to its per-share earnings. It showcases comparison for last 5 years Showcasing this set of slides titled price to earning financial ratios chart comparison slides pdf. The topics addressed in these templates are price to earning financial ratios chart comparison. All the content presented in this PPT design is completely editable. Download it and make adjustments in color, background, font etc. as per your unique business setting.

Web Hosting Software Company Outline Financial Performance Comparison Themes PDF
This slide highlights the financial performance comparison of companies from the years since company was founded which includes microsoft, oracle, sap and salesforce revenue. Get a simple yet stunning designed Web Hosting Software Company Outline Financial Performance Comparison Themes PDF. It is the best one to establish the tone in your meetings. It is an excellent way to make your presentations highly effective. So, download this PPT today from Slidegeeks and see the positive impacts. Our easy to edit Web Hosting Software Company Outline Financial Performance Comparison Themes PDF can be your go to option for all upcoming conferences and meetings. So, what are you waiting for Grab this template today.

Dividend Payout Financial Ratios Chart Comparison Themes PDF
This slide showcases dividend payout ratio graph that can help organization to determine the percentage of the companys earnings that is paid out to shareholders by way of dividend. It showcases comparison for a period of 8 years Showcasing this set of slides titled dividend payout financial ratios chart comparison themes pdf. The topics addressed in these templates are dividend payout financial ratios chart comparison. All the content presented in this PPT design is completely editable. Download it and make adjustments in color, background, font etc. as per your unique business setting.

IT Business Valuation Comparison Chart Ppt Model Themes PDF
This slide shows the comparison amongst valuation of three information technology companies. It includes data of last four years. Showcasing this set of slides titled IT Business Valuation Comparison Chart Ppt Model Themes PDF. The topics addressed in these templates are Key Takeaways, Increasing Competition, Innovative Products . All the content presented in this PPT design is completely editable. Download it and make adjustments in color, background, font etc. as per your unique business setting.
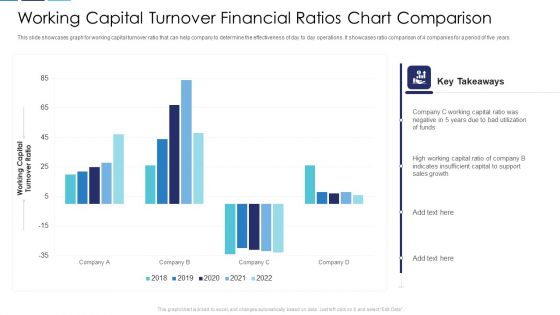
Working Capital Turnover Financial Ratios Chart Comparison Clipart PDF
This slide showcases graph for working capital turnover ratio that can help company to determine the effectiveness of day to day operations. It showcases ratio comparison of 4 companies for a period of five years Pitch your topic with ease and precision using this working capital turnover financial ratios chart comparison clipart pdf. This layout presents information on working capital turnover financial ratios chart comparison. It is also available for immediate download and adjustment. So, changes can be made in the color, design, graphics or any other component to create a unique layout.
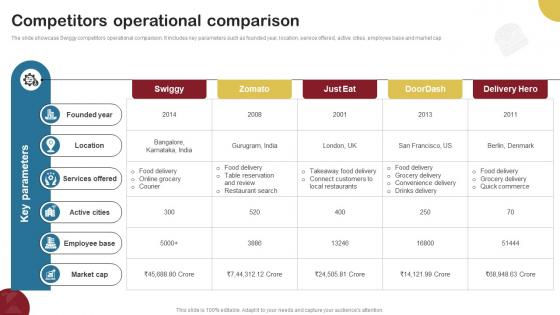
Competitors Operational Comparison Food Delivery Company Profile CP SS V
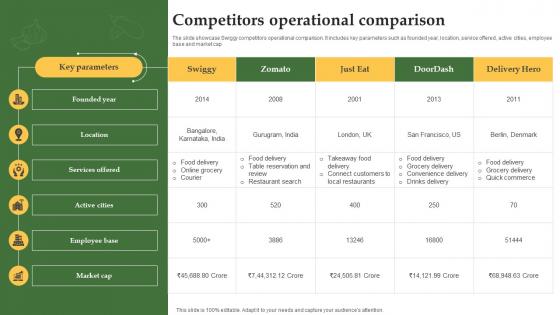
The slide showcase Swiggy competitors operational comparison. It includes key parameters such as founded year, location, service offered, active cities, employee base and market cap. From laying roadmaps to briefing everything in detail, our templates are perfect for you. You can set the stage with your presentation slides. All you have to do is download these easy-to-edit and customizable templates. Competitors Operational Comparison Food Delivery Company Profile CP SS V will help you deliver an outstanding performance that everyone would remember and praise you for. Do download this presentation today.
Competitors Operational Comparison Grocery Delivery Company Profile CP SS V
The slide showcase Swiggy competitors operational comparison. It includes key parameters such as founded year, location, service offered, active cities, employee base and market cap. From laying roadmaps to briefing everything in detail, our templates are perfect for you. You can set the stage with your presentation slides. All you have to do is download these easy-to-edit and customizable templates. Competitors Operational Comparison Grocery Delivery Company Profile CP SS V will help you deliver an outstanding performance that everyone would remember and praise you for. Do download this presentation today.

Hospital Medical Research Company Profile Competitor Comparison Inspiration PDF
The slide showcases the healthcare company historical yearly growth for profit and revenue. It also showcases comparative revenue and profit year on year growth for pharmacy, hospital and research business verticals. Deliver an awe inspiring pitch with this creative Hospital Medical Research Company Profile Competitor Comparison Inspiration PDF bundle. Topics like Global Market, Share 2022, Global Research, Market Share 2022 can be discussed with this completely editable template. It is available for immediate download depending on the needs and requirements of the user.
Revenue And Loss Actual And Budgeted Comparison Elements PDF
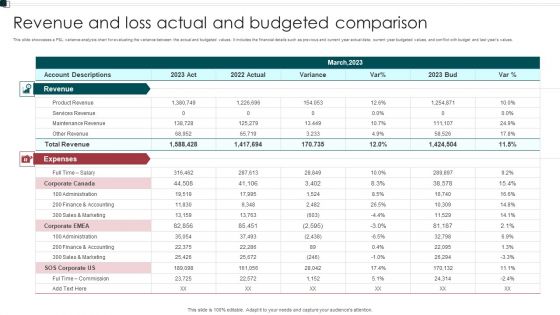
This slide showcases a P and L variance analysis chart for evaluating the variance between the actual and budgeted values. It includes the financial details such as previous and current year actual data current year budgeted values, and conflict with budget and last years values. Showcasing this set of slides titled Revenue And Loss Actual And Budgeted Comparison Elements PDF. The topics addressed in these templates are Expenses, Administration, Commission. All the content presented in this PPT design is completely editable. Download it and make adjustments in color, background, font etc. as per your unique business setting.

Annual Growth Comparison Of Online Health Industry Rules PDF
The purpose of this slide is to outline the healthcare online market revenue growth year over year influenced by expanding penetration among new consumer groups. Certain online tactics include digital advertising, online inquiry, online medicine delivery, etc. Showcasing this set of slides titled Annual Growth Comparison Of Online Health Industry Rules PDF. The topics addressed in these templates are Evolutionary Years, Online Health Insurance, Digital Advertising. All the content presented in this PPT design is completely editable. Download it and make adjustments in color, background, font etc. as per your unique business setting.

Companys Competitor Comparison Framework Ppt Infographic Template Example 2015 PDF
This slide provides competitive analysis with respect to the competitors based on some paraments like Revenue, Preferred Online Channel, Media Strategy, Global Market Share, Target Audience etc. Deliver and pitch your topic in the best possible manner with this companys competitor comparison framework ppt infographic template example 2015 pdf. Use them to share invaluable insights on media strategy, global market share, target audience, customer base, revenue, founding year and impress your audience. This template can be altered and modified as per your expectations. So, grab it now.

Revenue And Expenses Comparison Historical And Projection Designs PDF
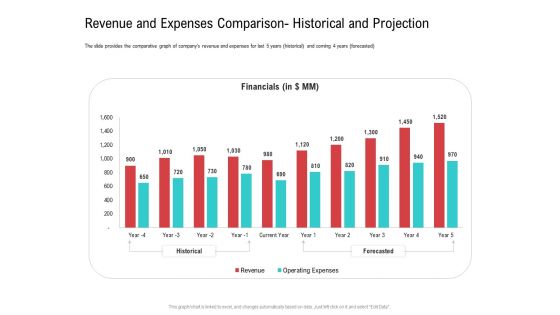
The slide provides the comparative graph of companys revenue and expenses for last 5 years historical and coming 4 years forecasted. Deliver an awe inspiring pitch with this creative revenue and expenses comparison historical and projection designs pdf bundle. Topics like revenue and expenses comparison historical and projection can be discussed with this completely editable template. It is available for immediate download depending on the needs and requirements of the user.
Companys Financial Comparison With Income Startup Investment Sources Summary Pdf
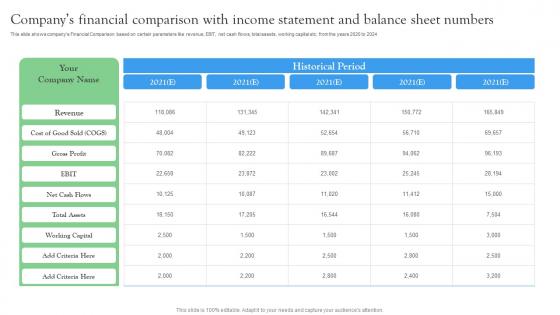
This slide shows companys Financial Comparison based on certain parameters like revenue, EBIT, net cash flows, total assets, working capital etc. from the years 2020 to 2024. There are so many reasons you need a Companys Financial Comparison With Income Startup Investment Sources Summary Pdf. The first reason is you can not spend time making everything from scratch, Thus, Slidegeeks has made presentation templates for you too. You can easily download these templates from our website easily.
Revenue And Expenses Comparison Historical And Projection Professional PDF
The slide provides the comparative graph of companys revenue and expenses for last 5 years historical and coming 4 years forecasted. Deliver and pitch your topic in the best possible manner with this revenue and expenses comparison historical and projection professional pdf. Use them to share invaluable insights on revenue, financial, operating expenses and impress your audience. This template can be altered and modified as per your expectations. So, grab it now.

Revenue And Expenses Comparison Historical And Projection Structure PDF
The slide provides the comparative graph of companys revenue and expenses for last 5 years historical and coming 4 years forecasted. Deliver an awe-inspiring pitch with this creative revenue and expenses comparison historical and projection structure pdf bundle. Topics like financials, revenue, operating expenses can be discussed with this completely editable template. It is available for immediate download depending on the needs and requirements of the user.
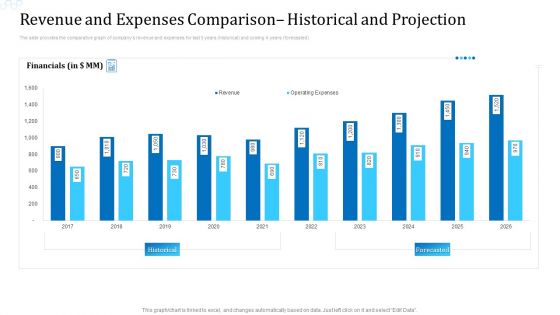
Revenue And Expenses Comparison Historical And Projection Mockup PDF
The slide provides the comparative graph of companys revenue and expenses for last 5 years historical and coming 4 years forecasted. Deliver an awe inspiring pitch with this creative revenue and expenses comparison historical and projection mockup pdf bundle. Topics like financials, revenue, expenses can be discussed with this completely editable template. It is available for immediate download depending on the needs and requirements of the user.

Battery Chart With Percentage Values For Comparison PowerPoint Slides
This year?s sales has matched up with your expectations. Now match this slide with your presentation to show the same. Show your company?s performance or business growth with this four staged battery chart PowerPoint template. With this slide, you can easily convince your colleagues how your company gave a tremendous growth over the years or months. Perfect illustration to show that the targets are achieved. This PPT template is easy to edit. You can choose the color of your choice. Your colleagues are already impressed with the sales growth. Now impress others and choose this PPT innovative designed template.
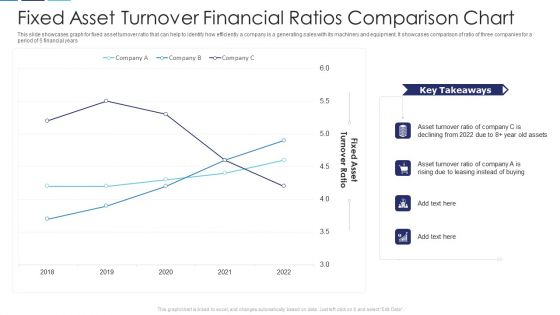
Fixed Asset Turnover Financial Ratios Comparison Chart Structure PDF
This slide showcases graph for fixed asset turnover ratio that can help to identify how efficiently a company is a generating sales with its machinery and equipment. It showcases comparison of ratio of three companies for a period of 5 financial years Showcasing this set of slides titled fixed asset turnover financial ratios comparison chart structure pdf. The topics addressed in these templates are fixed asset turnover financial ratios comparison chart. All the content presented in this PPT design is completely editable. Download it and make adjustments in color, background, font etc. as per your unique business setting.
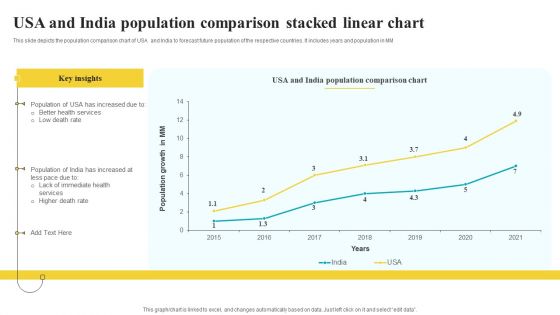
Usa And India Population Comparison Stacked Linear Chart Guidelines PDF
This slide depicts the population comparison chart of USA and India to forecast future population of the respective countries. It includes years and population in MM Pitch your topic with ease and precision using this Usa And India Population Comparison Stacked Linear Chart Guidelines PDF. This layout presents information on Key Insights, Population Growth, Comparison Chart. It is also available for immediate download and adjustment. So, changes can be made in the color, design, graphics or any other component to create a unique layout.
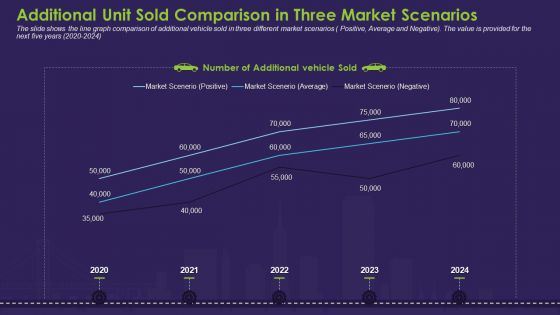
Additional Unit Sold Comparison In Three Market Scenarios Introduction PDF
The slide shows the line graph comparison of additional vehicle sold in three different market scenarios Positive, Average and Negative. The value is provided for the next five years 2020 to 2024.Deliver an awe-inspiring pitch with this creative additional unit sold comparison in three market scenarios introduction pdf. bundle. Topics like market scenario, positive, market scenario average, market scenario negative, 2020 to 2024 can be discussed with this completely editable template. It is available for immediate download depending on the needs and requirements of the user.

Annual Growth Comparison Of Digital Advertising Market Summary PDF
The purpose of this slide is to highlight the yearly growth of digital marketing due rapid increase in the e commerce industry. The growth trend period includes 2019 2023 along with key insights. Pitch your topic with ease and precision using this Annual Growth Comparison Of Digital Advertising Market Summary PDF. This layout presents information on Digital Marketing, Internet Users, Career Among Youngsters. It is also available for immediate download and adjustment. So, changes can be made in the color, design, graphics or any other component to create a unique layout.

Computer Comparison With Laptop Tablet And Mobile PowerPoint Slides
This PPT template is ideal to help you compare the big screen with small screen electronic gadgets like Laptops, Mac books, Tablets, IOS Pads, Mobiles and I-phones. This template can help differentiate application being used by various customers. Portable Devices can easily be compared with immovable devices by companies with the help of this PowerPoint design. The Technological developments in recent years can easily be represented with this diagram. This slide can be customized to demonstrate as per your needs.
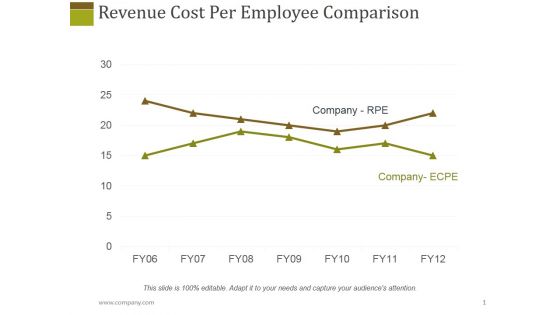
Revenue Cost Per Employee Comparison Ppt PowerPoint Presentation Diagram Lists
This is a revenue cost per employee comparison ppt powerpoint presentation diagram lists. This is a seven stage process. The stages in this process are year, graph, management, finance, company rpe.
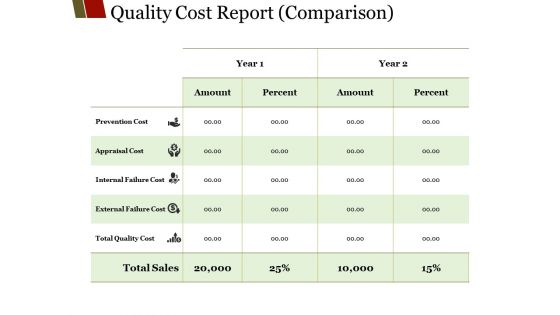
Quality Cost Report Comparison Ppt PowerPoint Presentation Visual Aids Model
This is a quality cost report comparison ppt powerpoint presentation visual aids model. This is a five stage process. The stages in this process are amount, percent, year, prevention cost, prevention cost.

Instagram Company Details Social Network Financial Comparison Portrait PDF
This slide showcases the financial comparison of social media networks which represents platform name, founded year, type, total funding raised, number of active users and revenue. Deliver an awe inspiring pitch with this creative Instagram Company Details Social Network Financial Comparison Portrait PDF bundle. Topics like Social Network Platforms, Revenue can be discussed with this completely editable template. It is available for immediate download depending on the needs and requirements of the user.
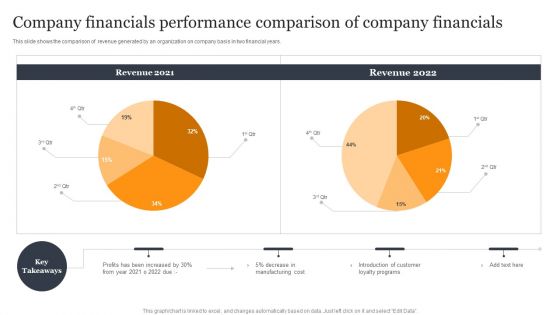
Company Financials Performance Comparison Of Company Financials Formats PDF
This slide shows the comparison of revenue generated by an organization on company basis in two financial years. Pitch your topic with ease and precision using this Company Financials Performance Comparison Of Company Financials Formats PDF. This layout presents information on Manufacturing Cost, Introduction Customer, Loyalty Programs. It is also available for immediate download and adjustment. So, changes can be made in the color, design, graphics or any other component to create a unique layout.

Competitor Comparison By Total Sales And Store Count Formats PDF
The purpose of this slide is to provide glimpse about several competitors and their comparison on the basis of total sales and store count in the present year. Deliver and pitch your topic in the best possible manner with this NAME. Use them to share invaluable insights on competitor comparison by total sales and store count and impress your audience. This template can be altered and modified as per your expectations. So, grab it now.
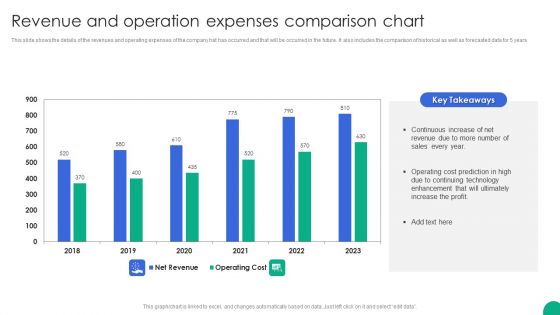
Revenue And Operation Expenses Comparison Chart Slides PDF
This slide shows the details of the revenues and operating expenses of the company hat has occurred and that will be occurred in the future. It also includes the comparison of historical as well as forecasted data for 5 years.Showcasing this set of slides titled Revenue And Operation Expenses Comparison Chart Slides PDF. The topics addressed in these templates are Continuous Increase, Operating Cost, Enhancement Ultimately. All the content presented in this PPT design is completely editable. Download it and make adjustments in color, background, font etc. as per your unique business setting.
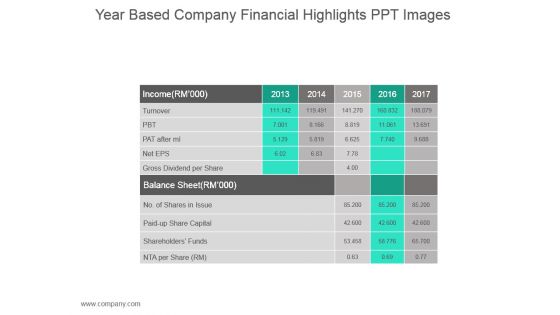
Year Based Company Financial Highlights Ppt Images
This is a year based company financial highlights ppt images. This is a two stage process. The stages in this process are turnover, gross dividend per share, shareholders funds, paid up share capital.

Four Year Sales Plan Timeline Summary PDF
This slide contains Gantt chart which can be used to present four year sales plan. It includes sales target, strategy, goal, etc. Pitch your topic with ease and precision using this Four Year Sales Plan Timeline Summary PDF. This layout presents information on Brand Awareness, Marketing Channel, Sales Target. It is also available for immediate download and adjustment. So, changes can be made in the color, design, graphics or any other component to create a unique layout.

5 Year Software Features Merger Roadmap Guidelines
Introducing our 5 year software features merger roadmap guidelines. This PPT presentation is Google Slides compatible, therefore, you can share it easily with the collaborators for measuring the progress. Also, the presentation is available in both standard screen and widescreen aspect ratios. So edit the template design by modifying the font size, font type, color, and shapes as per your requirements. As this PPT design is fully editable it can be presented in PDF, JPG and PNG formats.

Four Year Digital Marketing Timeline Brochure PDF
Pitch your topic with ease and precision using this Four Year Digital Marketing Timeline Brochure PDF. This layout presents information on Email Marketing, Organic Search, Social Media. It is also available for immediate download and adjustment. So, changes can be made in the color, design, graphics or any other component to create a unique layout.

Quarterly Sales Performance Of Business Dashboard With Region And Product Wise Comparison Guidelines PDF
This slide displays sales analysis for different products and regions in each quarter. t also includes inter year comparisons. Pitch your topic with ease and precision using this Quarterly Sales Performance Of Business Dashboard With Region And Product Wise Comparison Guidelines PDF. This layout presents information on Product Wise Quarterly Sales, Comparison. It is also available for immediate download and adjustment. So, changes can be made in the color, design, graphics or any other component to create a unique layout.
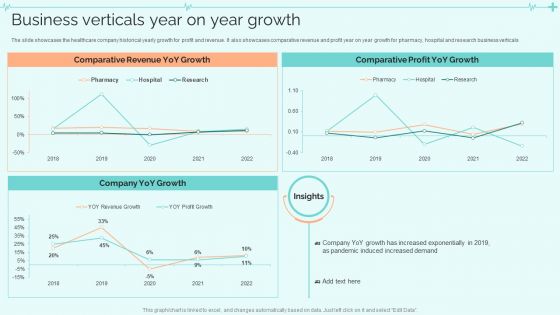
Clinical Services Company Profile Business Verticals Year On Year Growth Graphics PDF
The slide showcases the healthcare company historical yearly growth for profit and revenue. It also showcases comparative revenue and profit year on year growth for pharmacy, hospital and research business verticals. Deliver an awe inspiring pitch with this creative Clinical Services Company Profile Business Verticals Year On Year Growth Graphics PDF bundle. Topics like Comparative Revenue, Comparative Profit, Increased Demand can be discussed with this completely editable template. It is available for immediate download depending on the needs and requirements of the user.
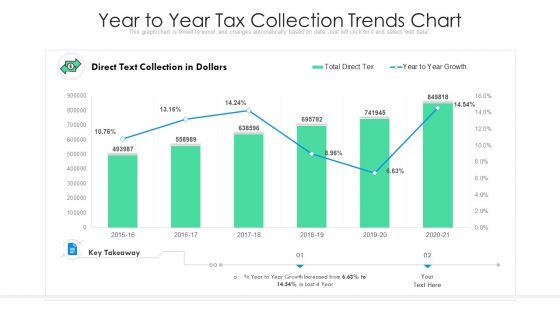
Year To Year Tax Collection Trends Chart Ppt Infographic Template Influencers PDF
Pitch your topic with ease and precision using this year to year tax collection trends chart ppt infographic template influencers pdf. This layout presents information on year to year tax collection trends chart. It is also available for immediate download and adjustment. So, changes can be made in the color, design, graphics or any other component to create a unique layout.

Merger And Acquisition Due Diligence Year Over Year Net Debt Diagrams PDF
This slide shows year over year net debt of the target company. It covers details of net debt and total potential net debt. Deliver and pitch your topic in the best possible manner with this merger and acquisition due diligence year over year net debt diagrams pdf. Use them to share invaluable insights on net debt, compensation liabilities, potential net debt, notes payable and impress your audience. This template can be altered and modified as per your expectations. So, grab it now.
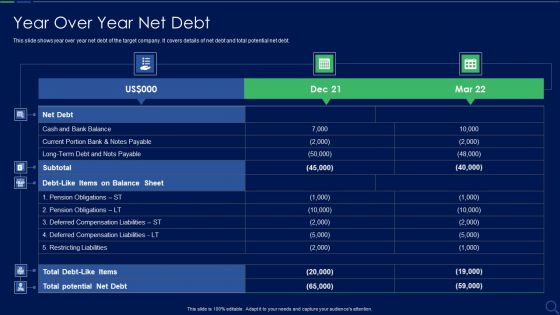
Audit Checklist For Mergers And Acquisitions Year Over Year Net Debt Ideas PDF
This slide shows year over year net debt of the target company. It covers details of net debt and total potential net debt. Deliver an awe inspiring pitch with this creative audit checklist for mergers and acquisitions year over year net debt ideas pdf bundle. Topics like net debt, total potential net debt, cash can be discussed with this completely editable template. It is available for immediate download depending on the needs and requirements of the user.

Due Diligence Process In Merger And Acquisition Agreement Year Over Year Income Statement Download PDF
This slide illustrates year over year income statement of the target company. It covers details such as total revenues, total expenses and income from continuing operations.Deliver an awe inspiring pitch with this creative due diligence process in merger and acquisition agreement year over year income statement download pdf bundle. Topics like commissions expenses, employee benefits, research and development can be discussed with this completely editable template. It is available for immediate download depending on the needs and requirements of the user.

Due Diligence Process In Merger And Acquisition Agreement Year Over Year Net Debt Elements PDF
This slide shows year over year net debt of the target company. It covers details of net debt and total potential net debt.Deliver and pitch your topic in the best possible manner with this due diligence process in merger and acquisition agreement year over year net debt elements pdf Use them to share invaluable insights on current portion, deferred compensation, pension obligations and impress your audience. This template can be altered and modified as per your expectations. So, grab it now.
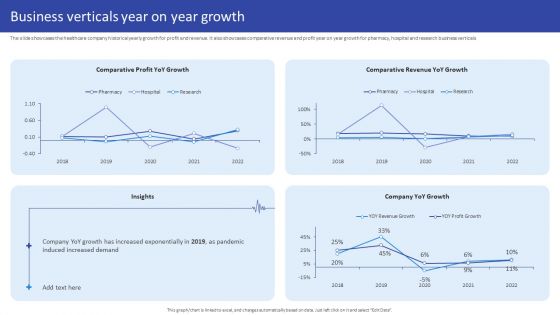
Hospital Medical Research Company Profile Business Verticals Year On Year Growth Themes PDF
The slide showcases the healthcare company historical yearly growth for profit and revenue. It also showcases comparative revenue and profit year on year growth for pharmacy, hospital and research business verticals Deliver an awe inspiring pitch with this creative Hospital Medical Research Company Profile Business Verticals Year On Year Growth Themes PDF bundle. Topics like Comparative Profit, YoY Growth, Comparative Revenue, Company YoY Growth can be discussed with this completely editable template. It is available for immediate download depending on the needs and requirements of the user.

Medical Care Company Overview Business Verticals Year On Year Growth Elements PDF
The slide showcases the healthcare company historical yearly growth for profit and revenue. It also showcases comparative revenue and profit year on year growth for pharmacy, hospital and research business verticals. Deliver an awe inspiring pitch with this creative Medical Care Company Overview Business Verticals Year On Year Growth Elements PDF bundle. Topics like Company Yoy Growth, Comparative Revenue, Comparative Profit can be discussed with this completely editable template. It is available for immediate download depending on the needs and requirements of the user.
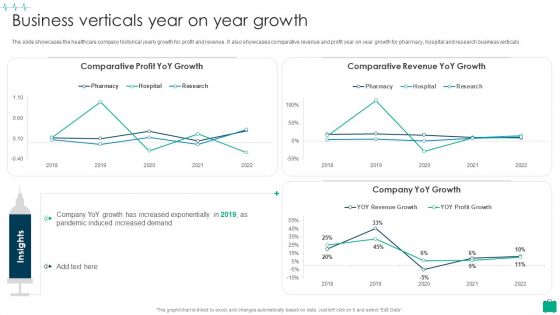
Healthcare Services Company Profile Business Verticals Year On Year Growth Summary PDF
The slide showcases the healthcare company historical yearly growth for profit and revenue. It also showcases comparative revenue and profit year on year growth for pharmacy, hospital and research business verticals.Deliver and pitch your topic in the best possible manner with this Healthcare Services Company Profile Business Verticals Year On Year Growth Summary PDF Use them to share invaluable insights on Comparative Profit, Comparative Revenue, Increased Exponentially and impress your audience. This template can be altered and modified as per your expectations. So, grab it now.
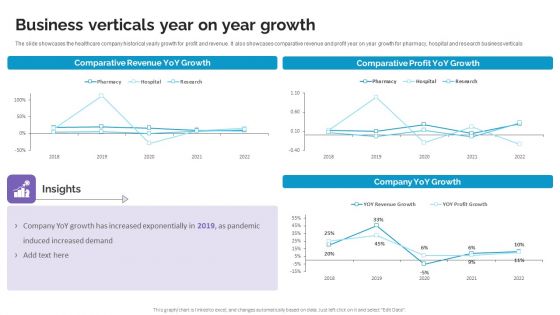
Business Verticals Year On Year Growth Life Science And Healthcare Solutions Company Profile Brochure PDF
The slide showcases the healthcare company historical yearly growth for profit and revenue. It also showcases comparative revenue and profit year on year growth for pharmacy, hospital and research business verticals. Formulating a presentation can take up a lot of effort and time, so the content and message should always be the primary focus. The visuals of the PowerPoint can enhance the presenters message, so our Business Verticals Year On Year Growth Life Science And Healthcare Solutions Company Profile Brochure PDF was created to help save time. Instead of worrying about the design, the presenter can concentrate on the message while our designers work on creating the ideal templates for whatever situation is needed. Slidegeeks has experts for everything from amazing designs to valuable content, we have put everything into Business Verticals Year On Year Growth Life Science And Healthcare Solutions Company Profile Brochure PDF

Pharmaceutical And Clinical Research Summary Business Verticals Year On Year Growth Ideas PDF
The slide showcases the healthcare company historical yearly growth for profit and revenue. It also showcases comparative revenue and profit year on year growth for pharmacy, hospital and research business verticals. Deliver and pitch your topic in the best possible manner with this Pharmaceutical And Clinical Research Summary Business Verticals Year On Year Growth Ideas PDF. Use them to share invaluable insights on Comparative Profit, Growth and impress your audience. This template can be altered and modified as per your expectations. So, grab it now.
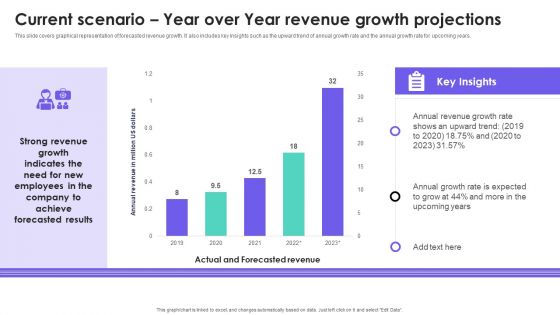
HRMS Execution Plan Current Scenario Year Over Year Revenue Growth Projections Inspiration PDF
This slide covers graphical representation of forecasted revenue growth. It also includes key insights such as the upward trend of annual growth rate and the annual growth rate for upcoming years. Presenting this PowerPoint presentation, titled HRMS Execution Plan Current Scenario Year Over Year Revenue Growth Projections Inspiration PDF, with topics curated by our researchers after extensive research. This editable presentation is available for immediate download and provides attractive features when used. Download now and captivate your audience. Presenting this HRMS Execution Plan Current Scenario Year Over Year Revenue Growth Projections Inspiration PDF. Our researchers have carefully researched and created these slides with all aspects taken into consideration. This is a completely customizable HRMS Execution Plan Current Scenario Year Over Year Revenue Growth Projections Inspiration PDF that is available for immediate downloading. Download now and make an impact on your audience. Highlight the attractive features available with our PPTs.
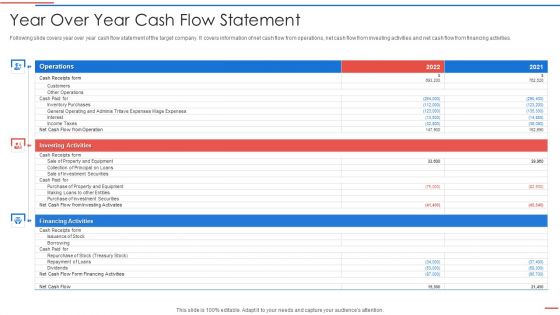
Due Diligence Process In Merger And Acquisition Agreement Year Over Year Cash Flow Statement Information PDF
Following slide covers year over year cash flow statement of the target company. It covers information of net cash flow from operations, net cash flow from investing activities and net cash flow from financing activities.Deliver an awe inspiring pitch with this creative due diligence process in merger and acquisition agreement year over year cash flow statement information pdf bundle. Topics like investing activities, operations, financing activities can be discussed with this completely editable template. It is available for immediate download depending on the needs and requirements of the user.

Cross Selling Your Products To Existing Customers Year Over Year Business Success Playbook Information PDF
Purpose of the following slide displays cross selling as a strategy to sell products to existing customers, it include key points such as based on consumer behavior, discounted rate to buy more, Complete product package etc. Presenting this PowerPoint presentation, titled Cross Selling Your Products To Existing Customers Year Over Year Business Success Playbook Information PDF, with topics curated by our researchers after extensive research. This editable presentation is available for immediate download and provides attractive features when used. Download now and captivate your audience. Presenting this Cross Selling Your Products To Existing Customers Year Over Year Business Success Playbook Information PDF. Our researchers have carefully researched and created these slides with all aspects taken into consideration. This is a completely customizable Cross Selling Your Products To Existing Customers Year Over Year Business Success Playbook Information PDF that is available for immediate downloading. Download now and make an impact on your audience. Highlight the attractive features available with our PPTs.
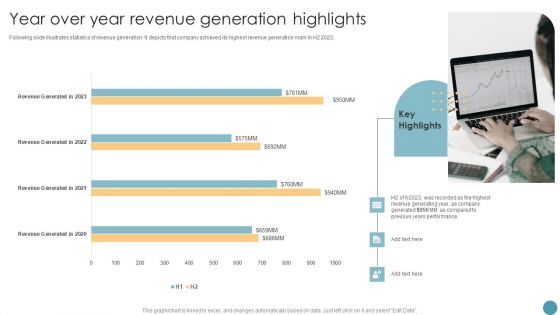
Feasibility Analysis Report For Construction Project Year Over Year Revenue Generation Highlights Portrait PDF
Following slide illustrates statistics of revenue generation. It depicts that company achieved its highest revenue generation mark in H2 2023. Presenting this PowerPoint presentation, titled Feasibility Analysis Report For Construction Project Year Over Year Revenue Generation Highlights Portrait PDF, with topics curated by our researchers after extensive research. This editable presentation is available for immediate download and provides attractive features when used. Download now and captivate your audience. Presenting this Feasibility Analysis Report For Construction Project Year Over Year Revenue Generation Highlights Portrait PDF. Our researchers have carefully researched and created these slides with all aspects taken into consideration. This is a completely customizable Feasibility Analysis Report For Construction Project Year Over Year Revenue Generation Highlights Portrait PDF that is available for immediate downloading. Download now and make an impact on your audience. Highlight the attractive features available with our PPTs.

Merger And Acquisition Due Diligence Year Over Year Cash Flow Statement Rules PDF
Following slide covers year over year cash flow statement of the target company. It covers information of net cash flow from operations, net cash flow from investing activities and net cash flow from financing activities. This is a merger and acquisition due diligence year over year cash flow statement rules pdf template with various stages. Focus and dispense information on three stages using this creative set, that comes with editable features. It contains large content boxes to add your information on topics like operations, investing activities, financing activities. You can also showcase facts, figures, and other relevant content using this PPT layout. Grab it now.
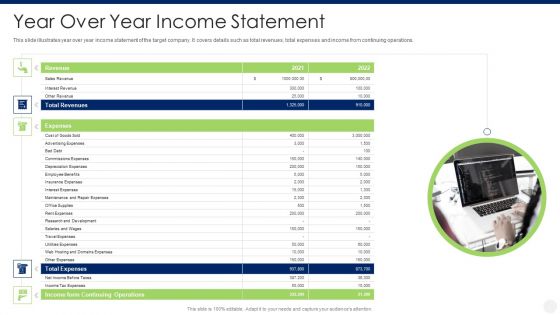
Merger And Acquisition Due Diligence Year Over Year Income Statement Themes PDF
This slide illustrates year over year income statement of the target company. It covers details such as total revenues, total expenses and income from continuing operations. This is a merger and acquisition due diligence year over year income statement themes pdf template with various stages. Focus and dispense information on five stages using this creative set, that comes with editable features. It contains large content boxes to add your information on topics like total revenues, total expenses, income from continuing operations. You can also showcase facts, figures, and other relevant content using this PPT layout. Grab it now.
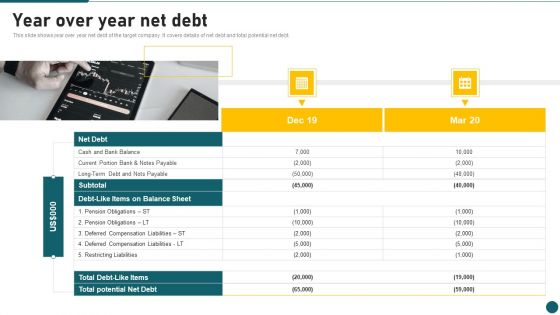
Due Diligence In Amalgamation And Acquisition Year Over Year Net Debt Information PDF
This slide shows year over year net debt of the target company. It covers details of net debt and total potential net debt. This is a Due Diligence In Amalgamation And Acquisition Year Over Year Net Debt Information PDF template with various stages. Focus and dispense information on two stages using this creative set, that comes with editable features. It contains large content boxes to add your information on topics like Potential Net Debt, Restricting Liabilities, Nots Payable. You can also showcase facts, figures, and other relevant content using this PPT layout. Grab it now.

Income Statement Format With Current Year And Previous Years Sales Ppt PowerPoint Presentation Gallery Summary PDF
Pitch your topic with ease and precision using this income statement format with current year and previous years sales ppt powerpoint presentation gallery summary pdf. This layout presents information on expenses, sales, cost. It is also available for immediate download and adjustment. So, changes can be made in the color, design, graphics or any other component to create a unique layout.

Information Technology Transformation Organization Year Over Year Operations Performance Professional PDF
Following slide compares operations performance of the company in financial years 2020 and 2021. It covers production volume, sales revenues, number of active manufacturing plant status and most common defects. Deliver and pitch your topic in the best possible manner with this information technology transformation organization year over year operations performance professional pdf. Use them to share invaluable insights on sales revenues, manufacturing, production volume and impress your audience. This template can be altered and modified as per your expectations. So, grab it now.
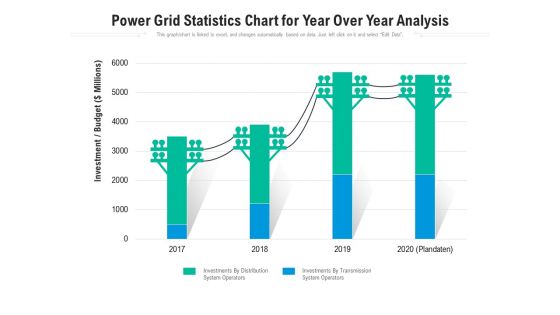
Power Grid Statistics Chart For Year Over Year Analysis Ppt PowerPoint Presentation Show Model PDF
Pitch your topic with ease and precision using this power grid statistics chart for year over year analysis ppt powerpoint presentation show model pdf. This layout presents information on investments by distribution system operators, investments by transmission system operators, 2017 to 2020. It is also available for immediate download and adjustment. So, changes can be made in the color, design, graphics or any other component to create a unique layout.
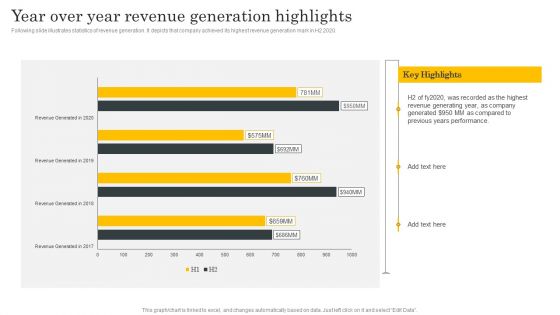
Financial Evaluation Report Year Over Year Revenue Generation Highlights Designs PDF
Following slide illustrates statistics of revenue generation. It depicts that company achieved its highest revenue generation mark in H2 2020. Are you searching for a Financial Evaluation Report Year Over Year Revenue Generation Highlights Designs PDF that is uncluttered, straightforward, and original Its easy to edit, and you can change the colors to suit your personal or business branding. For a presentation that expresses how much effort youve put in, this template is ideal With all of its features, including tables, diagrams, statistics, and lists, its perfect for a business plan presentation. Make your ideas more appealing with these professional slides. Download Financial Evaluation Report Year Over Year Revenue Generation Highlights Designs PDF from Slidegeeks today.

Cross Sell In Banking Industry Year Over Year Financial Performance Highlights Ppt Ideas Styles PDF
This is a cross sell in banking industry year over year financial performance highlights ppt ideas styles pdf template with various stages. Focus and dispense information on four stages using this creative set, that comes with editable features. It contains large content boxes to add your information on topics like operating income, net income, gross margin, operating cash flow. You can also showcase facts, figures, and other relevant content using this PPT layout. Grab it now.
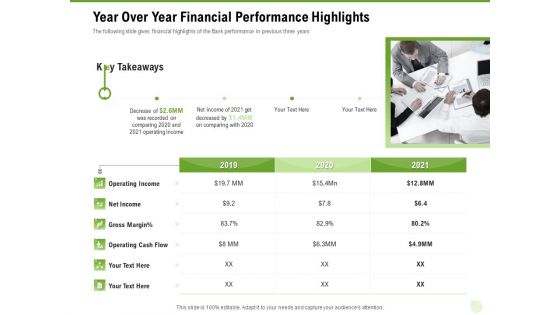
Cross Selling Of Retail Banking Products Year Over Year Financial Performance Highlights Ppt Styles Gallery PDF
This is a cross selling of retail banking products year over year financial performance highlights ppt styles gallery pdf template with various stages. Focus and dispense information on six stages using this creative set, that comes with editable features. It contains large content boxes to add your information on topics like operating income, net income, gross margin, operating cash flow. You can also showcase facts, figures, and other relevant content using this PPT layout. Grab it now.

Digital Marketing Dashboard For Organic Growth Playbook Year Over Year Business Success Playbook Themes PDF
This Digital Marketing Dashboard For Organic Growth Playbook Year Over Year Business Success Playbook Themes PDF from Slidegeeks makes it easy to present information on your topic with precision. It provides customization options, so you can make changes to the colors, design, graphics, or any other component to create a unique layout. It is also available for immediate download, so you can begin using it right away. Slidegeeks has done good research to ensure that you have everything you need to make your presentation stand out. Make a name out there for a brilliant performance.

Audit Checklist For Mergers And Acquisitions Year Over Year Financial Ratios Microsoft PDF
Mentioned slide illustrates financial ratios of the firm. It covers price to earnings ratio, debt to equity ratio, current ratio, return on assets, return on equity and return on investment. This is a audit checklist for mergers and acquisitions year over year financial ratios microsoft pdf template with various stages. Focus and dispense information on six stages using this creative set, that comes with editable features. It contains large content boxes to add your information on topics like debt to equity ratio, return assets, current ratio, return on equity, return on investment. You can also showcase facts, figures, and other relevant content using this PPT layout. Grab it now.

Due Diligence Process In Merger And Acquisition Agreement Year Over Year Financial Ratios Ideas PDF
Mentioned slide illustrates financial ratios of the firm. It covers price to earnings ratio, debt to equity ratio, current ratio, return on assets, return on equity and return on investment.This is a due diligence process in merger and acquisition agreement year over year financial ratios ideas pdf template with various stages. Focus and dispense information on six stages using this creative set, that comes with editable features. It contains large content boxes to add your information on topics like return on assets, return on equity, return on investment You can also showcase facts, figures, and other relevant content using this PPT layout. Grab it now.

Due Diligence In Amalgamation And Acquisition Year Over Year Financial Ratios Template PDF
Mentioned slide illustrates financial ratios of the firm. It covers price to earnings ratio, debt to equity ratio, current ratio, return on assets, return on equity and return on investment. This is a Due Diligence In Amalgamation And Acquisition Year Over Year Financial Ratios Template PDF template with various stages. Focus and dispense information on six stages using this creative set, that comes with editable features. It contains large content boxes to add your information on topics like Equity Ratio, Current Ratio, Return On Investment. You can also showcase facts, figures, and other relevant content using this PPT layout. Grab it now.
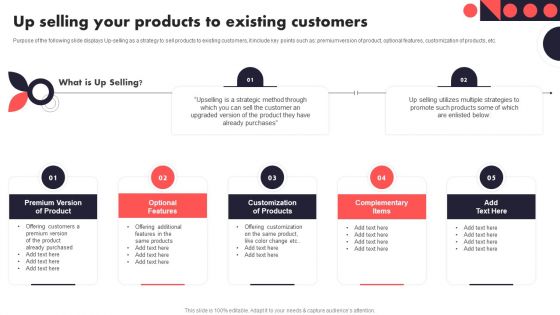
Up Selling Your Products To Existing Customers Year Over Year Business Success Playbook Designs PDF
Purpose of the following slide displays Up-selling as a strategy to sell products to existing customers, it include key points such as premium version of product, optional features, customization of products, etc.This Up Selling Your Products To Existing Customers Year Over Year Business Success Playbook Designs PDF is perfect for any presentation, be it in front of clients or colleagues. It is a versatile and stylish solution for organizing your meetings. The product features a modern design for your presentation meetings. The adjustable and customizable slides provide unlimited possibilities for acing up your presentation. Slidegeeks has done all the homework before launching the product for you. So, don not wait, grab the presentation templates today.

2 Year Evolution On Strategic Planning Process Slides PDF
This slide represents the 2 year Evolution on outlining strategic process. It comparison current and future mode of operations, design and service management. Showcasing this set of slides titled 2 Year Evolution On Strategic Planning Process Slides PDF. The topics addressed in these templates are Service Management, Enterprise Information Management. All the content presented in this PPT design is completely editable. Download it and make adjustments in color, background, font etc. as per your unique business setting.
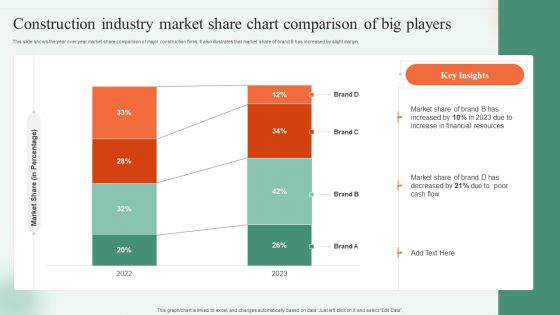
Construction Industry Market Share Chart Comparison Of Big Players Ppt Portfolio Shapes PDF
This slide shows the year over year market share comparison of major construction firms. It also illustrates that market share of brand B has increased by slight margin. Pitch your topic with ease and precision using this Construction Industry Market Share Chart Comparison Of Big Players Ppt Portfolio Shapes PDF. This layout presents information on Market Share Percentage, 2022 To 2023, Market Share. It is also available for immediate download and adjustment. So, changes can be made in the color, design, graphics or any other component to create a unique layout.

Three Year Stats For Different Phases Of Recruitment Information PDF
This slide covers the stages of the recruitment that took place while selecting or doing the related tasks of choosing suitable candidates. It shows the comparison analysis of last three years of each stage of the process. Persuade your audience using this Three Year Stats For Different Phases Of Recruitment Information PDF. This PPT design covers one stages, thus making it a great tool to use. It also caters to a variety of topics including Three Year Stats For Different Phases Of Recruitment. Download this PPT design now to present a convincing pitch that not only emphasizes the topic but also showcases your presentation skills.
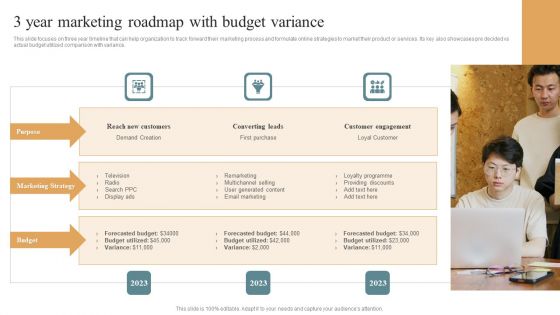
3 Year Marketing Roadmap With Budget Variance Microsoft PDF
This slide focuses on three year timeline that can help organization to track forward their marketing process and formulate online strategies to market their product or services. Its key also showcases pre decided vs actual budget utilized comparison with variance. Presenting 3 Year Marketing Roadmap With Budget Variance Microsoft PDF to dispense important information. This template comprises Three stages. It also presents valuable insights into the topics including Purpose, Marketing Strategy, Budget. This is a completely customizable PowerPoint theme that can be put to use immediately. So, download it and address the topic impactfully.
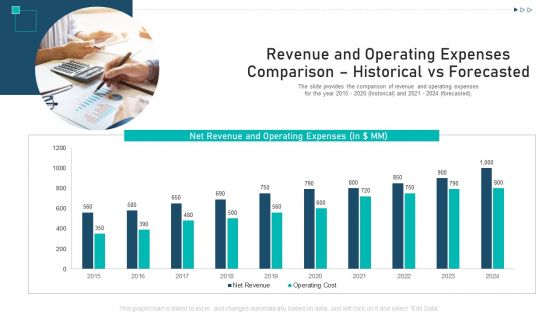
Revenue And Operating Expenses Comparison Historical Vs Forecasted Ppt Summary Clipart PDF
The slide provides the comparison of revenue and operating expenses for the year 2015 2020 historical and 2021 2024 forecasted. Deliver an awe inspiring pitch with this creative revenue and operating expenses comparison historical vs forecasted ppt summary clipart pdf bundle. Topics like revenue and operating expenses comparison historical vs forecasted can be discussed with this completely editable template. It is available for immediate download depending on the needs and requirements of the user.
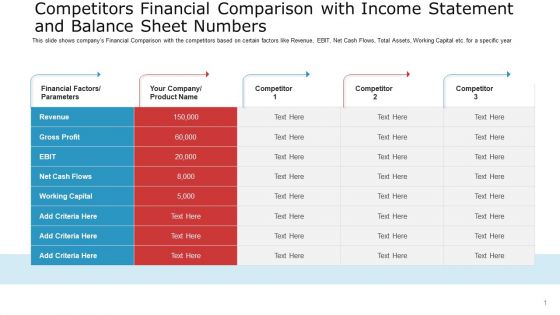
Competitors Financial Comparison With Income Statement And Balance Sheet Numbers Elements PDF
This slide shows companys Financial Comparison with the competitors based on certain factors like Revenue, EBIT, Net Cash Flows, Total Assets, Working Capital etc. for a specific year Deliver an awe-inspiring pitch with this creative competitors financial comparison with income statement and balance sheet numbers elements pdf bundle. Topics like financial factors or parameter, gross profit, working capital can be discussed with this completely editable template. It is available for immediate download depending on the needs and requirements of the user.

Fundraising From Corporate Investment Revenue And Operating Expenses Comparison Historical Pictures PDF
The slide provides the comparison of revenue and operating expenses for the year 2016 to 2021 historical and 2022 to 2025 forecasted. Deliver an awe inspiring pitch with this creative fundraising from corporate investment revenue and operating expenses comparison historical pictures pdf bundle. Topics like net revenue, operating cost can be discussed with this completely editable template. It is available for immediate download depending on the needs and requirements of the user.

Financial Chart For Current And Quick Financial Ratios Comparison Brochure PDF
This slide showcases current and quick ratio graph that can help to evaluate companys liquidity and and assess the company abilities to pay off debt. It also showcases comparison of ratio with previous financial year Pitch your topic with ease and precision using this financial chart for current and quick financial ratios comparison brochure pdf. This layout presents information on financial chart for current and quick financial ratios comparison. It is also available for immediate download and adjustment. So, changes can be made in the color, design, graphics or any other component to create a unique layout.

Current And Quick Ratio Comparison Graph For Liquidity Assessment Structure PDF
This slide showcases current and quick ratio graph that can help to evaluate companys liquidity and and assess the company abilities to pay off debt. It also showcases comparison of ratio with previous financial year. Showcasing this set of slides titled Current And Quick Ratio Comparison Graph For Liquidity Assessment Structure PDF. The topics addressed in these templates are Short Term Debt, Delayed Payments, Cash Shortage. All the content presented in this PPT design is completely editable. Download it and make adjustments in color, background, font etc. as per your unique business setting.

Revenue And Expenses Comparison Historical And Projection Ppt Styles Graphics Design PDF
The slide provides the comparative graph of companys revenue and expenses for last 5 years historical and coming 4 years forecasted.Deliver an awe-inspiring pitch with this creative revenue and expenses comparison historical and projection ppt styles graphics design pdf. bundle. Topics like financials, 2016 to 2025, revenue, operating expenses can be discussed with this completely editable template. It is available for immediate download depending on the needs and requirements of the user.

Big Data And Analytics Market Share And Earnings Comparison Matrix Elements PDF
This slide covers big data revenue comparison for two years. It also includes growth rate and market share of leading vendors to analyse its market position. Persuade your audience using this Big Data And Analytics Market Share And Earnings Comparison Matrix Elements PDF. This PPT design covers five stages, thus making it a great tool to use. It also caters to a variety of topics including Revenue, Growth Rate, Market Share. Download this PPT design now to present a convincing pitch that not only emphasizes the topic but also showcases your presentation skills.
Competitors Financial Comparison With Income Statement And Balance Sheet Numbers Icons PDF
This slide shows companys Financial Comparison with the competitors based on certain factors like Revenue, EBIT, Net Cash Flows, Total Assets, Working Capital etc. for a specific year Deliver an awe inspiring pitch with this creative competitors financial comparison with income statement and balance sheet numbers icons pdf. bundle. Topics like competitors financial comparison with income statement and balance sheet numbers can be discussed with this completely editable template. It is available for immediate download depending on the needs and requirements of the user.

Comparison Of Industrial Sector Based On Energy Use Intensity Themes PDF
This slide showcases the comparison of industries based on energy intensity. Energy intensity is energy used per square foot of a property per year. Key industries included for the comparison are machinery, plastic industry, food and beverage, manufacturing etc. Showcasing this set of slides titled Comparison Of Industrial Sector Based On Energy Use Intensity Themes PDF. The topics addressed in these templates are Machinery, Fabricated, Plastics. All the content presented in this PPT design is completely editable. Download it and make adjustments in color, background, font etc. as per your unique business setting.
Ukraine Vs Russia Examining Comparison Of Political Leadership Among Both Nations Icons PDF
This slide provides information regarding comparative assessment of political leaders across both nations. Post collision, Russia has been led by 3 different leaders as compared to Ukraine, which was led by 7 different leaders over the years. Presenting Ukraine Vs Russia Examining Comparison Of Political Leadership Among Both Nations Icons PDF to provide visual cues and insights. Share and navigate important information on five stages that need your due attention. This template can be used to pitch topics like Comparison Political, Leadership. In addtion, this PPT design contains high resolution images, graphics, etc, that are easily editable and available for immediate download.
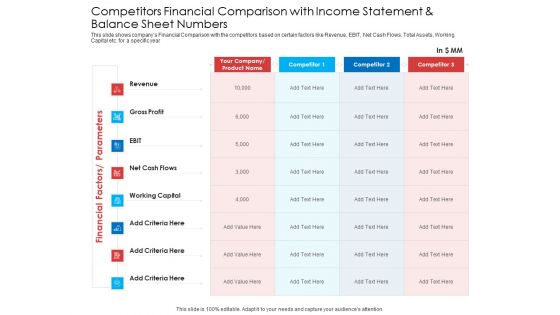
Competitors Financial Comparison With Income Statement And Balance Sheet Numbers Infographics PDF
This slide shows companys Financial Comparison with the competitors based on certain factors like Revenue, EBIT, Net Cash Flows, Total Assets, Working Capital etc. for a specific year. Deliver an awe-inspiring pitch with this creative competitors financial comparison with income statement and balance sheet numbers infographics pdf bundle. Topics like revenue, gross profit, net cash flows, working capital, competitor can be discussed with this completely editable template. It is available for immediate download depending on the needs and requirements of the user.

Remuneration Strategy And Payout Comparison Across Industries Ppt Layouts Example Topics PDF
The following slide highlights the commission scheme and payout comparison across industries. It compares industries payout for three years for retail, real estate, insurance, engineering, advertising and financial service industry. Persuade your audience using this Remuneration Strategy And Payout Comparison Across Industries Ppt Layouts Example Topics PDF. This PPT design covers five stages, thus making it a great tool to use. It also caters to a variety of topics including Industry, Commission Scheme, 2020 Payout, 2021 Payout, 2022 Payout. Download this PPT design now to present a convincing pitch that not only emphasizes the topic but also showcases your presentation skills.

Competitors Financial Comparison With Income Statement And Balance Sheet Numbers Diagrams PDF
This slide shows companys Financial Comparison with the competitors based on certain factors like Revenue, EBIT, Net Cash Flows, Total Assets, Working Capital etc. for a specific year. Deliver an awe inspiring pitch with this creative competitors financial comparison with income statement and balance sheet numbers diagrams pdf bundle. Topics like gross profit, net cash flows, working capital can be discussed with this completely editable template. It is available for immediate download depending on the needs and requirements of the user.

Competitors Financial Comparison With Income Statement And Balance Sheet Numbers Mockup PDF
This slide shows companys Financial Comparison with the competitors based on certain factors like Revenue, EBIT, Net Cash Flows, Total Assets, Working Capital etc. for a specific year. Deliver an awe inspiring pitch with this creative competitors financial comparison with income statement and balance sheet numbers mockup pdf bundle. Topics like revenue, gross profit, working capital, net cash flows can be discussed with this completely editable template. It is available for immediate download depending on the needs and requirements of the user.
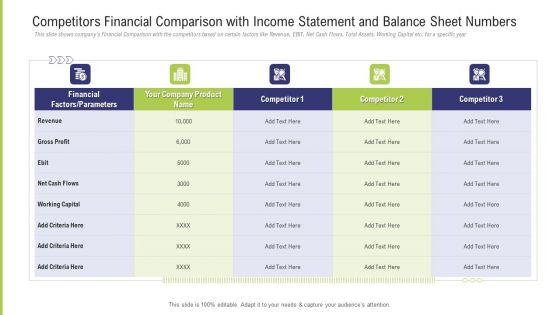
Competitors Financial Comparison With Income Statement And Balance Sheet Numbers Professional PDF
This slide shows companys Financial Comparison with the competitors based on certain factors like Revenue, EBIT, Net Cash Flows, Total Assets, Working Capital etc. for a specific year. Deliver an awe inspiring pitch with this creative competitors financial comparison with income statement and balance sheet numbers professional pdf bundle. Topics like financial, competitor, revenue, gross profit, net cash flows can be discussed with this completely editable template. It is available for immediate download depending on the needs and requirements of the user.

Employee Headcount Analysis Turnover Comparison Of Two Companies Ppt PowerPoint Presentation Infographics Smartart PDF
This slide shows the comparison of two organizations on the basis of headcount turnover. It includes turnover data of last six years. Showcasing this set of slides titled Employee Headcount Analysis Turnover Comparison Of Two Companies Ppt PowerPoint Presentation Infographics Smartart PDF. The topics addressed in these templates are Highest Turnover, Flexible Working, Lowest. All the content presented in this PPT design is completely editable. Download it and make adjustments in color, background, font etc. as per your unique business setting.
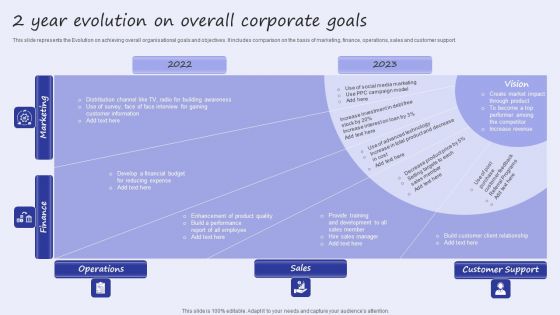
2 Year Evolution On Overall Corporate Goals Template PDF
This slide represents the Evolution on achieving overall organisational goals and objectives. It includes comparison on the basis of marketing, finance, operations, sales and customer support. Pitch your topic with ease and precision using this 2 Year Evolution On Overall Corporate Goals Template PDF. This layout presents information on Finance, Operations, Customer Support. It is also available for immediate download and adjustment. So, changes can be made in the color, design, graphics or any other component to create a unique layout.
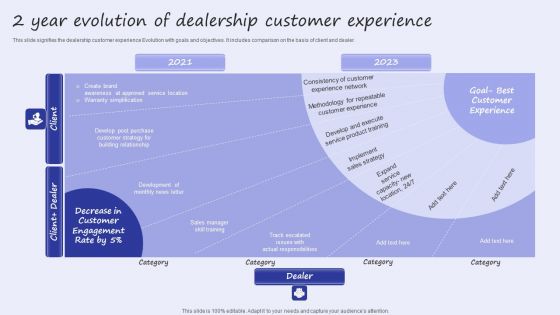
2 Year Evolution Of Dealership Customer Experience Slides PDF
This slide signifies the dealership customer experience Evolution with goals and objectives. It includes comparison on the basis of client and dealer. Showcasing this set of slides titled 2 Year Evolution Of Dealership Customer Experience Slides PDF. The topics addressed in these templates are Client Dealer, Best Customer Experience. All the content presented in this PPT design is completely editable. Download it and make adjustments in color, background, font etc. as per your unique business setting.
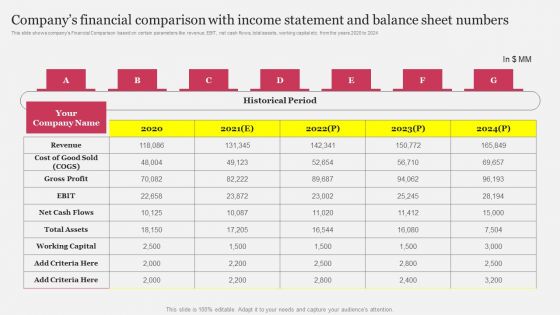
Companys Financial Comparison With Income Statement And Balance Sheet Numbers Elements PDF
This slide shows companys Financial Comparison based on certain parameters like revenue, EBIT, net cash flows, total assets, working capital etc. from the years 2020 to 2024 Create an editable Companys Financial Comparison With Income Statement And Balance Sheet Numbers Elements PDF that communicates your idea and engages your audience. Whether you are presenting a business or an educational presentation, pre designed presentation templates help save time. Companys Financial Comparison With Income Statement And Balance Sheet Numbers Elements PDF is highly customizable and very easy to edit, covering many different styles from creative to business presentations. Slidegeeks has creative team members who have crafted amazing templates. So, go and get them without any delay.

Organizations Retroactive Payments Statistics For Financial Year One Pager Documents
This one pager includes retroactive payments and payroll adjustments made before or after cyclic payment. Further, this includes comparison regular cyclic and retroactive payments. Presenting you an exemplary Organizations Retroactive Payments Statistics For Financial Year One Pager Documents. Our one-pager comprises all the must-have essentials of an inclusive document. You can edit it with ease, as its layout is completely editable. With such freedom, you can tweak its design and other elements to your requirements. Download this Organizations Retroactive Payments Statistics For Financial Year One Pager Documents brilliant piece now.
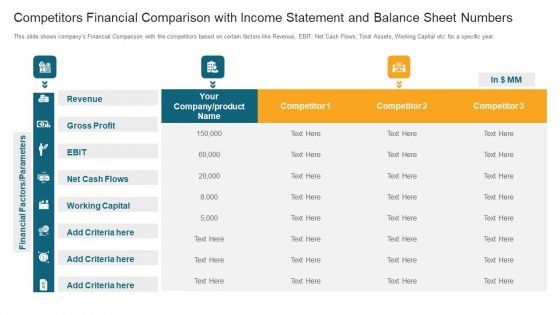
Competitors Financial Comparison With Income Statement And Balance Sheet Numbers Ppt Styles Gallery PDF
This slide shows companys Financial Comparison with the competitors based on certain factors like Revenue, EBIT, Net Cash Flows, Total Assets, Working Capital etc. for a specific year. Deliver an awe inspiring pitch with this creative competitors financial comparison with income statement and balance sheet numbers ppt styles gallery pdf bundle. Topics like revenue, gross profit, net cash flows, working capital can be discussed with this completely editable template. It is available for immediate download depending on the needs and requirements of the user.
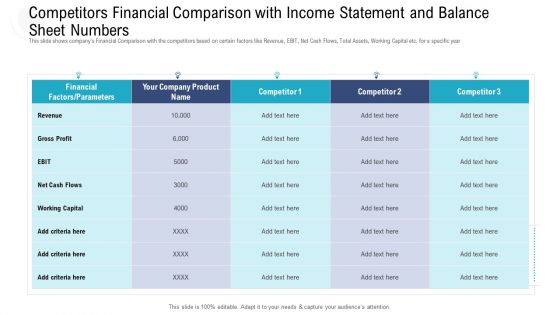
Competitors Financial Comparison With Income Statement And Balance Sheet Numbers Ideas PDF
This slide shows companys Financial Comparison with the competitors based on certain factors like Revenue, EBIT, Net Cash Flows, Total Assets, Working Capital etc. for a specific year. Deliver an awe inspiring pitch with this creative competitors financial comparison with income statement and balance sheet numbers ideas pdf bundle. Topics like financial factors parameters, competitor, net cash flows, revenue, gross profit can be discussed with this completely editable template. It is available for immediate download depending on the needs and requirements of the user.
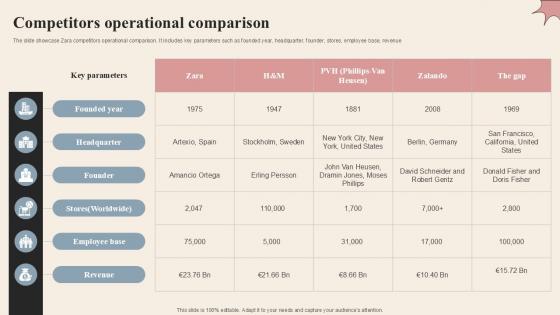
Competitors Operational Comparison Branded Clothing Company Profile PPT Slides CP SS V
The slide showcase Zara competitors operational comparison. It includes key parameters such as founded year, headquarter, founder, stores, employee base, revenue. Do you have to make sure that everyone on your team knows about any specific topic I yes, then you should give Competitors Operational Comparison Branded Clothing Company Profile PPT Slides CP SS V a try. Our experts have put a lot of knowledge and effort into creating this impeccable Competitors Operational Comparison Branded Clothing Company Profile PPT Slides CP SS V. You can use this template for your upcoming presentations, as the slides are perfect to represent even the tiniest detail. You can download these templates from the Slidegeeks website and these are easy to edit. So grab these today
New Year Holidays PowerPoint Templates Ppt Backgrounds For Slides 1212
We present our New Year Holidays PowerPoint Templates PPT Backgrounds For Slides 1212.Download our New year PowerPoint Templates because you can see In any endeavour people matter most. Use our Festival PowerPoint Templates because you can Inform your team of the various means they have to achieve them. Present our Festival PowerPoint Templates because you have configured your targets, identified your goals as per priority and importance. Download and present our Holidays PowerPoint Templates because You have some unique ones up your sleeve. Expose the special features of these hotspots to the world around you. Use our Shapes PowerPoint Templates because it gives you really bright ideas.Use these PowerPoint slides for presentations relating to 2013 new year modeled with tridimensional numbers, new year, sign, festival, shape, holidays. The prominent colors used in the PowerPoint template are Green, White, Black. The feedback we get is that our New Year Holidays PowerPoint Templates PPT Backgrounds For Slides 1212 are One-of-a-kind. Customers tell us our with PowerPoint templates and PPT Slides help you meet deadlines which are an element of today's workplace. Just browse and pick the slides that appeal to your intuitive senses. PowerPoint presentation experts tell us our New Year Holidays PowerPoint Templates PPT Backgrounds For Slides 1212 look good visually. You can be sure our modeled PowerPoint templates and PPT Slides are effectively colour coded to prioritise your plans They automatically highlight the sequence of events you desire. We assure you our New Year Holidays PowerPoint Templates PPT Backgrounds For Slides 1212 look good visually. The feedback we get is that our numbers PowerPoint templates and PPT Slides are Radiant.

New Year Metaphor PowerPoint Templates Ppt Backgrounds For Slides 1212
We present our New Year Metaphor PowerPoint Templates PPT Backgrounds For Slides 1212.Download and present our New year PowerPoint Templates because another year is coming to a close. Download and present our Christmas PowerPoint Templates because it is a season to celebrate and raise our thoughts in gratitude to the Lord. Use our Festival PowerPoint Templates because this slide brings grey areas to the table and explain in detail you assessment of the need for care to ensure continued smooth progress. Present our Holidays PowerPoint Templates because You have some unique ones up your sleeve. Expose the special features of these hotspots to the world around you. Download our Success PowerPoint Templates because iT outlines the entire thought process for the benefit of others. Tell it to the world with your characteristic aplomb.Use these PowerPoint slides for presentations relating to 2013 happy new year, new year, success, christmas, holidays, festival. The prominent colors used in the PowerPoint template are Blue, Gray, Black. The feedback we get is that our New Year Metaphor PowerPoint Templates PPT Backgrounds For Slides 1212 are incredible easy to use. Customers tell us our christmas PowerPoint templates and PPT Slides are Nifty. PowerPoint presentation experts tell us our New Year Metaphor PowerPoint Templates PPT Backgrounds For Slides 1212 are Striking. You can be sure our holidays PowerPoint templates and PPT Slides are Chic. We assure you our New Year Metaphor PowerPoint Templates PPT Backgrounds For Slides 1212 are Ultra. The feedback we get is that our new PowerPoint templates and PPT Slides are Elevated.
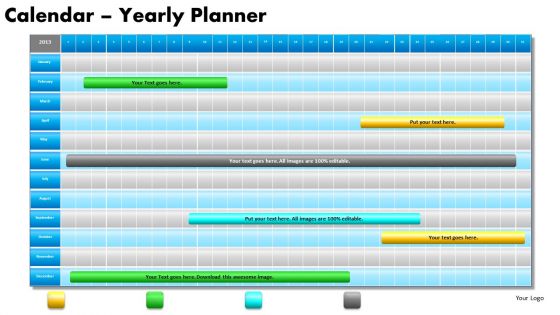
1 Year Planning Gantt Chart PowerPoint Slides Gantt Ppt Templates
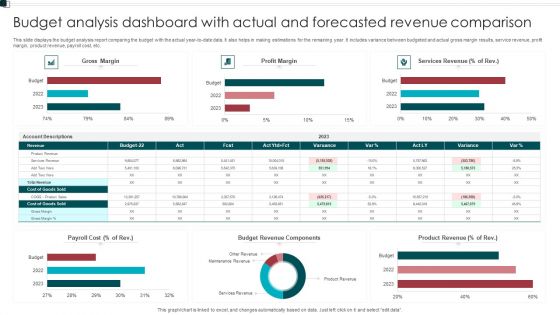
Budget Analysis Dashboard With Actual And Forecasted Revenue Comparison Structure PDF
This slide displays the budget analysis report comparing the budget with the actual year to date data. It also helps in making estimations for the remaining year. It includes variance between budgeted and actual gross margin results, service revenue, profit margin, product revenue, payroll cost, etc. Pitch your topic with ease and precision using this Budget Analysis Dashboard With Actual And Forecasted Revenue Comparison Structure PDF. This layout presents information on Payroll Cost, Budget Revenue Components, Product Revenue. It is also available for immediate download and adjustment. So, changes can be made in the color, design, graphics or any other component to create a unique layout.

Four Cities Sales Comparison Report Ppt PowerPoint Presentation Pictures Mockup PDF
Pitch your topic with ease and precision using this four cities sales comparison report ppt powerpoint presentation pictures mockup pdf. This layout presents information on sales, year 2020. It is also available for immediate download and adjustment. So, changes can be made in the color, design, graphics or any other component to create a unique layout.

Economic Facts And Insights Graph For Revenue Comparison Ppt PowerPoint Presentation Gallery Portfolio PDF
Pitch your topic with ease and precision using this economic facts and insights graph for revenue comparison ppt powerpoint presentation gallery portfolio pdf. This layout presents information on year 2021, revenue, key insights. It is also available for immediate download and adjustment. So, changes can be made in the color, design, graphics or any other component to create a unique layout.
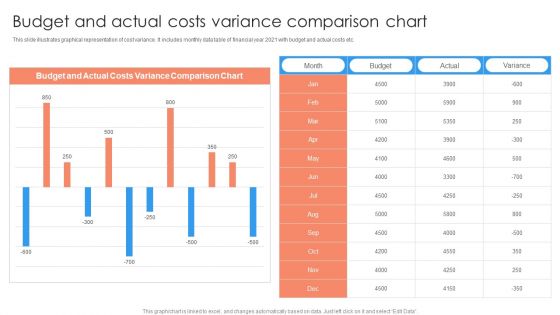
Budget And Actual Costs Variance Comparison Chart Ppt PowerPoint Presentation Show Graphics Example PDF
This slide illustrates graphical representation of cost variance. It includes monthly data table of financial year 2021 with budget and actual costs etc.Showcasing this set of slides titled Budget And Actual Costs Variance Comparison Chart Ppt PowerPoint Presentation Show Graphics Example PDF. The topics addressed in these templates are Budget And Actual, Costs Variance, Comparison Chart. All the content presented in this PPT design is completely editable. Download it and make adjustments in color, background, font etc. as per your unique business setting.
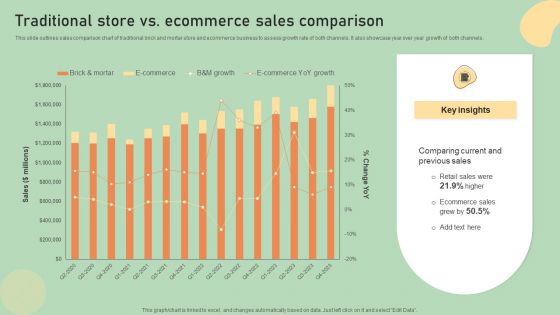
E Commerce Business Development Plan Traditional Store Vs Ecommerce Sales Comparison Guidelines PDF
This slide outlines sales comparison chart of traditional brick and mortar store and ecommerce business to assess growth rate of both channels. It also showcase year over year growth of both channels. Create an editable E Commerce Business Development Plan Traditional Store Vs Ecommerce Sales Comparison Guidelines PDF that communicates your idea and engages your audience. Whether you are presenting a business or an educational presentation, pre-designed presentation templates help save time. E Commerce Business Development Plan Traditional Store Vs Ecommerce Sales Comparison Guidelines PDF is highly customizable and very easy to edit, covering many different styles from creative to business presentations. Slidegeeks has creative team members who have crafted amazing templates. So, go and get them without any delay.

Four Year Process To Develop Profession Development Strategy Graphics Pdf
This slide shows four year process which can be used to formulate career plan. It includes various steps such as freshman year, sophomore year, junior and senior year. Pitch your topic with ease and precision using this Four Year Process To Develop Profession Development Strategy Graphics Pdf. This layout presents information on Freshman Year, Sophomore Year, Junior Year. It is also available for immediate download and adjustment. So, changes can be made in the color, design, graphics or any other component to create a unique layout.

127 SOLD In Year 2015 Ppt PowerPoint Presentation Ideas
This is a 127 sold in year 2015 ppt powerpoint presentation ideas. This is a two stage process. The stages in this process are home, comparison, sales, marketing, strategy, business.

Three Year Revenue Projection Business Ppt PowerPoint Presentation Inspiration Microsoft
This is a three year revenue projection business ppt powerpoint presentation inspiration microsoft. This is a four stage process. The stages in this process are comparison, planning, marketing, finance, strategy.
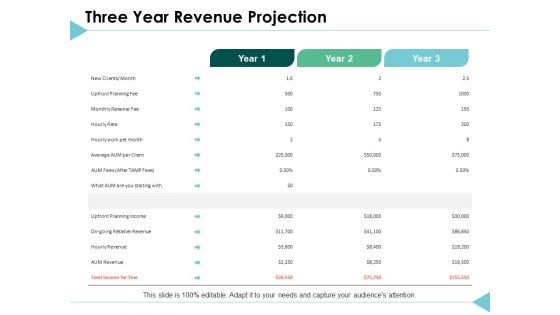
Three Year Revenue Projection Planning Ppt PowerPoint Presentation Model Show
This is a three year revenue projection planning ppt powerpoint presentation model show. This is a three stage process. The stages in this process are comparison, planning, marketing, finance, strategy.
Icon Showing Five Year Professional Development Plan Pictures Pdf
Pitch your topic with ease and precision using this Icon Showing Five Year Professional Development Plan Pictures Pdf. This layout presents information on Icon Showing Five Year, Professional Development Plan. It is also available for immediate download and adjustment. So, changes can be made in the color, design, graphics or any other component to create a unique layout.

 Home
Home