Visual Analytics

Table Of Contents Optimizing Decision Making The Power Of Prescriptive Analytics Data Analytics SS V
The best PPT templates are a great way to save time, energy, and resources. Slidegeeks have 100 percent editable powerpoint slides making them incredibly versatile. With these quality presentation templates, you can create a captivating and memorable presentation by combining visually appealing slides and effectively communicating your message. Download Table Of Contents Optimizing Decision Making The Power Of Prescriptive Analytics Data Analytics SS V from Slidegeeks and deliver a wonderful presentation.
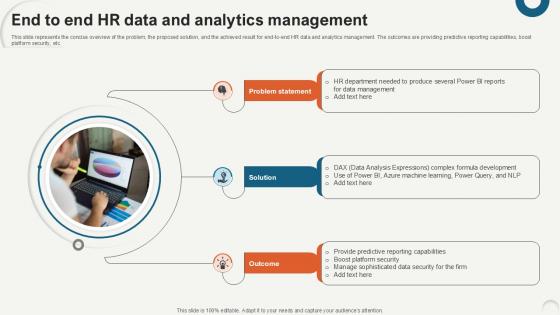
End To End HR Data And Analytics Data Analytics For Informed Decision Ppt Sample
This slide represents the concise overview of the problem, the proposed solution, and the achieved result for end-to-end HR data and analytics management. The outcomes are providing predictive reporting capabilities, boost platform security, etc. If you are looking for a format to display your unique thoughts, then the professionally designed End To End HR Data And Analytics Data Analytics For Informed Decision Ppt Sample is the one for you. You can use it as a Google Slides template or a PowerPoint template. Incorporate impressive visuals, symbols, images, and other charts. Modify or reorganize the text boxes as you desire. Experiment with shade schemes and font pairings. Alter, share or cooperate with other people on your work. Download End To End HR Data And Analytics Data Analytics For Informed Decision Ppt Sample and find out how to give a successful presentation. Present a perfect display to your team and make your presentation unforgettable.

Types Of Attribution Analysis Models Product Analytics Implementation Data Analytics V
This slide outlines major types of attribution analysis methods aimed at helping businesses improve marketing ROI. It covers various types such as first touch, last touch, linear, time decay, custom and U shaped attribution The Types Of Attribution Analysis Models Product Analytics Implementation Data Analytics V is a compilation of the most recent design trends as a series of slides. It is suitable for any subject or industry presentation, containing attractive visuals and photo spots for businesses to clearly express their messages. This template contains a variety of slides for the user to input data, such as structures to contrast two elements, bullet points, and slides for written information. Slidegeeks is prepared to create an impression.
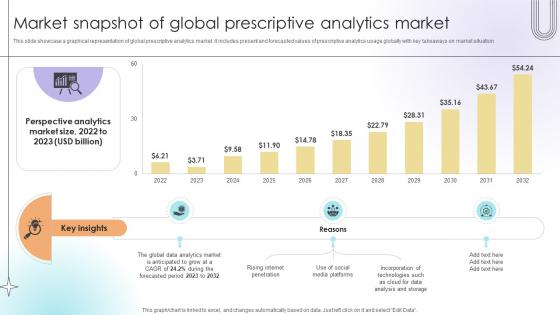
Market Snapshot Of Global Prescriptive Analytics Market Data Analytics SS V
This slide showcase a graphical representation of global prescriptive analytics market. It includes present and forecasted values of prescriptive analytics usage globally with key takeaways on market situation.Make sure to capture your audiences attention in your business displays with our gratis customizable Market Snapshot Of Global Prescriptive Analytics Market Data Analytics SS V. These are great for business strategies, office conferences, capital raising or task suggestions. If you desire to acquire more customers for your tech business and ensure they stay satisfied, create your own sales presentation with these plain slides.
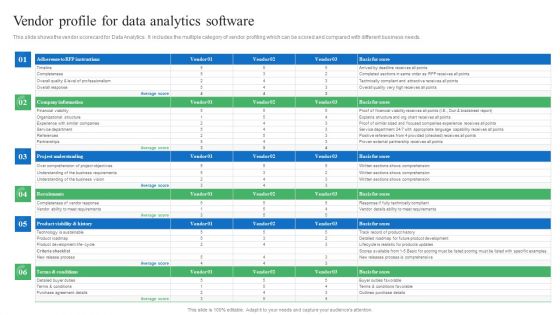
Toolkit For Data Science And Analytics Transition Vendor Profile For Data Analytics Software Introduction PDF
This slide shows the vendor scorecard for Data Analytics. It includes the multiple category of vendor profiling which can be scored and compared with different business needs. Formulating a presentation can take up a lot of effort and time, so the content and message should always be the primary focus. The visuals of the PowerPoint can enhance the presenters message, so our Toolkit For Data Science And Analytics Transition Vendor Profile For Data Analytics Software Introduction PDF was created to help save time. Instead of worrying about the design, the presenter can concentrate on the message while our designers work on creating the ideal templates for whatever situation is needed. Slidegeeks has experts for everything from amazing designs to valuable content, we have put everything into Toolkit For Data Science And Analytics Transition Vendor Profile For Data Analytics Software Introduction PDF.
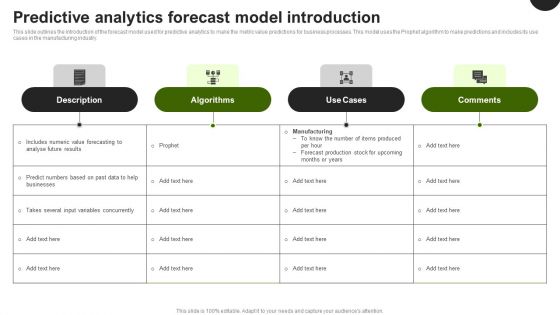
Predictive Analytics In The Age Of Big Data Predictive Analytics Forecast Model Introduction Information PDF
This slide outlines the introduction of the forecast model used for predictive analytics to make the metric value predictions for business processes. This model uses the Prophet algorithm to make predictions and includes its use cases in the manufacturing industry. Formulating a presentation can take up a lot of effort and time, so the content and message should always be the primary focus. The visuals of the PowerPoint can enhance the presenters message, so our Predictive Analytics In The Age Of Big Data Predictive Analytics Forecast Model Introduction Information PDF was created to help save time. Instead of worrying about the design, the presenter can concentrate on the message while our designers work on creating the ideal templates for whatever situation is needed. Slidegeeks has experts for everything from amazing designs to valuable content, we have put everything into Predictive Analytics In The Age Of Big Data Predictive Analytics Forecast Model Introduction Information PDF
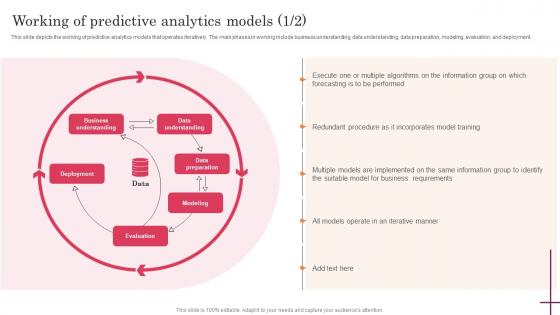
Predictive Analytics For Improved Working Of Predictive Analytics Models Template Pdf
This slide depicts the working of predictive analytics models that operates iteratively. The main phases in working include business understanding, data understanding, data preparation, modeling, evaluation, and deployment. If you are looking for a format to display your unique thoughts, then the professionally designed Predictive Analytics For Improved Working Of Predictive Analytics Models Template Pdf is the one for you. You can use it as a Google Slides template or a PowerPoint template. Incorporate impressive visuals, symbols, images, and other charts. Modify or reorganize the text boxes as you desire. Experiment with shade schemes and font pairings. Alter, share or cooperate with other people on your work. Download Working Of Predictive Analytics Models Predictive Analytics For Improved Template Pdf and find out how to give a successful presentation. Present a perfect display to your team and make your presentation unforgettable.

Big Data Analytics Implementation In Developing Strategic Insights Using Big Data Analytics SS V
This slide provides an overview of implementing big data analytics in health industry which helps in improving health outcomes. It includes elements such as clinical decision making, effective healthcare operations, resource allocation etc. If you are looking for a format to display your unique thoughts, then the professionally designed Big Data Analytics Implementation In Developing Strategic Insights Using Big Data Analytics SS V is the one for you. You can use it as a Google Slides template or a PowerPoint template. Incorporate impressive visuals, symbols, images, and other charts. Modify or reorganize the text boxes as you desire. Experiment with shade schemes and font pairings. Alter, share or cooperate with other people on your work. Download Big Data Analytics Implementation In Developing Strategic Insights Using Big Data Analytics SS V and find out how to give a successful presentation. Present a perfect display to your team and make your presentation unforgettable.

Why Is Predictive Analytics Important Predictive Analytics For Improved Guidelines Pdf
This slide depicts the importance of predictive analytics in different industries. It includes the rise of big data, using cutting-edge technologies for big data and machine learning to extract meaningful insights and increasing competition. If your project calls for a presentation, then Slidegeeks is your go-to partner because we have professionally designed, easy-to-edit templates that are perfect for any presentation. After downloading, you can easily edit Why Is Predictive Analytics Important Predictive Analytics For Improved Guidelines Pdf and make the changes accordingly. You can rearrange slides or fill them with different images. Check out all the handy templates
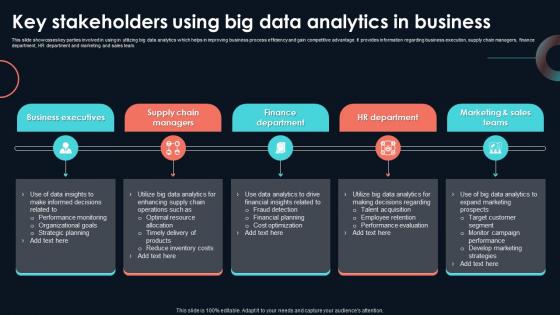
Key Stakeholders Using Big Data Analytics Developing Strategic Insights Using Big Data Analytics SS V
This slide showcases key parties involved in using in utilizing big data analytics which helps in improving business process efficiency and gain competitive advantage. It provides information regarding business execution, supply chain managers, finance department, HR department and marketing and sales team. If your project calls for a presentation, then Slidegeeks is your go-to partner because we have professionally designed, easy-to-edit templates that are perfect for any presentation. After downloading, you can easily edit Key Stakeholders Using Big Data Analytics Developing Strategic Insights Using Big Data Analytics SS V and make the changes accordingly. You can rearrange slides or fill them with different images. Check out all the handy templates

Step By Step Process To Conduct Trends Analysis Product Analytics Implementation Data Analytics V
This slide outlines phases to conduct market trends analysis aimed at identifying current patterns and make data driven decisions. It covers steps such as identify emerging competitors, analyse quantitative data, gather data, conduct primary research and create beta offerComing up with a presentation necessitates that the majority of the effort goes into the content and the message you intend to convey. The visuals of a PowerPoint presentation can only be effective if it supplements and supports the story that is being told. Keeping this in mind our experts created Step By Step Process To Conduct Trends Analysis Product Analytics Implementation Data Analytics V to reduce the time that goes into designing the presentation. This way, you can concentrate on the message while our designers take care of providing you with the right template for the situation.

When To Use Descriptive Analytics Technique Developing Strategic Insights Using Big Data Analytics SS V
This slide highlights applications of descriptive analytics in business environment which helps in data driven decision making. It provides information regarding studying past data, effective reporting, decision making and benchmarking. This slide highlights applications of descriptive analytics in business environment which helps in data driven decision making. It provides information regarding studying past data, effective reporting, decision making and benchmarking. This When To Use Descriptive Analytics Technique Developing Strategic Insights Using Big Data Analytics SS V from Slidegeeks makes it easy to present information on your topic with precision. It provides customization options, so you can make changes to the colors, design, graphics, or any other component to create a unique layout. It is also available for immediate download, so you can begin using it right away. Slidegeeks has done good research to ensure that you have everything you need to make your presentation stand out. Make a name out there for a brilliant performance.
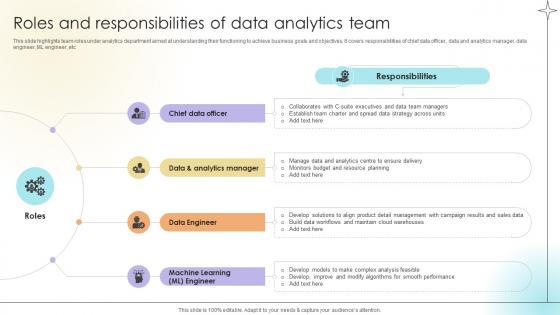
Roles And Responsibilities Of Data Analytics Team Data Analytics SS V
This slide highlights team roles under analytics department aimed at understanding their functioning to achieve business goals and objectives. It covers responsibilities of chief data officer, data and analytics manager, data engineer, ML engineer, etc.This Roles And Responsibilities Of Data Analytics Team Data Analytics SS V from Slidegeeks makes it easy to present information on your topic with precision. It provides customization options, so you can make changes to the colors, design, graphics, or any other component to create a unique layout. It is also available for immediate download, so you can begin using it right away. Slidegeeks has done good research to ensure that you have everything you need to make your presentation stand out. Make a name out there for a brilliant performance.

Predictive Analytics For Empowering Predictive Analytics Clustering Model Overview Professional Pdf
This slide represents the overview of the clustering model of predictive analytics covering its two methods such as hard clustering and soft clustering. It also caters to algorithms used in this model, such as K-means, nearest neighbor, and biologically inspired clustering. Are you in need of a template that can accommodate all of your creative concepts This one is crafted professionally and can be altered to fit any style. Use it with Google Slides or PowerPoint. Include striking photographs, symbols, depictions, and other visuals. Fill, move around, or remove text boxes as desired. Test out color palettes and font mixtures. Edit and save your work, or work with colleagues. Download Predictive Analytics For Empowering Predictive Analytics Clustering Model Overview Professional Pdf and observe how to make your presentation outstanding. Give an impeccable presentation to your group and make your presentation unforgettable.
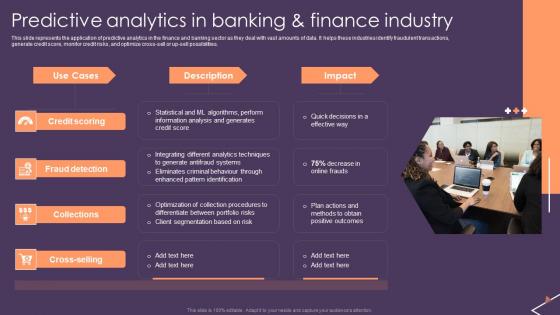
Predictive Analytics For Empowering Predictive Analytics In Banking And Finance Industry Slides Pdf
This slide represents the application of predictive analytics in the finance and banking sector as they deal with vast amounts of data. It helps these industries identify fraudulent transactions, generate credit score, monitor credit risks, and optimize cross-sell or up-sell possibilities. This modern and well-arranged Predictive Analytics For Empowering Predictive Analytics In Banking And Finance Industry Slides Pdf provides lots of creative possibilities. It is very simple to customize and edit with the Powerpoint Software. Just drag and drop your pictures into the shapes. All facets of this template can be edited with Powerpoint no extra software is necessary. Add your own material, put your images in the places assigned for them, adjust the colors, and then you can show your slides to the world, with an animated slide included.

Predictive Analytics Forecast Model Introduction Predictive Analytics For Improved Rules Pdf
This slide outlines the introduction of the forecast model used for predictive analytics to make the metric value predictions for business processes. This model uses the Prophet algorithm to make predictions and includes its use cases in the manufacturing industry. This modern and well-arranged Predictive Analytics Forecast Model Introduction Predictive Analytics For Improved Rules Pdf provides lots of creative possibilities. It is very simple to customize and edit with the Powerpoint Software. Just drag and drop your pictures into the shapes. All facets of this template can be edited with Powerpoint no extra software is necessary. Add your own material, put your images in the places assigned for them, adjust the colors, and then you can show your slides to the world, with an animated slide included.

Toolkit For Data Science And Analytics Transition Data Analytics Project Plan Designs PDF
This slide shows the data analytics lifecycle covering multiple stages starting from presenting the business case to data identification, data validation, analysis and ending at data visualization and utilization of results. Present like a pro with Toolkit For Data Science And Analytics Transition Data Analytics Project Plan Designs PDF Create beautiful presentations together with your team, using our easy to use presentation slides. Share your ideas in real time and make changes on the fly by downloading our templates. So whether you are in the office, on the go, or in a remote location, you can stay in sync with your team and present your ideas with confidence. With Slidegeeks presentation got a whole lot easier. Grab these presentations today.
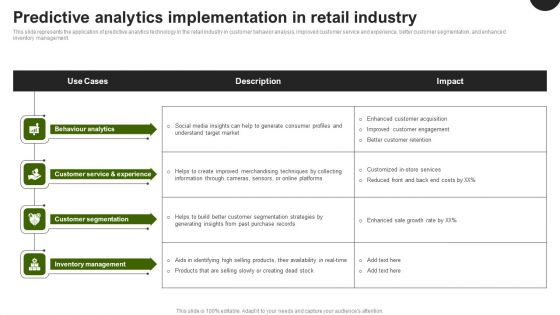
Predictive Analytics In The Age Of Big Data Predictive Analytics Implementation In Retail Industry Themes PDF
This slide represents the application of predictive analytics technology in the retail industry in customer behavior analysis, improved customer service and experience, better customer segmentation, and enhanced inventory management. Coming up with a presentation necessitates that the majority of the effort goes into the content and the message you intend to convey. The visuals of a PowerPoint presentation can only be effective if it supplements and supports the story that is being told. Keeping this in mind our experts created Predictive Analytics In The Age Of Big Data Predictive Analytics Implementation In Retail Industry Themes PDF to reduce the time that goes into designing the presentation. This way, you can concentrate on the message while our designers take care of providing you with the right template for the situation.
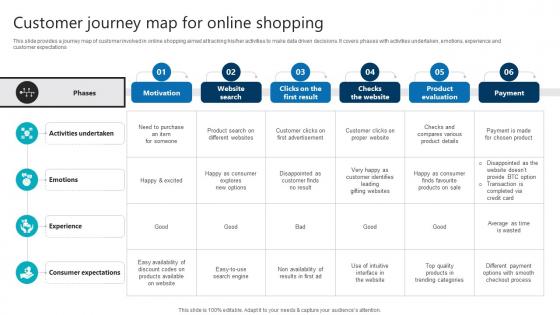
Customer Journey Map For Online Shopping Product Analytics Implementation Data Analytics V
This slide provides a journey map of customer involved in online shopping aimed at tracking his or her activities to make data driven decisions. It covers phases with activities undertaken, emotions, experience and customer expectations.Are you in need of a template that can accommodate all of your creative concepts This one is crafted professionally and can be altered to fit any style. Use it with Google Slides or PowerPoint. Include striking photographs, symbols, depictions, and other visuals. Fill, move around, or remove text boxes as desired. Test out color palettes and font mixtures. Edit and save your work, or work with colleagues. Download Customer Journey Map For Online Shopping Product Analytics Implementation Data Analytics V and observe how to make your presentation outstanding. Give an impeccable presentation to your group and make your presentation unforgettable.
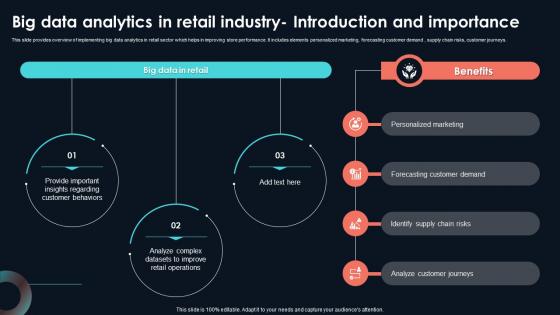
Big Data Analytics In Retail Industry Developing Strategic Insights Using Big Data Analytics SS V
This slide provides overview of implementing big data analytics in retail sector which helps in improving store performance. It includes elements personalized marketing, forecasting customer demand , supply chain risks, customer journeys. Are you in need of a template that can accommodate all of your creative concepts This one is crafted professionally and can be altered to fit any style. Use it with Google Slides or PowerPoint. Include striking photographs, symbols, depictions, and other visuals. Fill, move around, or remove text boxes as desired. Test out color palettes and font mixtures. Edit and save your work, or work with colleagues. Download Big Data Analytics In Retail Industry Developing Strategic Insights Using Big Data Analytics SS V and observe how to make your presentation outstanding. Give an impeccable presentation to your group and make your presentation unforgettable.
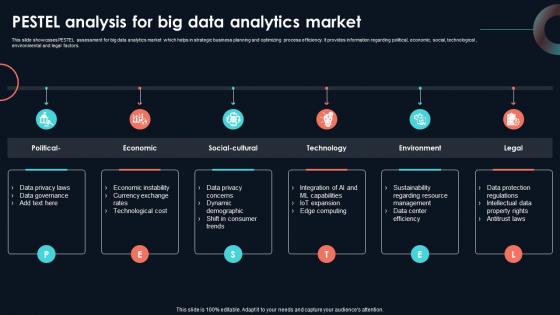
PESTEL Analysis For Big Data Analytics Developing Strategic Insights Using Big Data Analytics SS V
This slide showcases PESTEL assessment for big data analytics market which helps in strategic business planning and optimizing process efficiency. It provides information regarding political, economic, social, technological , environmental and legal factors. This modern and well-arranged PESTEL Analysis For Big Data Analytics Developing Strategic Insights Using Big Data Analytics SS V provides lots of creative possibilities. It is very simple to customize and edit with the Powerpoint Software. Just drag and drop your pictures into the shapes. All facets of this template can be edited with Powerpoint, no extra software is necessary. Add your own material, put your images in the places assigned for them, adjust the colors, and then you can show your slides to the world, with an animated slide included.

Prescriptive Analytics Dashboard To Track Website Sales Data Analytics SS V
This slide illustrates a KPI dashboard highlighting application of prescriptive analytics to analyze website visits and sales. It covers KPIs such as monthly visitors, monthly sales, cash deposits, increase in subscribers and orders received.This modern and well-arranged Prescriptive Analytics Dashboard To Track Website Sales Data Analytics SS V provides lots of creative possibilities. It is very simple to customize and edit with the Powerpoint Software. Just drag and drop your pictures into the shapes. All facets of this template can be edited with Powerpoint, no extra software is necessary. Add your own material, put your images in the places assigned for them, adjust the colors, and then you can show your slides to the world, with an animated slide included.

Predictive Analytics Models For Predictive Predictive Analytics For Improved Structure Pdf
This slide depicts the overview of predictive analytics models, including the predictive problems they solve, such as binary results, number prediction, detecting odd behavior, and so on. The models include classification, forecasting, anomaly, cluster, and time series. This Predictive Analytics Models For Predictive Predictive Analytics For Improved Structure Pdf from Slidegeeks makes it easy to present information on your topic with precision. It provides customization options, so you can make changes to the colors, design, graphics, or any other component to create a unique layout. It is also available for immediate download, so you can begin using it right away. Slidegeeks has done good research to ensure that you have everything you need to make your presentation stand out. Make a name out there for a brilliant performance.
Business Diagram Data Analytics Steps For Big Data Predictive Analytics Ppt Slide
This power point template has been designed with graphic of magnifier over boxes. This slide contains the concept of predictive analytics of big data. This diagram can be used for data analytics related topics in any presentation.
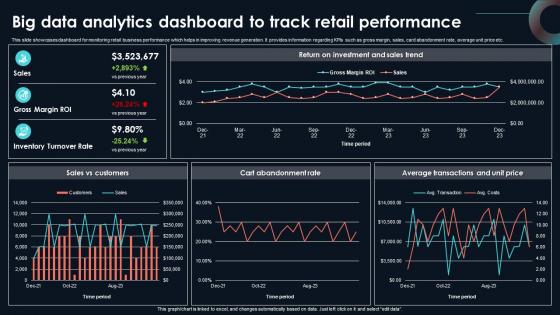
Big Data Analytics Dashboard To Track Developing Strategic Insights Using Big Data Analytics SS V
This slide showcases dashboard for monitoring retail business performance which helps in improving revenue generation. It provides information regarding KPIs such as gross margin, sales, card abandonment rate, average unit price etc. If your project calls for a presentation, then Slidegeeks is your go-to partner because we have professionally designed, easy-to-edit templates that are perfect for any presentation. After downloading, you can easily edit Big Data Analytics Dashboard To Track Developing Strategic Insights Using Big Data Analytics SS V and make the changes accordingly. You can rearrange slides or fill them with different images. Check out all the handy templates

Working Of Predictive Analytics Models Predictive Analytics For Empowering Graphics Pdf
This slide depicts the working of predictive analytics models that operates iteratively. The main phases in working include business understanding, data understanding, data preparation, modeling, evaluation, and deployment. This Working Of Predictive Analytics Models Predictive Analytics For Empowering Graphics Pdf from Slidegeeks makes it easy to present information on your topic with precision. It provides customization options, so you can make changes to the colors, design, graphics, or any other component to create a unique layout. It is also available for immediate download, so you can begin using it right away. Slidegeeks has done good research to ensure that you have everything you need to make your presentation stand out. Make a name out there for a brilliant performance.

Steps To Create Customer Journey Map Product Analytics Implementation Data Analytics V
This slide outlines phases to develop customer journey map aimed at tracking, aligning and prioritizing experiences. It covers steps such as define scope, list touchpoints, compile data, alignment, take journey, visualization, team pitching and share results Welcome to our selection of the Steps To Create Customer Journey Map Product Analytics Implementation Data Analytics V. These are designed to help you showcase your creativity and bring your sphere to life. Planning and Innovation are essential for any business that is just starting out. This collection contains the designs that you need for your everyday presentations. All of our PowerPoints are 100 percent editable, so you can customize them to suit your needs. This multi-purpose template can be used in various situations. Grab these presentation templates today.

R78 Solutions To Challenges Faced In Implementing Product Analytics Implementation Data Analytics V
This slide provides solutions to major data democratization challenges faced in product analytics. The basis of challenges are complexity of data infrastructure, lack of centralization, data security and privacy, data literacy and data quality.If your project calls for a presentation, then Slidegeeks is your go-to partner because we have professionally designed, easy-to-edit templates that are perfect for any presentation. After downloading, you can easily edit Solutions To Challenges Faced In R78 Solutions To Challenges Faced In Implementing Product Analytics Implementation Data Analytics V and make the changes accordingly. You can rearrange slides or fill them with different images. Check out all the handy templates
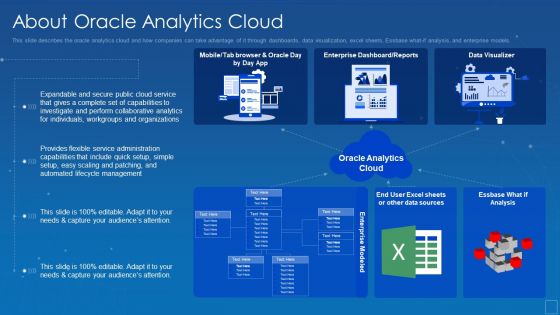
Oracle Cloud Data Analytics Administration IT About Oracle Analytics Cloud Clipart PDF
This slide describes the oracle analytics cloud and how companies can take advantage of it through dashboards, data visualization, excel sheets, Essbase what if analysis, and enterprise models. Deliver and pitch your topic in the best possible manner with this oracle cloud data analytics administration it about oracle analytics cloud clipart pdf. Use them to share invaluable insights on management, lifecycle, capabilities, service, flexible and impress your audience. This template can be altered and modified as per your expectations. So, grab it now.

Toolkit For Data Science And Analytics Transition Vendor Scan Analytics Table For Data Software Portrait PDF
In this slide, we are evaluating each vendor based on the mentioned criteria. These criteria are weighted to get a total score per vendor for checking the vendors actual capability to deliver the analytical tool. Coming up with a presentation necessitates that the majority of the effort goes into the content and the message you intend to convey. The visuals of a PowerPoint presentation can only be effective if it supplements and supports the story that is being told. Keeping this in mind our experts created Toolkit For Data Science And Analytics Transition Vendor Scan Analytics Table For Data Software Portrait PDF to reduce the time that goes into designing the presentation. This way, you can concentrate on the message while our designers take care of providing you with the right template for the situation.
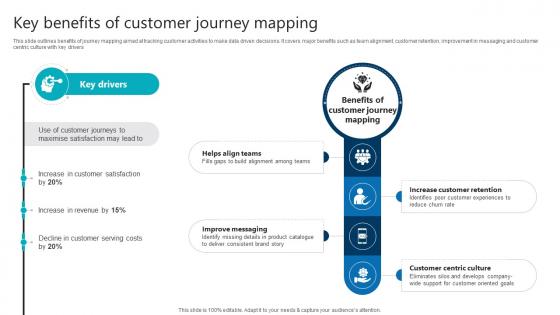
Key Benefits Of Customer Journey Mapping Product Analytics Implementation Data Analytics V
This slide outlines benefits of journey mapping aimed at tracking customer activities to make data driven decisions. It covers major benefits such as team alignment, customer retention, improvement in messaging and customer centric culture with key drivers This Key Benefits Of Customer Journey Mapping Product Analytics Implementation Data Analytics V from Slidegeeks makes it easy to present information on your topic with precision. It provides customization options, so you can make changes to the colors, design, graphics, or any other component to create a unique layout. It is also available for immediate download, so you can begin using it right away. Slidegeeks has done good research to ensure that you have everything you need to make your presentation stand out. Make a name out there for a brilliant performance.

Social Media Analytics KPI Major Promotional Analytics Future Trends Ideas Pdf
This slide covers a dashboard for tracking social media KPIs such as face engagements, total likes, followers, audience growth, YouTube subscribers, views, Instagram reach and , likes, LinkedIn impressions, etc. This Social Media Analytics KPI Major Promotional Analytics Future Trends Ideas Pdf from Slidegeeks makes it easy to present information on your topic with precision. It provides customization options, so you can make changes to the colors, design, graphics, or any other component to create a unique layout. It is also available for immediate download, so you can begin using it right away. Slidegeeks has done good research to ensure that you have everything you need to make your presentation stand out. Make a name out there for a brilliant performance.
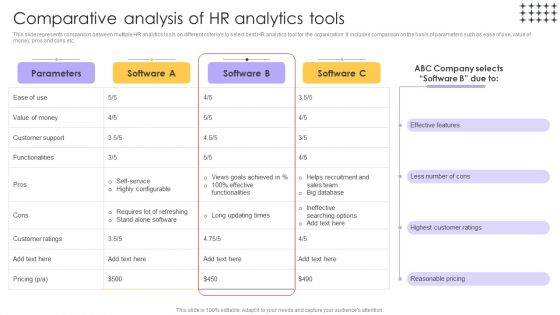
Tools For HR Business Analytics Comparative Analysis Of HR Analytics Tools Microsoft PDF
This slide represents comparison between multiple HR analytics tools on different criterias to select best HR analytics tool for the organization. It includes comparison on the basis of parameters such as ease of use, value of money, pros and cons etc. If your project calls for a presentation, then Slidegeeks is your go-to partner because we have professionally designed, easy-to-edit templates that are perfect for any presentation. After downloading, you can easily edit Tools For HR Business Analytics Comparative Analysis Of HR Analytics Tools Microsoft PDF and make the changes accordingly. You can rearrange slides or fill them with different images. Check out all the handy templates.
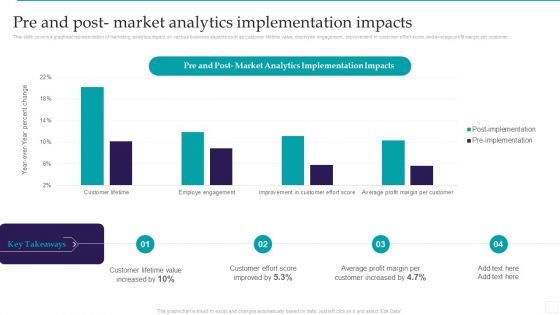
Optimizing Marketing Analytics To Enhance Organizational Growth Pre And Post Market Analytics Microsoft PDF
This slide covers a graphical representation of marketing analytics impact on various business aspects such as customer lifetime value, employee engagement, improvement in customer effort score, and average profit margin per customer. Get a simple yet stunning designed Optimizing Marketing Analytics To Enhance Organizational Growth Pre And Post Market Analytics Microsoft PDF. It is the best one to establish the tone in your meetings. It is an excellent way to make your presentations highly effective. So, download this PPT today from Slidegeeks and see the positive impacts. Our easy to edit Optimizing Marketing Analytics To Enhance Organizational Growth Pre And Post Market Analytics Microsoft PDF can be your go to option for all upcoming conferences and meetings. So, what are you waiting for Grab this template today.
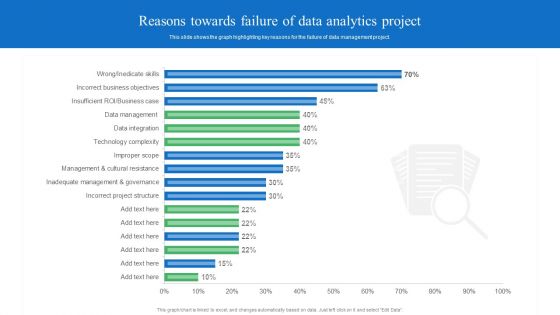
Toolkit For Data Science And Analytics Transition Reasons Towards Failure Of Data Analytics Project Background PDF
This slide shows the graph highlighting key reasons for the failure of data management project. If you are looking for a format to display your unique thoughts, then the professionally designed Toolkit For Data Science And Analytics Transition Reasons Towards Failure Of Data Analytics Project Background PDF is the one for you. You can use it as a Google Slides template or a PowerPoint template. Incorporate impressive visuals, symbols, images, and other charts. Modify or reorganize the text boxes as you desire. Experiment with shade schemes and font pairings. Alter, share or cooperate with other people on your work. Download Toolkit For Data Science And Analytics Transition Reasons Towards Failure Of Data Analytics Project Background PDF and find out how to give a successful presentation. Present a perfect display to your team and make your presentation unforgettable.
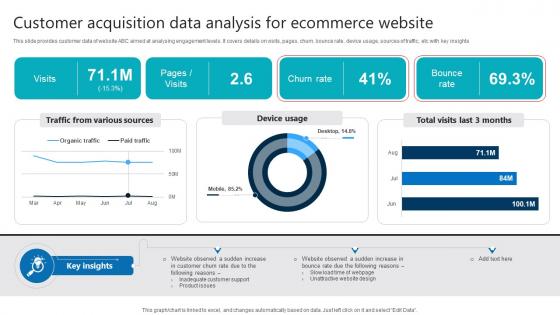
Customer Acquisition Data Analysis For Ecommerce Website Product Analytics Implementation Data Analytics V
This slide provides customer data of website ABC aimed at analysing engagement levels. It covers details on visits, pages, churn, bounce rate, device usage, sources of traffic, etc with key insights If you are looking for a format to display your unique thoughts, then the professionally designed Customer Acquisition Data Analysis For Ecommerce Website Product Analytics Implementation Data Analytics V is the one for you. You can use it as a Google Slides template or a PowerPoint template. Incorporate impressive visuals, symbols, images, and other charts. Modify or reorganize the text boxes as you desire. Experiment with shade schemes and font pairings. Alter, share or cooperate with other people on your work. Download Customer Acquisition Data Analysis For Ecommerce Website Product Analytics Implementation Data Analytics V and find out how to give a successful presentation. Present a perfect display to your team and make your presentation unforgettable.

Predictive Analytics In The Age Of Big Data Overview Of Predictive Analytics Framework Designs PDF
This slide outlines the overview of the predictive analytics framework and its components, including wide area network, OpenFlow, forecasting, software-defined networking controller, predictive models, elastic cluster, data acquisition and application servers. If your project calls for a presentation, then Slidegeeks is your go to partner because we have professionally designed, easy to edit templates that are perfect for any presentation. After downloading, you can easily edit Predictive Analytics In The Age Of Big Data Overview Of Predictive Analytics Framework Designs PDF and make the changes accordingly. You can rearrange slides or fill them with different images. Check out all the handy templates

Predictive Analytics Methods Uses Of Predictive Analytics In Marketing Industry Information PDF
This slide outlines the use of predictive analytics in the marketing industry, where active traders develop a new campaign based on customer behavior. The marketing use cases include understanding customer behavior, optimizing resources and spending, qualifying and prioritizing leads, and retaining customers. If your project calls for a presentation, then Slidegeeks is your go to partner because we have professionally designed, easy to edit templates that are perfect for any presentation. After downloading, you can easily edit Predictive Analytics Methods Uses Of Predictive Analytics In Marketing Industry Information PDF and make the changes accordingly. You can rearrange slides or fill them with different images. Check out all the handy templates.
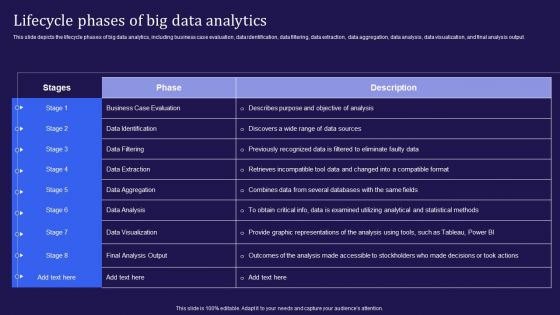
Big Data Analytics Lifecycle Lifecycle Phases Of Big Data Analytics Ppt Gallery Sample PDF
This slide depicts the lifecycle phases of big data analytics, including business case evaluation, data identification, data filtering, data extraction, data aggregation, data analysis, data visualization, and final analysis output. Slidegeeks is one of the best resources for PowerPoint templates. You can download easily and regulate Big Data Analytics Lifecycle Lifecycle Phases Of Big Data Analytics Ppt Gallery Sample PDF for your personal presentations from our wonderful collection. A few clicks is all it takes to discover and get the most relevant and appropriate templates. Use our Templates to add a unique zing and appeal to your presentation and meetings. All the slides are easy to edit and you can use them even for advertisement purposes.
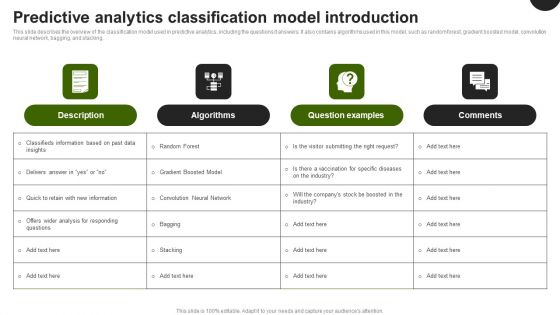
Predictive Analytics In The Age Of Big Data Predictive Analytics Classification Model Introduction Brochure PDF
This slide describes the overview of the classification model used in predictive analytics, including the questions it answers. It also contains algorithms used in this model, such as random forest, gradient boosted model, convolution neural network, bagging, and stacking. Are you in need of a template that can accommodate all of your creative concepts This one is crafted professionally and can be altered to fit any style. Use it with Google Slides or PowerPoint. Include striking photographs, symbols, depictions, and other visuals. Fill, move around, or remove text boxes as desired. Test out color palettes and font mixtures. Edit and save your work, or work with colleagues. Download Predictive Analytics In The Age Of Big Data Predictive Analytics Classification Model Introduction Brochure PDF and observe how to make your presentation outstanding. Give an impeccable presentation to your group and make your presentation unforgettable.
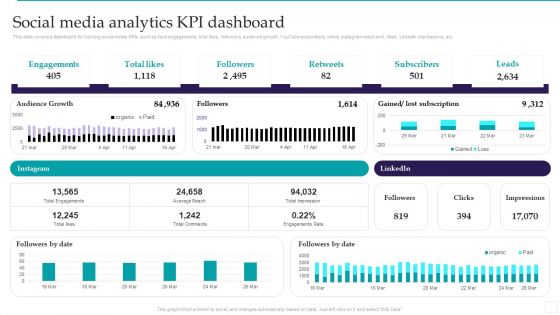
Optimizing Marketing Analytics To Enhance Organizational Growth Social Media Analytics KPI Dashboard Graphics PDF
This slide covers a dashboard for tracking social media KPIs such as face engagements, total likes, followers, audience growth, YouTube subscribers, views, Instagram reach and , likes, LinkedIn impressions, etc. From laying roadmaps to briefing everything in detail, our templates are perfect for you. You can set the stage with your presentation slides. All you have to do is download these easy to edit and customizable templates. Optimizing Marketing Analytics To Enhance Organizational Growth Social Media Analytics KPI Dashboard Graphics PDF will help you deliver an outstanding performance that everyone would remember and praise you for. Do download this presentation today.
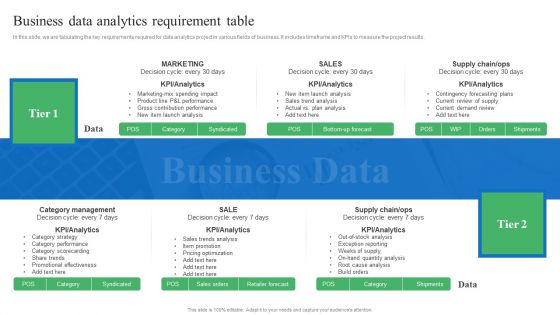
Toolkit For Data Science And Analytics Transition Business Data Analytics Requirement Table Sample PDF
In this slide, we are tabulating the key requirements required for data analytics project in various fields of business. It includes timeframe and KPIs to measure the project results. This Toolkit For Data Science And Analytics Transition Business Data Analytics Requirement Table Sample PDF from Slidegeeks makes it easy to present information on your topic with precision. It provides customization options, so you can make changes to the colors, design, graphics, or any other component to create a unique layout. It is also available for immediate download, so you can begin using it right away. Slidegeeks has done good research to ensure that you have everything you need to make your presentation stand out. Make a name out there for a brilliant performance.

Predictive Analytics In The Age Of Big Data Predictive Analytics Vs Machine Learning Slides PDF
This slide represents the comparison between predictive analytics and machine learning based on technology used and built on, the functionality of the model, and requirements for the development of the models. This Predictive Analytics In The Age Of Big Data Predictive Analytics Vs Machine Learning Slides PDF from Slidegeeks makes it easy to present information on your topic with precision. It provides customization options, so you can make changes to the colors, design, graphics, or any other component to create a unique layout. It is also available for immediate download, so you can begin using it right away. Slidegeeks has done good research to ensure that you have everything you need to make your presentation stand out. Make a name out there for a brilliant performance.
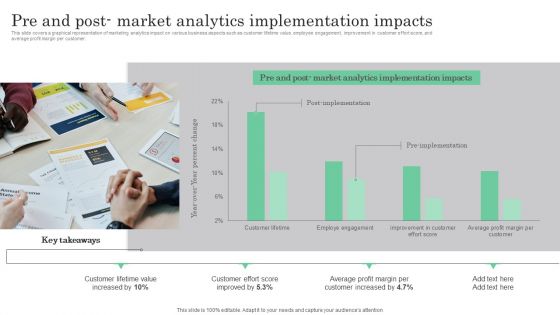
Online Marketing Analytics To Enhance Business Growth Pre And Post Market Analytics Implementation Clipart PDF
This slide covers a graphical representation of marketing analytics impact on various business aspects such as customer lifetime value, employee engagement, improvement in customer effort score, and average profit margin per customer. Present like a pro with Online Marketing Analytics To Enhance Business Growth Pre And Post Market Analytics Implementation Clipart PDF Create beautiful presentations together with your team, using our easy to use presentation slides. Share your ideas in real time and make changes on the fly by downloading our templates. So whether you are in the office, on the go, or in a remote location, you can stay in sync with your team and present your ideas with confidence. With Slidegeeks presentation got a whole lot easier. Grab these presentations today.
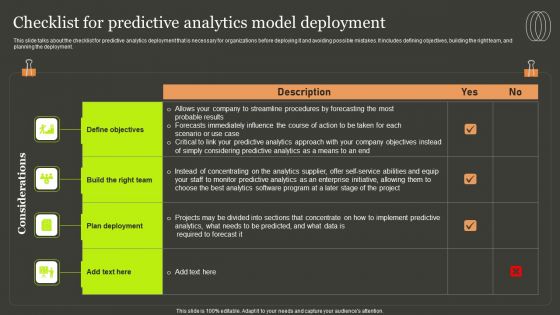
Predictive Analytics Methods Checklist For Predictive Analytics Model Deployment Mockup PDF
This slide talks about the checklist for predictive analytics deployment that is necessary for organizations before deploying it and avoiding possible mistakes. It includes defining objectives, building the right team, and planning the deployment.This Predictive Analytics Methods Checklist For Predictive Analytics Model Deployment Mockup PDF from Slidegeeks makes it easy to present information on your topic with precision. It provides customization options, so you can make changes to the colors, design, graphics, or any other component to create a unique layout. It is also available for immediate download, so you can begin using it right away. Slidegeeks has done good research to ensure that you have everything you need to make your presentation stand out. Make a name out there for a brilliant performance.

Guide For Marketing Analytics To Improve Decisions Key Goals Of Website Marketing Analytics Download PDF
The following slide depicts quarterly goals to set standards for comparing marketing performance and determine promotional return on investments. It includes elements such as page speed, bounce rate, error rate, website visits, referral sources, unique visitors etc. Are you in need of a template that can accommodate all of your creative concepts This one is crafted professionally and can be altered to fit any style. Use it with Google Slides or PowerPoint. Include striking photographs, symbols, depictions, and other visuals. Fill, move around, or remove text boxes as desired. Test out color palettes and font mixtures. Edit and save your work, or work with colleagues. Download Guide For Marketing Analytics To Improve Decisions Key Goals Of Website Marketing Analytics Download PDF and observe how to make your presentation outstanding. Give an impeccable presentation to your group and make your presentation unforgettable.
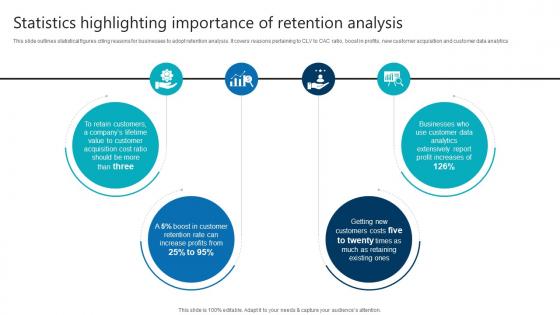
Statistics Highlighting Importance Of Retention Analysis Product Analytics Implementation Data Analytics V
This slide outlines statistical figures citing reasons for businesses to adopt retention analysis. It covers reasons pertaining to CLV to CAC ratio, boost in profits, new customer acquisition and customer data analyticsAre you in need of a template that can accommodate all of your creative concepts This one is crafted professionally and can be altered to fit any style. Use it with Google Slides or PowerPoint. Include striking photographs, symbols, depictions, and other visuals. Fill, move around, or remove text boxes as desired. Test out color palettes and font mixtures. Edit and save your work, or work with colleagues. Download Statistics Highlighting Importance Of Retention Analysis Product Analytics Implementation Data Analytics V and observe how to make your presentation outstanding. Give an impeccable presentation to your group and make your presentation unforgettable.

Steps To Build Attribution Strategy For Businesses Product Analytics Implementation Data Analytics V
This slide outlines phases to develop attribution strategy aimed at tracking, aligning and prioritizing experiences. It covers steps such as determine objectives, store information, focus on behavior, analyze interactions, choose right model and optimize attribution window This modern and well-arranged Steps To Build Attribution Strategy For Businesses Product Analytics Implementation Data Analytics V provides lots of creative possibilities. It is very simple to customize and edit with the Powerpoint Software. Just drag and drop your pictures into the shapes. All facets of this template can be edited with Powerpoint, no extra software is necessary. Add your own material, put your images in the places assigned for them, adjust the colors, and then you can show your slides to the world, with an animated slide included.
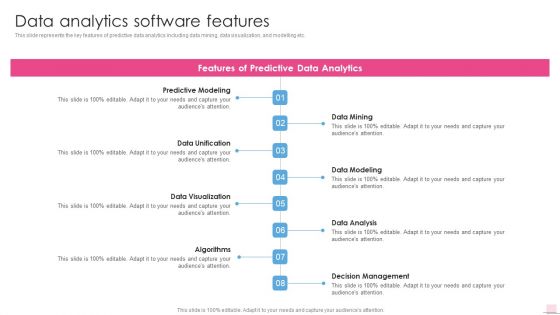
Data Analytics Software Features Business Analysis Modification Toolkit Formats PDF
This slide represents the key features of predictive data analytics including data mining, data visualization, and modelling etc.Presenting Data Analytics Software Features Business Analysis Modification Toolkit Formats PDF to provide visual cues and insights. Share and navigate important information on eight stages that need your due attention. This template can be used to pitch topics like Predictive Modeling, Data Unification, Data Visualization. In addtion, this PPT design contains high resolution images, graphics, etc, that are easily editable and available for immediate download.
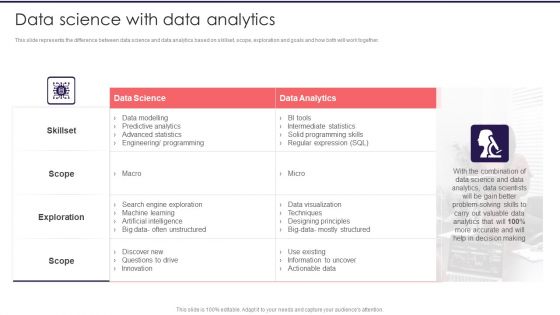
Information Studies Data Science With Data Analytics Background PDF
This slide represents the difference between data science and data analytics based on skillset, scope, exploration and goals and how both will work together. Deliver an awe inspiring pitch with this creative Information Studies Data Science With Data Analytics Background PDF bundle. Topics like Data Science, Data Analytics, Data Visualization can be discussed with this completely editable template. It is available for immediate download depending on the needs and requirements of the user.

Tools For Data Analytics Tensorflow Ppt Model Rules PDF
This slide represents the TensorFlow tool used in Data Science, and its features include flexibility, columns, visualizer, open-sourcing, and responsive construct. Presenting tools for data analytics tensorflow ppt model rules pdf to provide visual cues and insights. Share and navigate important information on eight stages that need your due attention. This template can be used to pitch topics like developing, source. In addtion, this PPT design contains high resolution images, graphics, etc, that are easily editable and available for immediate download.
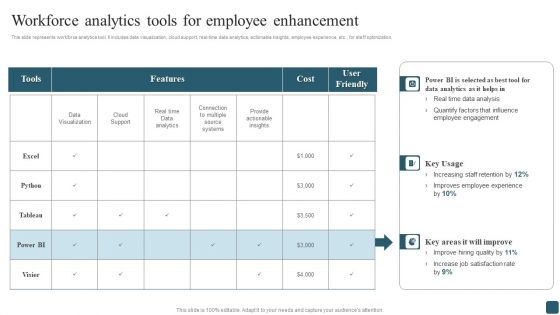
Workforce Analytics Tools For Employee Enhancement Clipart PDF
This slide represents workforce analytics tool. It includes data visualization, cloud support, real-time data analytics, actionable insights, employee experience, etc., for staff optimization. Do you know about Slidesgeeks Workforce Analytics Tools For Employee Enhancement Clipart PDF These are perfect for delivering any kind od presentation. Using it, create PowerPoint presentations that communicate your ideas and engage audiences. Save time and effort by using our pre-designed presentation templates that are perfect for a wide range of topic. Our vast selection of designs covers a range of styles, from creative to business, and are all highly customizable and easy to edit. Download as a PowerPoint template or use them as Google Slides themes.

Tasks And Skills Of Data Analytics Ppt Infographics Summary PDF
This slide describes the tasks performed by data scientists in data science and their skills, including distributive computing knowledge, predictive modeling, story-telling, visualization, etc. Presenting tasks and skills of data analytics ppt infographics summary pdf to provide visual cues and insights. Share and navigate important information on six stages that need your due attention. This template can be used to pitch topics like data analysis, information, predictive modeling, distributive computing. In addtion, this PPT design contains high resolution images, graphics, etc, that are easily editable and available for immediate download.
What Is Big Data Analytics Ppt Icon Inspiration PDF
This slide represents the meaning of big data and the complete data handling process such as data collection, storage, research, analysis, visualization, volume, and network. Presenting what is big data analytics ppt icon inspiration pdf to provide visual cues and insights. Share and navigate important information on eight stages that need your due attention. This template can be used to pitch topics like cloud technology, visualization, analysis, organizations, applications. In addtion, this PPT design contains high resolution images, graphics, etc, that are easily editable and available for immediate download.

Table Of Contents Procurement Analytics Slide Diagrams PDF
Presenting Table Of Contents Procurement Analytics Slide Diagrams PDF to provide visual cues and insights. Share and navigate important information on one stage that need your due attention. This template can be used to pitch topics like Data Analysis, Enterprise Procurement, Budget Analysis. In addtion, this PPT design contains high resolution images, graphics, etc, that are easily editable and available for immediate download.
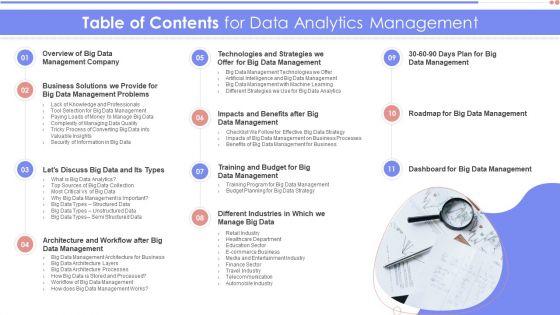
Table Of Contents For Data Analytics Management Sample PDF
Presenting Table Of Contents For Data Analytics Management Sample PDF to provide visual cues and insights. Share and navigate important information on one stage that need your due attention. This template can be used to pitch topics like Management Company, Management Problems, Data Management. In addtion, this PPT design contains high resolution images, graphics, etc, that are easily editable and available for immediate download.

Enhancing Business Data Management And Analytics Capabilities DT SS V
This slide presents the strategies for enhancing the data management and analytics capabilities for effective business model innovation. It includes data governance and quality, data integration and accessibility, advanced analytics tools, and data visualization and communication.Here you can discover an assortment of the finest PowerPoint and Google Slides templates. With these templates, you can create presentations for a variety of purposes while simultaneously providing your audience with an eye-catching visual experience. Download Enhancing Business Data Management And Analytics Capabilities DT SS V to deliver an impeccable presentation. These templates will make your job of preparing presentations much quicker, yet still, maintain a high level of quality. Slidegeeks has experienced researchers who prepare these templates and write high-quality content for you. Later on, you can personalize the content by editing the Enhancing Business Data Management And Analytics Capabilities DT SS V.

Example Of Business Marketing Operations And Analytics Ppt Presentation Design
This is a example of business marketing operations and analytics ppt presentation design. This is a four stage process. The stages in this process are consolidate, analyze, visualize, operationalize, financial management, trade management, market data and analytics, risk management, marketing operations and analytics.
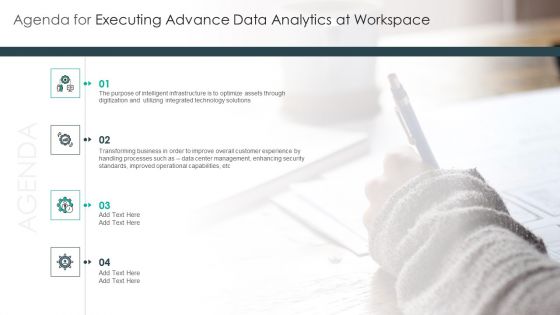
Agenda For Executing Advance Data Analytics At Workspace Introduction PDF
Presenting agenda for executing advance data analytics at workspace introduction pdf to provide visual cues and insights. Share and navigate important information on four stages that need your due attention. This template can be used to pitch topics like handling, processes, improved, operational, capabilities. In addtion, this PPT design contains high resolution images, graphics, etc, that are easily editable and available for immediate download.
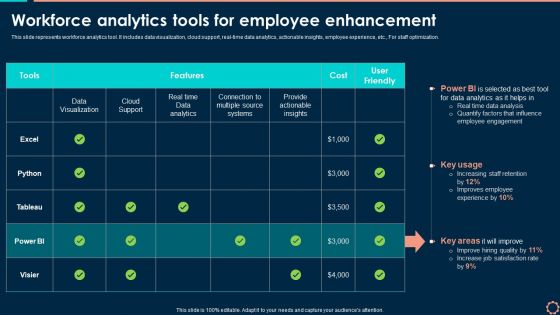
Workforce Analytics Tools For Employee Enhancement Introduction PDF
This slide represents workforce analytics tool. It includes data visualization, cloud support, real-time data analytics, actionable insights, employee experience, etc. For staff optimization. Are you searching for a Workforce Analytics Tools For Employee Enhancement Introduction PDF that is uncluttered, straightforward, and original Its easy to edit, and you can change the colors to suit your personal or business branding. For a presentation that expresses how much effort you have put in, this template is ideal With all of its features, including tables, diagrams, statistics, and lists, its perfect for a business plan presentation. Make your ideas more appealing with these professional slides. Download Workforce Analytics Tools For Employee Enhancement Introduction PDF from Slidegeeks today.

 Home
Home